Article

Designing a Rice Straw-Based Biofuel Supply Chain Using Mixed-Integer Programming in South Korea


by
Seongeun Song
1,
Junyoung Seo
1,
Youngjin Kim
1,
Sumin Kim
2 and
Sojung Kim
1,*
1
Department of Industrial and Systems Engineering, Dongguk University-Seoul, Seoul 04620, Republic of Korea
2
Department of Environmental Horticulture & Landscape Architecture, College of Life Science & Biotechnology, Dankook University, Cheonan-si 31116, Republic of Korea
*
Author to whom correspondence should be addressed.
Energies 2026, 19(5), 1338; https://doi.org/10.3390/en19051338
Submission received: 30 January 2026 / Revised: 1 March 2026 / Accepted: 5 March 2026 / Published: 6 March 2026

Abstract

To achieve the goal of the 2015 Paris Agreement to limit global warming to 2 °C compared to pre-industrial levels, South Korea is implementing a policy to use bioethanol as a transportation fuel based on the Renewable Fuel Standard (RFS). This study proposes a mixed-integer linear programming (MILP) model to design an optimal bioethanol supply chain utilizing rice straw, a readily available resource in South Korea. To minimize the total cost of bioethanol production, the proposed model considers optimal facility locations, i.e., those of feedstock collection (farm), refining (refinery), and consumption (market), and transportation volumes. This experiment is conducted to evaluate the blending ratios of bioethanol in gasoline (3%, 6%, and 9%) specified by the Renewable Fuel Standard (RFS) policy, based on actual gasoline consumption data in South Korea. In the RFS 3% scenario, operating a single large-scale refinery was the most economical option, but in the RFS 6% and RFS 9% scenarios, multiple refineries must be utilized to ensure supply chain economics. In conclusion, the proposed MILP model shows the practicality of gradually increasing the number of refineries and selecting the optimal location for each region as future bioethanol demand increases.

1. Introduction

Global energy demand continues to increase due to industrial development and population growth, and is projected to peak around 2030 [1]. With the depletion of fossil fuels and the growing pressure to reduce greenhouse gas emissions to address climate change, research into renewable energy sources that can replace existing energy systems is more active than ever [2]. Biomass is recognized as the world’s fourth-largest energy source after coal, oil, and natural gas, and, as of 2022, it occupies about a 9% share of the world’s total energy supply (622 EJ) [3]. Bioethanol, in particular, accounts for about 70% of all liquid biofuels, with global production reaching 116 billion liters in 2023. By country, the United States and Brazil produce 59 billion liters and 35 billion liters, respectively, accounting for 80% of global output, while India recently expanded production to 6.4 billion liters, making it the world’s third-largest producer [3]. Biofuels are expected to expand their share in the global energy mix over the next few decades. In particular, the EU has set a specific goal of raising the share of renewable energy in the transportation sector to 29% by 2030. On a global scale, the low-carbon fuel market, including biofuels, is expected to become a key energy source, supported by an annual global investment of US $1.3 trillion in accordance with the goal of tripling renewable energy capacity (to achieve 11,000 GW by 2030), agreed at the UN Climate Conference (COP 28) in Dubai in November 2023 [4].
In South Korea, the majority of its supply chain remains dependent on fossil fuels, making it difficult to limit global warming to below 2 °C compared to pre-industrial levels, as required by the 2015 Paris Agreement [5]. To meet these international agreements and policies, the Renewable Fuel Standard (RFS) was announced to reduce South Korea’s high dependence on external sources of existing energy and expand the share of renewable energy [6]. In particular, rice straw has emerged as a promising feedstock for bioethanol production due to its abundant domestic supply, which offers a significant strategic advantage in reducing overall production costs [7]. However, despite the potential for conversion of the vast amount of rice straw generated annually into a carbon-neutral energy source, the current biofuel blending policy in South Korea remains behind compared to those in other countries that have actively pursued biofuel blending policies from an early stage [8].
South Korea’s biofuel policies are categorized into the Renewable Portfolio Standard (RPS) for power generation and the Renewable Fuel Standard (RFS) for transportation. Under the RPS framework, bio-heavy oil and biogas are already being supplied for electricity production. In the transportation sector, biodiesel and bioethanol are the primary liquid fuels capable of commercialization under the RFS [9]. Demand for biofuels in South Korea is mainly concentrated on road transport blending under the Renewable Energy Fuel Mixing Mandatory System (RFS) [10]. To be specific, the biodiesel mixing ratio has been raised to 4.0% as of 2024, and in the case of bioethanol, a demonstration project and system are being introduced with the goal of mixing 3% to 5% in gasoline [11]. Despite recent policy discussions regarding the adoption of sustainable aviation fuel (SAF) and bio-ship fuels in response to international regulations, the majority of domestic demand continues to be concentrated in blended fuels for the general transportation and passenger vehicle sectors. To support this transition, the government is also expanding the regulatory scope of usable feedstock to include various bio-based wastes and agricultural byproducts [12].
In terms of geography in South Korea, transportation energy demand is severely concentrated in the Seoul metropolitan area. As of 2025, around 46 percent of the country’s gasoline consumption is concentrated in the metropolitan area, including Seoul, Gyeonggi, and Incheon [13], which causes a severe distribution imbalance between the source and demand locations. As this demand-site bias leads to higher logistics costs and inefficiency in the biofuel supply chain, the design of an optimal supply chain reflecting the geographical characteristics and complex logistical environment in South Korea is a very essential task in establishing a national energy security and efficient carbon neutrality strategy [14].
This study proposes a Mixed-Integer Linear Programming (MILP) model to minimize the total cost of a bioethanol supply chain utilizing rice straw resources in South Korea. While previous biofuel research in South Korea has primarily focused on the deterministic flow of organic waste or specific feedstocks (see Section 2.1), this study designs a supply chain centered on rice straw, the largest biomass resource in South Korea. Globally, rice straw is the most abundant agricultural residue, with an annual production estimated at 700 to 800 million tons, 90% of which is concentrated in Asia. Due to this massive regional availability, rice straw holds significant potential as a primary feedstock for biofuel production, especially when compared to first-generation feedstock. Furthermore, leveraging the pre-existing infrastructure of Rice Processing Complexes facilitates a cost-effective collection system without the need for new logistics hubs [15]. The proposed model analyzes the impact of technical yield differences on the overall network structure and cost-effectiveness, and derives an optimal infrastructure configuration to meet the policy target of RFS 3% blending ratio.
The main contributions of this study can be summarized as follows: (1) An integrated MILP framework for planning a rice straw-based bioethanol supply chain is established based on South Korean geographic information and agricultural data. (2) An optimization model is developed that simultaneously determines refinery location, size, and process method by linking pretreatment technology (i.e., dilute acid) yields, investment costs, and operating costs with decision variables. (3) The proposed model quantitatively analyzes the transportation cost trade-off between heavy raw materials and light products in a three-stage logistics network within South Korea, encompassing raw material collection (Farm), refining (Refinery), and consumption (Market). (4) By applying actual fuel consumption data and RFS policy scenarios in South Korea, this research will see what is appropriate among the single large-scale refinery strategy and the distribution of refinery operation strategies, and present practical policy guidelines.
This study is structured as follows: Section 2 reviews the theoretical foundations of the bioethanol process and supply chain optimization techniques, and presents a rice straw-based bioethanol supply chain optimization model. Section 3 identifies optimal scenarios for a bioethanol supply chain based on the number of refineries and, based on the results, conducts a demand sensitivity analysis in South Korea. Section 4 concludes with comprehensive implications and future research directions.

2. Materials and Methods

2.1. Rice Straw-Based Bioethanol Production

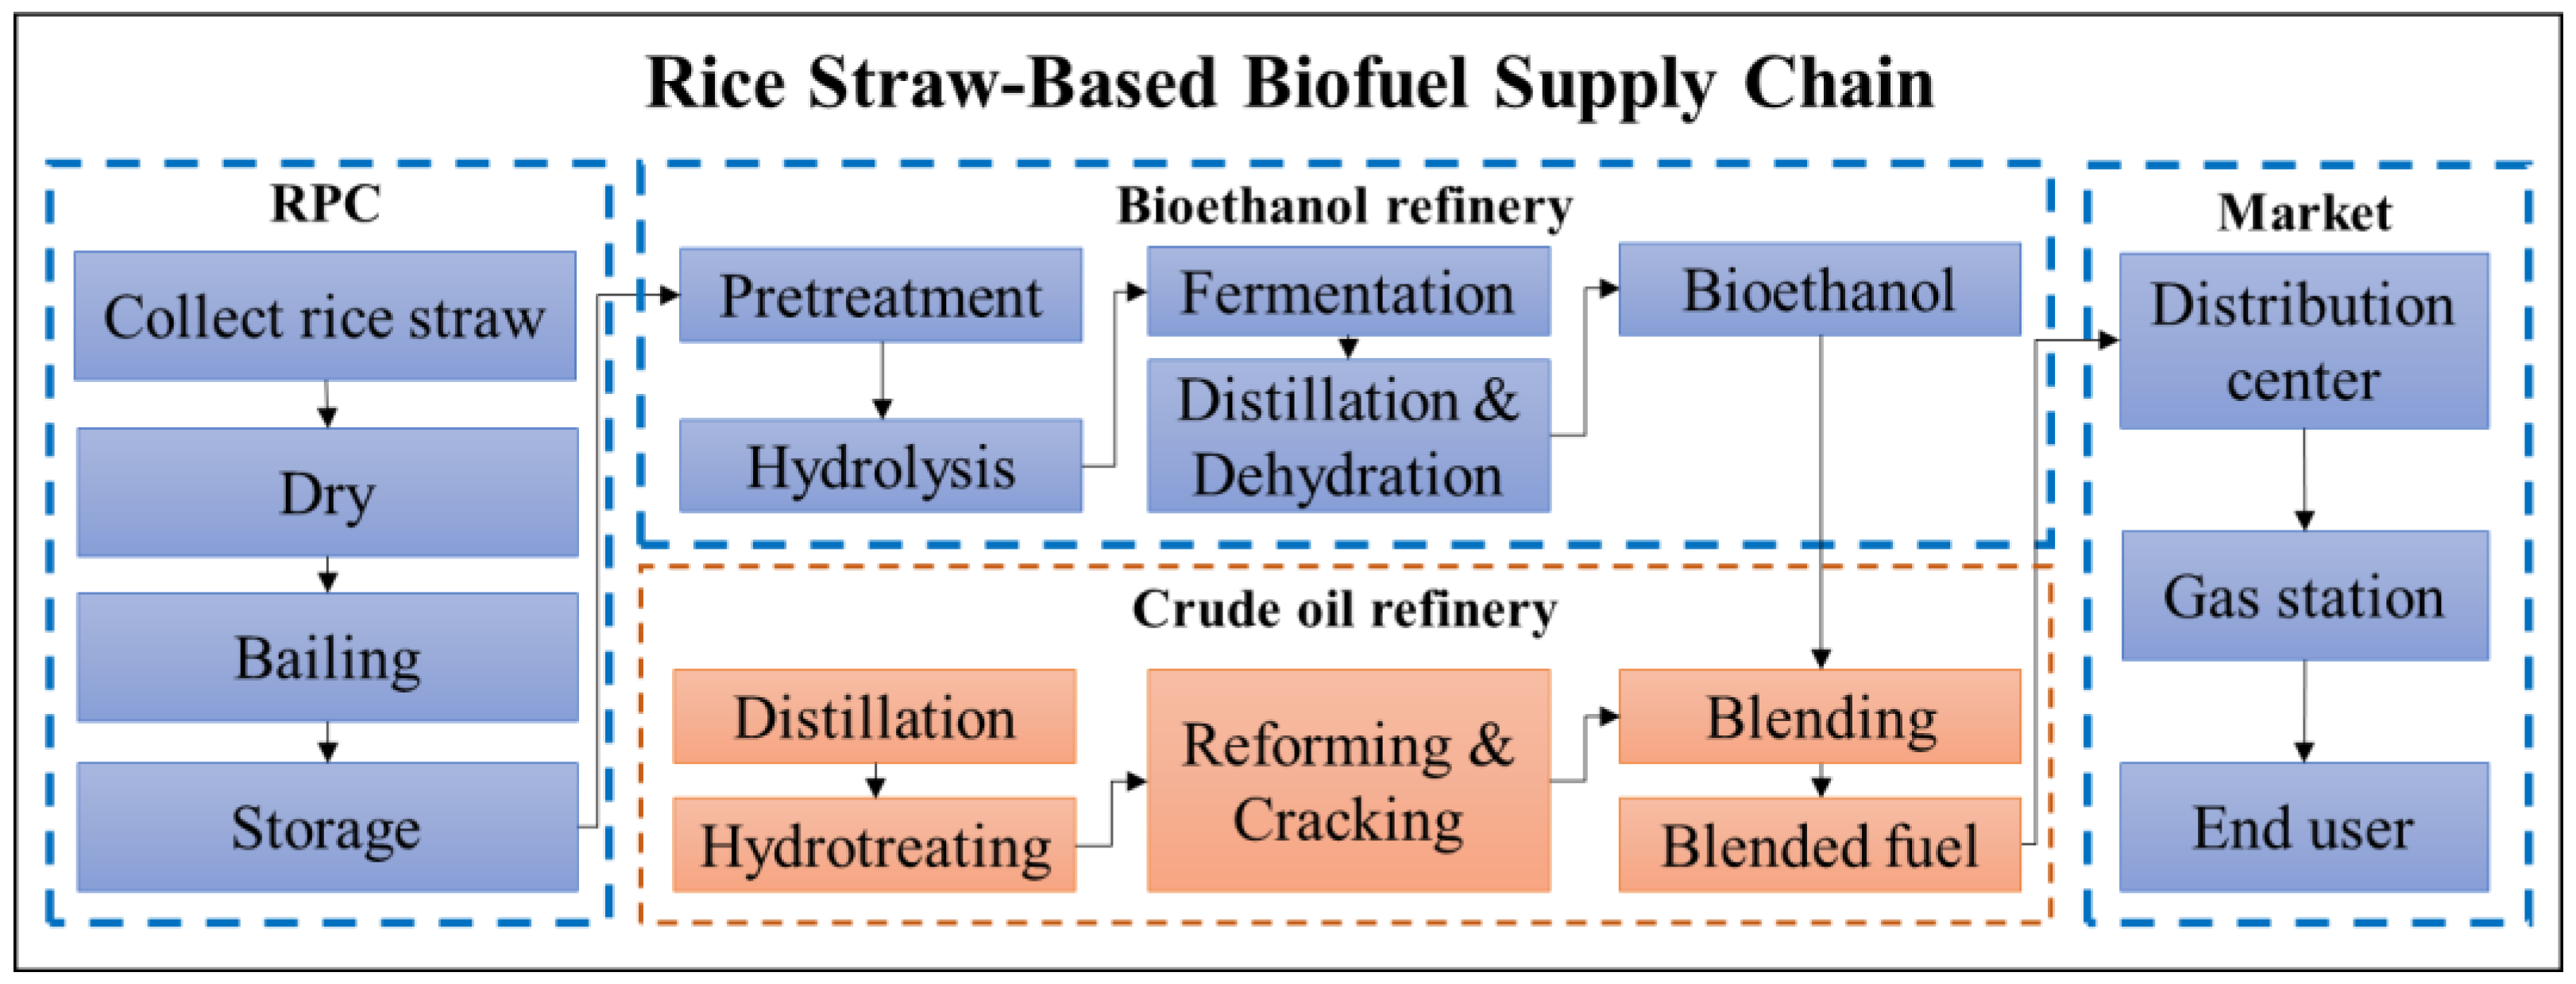
The bioethanol supply chain network is composed of a multi-stage network ranging from the production of feedstock to collection, refining, and final consumption (see Figure 1). Unlike the general first-generation bioethanol production process (e.g., corn-based bioethanol or sugarcane-based bioethanol), the main feature of raw straw-based biofuel production is that rice straw is collected through a rice processing complex (RPC) during the raw material production stage, goes through a compression packaging process to maximize transportation efficiency, and is then transported to a refinery to produce bioethanol from rice straw. Notice that raw rice straw is collected from individual farms and undergoes a drying process to reduce moisture content below 25%, preventing decomposition during storage [16]. Subsequently, a baling (compression packaging) process is performed to increase the bulk density of the straw, which is essential for maximizing transportation efficiency to the refinery. These preprocessed bales are stored in storage to ensure a steady, year-round supply of feedstock regardless of seasonal harvest variations.
The rice straw-based bioethanol production process of refineries is largely divided into four categories: (1) pretreatment, (2) hydrolysis, (3) fermentation, and (4) distillation and dehydration. This second-generation bioethanol pathway is gaining significant attention due to its high availability and positive environmental impact, with global capacity projected to grow through 2025 [17]. The pretreatment process is a step that involves destroying the solid lignocellulose structure of rice straw so that the internal cellulose enzymes can access it [18]. Rice straw is a composite structure in which carbohydrate polymers such as cellulose and hemicellulose are firmly surrounded by lignin. This physical barrier of lignin fundamentally blocks the access of enzymes and acts as a major factor impeding the efficiency of the direct saccharification process. Therefore, for effective bioethanol production, a pretreatment process aimed at destroying the lignin structure, removing hemicellulose, increasing the reaction surface area, and alleviating cellulose crystallinity is essential. Lignin acts as a recalcitrant barrier that physically impedes enzymatic access to cellulose and causes non-productive enzyme adsorption, thereby significantly reducing the efficiency of saccharification and subsequent ethanol yield. Successful pretreatment facilitates the breakdown of complex carbohydrates into monomeric sugars by increasing the surface area available for enzymatic attack, thereby improving overall yields [19]. Diluted acid (DA) pretreatment mainly hydrolyzes hemicellulose to increase the accessibility of cellulose. It is an extensively studied pretreatment method with high technical proficiency and was economically regarded as a standard technology [20,21]. While alternative methods such as steam explosion, alkaline pretreatment, and ammonia fiber expansion (AFEX) were considered for their specific advantages, this study adopted DA due to its high technical readiness level and proven efficiency in maximizing sugar yields from rice straw [22].
The hydrolysis process involves converting the cellulose and hemicellulose polymers of the pretreated biomass into fermentable monosaccharides using enzymes [23]. The efficiency of the process is determined by various factors such as the particle size of the substrate, reaction temperature, pH, and enzyme and substrate concentration [24]. Enzymatic hydrolysis is performed specifically on rice straw that has undergone DA pretreatment to disrupt its solid lignocellulosic structure. This process is conducted in 18 parallel saccharification vessels, where a cellulase enzyme cocktail is introduced to catalyze the chemical breakdown of the biomass structure [25]. The efficiency of this enzymatic conversion is determined by several operational factors, including the particle size of the substrate, reaction temperature, and pH levels. According to the process specifications, an enzyme loading of 31.3 to 35.1 mg protein per gram of cellulose is applied, with a sustained residence time of 5 days to ensure the maximum yield of glucose and other soluble sugars from the rice straw feedstock [26]. Modern optimization efforts in 2025 emphasize that refining enzyme cocktails and managing process conditions can further shorten residence times while maintaining high productivity [27].
The fermentation process is the step in which the monosaccharides derived from hydrolysis are converted into ethanol using microorganisms [28]. This study utilizes the Separate Hydrolysis and Fermentation (SHF) strategy, in which fermentation is executed using eight parallel sequenced batch reactors that are independent of the saccharification vessels [29]. By employing the SHF approach, the fermentation stage can be optimized for the specific requirements of the microorganisms at a residence time of 2 days [26]. This separation is essential to preserve the metabolic efficiency of the organisms, allowing the preceding hydrolysis to function at elevated temperatures for enzyme activity while fermentation occurs under its own optimal thermal conditions [30].
Finally, the distillation and dehydration process is employed to separate the bioethanol from water and lignin-rich residual solids remaining after fermentation [31]. The distillation stage utilizes two sequential columns to progressively increase ethanol concentration. The beer column first removes dissolved carbon dioxide and vapor to generate a concentrated ethanol stream, which is then fed into a rectification column. During this rectification process, ethanol is concentrated to approximately 95 wt%, representing the maximum purity achievable through conventional distillation due to the occurrence of an azeotrope [32]. To satisfy the high purity required for gasoline blending, a dehydration process is subsequently performed. Because distillation cannot surpass the ethanol-water azeotrope, a molecular sieve adsorption column is employed to remove nearly all remaining water [33]. This dehydration process yields high-grade anhydrous bioethanol, ensuring the final product meets a minimum purity threshold of 99.5 wt% [24]. The resulting high-purity ethanol is then integrated with a petroleum-based gasoline base through a blending process. The blended fuel produced at the refinery is transported to the market via road-based truck transportation to satisfy the mandatory demand at each market. These sequential stages are increasingly evaluated through an integrated approach to ensure the efficient exploitation of biomass within the entire supply chain system [34].
Bioethanol produced at bioethanol refineries is blended with gasoline and consumed as a fuel. This blended transportation fuel is then transported to various distribution centers to meet local market demand. Bioethanol demand is determined by applying the Renewable Fuel Standard (RFS) blending ratio (e.g., 3%, 6%, or 9%) to the demand for blended transportation fuel. The blended fuel is ultimately sold to individual consumers at gas stations.
To improve the operational efficiency of the bioethanol supply chain, which consists of such diverse components, research has been conducted on optimal network design. Chen and Fan [35] developed a two-stage probabilistic programming model that reflects uncertainty in raw material supply and demand. While this model has the advantage of being able to infer uncertain demand distributions through probabilistic models, it is highly dependent on specific probability distribution data and is difficult to apply to renewable energy industries due to the lack of data for probabilistic modeling. To overcome these data-dependency issues, Aranguren et al. [36] proposed a two-stage stochastic model that optimizes co-firing biomass supply chains under supply uncertainty. While this provides robust decision-making under fluctuating feedstock conditions, it often suffers from high computational costs when applied to large-scale, nationwide logistics problems. To address these practical limitations, some researchers have focused on the empirical feasibility and spatial distribution of biomass. Hiloidhari et al. [37] integrated a geographic information system (GIS) with heuristic methods to assess the bioenergy potential of rice straw in India. While this approach effectively visualizes spatial availability and identifies resource-rich areas, it has the disadvantage of failing to guarantee total cost minimization in complex multi-level networks. Building on spatial analysis, Wu et al. [38] applied a GIS-integrated framework to design an agri-biomass supply chain in north China, specifically allocating centralized storage facilities based on regional resource density. This methodology is advantageous for capturing localized geographic constraints and precise transportation routing. However, it exhibits limitations in systematically evaluating the complex economic trade-offs between capital investments and long-term logistics costs across a large-scale network. Nguyen et al. [39] conducted a techno-economic analysis of mechanized rice straw collection in Vietnam to demonstrate its operational feasibility. However, their focus was primarily on individual collection operations and spatial mapping, without conducting a systematic network optimization study.
In fact, mathematical models are being utilized for the optimal design of supply chain networks. Tran et al. [40] proposed a mixed-integer nonlinear programming (MINLP) model for agricultural waste logistics that integrates location–allocation–routing decisions. While this model accurately reflects process characteristics, the MINLP formulation suffers from high computational complexity, making it difficult to derive a global optimum in large-scale logistics scenarios with numerous candidate sites. Therefore, this study adopts a mixed-integer linear programming (MILP) framework to ensure both clarity in strategic decision-making and computational efficiency. MILP is particularly suitable for modeling discrete decisions, such as optimal refinery and raw material warehouse location selection, which are essential for managing the highly distributed nature of rice straw [41]. Unlike nonlinear or heuristic approaches, MILP mathematically guarantees global optimality through an established solver, providing a reliable foundation for long-term capital investment [42]. This model maintains high scalability for regional-scale biomass logistics in South Korea without sacrificing mathematical rigor by linearizing complex network constraints [43].

2.2. Optimal Design Model for a Rice Straw-Based Bioethanol Supply Chain

This study designs a rice straw-based bioethanol supply chain reflecting the situation in South Korea and proposes an optimal network to minimize the total cost by using a mixed integer linear programming method. Data on the location, cost, and operational constraints of each facility have collected from the rice straw-based bioethanol supply chain depicted in Figure 1 and utilized in the optimization model. Section 2.2.1 and Section 2.2.2 will describe the data collected on the process and present the proposed optimization model, respectively.

2.2.1. Rice Straw-Based Bioethanol Supply Chain Data

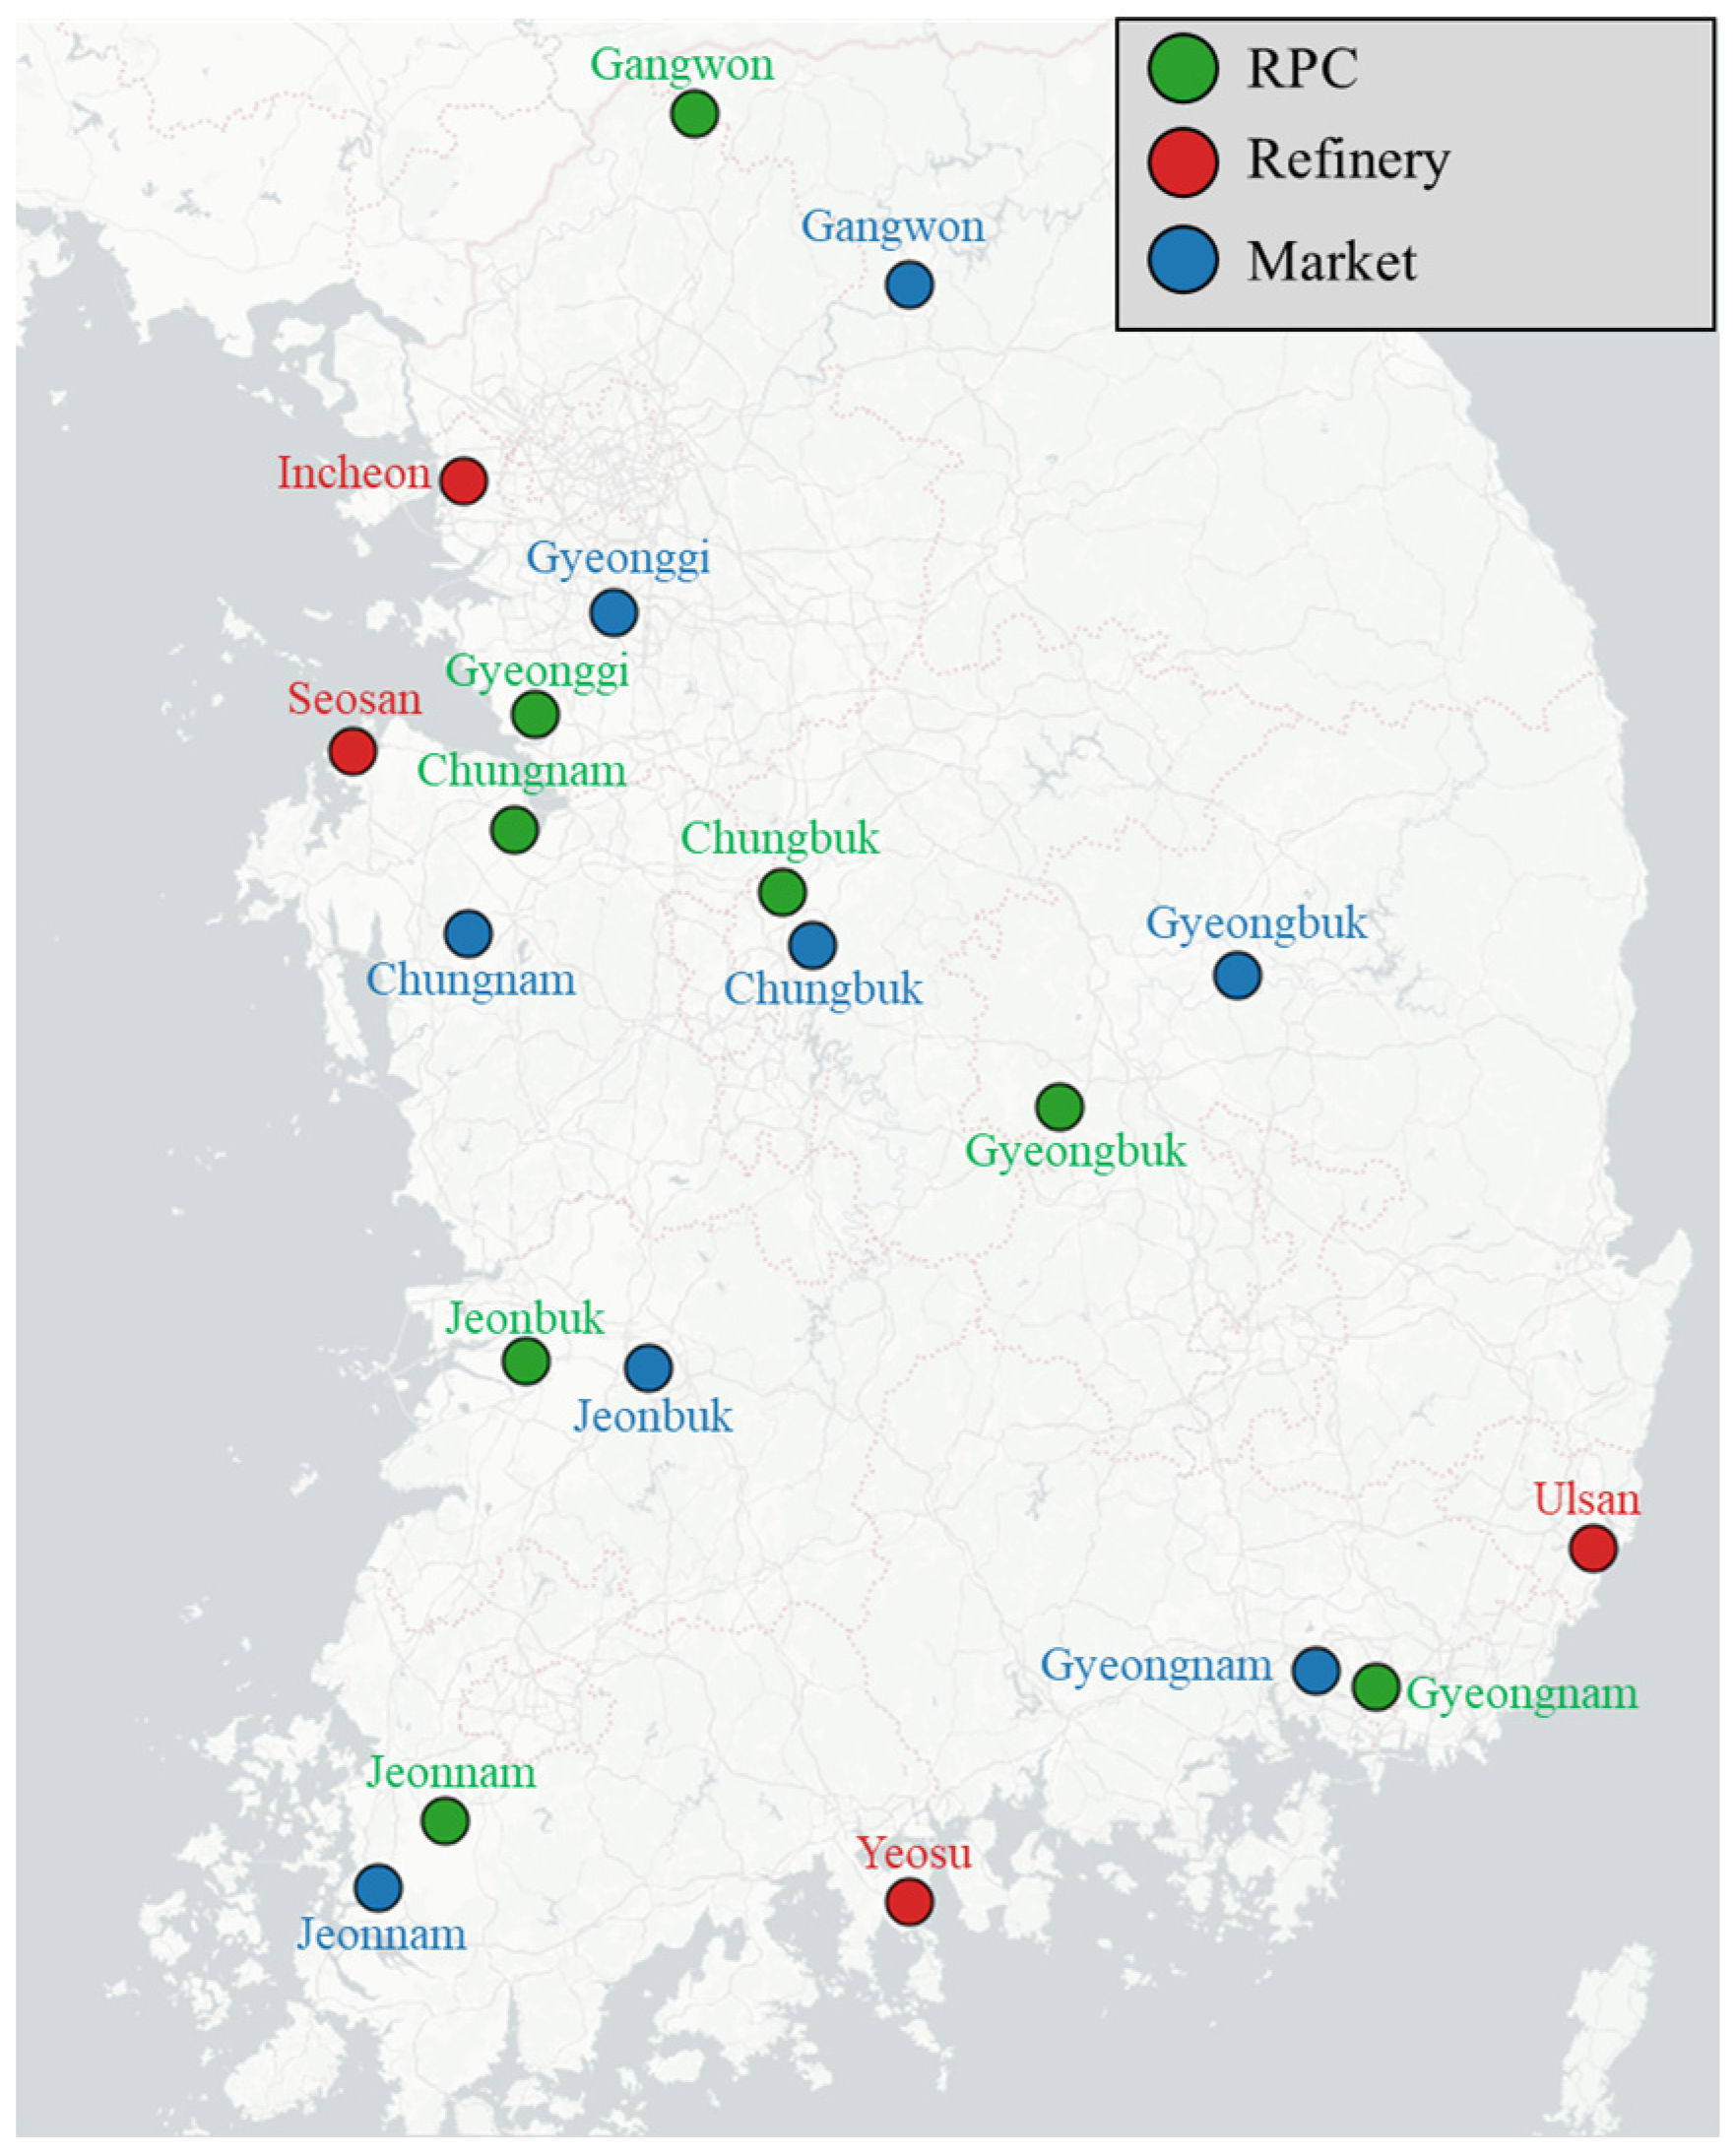
This study, which aims to design an optimal supply chain for the efficient production of bioethanol using rice straw as a raw material in South Korea, investigates the flow from rice straw-supplying farms (including RPCs), bioethanol refineries (including blended fuel production), and final demand areas (markets), as shown in Figure 2. Market locations are limited to transportation fuel distribution centers, which are considered representative of regional energy consumption in terms of population density and economic activity. The goal is to select bioethanol refinery sites that can efficiently supply blended fuel to these key transportation fuel distribution centers.
Rice straw, the raw material for bioethanol refineries, is supplied by rice farmers. Rice produced by individual farms nationwide is transported to RPCs (rice purchasing, drying, and processing facilities) located in the largest grain production centers of each region [44]. This is why RPCs are considered feedstock production sites in the rice straw supply chain design [45]. Table 1 describes the locations of RPCs and regional rice straw production in South Korea [46].
Based on the information on annual rice straw production in eight regions of South Korea in Table 1, Chungnam and Jeonnam are major supply bases, producing 769,895 tons and 812,864 tons of rice straw, respectively, accounting for 40.3% of total production. In contrast, Gangwon has the lowest production, at 131,788 tons, indicating a relatively low supply potential. These regional differences in rice straw production suggest the need for refinery location selection.
Candidate sites for bioethanol refineries are selected with existing transportation fuel refineries nearby, including Ulsan, Seosan, Yeosu, and Incheon. These sites can not only produce blended fuel using the produced bioethanol, but also already possess the core infrastructure necessary for bioethanol production, including ports, storage tanks, transportation facilities, power, and water. Leveraging these existing refineries can reduce initial investment costs, secure operational synergies with the existing energy supply chain, and maximize practicality [47]. Compared to building a plant on a new site, utilizing existing infrastructure can shorten the permitting period, improving the economic feasibility of the project.
Table 2 describes the locations and nameplate capacities of the bioethanol refinery candidates [48,49,50]. Ulsan has the largest nameplate capacity at 241,680 KL, followed by Yeosu (116,070 KL) and Seosan (109,710 KL). In this study, the standard medium-scale (M) plant size was defined as 700,000 tons per year of straw processing capacity, based on the design specifications in the NREL technical report. Based on this, a small-scale (S) plant is defined as one with an annual processing capacity of 350,000 tons, and a large-scale (L) plant is defined as one with an annual processing capacity of 1,400,000 tons. This reflects the effect of decreasing fixed costs per unit of production as the plant size increases [25].
Table 3 describes the locations of transportation fuel distribution centers by region and their annual transportation fuel consumption [13]. While bioethanol demand is widespread, for model efficiency, we assumed that regional demand is concentrated in provincial capitals, which are population and industrial centers. Bioethanol demand at each refinery was calculated based on the government’s RFS. Given that bioethanol is supplied by blending it with a certain ratio of blended fuel (transportation fuel), regional transportation fuel consumption is a key indicator of potential bioethanol demand. As described in Table 3, annual fuel consumption in Gyeonggi is 28.375 million barrels, accounting for approximately 44.7% of the total demand across the eight regions. This figure is more than 4.1 times higher than that of Gyeongnam (6.874 million barrels), the second-largest consumer, and 7.3 times higher than that of Jeonbuk (3.888 million barrels), the top consumer. This concentration of demand leads to a concentration of cargo volume in metropolitan hubs within the optimization model, suggesting that optimizing the logistics network in these areas is a critical factor in determining overall demand.
Table 4 presents the cost details of the dilute acid (DA) process in a bioethanol refinery. Costs are inferred based on ethanol production data from corn stalks [25], as rice straw is also an herbaceous material similar to corn stalks, and several previous studies have proven that the chemical composition of cellulose and hemicellulose and the fiber structure are similar to those of corn stalks [51,52].
Table 5 shows the transportation distances from the RPC to the four bioethanol refineries. Table 5 was compiled based on location data retrieved via Geographic Information System (GIS). All logistics movements within the supply chain in this study are based on road-based truck transportation. Incheon boasts the shortest distance from Gyeonggi-do farms, approximately 53.43 km, demonstrating the best accessibility for raw material procurement in Gyeonggi-do. Meanwhile, the distance between Yeosu and the supply point in Gangwon-do, at 453.85 km, represents the longest raw material transport distance among the analyzed routes.
Table 6 describes the transport distances from bioethanol refineries to markets. Seosan boasts the shortest distance from Chungnam, approximately 50.57 km, demonstrating the best accessibility for product supply. Conversely, the distance between Yeosu and the demand point in Gangwon-do, at 437.86 km, represents the longest product transport distance among the analyzed routes. This demonstrates the advantage of distance over demand in specific regions.
As described in Table 7, transportation costs in the biomass supply chain are divided into fixed and variable costs. For rice straw, fixed costs of US $1.725 per ton and variable costs of US $0.414 per ton were applied. Fixed costs consist of US $1.725 for loading and unloading at feed stations and refineries [16]. Due to its low density and bulkiness, rice straw is a solid cargo, resulting in higher overhead and transportation costs and a higher unit cost per distance transported than liquid bioethanol [53]. On the other hand, bioethanol utilizes liquid transport methods using pumps and pipelines, enabling efficient overhead and transportation without the physical handling required for rice straw [54]. Compared to rice straw transportation, variable costs per distance are approximately 1/8th of that amount, or US $0.055, and fixed costs are approximately 4 times that amount, or US $6.70 [53].

2.2.2. Optimization Model

Based on the bioethanol supply chain data described in Section 2.2.1, an optimization model was designed to select the optimal location for bioethanol, and Table 8 describes the nomenclature for the symbols used in the optimization model.
Equation (1) is the objective function of the model set to minimize total cost, which consists of the sum of the annual total fixed cost of selected refineries, the variable cost for processing straw, the cost of transporting straw from the farm to the refinery, and the cost of transporting bioethanol from the refinery to the market.
M i n i m i z e   Z = r R s S A F C s × X r , s + f F r R ( O C + P C ) × Q f , r + f F r R ( V C f , r s t r a w × D i s f , r + F C s t r a w ) × Q f , r + r R m M ( V C r , m e t h × D i s r , m + F C e t h ) × T r , m
subject to
s S X r , s 1 , ( r R )
r R Q f , r S t f , ( f F )
r R T r , m D m , ( m M )
m M T r , m = P r , ( r R )
m M T r , m s S C A P s × X r , s , ( r R )
X r , s 0 , 1 ,     Q f , r 0 ,     T r , m 0
To solve the optimization problem, constraints were designed. Equation (2) specifies that only one size can be selected for each candidate refinery location to prevent redundant investment. Equation (3) ensures that the total amount of rice straw transported from each farm to the refinery does not exceed the available rice straw quantities of each farm. Equation (4) requires that the total amount of bioethanol transported to each market must satisfy the mandatory allocation demand of the corresponding region. Equation (5) specifies the balance of the mass balance where rice straw brought into the refinery is converted into bioethanol according to the process yield. Equation (6) restricts the amount of bioethanol produced from exceeding the maximum refinery capacity of the refinery and forces a logical connection so that transportation volume does not occur if the facility is not built. Equation (7) specifies the binary variables related to facility construction and forces the non-negativity constraint on transportation volumes. Therefore, this model selects the optimal location and scale of the refinery that satisfy all constraints while minimizing the objective function mentioned above. After that, the optimal transportation volumes of rice straw and bioethanol allocated to the selected refineries and each market are determined.
To evaluate the economic feasibility of the refinery, the Total Capital Investment (TCI) is converted into an annual capital cost and reflected in the objective function. This is to optimize the cost on the same time scale as the annual operating and raw material costs. For calculating the annual capital cost, a capital recovery factor (CRF) such as Equation (8) is applied.
C R F = i ( 1 + i ) n ( 1 + i ) n 1
In this model, the discount rate is set to 10% and the project life to 20 years, consistent with NREL technical reports [25]. This rate also reflects specific investment risks of South Korea’s nascent bioethanol market, which involves higher uncertainty than established energy sectors. Equation (9) represents that the total capital investment of refinery scale s ( T C I s ), where T C I b a s e denotes the total capital investment of the refinery using Dilute Acid (DA) at the base capacity (700,000 tons). The scaling factor ( b ) applies 0.6, the standard for chemical equipment [55]. The refinery capacity varies according to the refinery scale s ( C a p s ). Equation (10) represents the fixed operating cost of refinery scale s ( F C s ). Equation (11) denotes the total annual fixed cost ( A F C s ) of refinery scale s involving annual capital cost ( T C I s × CRF ) and the fixed operating cost ( F C s ). Based on this, the optimization module simultaneously determines the location r and scale s .
T C I s = T C I b a s e × ( C a p s C a p b a s e ) b
F C s = F C b a s e × ( C a p s C a p b a s e ) b
A F C s = T C I s × C R F + F C s
The annual available rice straw supply ( S t f ) at the farm can be defined as Equation (12).
S t f = Y f × ( 1 M c ) × E c
The average moisture content of Korean rice straw ( M c ) is defined as 12.29% [56], but to determine the actual available supply, mechanical losses occurring during the collection process must be taken into account. Equation (12) takes this into account, and rice straw experiences approximately a 4% loss during the collection process [57]. Thus, the coefficient representing the efficiency of the mechanical collection and bailing process ( E c ) is 96%.
The bioethanol demand ( D M ) at the market is computed by Equation (13).
D M = θ × G M
G M denotes the annual gasoline consumption of each market and θ denotes the mandatory mixing ratio announced by government policy (e.g., RFS 3%). The mixed fuel is consumed as vehicle fuel at the market.
The function for calculating the annual total bioethanol production ( P r ) of the refinery is defined in Equation (14), which represents the yield ( α ) of ethanol produced from rice straw processed in the bioethanol refinery.
P r = f F Q f , r × α
Rice straw delivered to a bioethanol refinery undergoes the process described in Section 2.1. The pretreated biomass is converted into fermentable sugars through enzymatic hydrolysis, and the resulting sugars are then converted into ethanol through microbial metabolism in a fermentation process. The final production yield ( α ) through this series of conversion processes is determined by the efficiency of the selected pretreatment technology [25].

3. Results

3.1. Scenario

The proposed MILP model is applied to scenarios reflecting South Korea’s geographic characteristics and resource distribution to determine the optimal refinery location and transportation volume that minimizes total costs within the bioethanol supply chain. South Korea is implementing the Renewable Fuel Standard (RFS), mandating a certain percentage of biofuels to reduce dependence on petroleum-based fuels and greenhouse gas emissions. Reflecting this policy trend, this study sets a 3% bioethanol blending ratio (RFS 3%) as the baseline scenario. The resulting bioethanol demand is calculated based on regional gasoline consumption, and rice straw, a biomass feedstock abundant in South Korea, is selected to meet this demand.
The experiment first analyzes the tradeoff between initial investment and transportation costs by varying the number of refineries from one to four, deriving an optimal infrastructure configuration. Furthermore, to assess the supply chain’s scalability and responsiveness to national policy changes, a scenario of increasing the RFS blending ratio is examined. In addition to the baseline scenario of RFS 3%, we assume a phased increase to 6% (RFS 6%) and 9% (RFS 9%), as outlined in the future policy roadmap. We analyze how additional refinery locations and changes in facility size will be implemented to meet rapidly growing bioethanol demand. We also quantitatively identify the resulting increases in total costs and the expansion of feedstock collection areas.

3.2. Supply Chain Cost Analysis by Number of Refineries

The experiment analyzes the bioethanol supply chain by varying the number of refineries from one to four to minimize the total cost. This is done by considering the tradeoff between the initial investment cost of facility construction and the transportation costs incurred for moving raw materials and products, thereby determining the optimal number of refineries.
Table 9 details the total annual cost according to the number of refineries installed. As the number of refineries increases, the total annual cost of the system increases. The total cost, which was US $219,244,988 for operating one facility, increases by approximately 22.0% to US $267,472,291 when distributed across four facilities. This suggests that operating a large, single facility is more cost-effective than distributing smaller facilities across multiple locations.
In Table 9, as the number of refineries increases from one to four, the annual capital cost increases by approximately 65.7%. While bioethanol transport cost decreased by 18.4%, rice straw transportation cost increased by 6%, resulting in a 2.3% increase in total transportation cost.
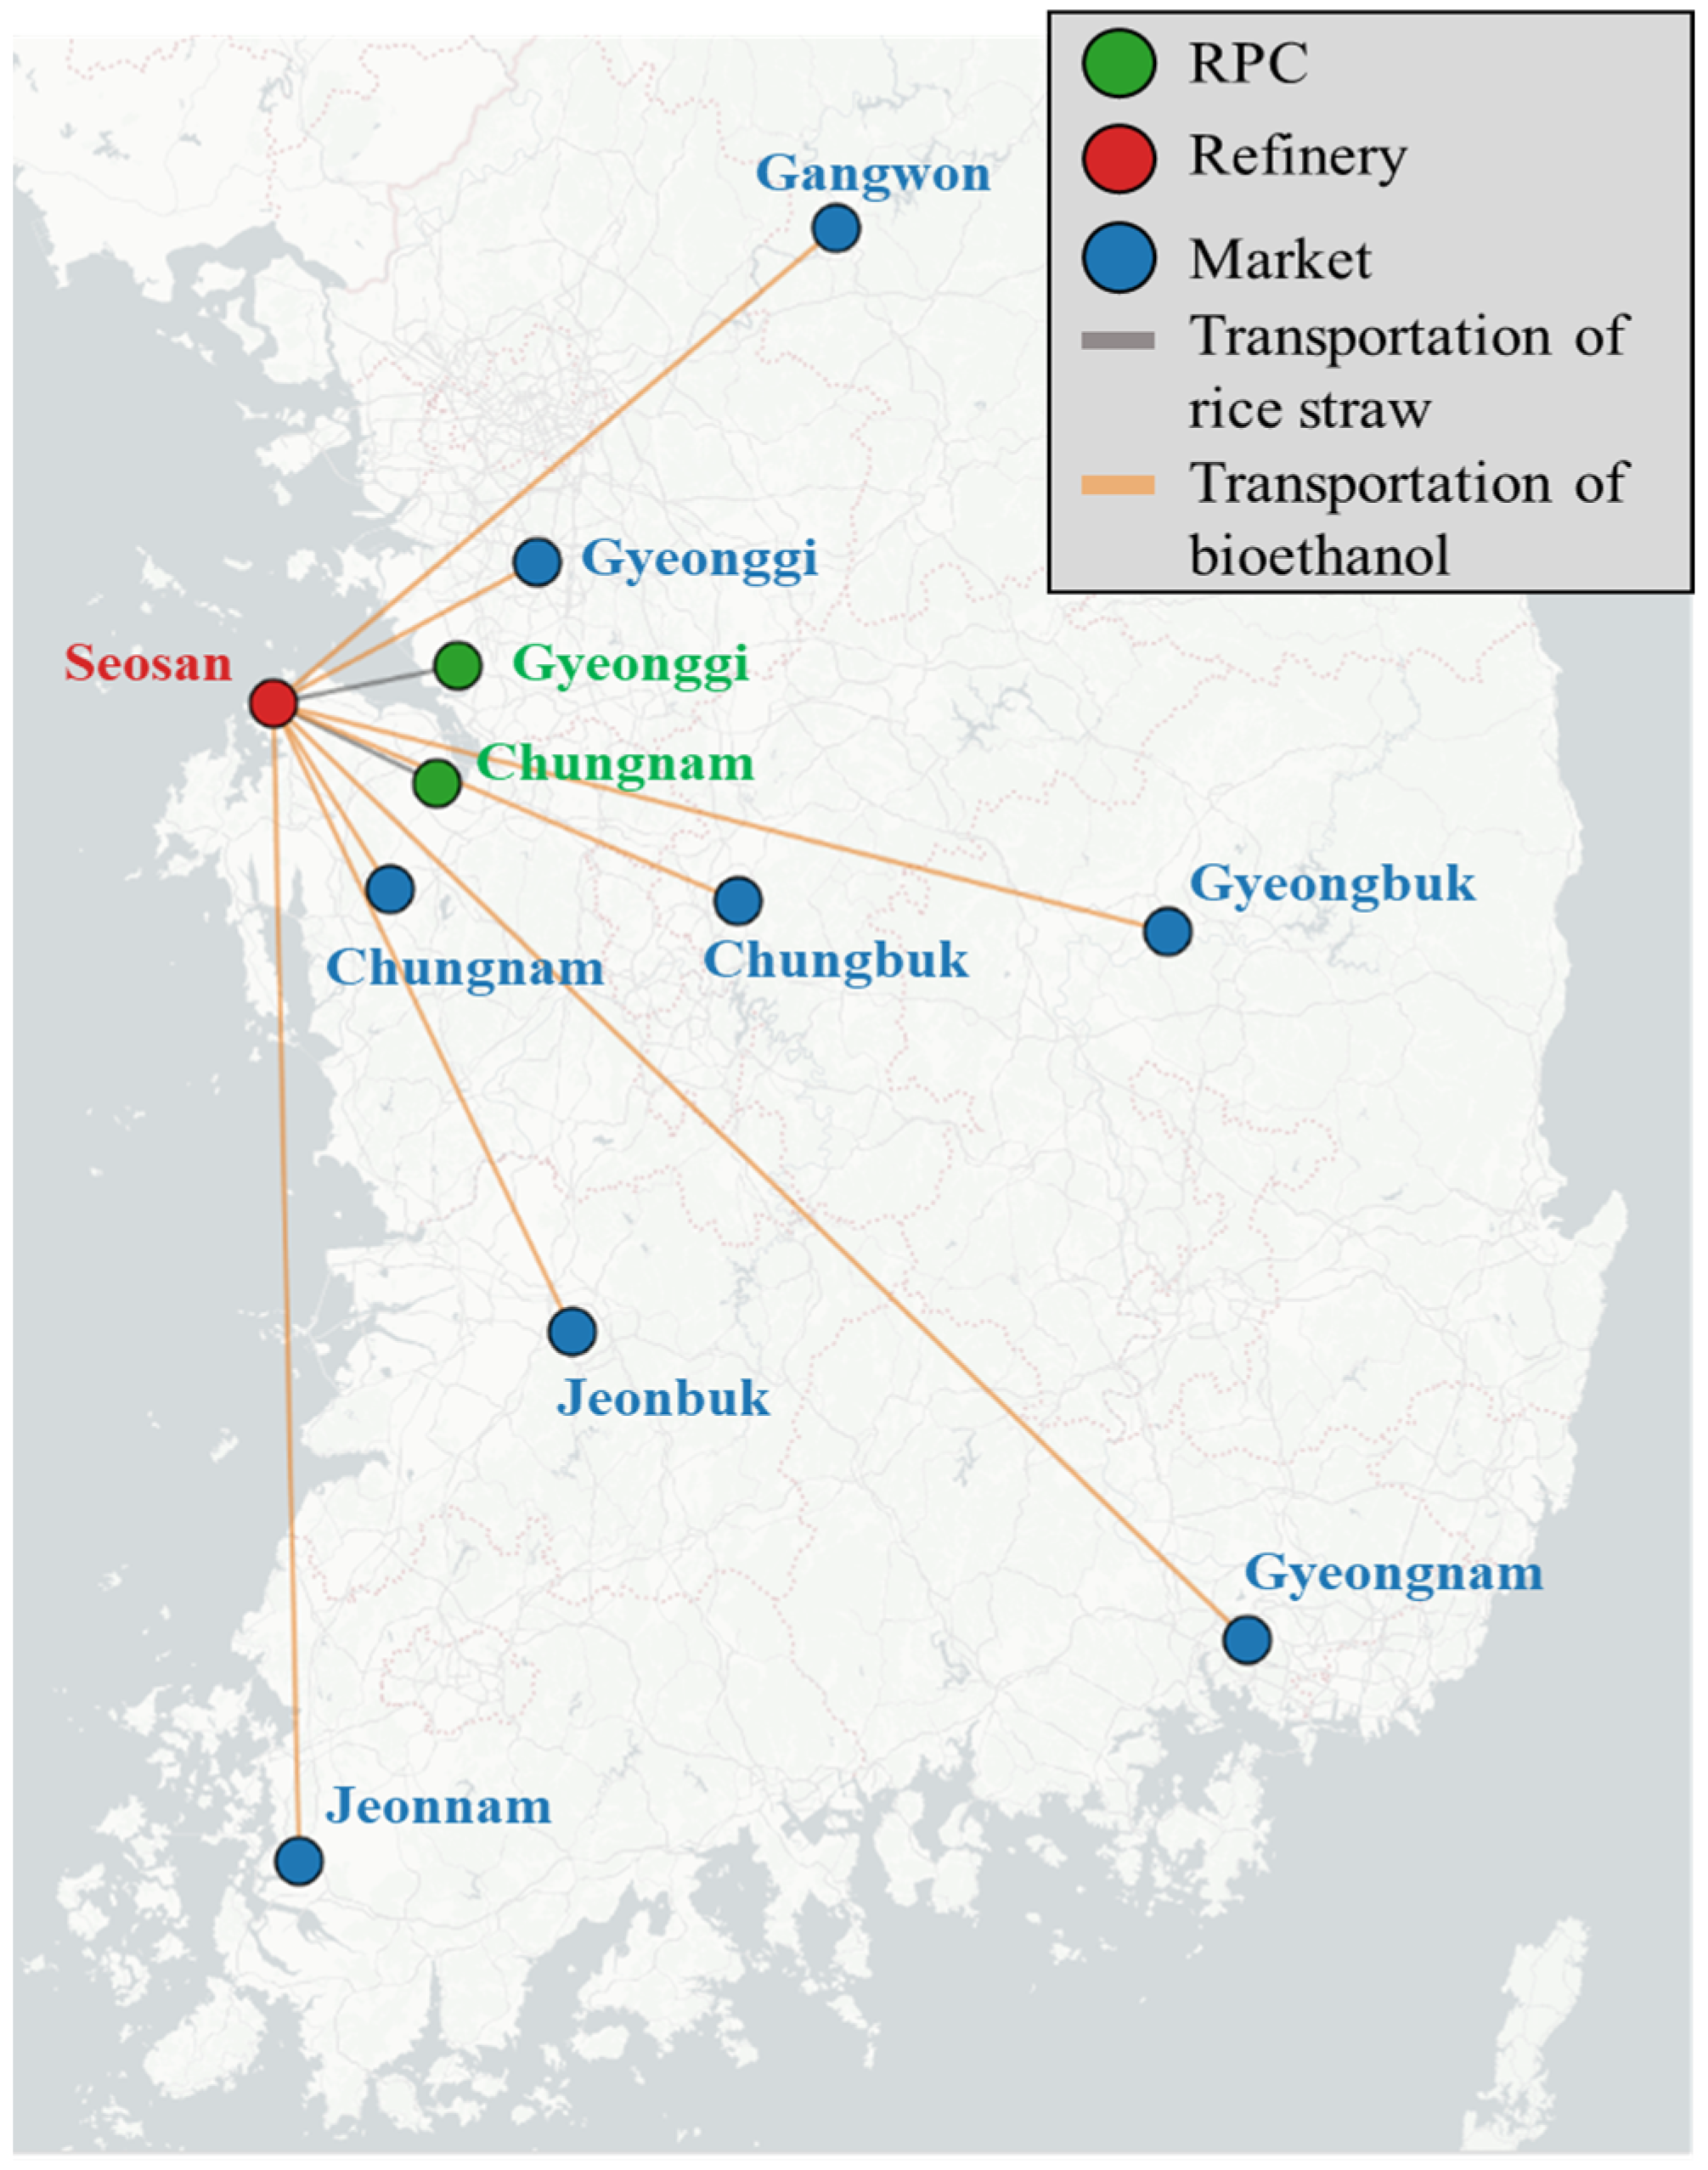
Figure 3 illustrates the optimal supply chain configuration for the RFS 3% scenario. This phenomenon stems from the geographical peculiarities of the Korean bioethanol supply chain. Currently, Chungnam, the largest domestic RPC, is geographically close to Gyeonggi and the Seoul metropolitan area, the largest demand sources. Seosan, identified as the optimal location, serves as the center of gravity within the supply chain and has already optimized the movement routes of major cargo volumes. Therefore, even if additional transportation hubs are secured to shorten transportation distances, the resulting transportation cost benefits are smaller than the costs of additional refineries.
According to the optimization results in Table 9, operating a single refinery is the most economical scenario. The total annual cost of the optimal scenario is calculated to be US $219,244,988, and a total of 920,492 tons of rice straw is collected to produce 302,842 KL of bioethanol, which meets the blending obligation stipulated by the RFS 3%. A detailed examination of the cost structure reveals that processing and raw material costs are the most dominant items, accounting for 53.9% of the total. Fixed costs, which include annual investment amortization and fixed operating costs, account for 33.0%, and transportation costs account for 13.1%. Operating a single, large-scale refinery generates an annual investment amortization of US $54,337,529, which is higher than the total transportation cost of US $28,771,256. Expanding from one to four refineries increases the combined annual capital and fixed operating costs by $47,574,268. Rather than reducing logistics expenses, this decentralization results in a $653,035 increase in total transportation costs. Therefore, a single, large-scale refinery was selected as the optimal supply chain component.
Furthermore, the results in Table 9 show that approximately 83.3% of total transportation costs occur during the transportation of rice straw, which is characterized by its high weight and low density. Therefore, minimizing the transportation distance for rice straw is more important than the transportation of bioethanol. Seosan, selected as the optimal refinery, is only 50.57 km from Chungnam, the largest raw material supplier in South Korea, offering a geographic advantage that minimizes raw material procurement costs. Meanwhile, the distance to the next-tier major supply region, Gyeonggi, is 78.06 km. This means that major supply areas, accounting for approximately 44.7% of the total domestic procurement, can be integrated within a logistics radius of approximately 120 km. In terms of bioethanol transportation, the product transport distance to Gyeonggi, the largest consumer, is 100.94 km, and to Chungnam, it is 70.52 km. This means that a significant portion of production is consumed via short-distance routes of approximately 100 km. While some transportation costs increase during distribution to distant demand regions, such as Jeonnam (284.13 km) and Gyeongnam (368.71 km), this is more than offset by the significant cost savings achieved in transporting rice straw, a heavy raw material.
Table 10 shows the rice straw transport volume in the optimal supply chain. Based on the derived optimal scenario, a detailed logistics flow analysis shows that, in the raw material transportation stage, resources in areas with high geographic proximity to the refinery site are preferentially consumed to minimize raw material transportation costs, which account for a high proportion of variable costs in the total system cost. Table 10 shows the rice straw transportation volume. Seosan, selected as the site, will preferentially secure all available resources (648,264 tons) from Chungnam, one of the largest rice straw suppliers in South Korea. This is because the transportation distance from the refinery is the shortest at 50.57 km, resulting in the lowest cost per unit of transportation. However, since Chungnam’s resources alone cannot fully satisfy the feedstock supply consumed by a large-scale single refinery, additional available resources (272,228 tons) are additionally procured from the next-priority neighboring region, Gyeonggi.
In contrast, regions such as Jeonnam (684,444 tons) and Gangwon (110,968 tons), despite their abundant production, were completely excluded from raw material procurement. This is because these regions are located far from the refinery in Seosan, and the increased transportation costs associated with increased distances hinder cost minimization, outweighing the benefits of securing resources.
Table 11 presents the bioethanol transport volume in the optimal supply chain. The volume difference in bioethanol transportation is directly proportional to the ethanol demand at each consumer site, rather than the transport distance. Gyeonggi (135,338 KL), the largest consumer region nationwide, accounts for approximately 44.7% of the total production of 302,842 KL and has the highest supply priority. Seosan’s proximity to this largest consumer, approximately 100.94 km, makes it ideal for cost reduction. For distant consumers in Gyeongnam, Gyeongbuk, Jeonnam, and Jeonbuk, supply is provided to meet essential demand despite the significant transportation costs associated with the long distance from Seosan. In conclusion, this model demonstrates the advantage of operating a single large refinery, lowering fixed costs while accepting some long-distance distribution costs. Since rice straw transport accounts for 85.9% of total logistics costs and its amount is reduced after preprocessing, minimizing this distance is more cost-effective than shortening the transport distance of bioethanol.

3.3. Supply Chain Cost Analysis by Bioethanol Blending Ratios

This section analyzes the impact of gradual increases in the RFS (3%, 6%, and 9%) on the economics and supply chain structure of the bioethanol supply chain. An increase in the policy target directly leads to increased demand, which becomes a key driver for the selection of additional refinery locations and expansion.
Table 12 describes detailed cost and supply chain configurations for each RFS scenario. In Table 12, analysis of the economic structural changes in the supply chain due to the increase in the RFS policy shows that as the blending ratio increases from 3% to 9%, the total annual cost increases by approximately 199%, from US $219,244,988 to US $655,897,738. This cost increase demonstrates that the increase in policy targets is a key driver of the impact on the entire supply chain. In particular, while demand triples, total costs increase by approximately 2.9 times, confirming the close link between demand and costs. Looking at fixed costs, the initial investment cost and annual investment amortization change significantly as the number of refineries and facility scale expand. The total initial investment cost increases by approximately 2 times, from US $677,525,305 to US $1,355,050,610, which entails a structural shift from a single, large-scale refinery to a multi-refinery distributed system.
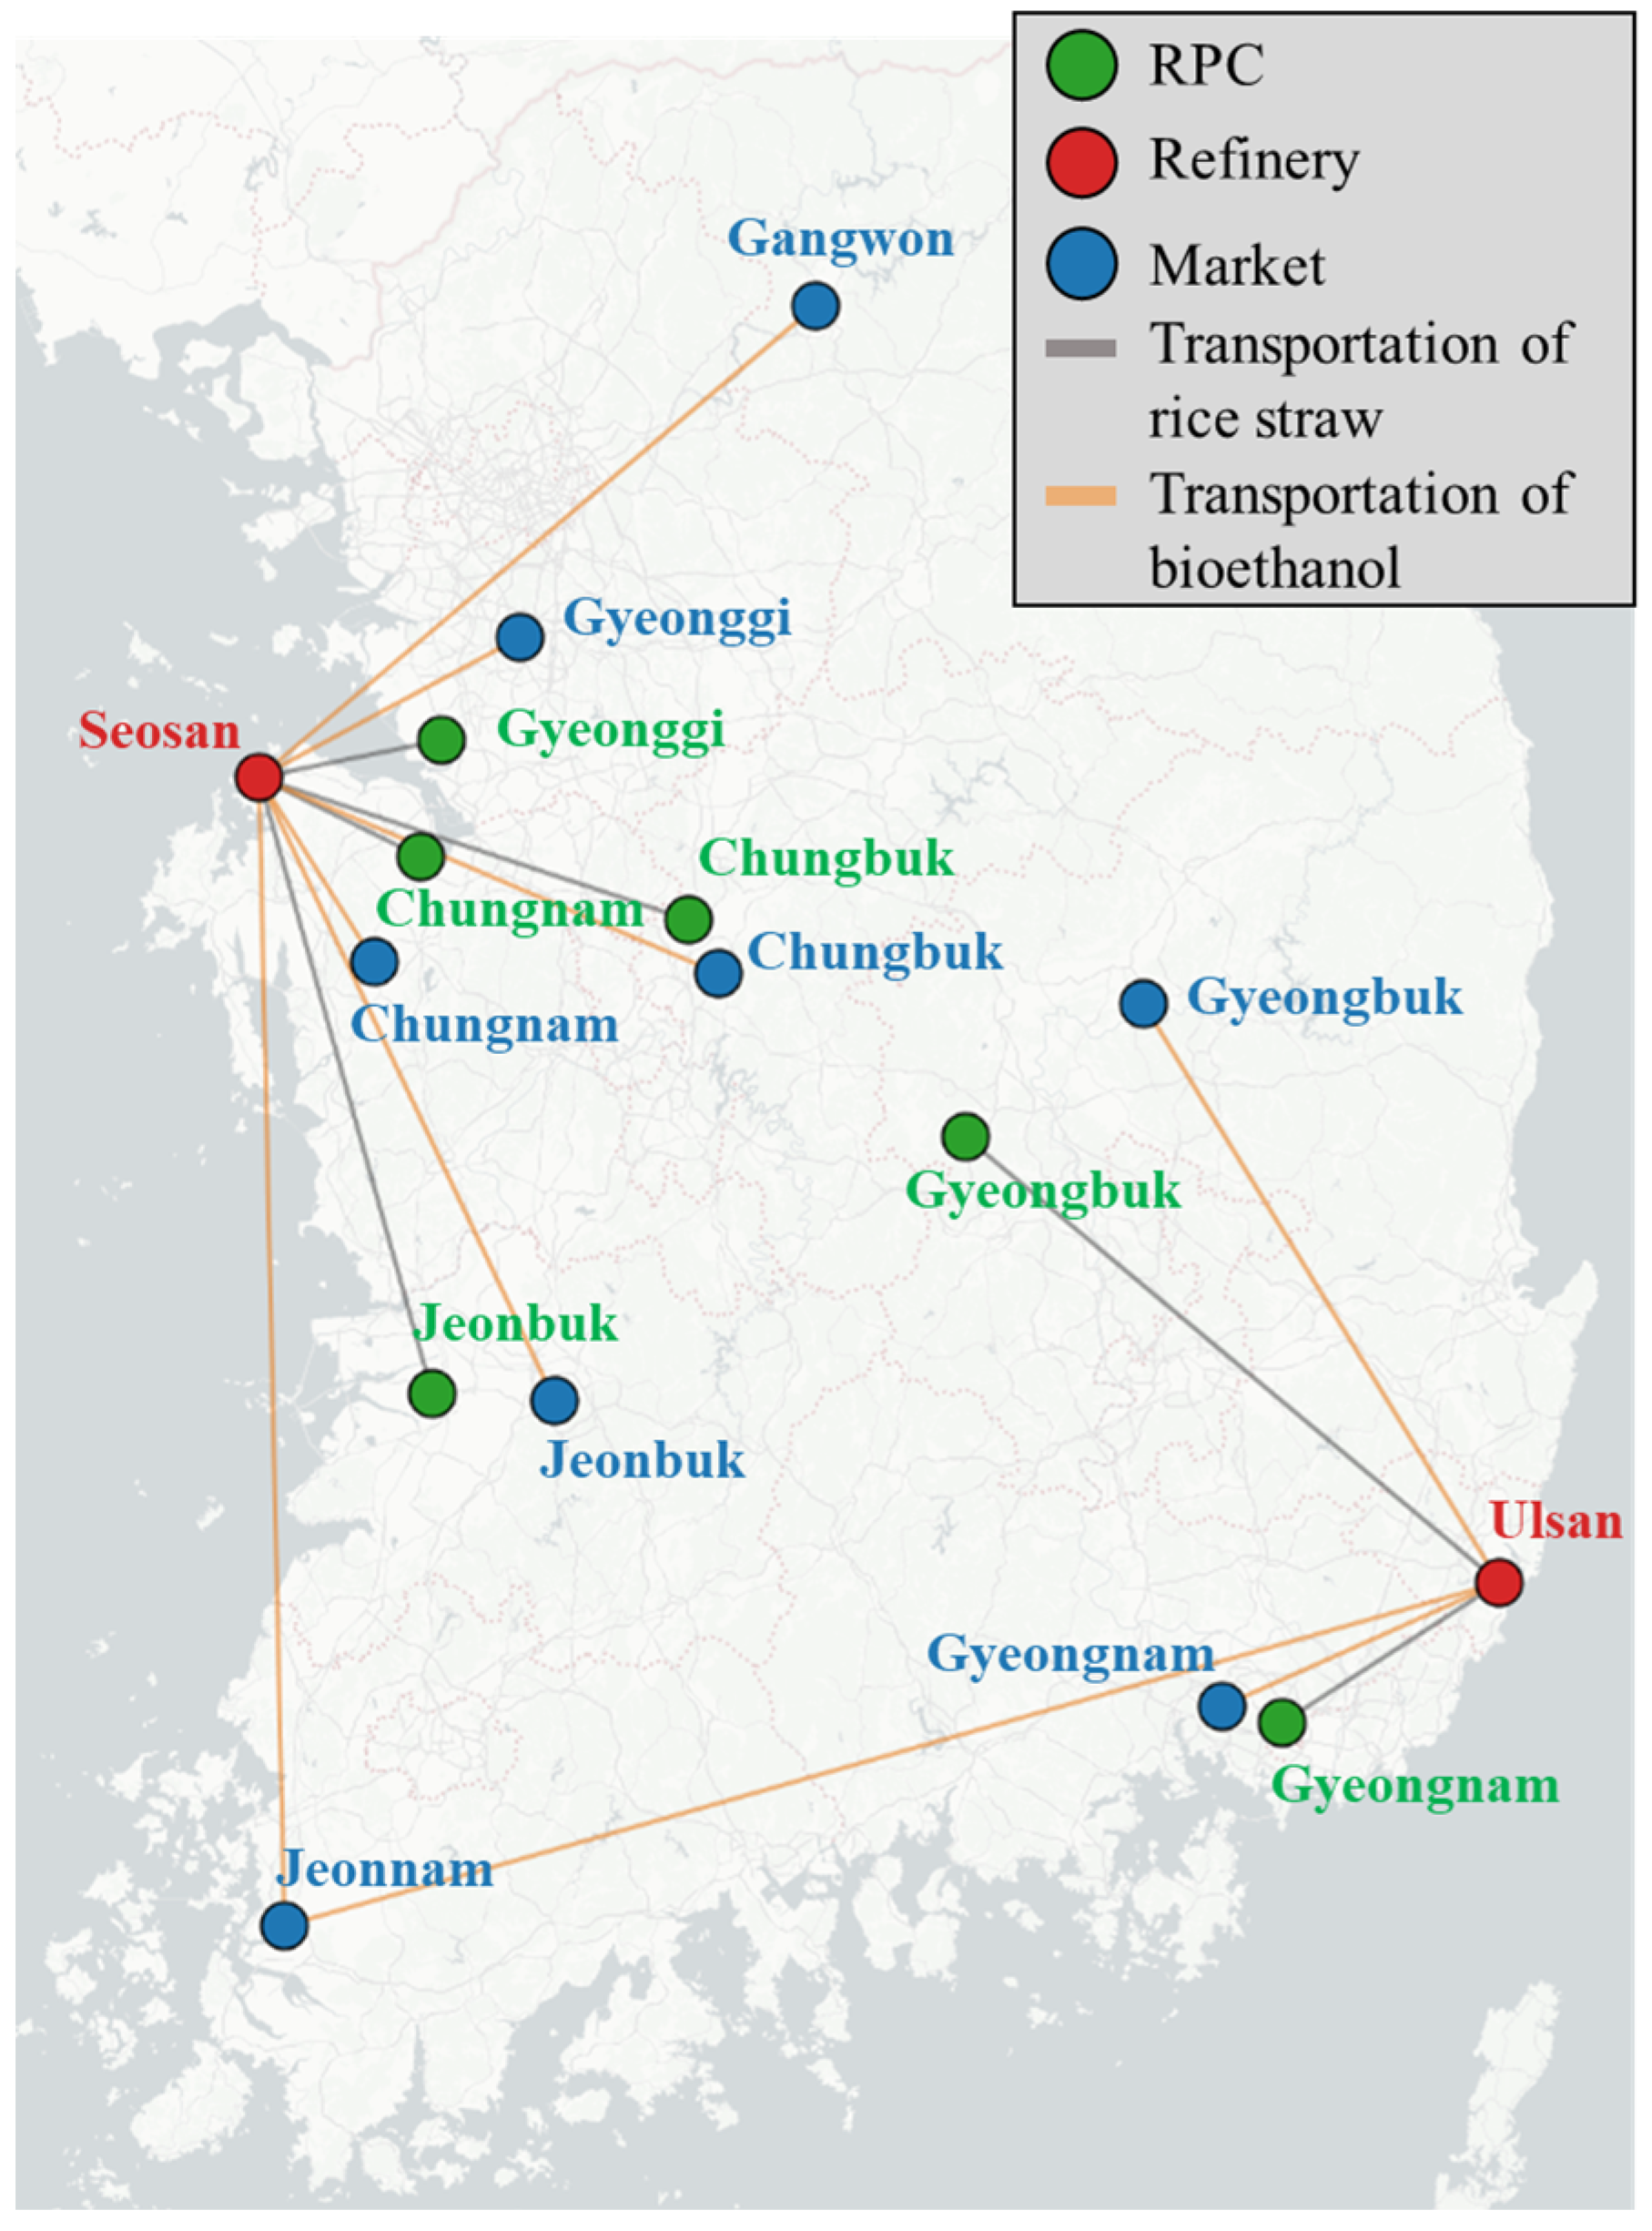
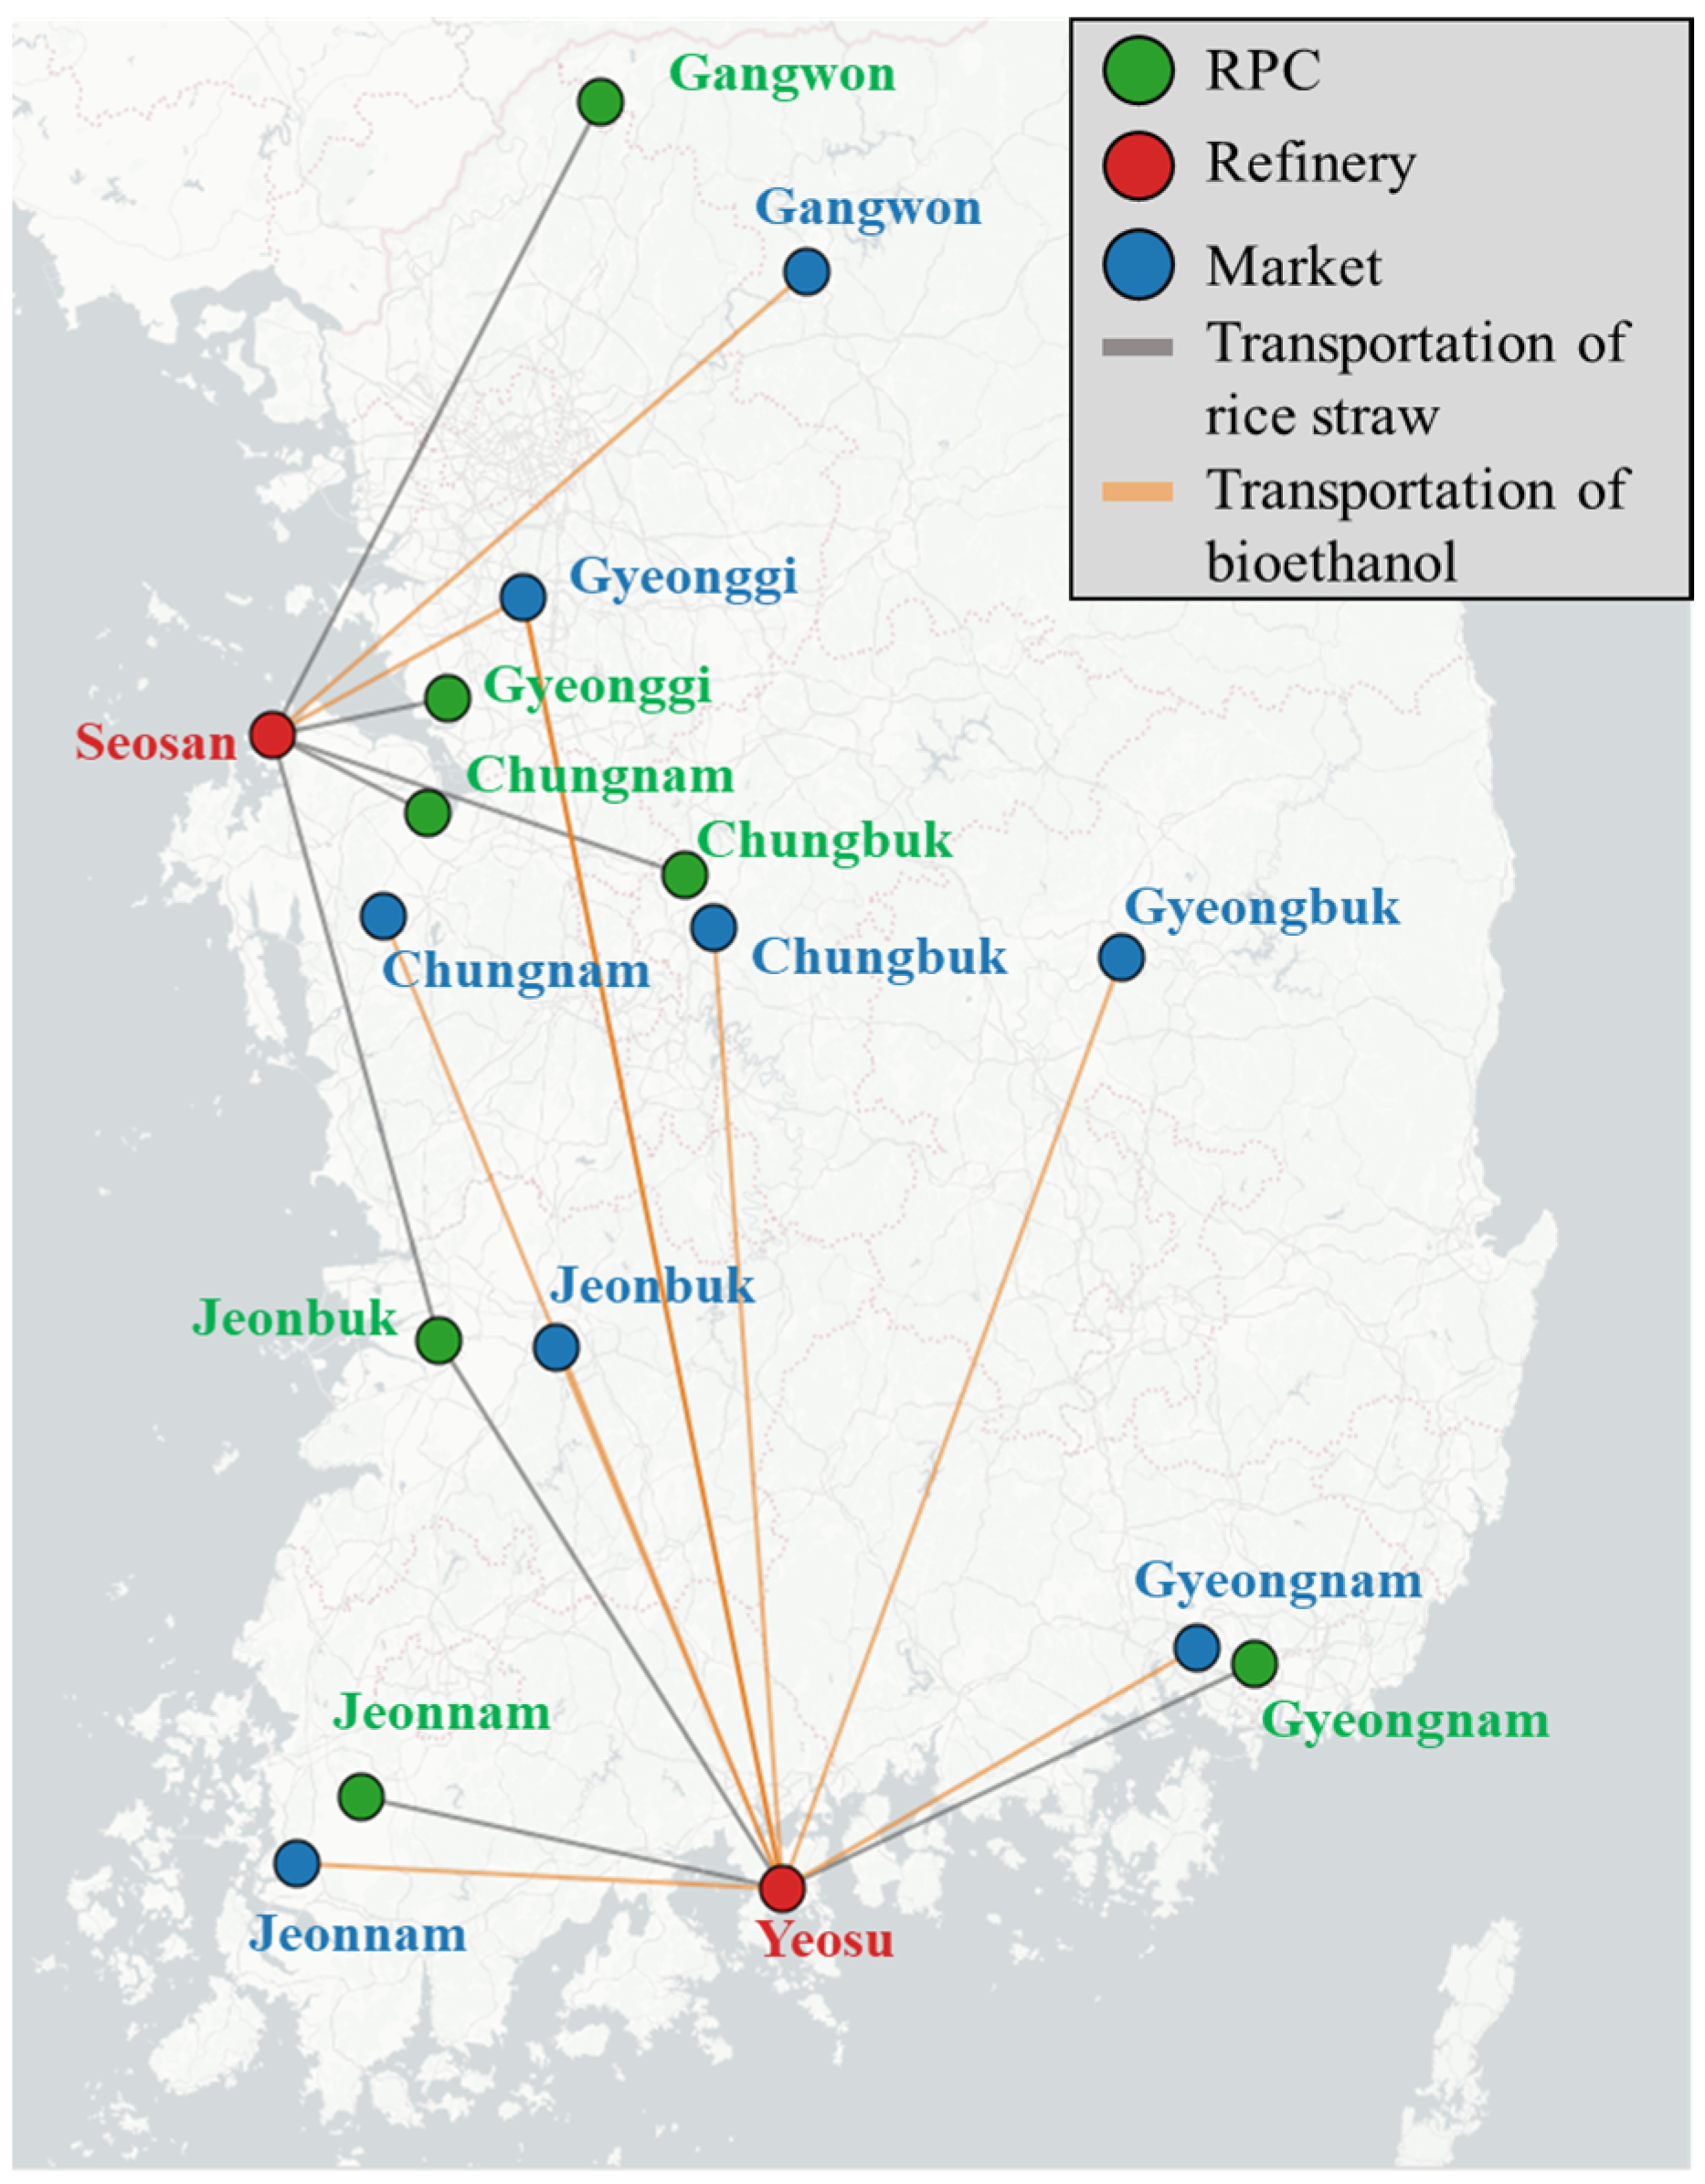
Figure 4 shows the optimal supply chain configuration for the RFS 6% scenario. Under the RFS 3% scenario, operating a single large-scale refinery in Seosan was the most economical option. However, at the RFS 6% scenario, a medium-scale refinery is added in Ulsan, expanding the total number of refineries to two. The reason for the expansion to two refineries in the RFS 6% scenario is due to the physical production capacity limitations of a single large-scale refinery located in Seosan. The maximum annual straw production capacity of a single large-scale refinery is set at 1,400,000 tons, but the total straw collection volume required to achieve the RFS 6% policy target is 2,095,792 tons, significantly exceeding the production capacity of a single facility. Ulsan was selected in this case to immediately process abundant raw materials distributed in Gyeongnam (359,321 tons) and Gyeongbuk (181,664 tons) at a nearby industrial base, thereby reducing long-distance transportation costs for heavy raw materials. Ulsan serves as the optimal geographical location for minimizing product distribution distances to southern demand sources, including Gyeongnam (65,572 KL) and Gyeongbuk (60,488 KL).
Figure 5 illustrates the optimal supply chain configuration for the RFS 9% scenario. In the RFS 9% scenario, the annual capital cost (US $108,675,059) represents approximately 16.6% of the total system cost. Annual operating fixed costs also increase from US $18,037,027 to US $36,074,054 due to the facility expansion. In the RFS 9% scenario, securing facility capacity and logistics efficiency are crucial factors in establishing a three-pronged supply chain. The total straw collection required to achieve the 9% target would surge to 3,143,689 tons, a level that is impossible to accommodate with the existing 6% scenario. Accordingly, the model adopts a strategy of building a new, large-scale refinery in Yeosu. The Yeosu refinery, with its superior access to resources in Jeonbuk and Jeonnam compared to Ulsan, will efficiently share the logistics load, resulting in the distribution of 301,572 KL of bioethanol. In terms of operating variable costs, raw material purchase costs dominate across all scenarios. Based on the 9% scenario, the raw material purchase cost is US $238,315,483, accounting for approximately 36.3% of the total system cost, demonstrating that the economic feasibility of the supply chain is highly sensitive to the unit price of rice straw. Process variable costs also increase from US $38,660,681 to US $115,982,043 as raw material usage increases, remaining at approximately 17.7% of the total cost. In conclusion, the Korean bioethanol supply chain should adopt a strategy of gradually increasing the number of refineries to meet future bioethanol demand and selecting the optimal size for each region.
Table 13 presents rice straw transportation volumes based on demand. Analysis of rice straw transportation volumes reveals that as the blending ratio increases, the geographic link between raw material sources and refineries strengthens. For the RFS 3% scenario, the Seosan refinery exclusively sources 920,492 tons of rice straw from Gyeonggi and Chungnam RPC. However, in the RFS 9% scenario, Yeosu emerges as a key refinery, absorbing 317,712 tons from Jeonbuk, 684,444 tons from Jeonnam, and 359,321 tons from Gyeongnam, for a total consumption of 1,361,477 tons. Seosan refinery receives 350,766 tons of rice straw from Gyeonggi, 2575 tons from Gangwon, 648,264 tons from Chungnam, and 225,735 tons from Jeonbuk. Under the RFS 9% scenario, the rice straw from the Gyeongnam RPC (440,985 tons), which is transported to the Ulsan refinery in the RFS 6% scenario, is integrated and processed at the Yeosu refinery. Therefore, the Yeosu refinery expands its processing capacity to 1,361,477 tons.
Table 14 shows bioethanol transport volumes based on demand. Under the RFS 3% scenario, the Seosan refinery, which distributes bioethanol across eight regions nationwide, will shift to a structure focused on serving adjacent large-demand sources, including 403,678 KL in Gyeonggi and 56,922 KL in Gangwon, under the RFS 9% scenario. The Yeosu refinery, under the 9% scenario, will transport a total of 460,600 KL of bioethanol as a distribution base for the southern region, including not only Jeonnam and Gyeongnam but also 61,257 KL in Chungbuk and 82,761 KL in Chungnam. This demonstrates that transporting light-weight products produced in refineries near RPC over long distances is more economical than transporting heavy-weight raw materials. In conclusion, the transportation of 2,761,477 tons of rice straw and the distribution of 908,526 KL of ethanol required to achieve the RFS 9% target will be optimized through a multi-location strategy that reflects the geographic characteristics of South Korea. To minimize the movement of heavy raw materials, refineries will be located on a large scale in refineries in Seosan and Yeosu. This supply chain structure will form the foundation for an efficient infrastructure roadmap to achieve future national energy policy goals.

4. Discussion

The experimental results in Section 3 demonstrate that national policy goals are a key driver of the structure of the bioethanol supply chain. The increase in the RFS ratio, driven by the national renewable energy policy, directly leads to increased demand, which becomes a decisive factor in determining the location of additional refineries and infrastructure expansion. Specifically, increasing the RFS from 3% to 9% triples demand, while the total cost of meeting this demand increases approximately 2.9 times, demonstrating the link between demand and cost. This suggests that increasing policy goals goes beyond simply increasing bioethanol use and has a complex impact that leads to structural changes throughout the entire supply chain.
Furthermore, the experiment demonstrates the importance of considering geographic specificities in designing the Korean bioethanol supply chain. Seosan, the optimal location for the baseline scenario of 3% RFS, serves as the center of gravity of the supply chain and optimizes the movement routes of major cargo volumes. Seosan offers an excellent geographic advantage, minimizing raw material procurement costs, as it is located close to Chungnam (50.57 km), the largest raw material supplier in Korea, and Gyeonggi (100.94 km), the largest consumer. From an economic perspective, building a single, large-scale refinery in Seosan is the most feasible strategy for low mixing ratios. Dispersing operations across multiple smaller facilities, rather than reducing logistics costs, increases total transportation costs by US $653,035, significantly increasing annual capital costs. Consequently, while operating a single, large-scale refinery increases shipping costs to some remote demand sources (e.g., South Jeolla Province and South Gyeongsang Province), the significant cost savings in raw material procurement more than offset this increase.
This model maximizes the cost efficiency of the entire supply chain by minimizing the transport distance of heavy rice straw, rather than simply identifying resource-rich regions. Since rice straw transportation accounts for 85.9% of total logistics costs and its mass decreases significantly after preprocessing, reducing the transport distance of raw materials is more economical than shortening the transport distance of the final product, bioethanol. Regions with abundant resources, such as Jeonnam (684,444 tons) and Gangwon (110,968 tons), were completely excluded from procurement in the initial scenario, likely because the increased costs associated with increased transport distance offset the economic benefits of securing resources.
The expansion from one refinery to two under the 6% RFS condition is due to the physical production capacity limit of a single large-scale refinery of 1.4 million tons, necessitating the utilization of multiple refineries to meet demand. As the bioethanol blending ratio increases, the transportation costs of heavy rice straw increase, making geographic proximity between the RPC and the refinery a key factor in supply chain economics. Accordingly, the model opts for a structural shift from a single hub to a distributed system across multiple hubs, including Ulsan and Yeosu. Therefore, to effectively respond to future demand, a strategy is needed to maximize logistics efficiency by gradually expanding refineries near raw material collection points. This supply chain structure will form the basis for an efficient infrastructure roadmap to achieve future national energy policy goals. Despite the supply chain economics fluctuating significantly depending on the purchase price of rice straw, which accounts for 36.3% of total costs, to meet demand under the 9% RFS, securing facility capacity and maintaining logistics efficiency remain crucial. However, this study has limitations in that it relies on a deterministic methodology and thus fails to fully capture the probabilistic uncertainty of the purchase price of rice straw and market demand.

5. Conclusions

This study has proposed an MILP model to design an optimal bioethanol supply chain utilizing rice straw, a readily available resource in South Korea. The proposed MILP model has optimized the total cost of bioethanol production by considering the locations of farms, refineries, and markets, as well as transportation volumes. Furthermore, this study has developed an optimization model that simultaneously determines refinery location, size, and process method by linking pretreatment technology yield, investment costs, and operating costs to decision variables. For the experiments, this study has considered the RFS policy scenarios implemented by the Korean government and studied the supply chain changes resulting from changes in the blending ratio from 3% (RFS 3%) to 9% (RFS 9%). This study has examined how four refineries were selected based on the blending ratio changes and analyzed the balance between initial investment and transportation costs to derive the optimal supply chain network configuration. While operating a single large-scale refinery was the most economical option under the RFS 3% scenario, the RFS 6% and RFS 9% scenarios required the utilization of multiple refineries to ensure better supply chain economics. In conclusion, the proposed MILP model enables the analysis of how additional refinery construction and facility size changes can be implemented to meet the rapidly increasing demand for bioethanol. Furthermore, the proposed model quantitatively assesses the resulting total cost increase and the extent of expansion in the feedstock collection area, thereby proposing optimal supply chain operation policies.

Author Contributions

Conceptualization, S.S., J.S., Y.K., S.K. (Sumin Kim), and S.K. (Sojung Kim); methodology, S.S., J.S., Y.K., S.K. (Sumin Kim), and S.K. (Sojung Kim); software, S.S., J.S., and Y.K.; validation, S.S., S.K. (Sumin Kim), and S.K. (Sojung Kim); formal analysis, S.S., J.S., Y.K., and S.K. (Sojung Kim); investigation, S.S., J.S., Y.K., and S.K. (Sojung Kim); resources, S.K. (Sumin Kim) and S.K. (Sojung Kim); writing—original draft, S.S., J.S., Y.K., S.K. (Sumin Kim), and S.K. (Sojung Kim); writing—review and editing, S.S., J.S., Y.K., S.K. (Sumin Kim), and S.K. (Sojung Kim); visualization, S.S., J.S., and Y.K.; funding acquisition, S.K. (Sojung Kim); supervision, S.K. (Sojung Kim) All authors have read and agreed to the published version of the manuscript.

Funding

This work was supported by a Basic Science Research Program through the National Research Foundation of Korea (NRF), funded by the Ministry of Education (No. RS-2023–00239448).

Data Availability Statement

The original contributions presented in the study are included in the article; further inquiries can be directed to the corresponding author.

Acknowledgments

The authors gratefully acknowledge the support of the National Research Foundation of Korea (NRF) of Korea and the Ministry of Education. The views expressed in this paper are solely those of the authors and do not represent the opinions of the funding agency.

Conflicts of Interest

The authors declare no conflicts of interest.

References

  1. Cozzi, L.; Gould, T.; Bouckart, S.; Crow, D.; Kim, T.Y.; McGlade, C.; Wetzel, D. World Energy Outlook 2020; International Energy Agency: Paris, France, 2020. [Google Scholar]
  2. Wang, J.; Azam, W. Natural resource scarcity, fossil fuel energy consumption, and total greenhouse gas emissions in top emitting countries. Geosci. Front. 2024, 15, 101757. [Google Scholar] [CrossRef]
  3. World Bioenergy Association (WBA). Global Bioenergy Statistics Report; World Bioenergy Association (WBA): Stockholm, Sweden, 2024; Available online: https://www.worldbioenergy.org/uploads/241023_GBS_Report.pdf (accessed on 21 January 2026).
  4. Renewable Energy Policy Network for the 21st Century (REN21). Renewables 2024 Global Status Report; Renewable Energy Policy Network for the 21st Century (REN21): Paris, France, 2024; Available online: https://www.lerenovaveis.org/contents/lerpublication/2024_abr_ren21_renewables-2024--global-status-report.pdf (accessed on 21 January 2026).
  5. United Nations Framework Convention on Climate Change. Paris Agreement. Available online: https://unfccc.int/sites/default/files/resource/parisagreement_publication.pdf (accessed on 21 January 2026).
  6. Korea Energy Agency. New and Renewable Energy Center. Renewable Fuel Standard (RFS). Available online: https://www.knrec.or.kr/biz/introduce/new_policy/intro_rfs.do?gubun=A (accessed on 21 January 2026).
  7. de Assis Castro, R.C.; Camacho, C.E.C.; Roberto, I.C.; Mussatto, S.I. Techno-economic assessment of rice straw biorefineries to produce ethanol with co-production of xylitol and phenolic acids. Biomass Bioenergy 2025, 197, 107804. [Google Scholar] [CrossRef]
  8. Hong, S.; Huh, S. Assessing the relative importance of strategies for enhancing transportation bio-diesel production and distribution in South Korea. J. Clim. Change Res. 2023, 14, 599–609. [Google Scholar] [CrossRef]
  9. Korea Biofuel Forum. Introduction to Biofuels. Available online: https://k-biofuels.or.kr/front/kor/bio/biofuel (accessed on 20 February 2026).
  10. IEA Bioenergy. Implementation of Bioenergy in the Republic of Korea 2024 Update. Available online: https://www.ieabioenergy.com/wp-content/uploads/2024/12/CountryReport2024_Korea_final.pdf (accessed on 21 January 2026).
  11. The Korea Economic Daily. Biodiesel Blending in Diesel Fuel Will Increase to 5% by 2030. Available online: https://www.hankyung.com/article/202101310851Y (accessed on 21 January 2026).
  12. Ministry of Land, Infrastructure and Transport (MOLIT). SAF Expansion Strategy. Available online: https://molit.go.kr/atmo/USR/N0201/m_36515/dtl.jsp?lcmspage=8&id=95090132 (accessed on 20 February 2026).
  13. Korea National Oil Corporation Petronet. Gasoline Consumption Statistics by Region in 2024. Available online: http://www.petronet.co.kr (accessed on 21 January 2026).
  14. Lee, M.; Cho, S.; Kim, J. A comprehensive model for design and analysis of bioethanol production and supply strategies from lignocellulosic biomass. Renew. Energy 2017, 112, 247–259. [Google Scholar] [CrossRef]
  15. Park, Y.C.; Kim, J.S. Enzymatic hydrolysis characteristics of pretreated rice straw by aqueous ammonia for bioethanol production. Korean Chem. Eng. Res. 2011, 49, 470–474. [Google Scholar] [CrossRef]
  16. Mao, J.; Zhang, S.; Liu, J. Straw Logistics Network Optimization Considering Cost Importance and Carbon Emission under the Concept of Sustainable Development. Sustainability 2024, 16, 6235. [Google Scholar] [CrossRef]
  17. Malik, K.; Sharma, P.; Yang, Y.; Zhang, P.; Zhang, L.; Xing, X.; Yue, J.; Song, Z.; Nan, L.; Yujun, S.; et al. Lignocellulosic biomass for bioethanol: Insight into the advanced pretreatment and fermentation approaches. Ind. Crops Prod. 2022, 188, 115569. [Google Scholar] [CrossRef]
  18. Mosier, N.; Wyman, C.; Dale, B.; Elander, R.; Lee, Y.Y.; Holtzapple, M.; Ladisch, M. Features of promising technologies for pretreatment of lignocellulosic biomass. Bioresour. Technol. 2005, 96, 673–686. [Google Scholar] [CrossRef] [PubMed]
  19. Chen, N.; Jiang, K.; Zhao, M.; Zhang, C.; Jin, Y.; Wu, W. Pretreatment process of lignocellulosic biomass: A review of pseudo-lignin formation. Biomass Bioenergy 2024, 188, 107339. [Google Scholar] [CrossRef]
  20. Kumakura, M.; Kaetsu, I. Effect of radiation pretreatment of bagasse on enzymatic and acid hydrolysis. Biomass 1983, 3, 199–208. [Google Scholar] [CrossRef]
  21. Sumphanwanich, J.; Leepipatpiboon, N.; Srinorakutara, T.; Akaracharanya, A. Evaluation of dilute-acid pretreated bagasse, corn cob and rice straw for ethanol fermentation by Saccharomyces cerevisiae. Ann. Microbiol. 2008, 58, 219–225. [Google Scholar] [CrossRef]
  22. Hsu, T.-C.; Guo, G.-L. Effect of dilute acid pretreatment of rice straw on structural properties and enzymatic hydrolysis. Bioresour. Technol. 2010, 101, 4907–4913. [Google Scholar] [CrossRef] [PubMed]
  23. Khantibongse, P.; Ratanatamskul, C. Insight into pathway of monosaccharide production from integrated enzymatic hydrolysis of rice straw waste as feed stock for anaerobic digestion. Sci. Rep. 2023, 13, 148. [Google Scholar] [CrossRef] [PubMed]
  24. Binod, P.; Sindhu, R.; Singhania, R.R.; Vikram, S.; Devi, L.; Nagalakshmi, S.; Kurien, N.; Sukumaran, R.K.; Pandey, A. Bioethanol production from rice straw: An overview. Bioresour. Technol. 2010, 101, 4767–4774. [Google Scholar] [CrossRef]
  25. National Renewable Energy Laboratory. 2024 Annual Technology Baseline: Ethanol; U.S. Department of Energy, Office of Energy Efficiency & Renewable Energy: Washington, DC, USA, 2024. Available online: https://atb.nrel.gov/transportation/2024/Ethanol (accessed on 23 February 2026).
  26. Aden, A.; Ruth, M.; Ibsen, K.; Jechura, J.; Neeves, K.; Sheehan, J.; Wallace, B.; Montague, L.; Slayton, A.; Lukas, J. Lignocellulosic Biomass to Ethanol Process Design and Economics Utilizing Co-Current Dilute Acid Pretreatment and Enzymatic Hydrolysis for Corn Stover; NREL/TP-510-32438; National Renewable Energy Laboratory: Golden, CO, USA, 2002.
  27. Maibam, P.D.; Goyal, A. Bioethanol production from delignified rice straw by using a novel crude recombinant enzyme cocktail in pre-saccharification simultaneous saccharification and fermentation process. Process Biochem. 2025, 153, 26–33. [Google Scholar] [CrossRef]
  28. Sukma, A.C.T.; Budiyono, B.; Al-Baarri, A.N.M. Recent advances in bioethanol production from rice straw: Strategies, new concepts, and challenges. Int. J. Environ. Res. 2025, 19, 8. [Google Scholar] [CrossRef]
  29. Humbird, D.; Davis, R.; Tao, L.; Kinchin, C.; Hsu, D.; Aden, A.; Dudgeon, D.; Sneeringer, P.; Beaty, J.N.; Milbrandt, A. Process Design and Economics for Biochemical Conversion of Lignocellulosic Biomass to Ethanol: Dilute-Acid Pretreatment and Enzymatic Hydrolysis of Corn Stover; Technical Report NREL/TP-5100-47764; National Renewable Energy Laboratory (NREL): Golden, CO, USA, 2011.
  30. Tao, L.; Schell, D.; Davis, R.; Tan, E.; Elander, R.; Bratis, A. NREL 2012 Achievement of Ethanol Cost Targets: Biochemical Ethanol Fermentation via Dilute-Acid Pretreatment and Enzymatic Hydrolysis of Corn Stover; Technical Report NREL/TP-5100-61568; National Renewable Energy Laboratory (NREL): Golden, CO, USA, 2014.
  31. Hassan, M.K.; Ilyas, S.Z.; Al-Refai, A.; Ahmad, M.S. Energy and environmental impact assessment of Indian rice straw for the production of second-generation bioethanol. Sustain. Energy Technol. Assess. 2021, 47, 101546. [Google Scholar] [CrossRef]
  32. Dutta, A.; Talmadge, M.; Hensley, J.; Worley, M.; Dudgeon, D.; Barton, D.; Groendijk, P. Process Design and Economics for Conversion of Lignocellulosic Biomass to Ethanol: Thermochemical Pathway by Indirect Gasification and Mixed Alcohol Synthesis; Technical Report NREL/TP-5100-51400; National Renewable Energy Laboratory (NREL): Golden, CO, USA, 2011.
  33. Dunn, J.; Johnson, M.; Wang, Z.; Wang, M.; Cafferty, K.; Jacobson, J.; Searcy, E.; Biddy, M.; Dutta, A.; Inman, D.; et al. Supply Chain Sustainability Analysis of Three Biofuel Pathways: Biochemical Conversion of Corn Stover to Ethanol, Indirect Gasification of Southern Pine to Ethanol, Pyrolysis of Hybrid Poplar to Hydrocarbon Fuels; Technical Report ANL/ESD/14-3; Argonne National Laboratory (ANL): Argonne, IL, USA, 2013.
  34. Valles, A.; Capilla, M.; Álvarez-Hornos, F.J.; García-Puchol, M.; San-Valero, P.; Gabaldón, C. Optimization of alkali pretreatment to enhance rice straw conversion to butanol. Biomass Bioenergy 2021, 150, 106131. [Google Scholar] [CrossRef]
  35. Chen, C.W.; Fan, Y. Bioethanol supply chain system planning under supply and demand uncertainties. Transp. Res. Part E Logist. Transp. Rev. 2012, 48, 150–164. [Google Scholar] [CrossRef]
  36. Aranguren, M.; Castillo-Villar, K.K.; Aboytes-Ojeda, M. A two-stage stochastic model for co-firing biomass supply chain networks. J. Clean. Prod. 2021, 319, 128582. [Google Scholar] [CrossRef]
  37. Hiloidhari, M.; Das, D.; Baruah, D.C. Bioenergy potential from crop residue biomass in India. Renew. Sustain. Energy Rev. 2014, 32, 369–381. [Google Scholar] [CrossRef]
  38. Wu, J.; Zhang, J.; Yi, W.; Cai, H.; Li, Y.; Su, Z. Agri-biomass supply chain optimization in north China: Model development and application. Energy 2022, 239, 122374. [Google Scholar] [CrossRef]
  39. Nguyen, H.V.; Nguyen, C.D.; Tran, T.V.; Hau, H.D.; Nguyen, N.T.; Gummert, M. Energy efficiency, greenhouse gas emissions, and cost of rice straw collection in the Mekong River Delta of Vietnam. Field Crops Res. 2016, 198, 16–22. [Google Scholar] [CrossRef]
  40. Tran, T.H.; Nguyen, T.B.T.; Le, H.S.T.; Phung, D.C. Formulation and solution technique for agricultural waste collection and transport network design. Eur. J. Oper. Res. 2024, 313, 1152–1169. [Google Scholar] [CrossRef]
  41. Lee, Y.; Carrero-Parreño, A.; Papageorgiou, L.G.; Ramaswamy, S.; Jose, M. Integrated Planning of Industrial Gas Supply Chains. In Computer Aided Chemical Engineering; Pierucci, S., Ed.; Elsevier: Amsterdam, The Netherlands, 2020; Volume 48, pp. 1207–1212. [Google Scholar]
  42. Clautiaux, F.; Ljubić, I. Last fifty years of integer linear programming: A focus on recent practical advances. Eur. J. Oper. Res. 2025, 324, 707–731. [Google Scholar] [CrossRef]
  43. El Mehdi, E.R.; Ilyas, H.; François, S. Incremental LNS framework for integrated production, inventory, and vessel scheduling: Application to a global supply chain. Omega 2023, 116, 102821. [Google Scholar] [CrossRef]
  44. Rural Development Administration. Rice Processing Complex. Available online: https://www.nongsaro.go.kr/portal/viewer/result/cms_contents/crop/viewer/23130.hwp.view.xhtml (accessed on 20 January 2026).
  45. Ministry of Agriculture, Food and Rural Affairs. State of Government-Supported Rice Processing Complex. Available online: https://www.data.go.kr/data/3077309/fileData.do (accessed on 5 January 2026).
  46. Ministry of Data and Statistics. Rice Straw Production. Available online: https://forums.swift.org/t/if-vs-available-vs-if-available/40266 (accessed on 2 January 2026).
  47. Karatzos, S.; McMillan, J.D.; Saddler, J.N. The Potential and Challenges of Drop-in Biofuels: A Report by IEA Bioenergy Task 39; IEA Bioenergy: Paris, France, 2014. [Google Scholar]
  48. Hyundai Oilbank. Refining Business. Available online: https://www.hd-hyundaioilbank.co.kr/eng/business-domain/business/contentsid/650/index.do?linkTab (accessed on 2 December 2025).
  49. SK Seagate. Company Information. Available online: https://skseagate.skinnovation.com/view/seagate/abo/company/company01 (accessed on 2 December 2025).
  50. Oilandgas Club. Top 15 Refineries by Throughput. Available online: https://www.oilandgasclub.com/worlds-largest-refineries/ (accessed on 2 December 2025).
  51. Kim, J.; Realff, M.J.; Lee, J.H. Optimal design and global sensitivity analysis of biomass supply chain networks for biofuels under uncertainty. Comput. Chem. Eng. 2011, 35, 1738–1751. [Google Scholar] [CrossRef]
  52. Garrote, G.; Domínguez, H.; Parajó, J.C. Autohydrolysis of corncob: Study of non-isothermal operation for xylooligosaccharide production. J. Food Eng. 2002, 52, 211–218. [Google Scholar] [CrossRef]
  53. Kwon, O.; Son, M.; Kim, J.; Han, J.-H. Organic waste derived bioethanol supply chain network: Multiobjective snapshot model with a real-Korea case study. J. Environ. Manag. 2023, 342, 118279. [Google Scholar] [CrossRef]
  54. You, F.; Wang, B. Life cycle optimization of biomass-to-liquid supply chains with distributed centralized processing networks. Ind. Eng. Chem. Res. 2011, 50, 10102–10127. [Google Scholar] [CrossRef]
  55. Peters, M.S.; Timmerhaus, K.D. Plant Design and Economics for Chemical Engineers; McGraw-Hill: New York, NY, USA, 2003. [Google Scholar]
  56. National Institute of Animal Science (RDA). Standard Feed Composition Tables (Korean Standard Feed Composition); Rural Development Administration: Wanju, Republic of Korea, 2023. [Google Scholar]
  57. Sokhansanj, S.; Kumar, A.; Turhollow, A.F. Development and implementation of integrated biomass supply analysis and logistics model (IBSAL). Biomass Bioenergy 2006, 30, 838–847. [Google Scholar] [CrossRef]
Figure 1. Rice straw-based biofuel supply chain.
Energies 19 01338 g001
Figure 2. Facility distribution of a bioethanol supply chain in South Korea.
Energies 19 01338 g002
Figure 3. Optimal supply chain configuration for RFS 3% scenario.
Energies 19 01338 g003
Figure 4. Optimal supply chain configuration for RFS 6% scenario.
Energies 19 01338 g004
Figure 5. Optimal supply chain configuration for the RFS 9% scenario.
Energies 19 01338 g005
Table 1. RPC locations and regional rice straw production in South Korea [45,46].
LocationLatitude (°N)Longitude (°E)Area (ha)Yield (Ton)
Gyeonggi37.07126.8372,914416,579
Gangwon38.20127.2127,651131,788
Chungbuk36.73127.4232,469205,056
Chungnam36.85126.78129,786769,895
Jeonbuk35.83126.81104,343645,412
Jeonnam34.94126.62147,714812,864
Gyeongbuk36.32128.0889,339512,654
Gyeongnam35.20128.8362,479426,739
Table 2. Location and nameplate capacity of bioethanol refineries in South Korea [48,49,50].
LocationLatitude (°N)Longitude (°E)Capacity (KL)
Ulsan35.47129.35241,680
Yeosu34.78127.72116,070
Seosan37.00126.40109,710
Incheon37.51126.6643,725
Table 3. Market locations and regional gasoline demand [13].
LocationLatitude (°N)Longitude (°E)Demand (°Bbl)
Gyeonggi37.26127.0228,375,000
Gangwon37.88127.723,978,000
Chungbuk36.63127.494,281,000
Chungnam36.65126.675,784,000
Jeonbuk35.82127.103,888,000
Jeonnam34.81126.463,973,000
Gyeongbuk36.57128.506,341,000
Gyeongnam35.23128.696,874,000
Table 4. Dilute acid pretreatment yield and cost components [25].
PretreatmentYield (KL/Ton)Total Capital Investment (US $)Fixed Costs
(US $/Year)
Operating Costs
(US $/Ton)
Feedstock Costs
(US $/Ton)
Dilute Acid0.329447,000,00011,900,0004286.3
Table 5. Transportation distance from farm to refineries (unit: km).
FarmRefinery
UlsanYeosuSeosanIncheon
Gyeonggi366.08321.6878.0667.37
Gangwon439.4437.86220.48122.14
Chungbuk278.27268.76117.73153.83
Chungnam339.27285.7150.57103.34
Jeonbuk305.99180.91160.06221.96
Jeonnam337.71146.03280.64342.54
Gyeongbuk193.87279.57234.66228.78
Gyeongnam74.69161.63385.33414.92
Table 6. Transportation distance from refineries to market (unit: km).
RefineryMarket
GyeonggiGanwonChungbukChungnamJeonbukJeonnamGyeongbukGyengnam
Ulsan356.51389.28260.83357.65280.56332.31202.5994.21
Yeosu327.12453.85260.43275.27157.38143.16297.92140.86
Seosan100.94215.27126.9770.52183.23284.13247.25368.71
Incheon53.43129.53155.15131.57235.41342.51246.96389.9
Table 7. Unit transportation cost by feedstock [16,53].
FeedstockVariable Cost (US $/km/Ton)Fixed Cost (US $/Ton)
Rice Straw0.4141.725
Bioethanol0.0556.70
Table 8. Nomenclature.
IndexDescription
F Set of farms
R Set of candidate refinery locations
M Set of markets
S Set of refinery scales
ParameterDescription
i Discount rate
n Project life of the refinery
C R F Capital recovery factor
T C I s Total capital investment for scale s (US $)
F C s Fixed operating cost for building scale s (US $)
A F C s Annual total fixed cost for refinery scale s (US $)
b Scaling factor
Y f Annual total rice straw production of farm f (ton/year)
S t f Annual available rice straw supply of farm f (ton/year)
C A P s Annual Refinery Production Capacity (capacity) for scale s (KL/year)
D m Annual bioethanol demand of market m (ton/year)
G m Annual gasoline demand of market m (ton/year)
M c Average moisture content of rice straw
E c Coefficient representing the efficiency of the mechanical collection and baling process
V C f , r s t r a w Variable cost for transporting rice straw from farm
f to refinery r (US $/km/ton)
F C s t r a w Fixed cost for transporting rice straw (US $/ton)
V C r , m e t h Variable cost for transporting ethanol from refinery
r to market m (US $/km/ton)
F C e t h Fixed cost for transporting ethanol (US $/ton)
P C Purchase unit price of rice straw raw material
(US $/ton)
O C Variable cost of processing rice straw into ethanol (US $/ton)
α Yield of Dilute Acid process (KL/ton)
D i s f , r Distance from farm f to refinery r
D i s r , m Distance from refinery r to market m
Decision VariableDescription
X r , s Binary variable indicating whether to build refinery r with scale s
Q f , r Amount of rice straw transported from farm f to refinery r (ton/year)
T r , m Amount of bioethanol produced at refinery r and transported to market m (ton/year)
Table 9. Cost and feedstock usage by number of refineries.
Details Number of Refineries
1 Refinery
(Scale)
2 Refinery
(Scale)
3 Refinery
(Scale)
4 Refinery
(Scale)
LocationSeosan (Large)Seosan
(Medium),
Incheon (Small)
Ulsan (Small), Seosan (Small),
Incheon (Small)
Ulsan (Small),
Seosan (Small),
Yeosu (Small),
Incheon (Small)
Annual Capital Cost
(US $/year)
54,337,52959,501,18370,955,35090,061,970
Fixed Operating Cost
(US $/year)
18,037,02719,751,07223,553,21629,886,854
Variable Operating Cost
(US $/year)
38,660,68138,660,68138,660,68438,660,681
Feedstock Cost
(US $/year)
79,438,49479,438,49479,438,49479,438,494
Rice Straw Transport Cost
(US $/year)
23,957,45322,752,66325,553,21625,495,346
Bioethanol Transport Cost
(US $/year)
4,813,8034,539,8743,928,9453,928,945
Total Annual Cost
(US $/year)
219,244,988224,643,967242,032,033267,472,291
Table 10. Rice straw transport volume in the optimal supply chain.
FarmRefineryTransportation Volume (ton)
GyeonggiSeosan272,228
ChungnamSeosan648,264
Table 11. Bioethanol transport volume in the optimal supply chain.
RefineryMarketTransportation Volume (KL)
SeosanGyeonggi135,338
Gangwon18,974
Chungbuk20,419
Chungnam27,587
Jeonbuk18,544
Jeonnam18,950
Gyeongbuk30,244
Gyeongnam32,786
Table 12. Supply chain costs according to demand.
DemandRFS 3%RFS 6%RFS 9%
Location/ScaleSeosan/LargeSeosan/Large,
Ulsan/Medium
Seosan/Large, Yeosu/Large
Annual Capital Cost (US $/year)54,337,52990,186,929108,675,059
Fixed Operating Cost (US $/year)18,037,02729,937,02736,074,054
Variable Operating Cost (US $/year)38,660,68177,321,362115,982,043
Feedstock Cost (US $/year)79,438,494158,876,988238,315,483
Rice Straw Transport Cost (US $/year)23,957,45369,293,118142,498,609
Bioethanol Transport Cost (US $/year)4,813,8038,539,46714,352,490
Total Annual Cost (US $/year)219,244,988434,154,892655,897,738
Table 13. Rice straw transport volume according to RFS.
Farm RefineryRFS 3%RFS 6%RFS 9%
GyeonggiSeosan272,228350,766350,766
Incheon---
GangwonSeosan--2575
ChungbukSeosan-172,660172,660
ChungnamSeosan648,264648,264648,264
JeonbukSeosan-228,310225,735
Yeosu--317,712
JeonnamYeosu--684,444
GyeongbukSeosan---
Ulsan-81,664-
GyeongnamUlsan-359,321-
Yeosu--359,321
Total Rice Straw (ton)920,4921,840,9852,761,477
Table 14. Bioethanol transport volume according to RFS.
RefineryMarketRFS 3%RFS 6%RFS 9%
SeosanGyeonggi135,338270,676403,678
Gangwon18,97437,94856,922
Chungbuk20,41940,802-
Chungnam27,58755,174-
Jeonbuk18,54437,088-
Jeonnam18,95018,876-
Gyeongbuk30,244--
Gyeongnam32,786--
UlsanChungbuk---
Jeonbuk---
Jeonnam-19,024-
Gyeongbuk-60,488-
Gyeongnam-65,572-
YeosuGyeonggi--2336
Chungbuk--61,257
Chungnam--82,761
Jeonbuk--55,632
Jeonnam--56,850
Gyeongbuk--90,732
Gyeongnam--98,358
IncheonGyeonggi---
Gangwon---
Total Ethanol (KL)302,842605,684908,526
Disclaimer/Publisher’s Note: The statements, opinions and data contained in all publications are solely those of the individual author(s) and contributor(s) and not of MDPI and/or the editor(s). MDPI and/or the editor(s) disclaim responsibility for any injury to people or property resulting from any ideas, methods, instructions or products referred to in the content.