Article

Multi-Scenario Assessment of Imbalance Settlement Mechanisms in a Provincial Dual-Track Electricity Market: An EMS-Oriented Framework
School of Electric Power, South China University of Technology, Guangzhou 510641, China
*
Author to whom correspondence should be addressed.
Energies 2026, 19(3), 683; https://doi.org/10.3390/en19030683
Submission received: 18 December 2025 / Revised: 18 January 2026 / Accepted: 26 January 2026 / Published: 28 January 2026

Abstract

In provincial electricity markets where long-term contracts and spot trading coexist, multiple categories of imbalance funds arise from congestion, energy deviations and dual-track price differences, posing challenges to energy management systems (EMS) in terms of fair and robust settlement. This paper proposes an EMS-oriented framework to assess and diagnose alternative imbalance settlement mechanisms in a provincial dual-track market. First, a unified settlement model is developed that reconstructs key imbalance fund categories and allocates them to heterogeneous agents—thermal, renewable and storage units and different user groups—under a library of settlement rules. Second, a multi-scenario simulation platform is built, covering normal operation, tight supply and high-renewable-volatility conditions. Third, a multi-criteria evaluation scheme is designed to quantify economic efficiency, fairness, risk and renewable support for each mechanism–scenario combination. Finally, a category–agent two-dimensional diagnostic module is introduced to reveal misallocation patterns and the main money-transfer paths among fund categories and agent groups. A case study on a realistic provincial system shows that the proposed framework can distinguish mechanisms with better overall robustness, identify severe cross-subsidies in extreme scenarios and provide practical guidance for refining imbalance settlement parameters within EMS-driven market operations.

1. Introduction

In liberalized power systems, energy management systems (EMSs) are increasingly required not only to coordinate physical resources, but also to interact with complex market architectures spanning mid- to long-term contracts, wholesale spot trading and, increasingly, retail and peer-to-peer arrangements [1,2,3]. As more variable renewable generation is integrated and demand patterns become more uncertain, maintaining real-time balance between generation and consumption relies on a combination of forward markets, balancing mechanisms and ex post settlement rules [4,5]. In this context, the design of imbalance pricing and settlement mechanisms has a direct impact on cost recovery, risk allocation and the incentives faced by market participants, and therefore becomes a key concern for EMS-driven operation of modern electricity markets [6,7,8].
A large body of literature has examined imbalance settlement in European-type balancing markets, focusing on the behaviour of balance responsible parties (BRPs) and overall balancing performance under alternative pricing schemes. Agent-based and analytical studies have shown that single- and dual-price designs can create markedly different incentives for BRPs to self-balance versus relying on the system operator, thereby influencing system costs and residual imbalances [1,7]. Other works have analysed how price caps, regulated add-ons or reserve activation strategies affect the distribution of imbalance costs and potential gaming opportunities in multi-product real-time markets [9,10,11]. Overall, these studies underline that imbalance settlement is not a neutral accounting step, but an essential part of market design that shapes participants’ strategies and system-level outcomes [6].
Compared with this extensive experience in European balancing markets, research on imbalance funds and settlement mechanisms in China is more recent and closely tied to its ongoing market reforms [2,12]. China is building a unified national power market in which mid- to long-term (MLT) contracts and spot markets are jointly developed: long-term bilateral contracts are intended to provide risk hedging and investment signals, while spot markets are expected to reveal short-term marginal costs and support efficient dispatch [12,13]. In practice, MLT contracts typically account for the majority of traded energy and provide a relatively stable settlement baseline, whereas spot trading often represents a smaller share but exhibits higher volatility and stronger sensitivity to system conditions (e.g., forecasting errors, network constraints and scarcity events). Therefore, post-settlement diagnosis should explicitly account for this volume asymmetry when interpreting imbalance funds and the associated rights–responsibilities allocation. In several provincial pilot markets, this has led to a dual-track structure where legacy regulated contracts coexist with newly established spot trades, giving rise to substantial “unbalanced funds” that must be cleared ex post [14,15,16,17]. These funds typically include dual-track price differences, congestion rents, compensation and assessment fees, and other settlement residuals that arise from the interaction of contract and spot positions [16,18,19,20].
Different imbalance fund categories are driven by distinct physical and settlement determinants. The dual-track unbalanced fund is mainly caused by the price–quantity mismatch between regulated (priority) transactions and market-based settlement, i.e., regulated-to-spot price gaps applied to priority volumes. The generation–consumption imbalance fund reflects the net difference between aggregated user-side payments and generator-side revenues across the MLT/DA/RT settlement layers and is therefore sensitive to DA–RT price spreads and deviation settlement rules. The congestion-related fund arises from network constraints that create locational price differences and congestion rents. The low-voltage and agency-user imbalance fund is primarily associated with regulated tariff arrangements and agency settlement rules for non-market-facing users. Finally, compensation and assessment funds are dominated by deviation-related penalties, redispatch/operational compensation and regulation-defined incentives or punishments. Notably, several determinants (e.g., deviations and DA–RT spreads) recur across multiple categories; in our framework, these factors are emphasized through scenario design and evaluation criteria to support robust post-settlement diagnosis. In line with the widely adopted cost-causation or beneficiary-pays principles in electricity markets, the allocation of each imbalance fund category should, as far as possible, reflect its physical origin (e.g., network congestion or forecasting deviation) and the distribution of economic benefits, so that agents who cause or benefit from a fund bear a commensurate share of it.
Existing Chinese-language studies have clarified the composition and accounting of unbalanced funds under the dual-track system and have discussed preliminary allocation principles for different categories of generators and consumers. More recent work has begun to design explicit allocation mechanisms for these imbalance funds in the context of China’s dual-track market, examining options for assigning costs and benefits to market entities while maintaining revenue adequacy and regulatory constraints. However, most of these contributions either focus on static allocation rules under a single operating condition or analyse only a subset of imbalance fund categories. They typically propose one-off allocation rules for each fund category, rather than systematically exploring families of settlement schemes constructed by combining different allocation objects, allocation bases and temporal granularities in a way that is consistent with physical cost-causation and beneficiary-pays principles. As a result, there is still limited evidence on how alternative imbalance settlement mechanisms perform across a range of normal and extreme operating scenarios in provincial dual-track markets and how robust they are with respect to fairness, economic efficiency and risk allocation [15,16,18,19,21,22].
Nevertheless, system operators still lack a unified and quantitative tool to evaluate how alternative settlement schemes jointly shape cost redistribution and operational incentives across multiple imbalance-fund categories, especially under stressed scenarios such as supply tightness and renewable volatility. This gap motivates an EMS-oriented, multi-scenario assessment framework.
In parallel, multi-criteria decision-making (MCDM) methods have been widely applied in the energy sector to support technology selection, planning and operation decisions under multiple, often conflicting objectives. Comprehensive reviews report extensive use of the analytic hierarchy process (AHP), entropy weighting, CRITIC (Criteria Importance Through Intercriteria Correlation), TOPSIS (Technique for Order Preference by Similarity to Ideal Solution) and their variants in renewable energy planning, infrastructure siting and resilience assessment. Recent studies have combined expert-based weighting and data-driven measures of dispersion or contrast intensity to construct hybrid weighting schemes and have used (fuzzy) TOPSIS or related ranking methods to derive transparent composite scores for competing alternatives. Within power systems, such MCDM frameworks have been used to evaluate, for example, distributed generation options, system resilience strategies and operational policies. Nevertheless, the application of structured multi-criteria evaluation and diagnosis to market settlement mechanisms, and in particular to the allocation of imbalance funds in dual-track electricity markets, remains relatively scarce [23,24,25,26,27,28,29].
From the perspective of provincial EMS and market operators, there is a practical need for tools that can (i) model multiple imbalance fund categories in a unified way under realistic dual-track settlement rules, (ii) construct and compare families of alternative allocation mechanisms by combining different allocation objects, allocation bases and temporal granularities in a principled manner, and (iii) provide interpretable diagnostics on who ultimately pays and who benefits from each fund category [19,20,21]. Existing works on unbalanced funds in China typically stop at defining fund categories and proposing allocation principles, while EMS-oriented research tends to concentrate on physical balancing and dispatch rather than ex post financial settlement. To the best of our knowledge, there is still a gap in integrating multi-scenario settlement simulation, multi-criteria evaluation and a two-dimensional diagnosis of imbalance fund flows into a coherent framework that can support the principled design and refinement of imbalance settlement rules in provincial dual-track markets [23,24].
This paper addresses this gap by proposing an EMS-oriented framework for the multi-scenario assessment of imbalance settlement mechanisms in a provincial dual-track electricity market. The main contributions are threefold. First, we develop a unified settlement model that explicitly represents several representative imbalance fund categories—such as congestion surplus, dual-track price differences and compensation or assessment funds—and, for each category, defines a set of allocation options with different allocation objects, allocation bases and temporal granularities. By reasonably combining these options in line with physical cost-causation and beneficiary-pays principles, we construct a family of alternative imbalance settlement mechanisms within a single modelling framework. Second, we construct a provincial-scale, multi-scenario simulation platform that emulates normal operation, tight supply and high renewable volatility conditions and generates settlement outcomes for each mechanism–scenario combination. Third, we design a combined multi-criteria evaluation and category–agent two-dimensional diagnostic module: the former quantifies economic efficiency, fairness, risk and renewable support, while the latter reveals misallocation patterns and the main money-transfer paths among fund categories and agent groups. A case study based on a realistic provincial system illustrates how the proposed framework can distinguish imbalance settlement mechanisms with superior overall robustness and identify severe cross-subsidies in extreme scenarios, thereby providing actionable guidance for refining settlement parameters within EMS-driven market operations.
To clarify the practical applicability of the proposed framework, we briefly discuss the data requirements and potential limitations in real-world EMS settings.
The proposed EMS-oriented framework relies on routinely available operational and settlement records, such as day-ahead schedules, real-time dispatch and metered energy, deviation quantities and published settlement prices. In practice, some EMS parameters may be incomplete, delayed or subject to confidentiality constraints. In such cases, the framework can still be applied in a “data-available” manner by (i) conducting the diagnosis at an aggregated participant-group level, (ii) using proxy indicators or simplified allocation bases when detailed measurements are unavailable and (iii) performing scenario-based sensitivity checks to assess the robustness of the conclusions. In addition, basic data cleaning and outlier screening can be adopted to mitigate the influence of noisy or abnormal EMS records on settlement diagnosis. Nevertheless, the accuracy of fine-grained attribution and participant-level diagnosis may be limited by data availability and quality, which remains an important direction for future work.

2. Materials and Methods

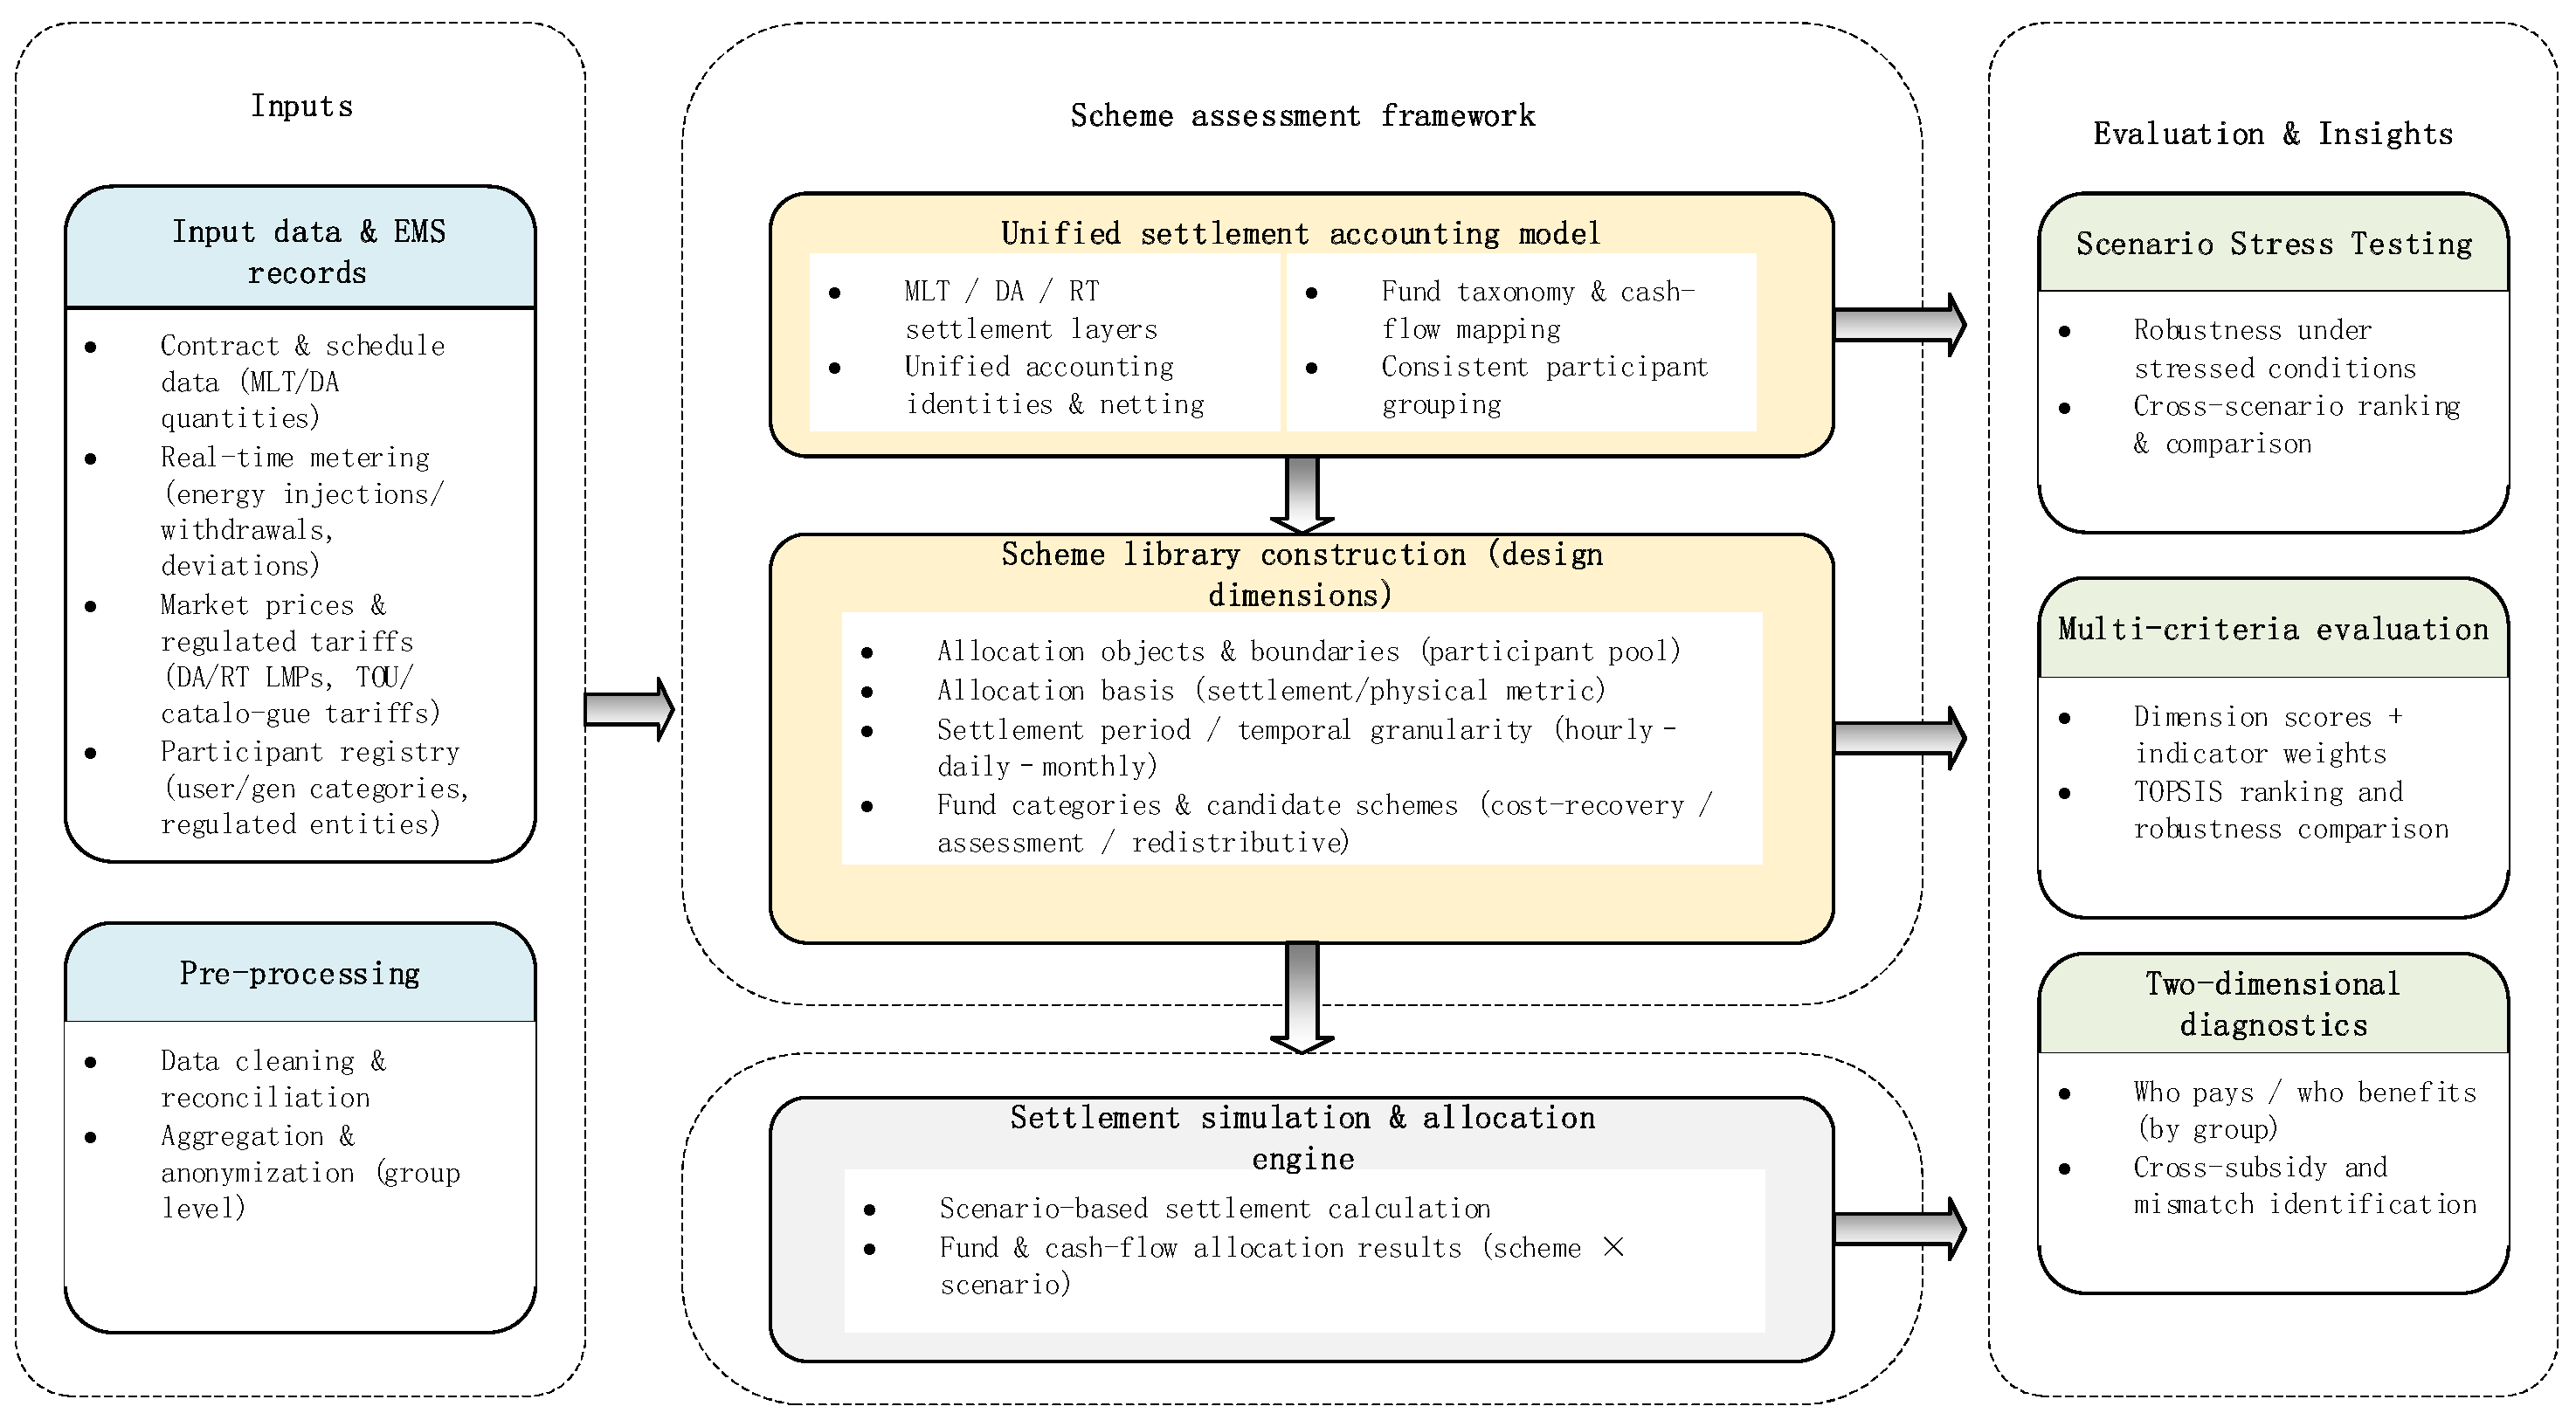
Figure 1 summarizes the EMS-oriented multi-scenario assessment workflow proposed in this paper, including the input datasets, unified settlement accounting, scheme-library construction, settlement simulation and allocation engine, and the evaluation and diagnostic modules used to compare alternative mechanisms.

2.1. Market Framework and Imbalance Funds

In this study, we consider a provincial-level electricity market in China where mid- to long-term (MLT) contracts and spot trading are jointly implemented under a dual-track structure [2,20]. Most physical demand is covered ex ante by a portfolio of regulated or semi-regulated priority contracts and market-based MLT contracts, while a smaller but growing share of energy is traded through the spot market to reveal short-term marginal costs and support efficient dispatch. In the dispatch and settlement process, “in-the-market” transactions (spot trades and market-based contracts) coexist with “out-of-the-market” arrangements (legacy regulated contracts, administrative dispatch and compensation schemes), which inevitably generates residuals between system-level revenues and expenditures. These residuals are managed as imbalance funds at the provincial level and must be allocated ex post to market participants.
The provincial market operator runs a two-settlement system. In the forward stage, MLT contracts specify contracted quantities and prices between generators, retailers and large consumers over daily to annual horizons [2,12,20]. In the spot stage, a security-constrained economic dispatch (SCED) co-optimizes generation output subject to network constraints and produces locational or zonal spot prices for each settlement interval. A preliminary settlement is then performed at spot prices for all in-the-market energy volumes, while contract positions are settled at contracted prices. The coexistence and interaction of these two settlement tracks, together with compensation and assessment schemes defined by regulation, lead to multiple categories of imbalance funds that are not directly assigned to individual agents by the basic energy settlement.
To represent this environment, we group market participants into a finite set of agent categories A , including thermal generators (coal- and gas-fired units), renewable generators (wind and solar), storage units and several user groups (e.g., large industrial, general commercial and other consumers). For each agent a ∈ A and settlement interval t ∈ T , the model keeps track of contracted quantities, spot trades and actual metered injections or withdrawals. At the system level, we denote by p t n the spot price at node or zone n, and by P a , t the net energy cleared for agent a in interval t. Detailed unit commitment and network modelling are abstracted into the SCED block; the present work focuses on how the residual imbalance funds created by the dual-track structure and ancillary settlement rules are measured and subsequently allocated across agent groups.
In practice, some market entities operate hybrid portfolios that combine renewable generation with flexible thermal units as backup to cope with renewable variability driven by environmental factors. In our framework, such entities can be treated as an aggregated portfolio agent (i.e., a separate participant category) and analysed based on their net injections/withdrawals, deviations and settlement outcomes. This portfolio-level representation preserves the applicability of the proposed settlement diagnosis even when unit-level attribution within the entity is not fully observable.
In such a portfolio-level representation, the relevant quantities (e.g., scheduled energy, metered energy and deviations) are computed using the net position of the entity by aggregating across its owned units. This enables a consistent settlement accounting and a practical diagnosis of fund flows even when internal unit-level attribution within the entity is not fully disclosed.
Following empirical studies on China’s dual-track electricity markets, imbalance funds are classified into several representative categories: dual-track unbalanced funds, generation–consumption imbalance funds, congestion-related imbalance funds, low-voltage and agency-user imbalance funds, and compensation and assessment funds [14,16,18,19,21,30]. This classification is broadly consistent with those used in provincial spot market pilots, while allowing for some aggregation of minor items for modelling tractability. Below, we define each fund category at the system level and outline its implementation in a typical provincial pilot; detailed engineering formulas used in the case study follow the logic in the Guangdong-style settlement rules and are summarized in Supplementary S1.
(1)
Dual-track unbalanced funds.
Dual-track unbalanced funds arise from price and quantity differences between the regulated track and the market track in a command–market dual system. In simplified terms, let Q t reg denote the priority or catalogue-based energy volume in interval t, settled at a regulated price P t reg , and let P t spot denote the corresponding spot price at the relevant node or zone. A first-level representation of the dual-track unbalanced fund in interval t is
F t DT = P t reg P t spot Q t reg ,
so that the total dual-track fund over the settlement horizon is F DT = t T F t DT .
In a practical provincial implementation, priority generators and priority users are further distinguished from market-based entities, and two structural cases are considered depending on whether priority generation exceeds priority consumption or vice versa. In each case, the regulator first constructs the “theoretical” settlement that would occur if priority generation and priority consumption were fully matched at regulated tariffs, then computes the “actual” settlement in which the mismatch is bridged by market purchases or sales at spot prices. The dual-track unbalanced fund is obtained as the difference between user-side and generator-side settlement under this dual structure.
(2)
Generation–consumption imbalance funds.
Generation–consumption imbalance funds reflect residual differences between the total settlement revenue of generators and the total settlement payments of market users, across the MLT, day-ahead and real-time markets, under the condition that aggregate physical generation equals aggregate physical consumption. Formally, the generation–consumption imbalance fund over the settlement horizon T is defined as
F G C = t T u U P u , t M L T + P u , t D A + P u , t R T g G R g , t M L T + R g , t D A + R g , t R T ,
where P u , t M L T , P u , t D A , P u , t R T denote the payments of user u in interval t in the MLT/DA/RT layers, and R g , t M L T , R g , t D A , R g , t R T denote the corresponding revenues of generator g.
In the Guangdong-type rules, this is implemented by (i) settling generators at their cleared volumes and prices in the MLT, day-ahead and real-time markets, including deviation volumes; (ii) settling users at their contracted, declared and actual consumption volumes with the corresponding prices; and (iii) taking the net difference between total user payments and generator revenues as the generation–consumption imbalance fund [19,20].
(3)
Congestion-related imbalance funds.
Congestion-related imbalance funds are generated when network constraints cause locational or zonal price differences, leading to congestion rents that are not fully assigned through basic energy settlement [11,16,31]. In a nodal pricing setting, the congestion surplus in interval t can be written as
F t CS = n p t n P t n p t ref n P t n ,
where P t n denotes net injections at node n and p t ref is a reference price. In the provincial pilot considered in this paper, congestion-related funds are computed separately for the day-ahead and real-time markets, based on the difference between generator-side nodal or zonal prices and a unified settlement price on the user side, after subtracting the contracted volumes of low-voltage and agency-purchase users from the generators’ contractual quantities. The total congestion-related imbalance fund is obtained by summing these day-ahead and real-time congestion charges over all generators and settlement intervals.
(4)
Low-voltage and agency-user imbalance funds.
Low-voltage users and agency-purchase users typically do not participate directly in the spot market and are settled at regulated catalogue tariffs [20,21].
A compact formulation is as follows. Let E u , t be the metered energy of user u at interval t, p τ ( t ) TOU the market-based time-of-use (TOU) tariff corresponding to time category τ ( t ) , and p u cat the regulated catalogue tariff. The agency-user and low-voltage-user imbalance funds can be expressed as
F AG = t T u U A G p τ ( t ) TOU p u cat E u , t ,
F LV = t T u U LV p τ ( t ) TOU p u cat E u , t ,
where U AG and U LV denote the sets of agency-purchase and low-voltage users, respectively. Positive values indicate additional cost under TOU-based theoretical settlement, while negative values indicate a net subsidy relative to catalogue tariffs.
For these users, imbalance funds are defined as the difference between a “theoretical” settlement at market-based time-of-use (TOU) prices, given their actual consumption and implicit contract positions, and the “actual” settlement at catalogue tariffs. In other words, the low-voltage-user and agency-user imbalance funds capture the cost or benefit of shielding these users from spot price fluctuations while serving them through a mix of priority and market-based supply. In the provincial implementation, the two user groups are treated separately, reflecting differences in tariff structures and regulatory objectives; their imbalance funds are then incorporated into the overall imbalance fund pool.
(5)
Compensation funds.
Compensation funds aggregate payments to generators or other resources for services that are not fully remunerated at spot energy prices [9,10,11]. In the pilot system studied here, they include, in particular, variable-cost compensation for units dispatched below their declared variable costs, start-up cost compensation for units that are committed but recover only part of their start-up costs from the spot market, running-cost compensation when energy revenues do not cover approved operating costs and peak–off-peak balancing funds in both energy tariffs and transmission and distribution tariffs.
Let S 1 denote the set of compensation items and C s , t the compensation amount for item s ∈ S 1 in interval t. The total compensation fund is
F CF = s S 1 t T C s , t ,
In the provincial rules, these C s , t values are computed from unit-level cost parameters, start-up status and operating schedules, and peak–off-peak price differentials; a compact description of the corresponding formulas is provided in Supplementary S1.
(6)
Assessment funds.
Assessment funds refer to charges and penalties related to regulatory or performance assessments, such as reliability obligations, adequacy tests, renewable integration targets and demand response performance [20,32,33]. Let S 2 denote the set of such assessment items, with A r , a representing the charge (possibly negative if it is a reward) applied to agent a under item r ∈ S 2 over the settlement horizon. The total assessment fund is
F AS = r S 2 a A A r , a ,
In provincial pilots, these assessment items are typically linked to policy objectives such as resource adequacy, demand-side participation and clean energy utilization.
Collecting the above, the vector of system-level imbalance funds is
F = F DT , F GC , F CS , F LV , F AU , F CF , F AS ,
where F LV and F AU denote low-voltage-user and agency-user imbalance funds respectively, and each component is determined endogenously by the dual-track settlement of contracts and spot trades, the SCED outcomes and the regulatory compensation and assessment schemes.
In accordance with the cost-causation or beneficiary-pays principles widely applied in electricity tariff and transmission cost allocation, agents that cause or benefit from a given imbalance fund category should bear a roughly commensurate share of that fund [34,35,36]. In this paper, the fund formation formulas above serve as inputs to a set of alternative allocation mechanisms defined in Section 2.2. These mechanisms combine different allocation objects (e.g., selected agent groups versus all participants), allocation bases (e.g., energy, capacity, deviation and benefit changes) and temporal granularities (hourly versus daily or monthly) into a family of imbalance settlement schemes that are consistent with physical cost-causation and beneficiary-pays principles and will be compared under multiple operating scenarios.

2.2. Settlement Mechanisms Under Comparison

2.2.1. Design Problem and Rights–Responsibilities Perspective

Section 2.1 has identified several categories of imbalance-related funds in the provincial dual-track market, including dual-track unbalanced funds, generation–consumption imbalance funds, congestion-related imbalance funds, low-voltage and agency-user imbalance funds, and compensation and assessment funds [16,18,30]. For the settlement design and case studies in this paper, we focus on those components that are explicitly allocated through settlement rules, namely variable-cost compensation, generation–load energy imbalance funds, congestion-related imbalance funds, start-up and operating compensation items, assessment funds and other redistributive funds.
In this subsection, we no longer focus on how the total amounts of these funds are generated at the system level, but on how they are allocated among generators and users under alternative settlement mechanisms.
The candidate allocation options for each fund category are not arbitrary [35,36]. They are derived from the physical rights–responsibilities analysis outlined in Section 2.1 and further elaborated in the market design. For example, variable-cost compensation is primarily justified by reliability and adequacy considerations and therefore naturally points to renewable units and users as beneficiaries; generation–load energy imbalance funds follow a “who gains from DA–RT price differences pays/receives” logic between DA and RT participants; congestion-related imbalance funds are linked to the use of scarce transmission capacity by particular generators and users. On this basis, the design problem can be summarized as choosing, for each fund category c, (i) which participant groups should bear or receive this fund; (ii) over which settlement period the fund should be calculated and allocated; and (iii) according to which physical or settlement basis the fund should be distributed. For completeness, we note that some fund categories may also involve additional implementation details, such as the definition of the allocation boundary/pool, netting rules, or caps and floors imposed by regulation. In this paper, these elements are treated either as part of the “allocation objects” dimension (e.g., changing the participant set/boundary) or as fixed market settings, so that the comparison can focus on the three core design dimensions in a consistent manner. Therefore, the proposed three-dimensional design space is applicable to all six fund categories, with category-specific differences reflected only in the feasible option sets and parameter ranges.
In the following, these three design dimensions are formalized, and a small library of representative settlement schemes is constructed for use in the case studies in Section 3.

2.2.2. Generic Design Dimensions: Objects, Period and Basis

(1)
Allocation objects (who pays/receives)
The first dimension specifies the set of participants that share or receive the fund in question. Depending on the fund category and the rights–responsibilities logic, the allocation objects may include (i) industrial and commercial users (direct-purchase, agency-purchase, premium users and other market users); (ii) renewable energy units and other market generators; (iii) non-market generators and policy-protected units; and (iv) combinations of DA market participants and RT market participants (e.g., DA generators + RT users; RT generators + DA users).
These objects correspond directly to the “allocation objects” menus in the detailed design and reflect different interpretations of “who benefits” and “who is responsible” for each fund category.
(2)
Settlement period (over which time window)
The second dimension specifies the time window over which the fund is calculated and allocated. Consistent with the original menus, three levels are considered: (i) hourly, which provides strong short-term signals but entails higher volatility; (ii) daily, which partially smooths intra-day fluctuations; and (iii) monthly, which is suitable for slow-varying, tariff-like adjustments and ex post balancing items.
In the notation used later, “–h”, “–d” and “–m” are used as suffixes to indicate hourly, daily and monthly settlement, respectively.
(3)
Allocation basis (according to what metric)
The third dimension specifies the physical or settlement quantity used as the proportional basis for allocating the fund [34,35]. Drawing from the design menus in Section 2.2.1 of the regulatory report, typical bases include (i) actual settled energy, possibly restricted to constrained periods; (ii) DA cleared energy or long-term contract energy; (iii) DA declared demand or monthly declared quantities; (iv) DA positive deviations and RT positive deviations; (v) congestion-related weighted energy, e.g., actual settled energy multiplied by max{uniform price − nodal price, 0}; and (vi) energy during specific periods, such as start-up/shutdown periods or constraint-binding periods.
Different choices on this dimension translate the rights–responsibilities analysis into concrete allocation rules: for instance, using DA positive deviations emphasizes controllable planning errors, whereas using RT energy with congestion weights reflects the use of scarce network capacity.

2.2.3. Candidate Options by Fund Category and Representative Schemes

Based on the three generic dimensions above, the current market design provides, for each fund category, a menu of candidate options for allocation objects, settlement periods and bases [19,20,30]. Table 1 summarizes these menus in a compact way and indicates which combinations are selected as representative schemes in this paper.
In the numerical case studies, a subset of these options is selected for detailed comparison, focusing on variable-cost and operating compensation (Section 3.2), assessment funds (Section 3.3) and redistributive funds including congestion-related and other surplus funds (Section 3.4). For each of these categories, several representative combinations of objects, period and basis are implemented as specific schemes (such as “users-only, RT energy” and “DA-deviation-based” schemes) and evaluated using the multi-criteria and diagnostic framework described in Section 2.3. To keep the main text concise, the detailed engineering settlement formulas for each imbalance-fund category are provided in Supplementary S1.

2.3. Evaluation and Diagnostic Methods

This section introduces the methods used to evaluate and diagnose alternative imbalance settlement schemes [23,24]. It has two components:
(i)
A multi-criteria evaluation that scores each scheme along four dimensions and aggregates them with TOPSIS;
(ii)
A two-dimensional diagnostic that examines the consistency between fund flows and physical responsibilities.

2.3.1. Evaluation Dimensions and Indicators

Each scheme is evaluated along four first-level dimensions [23,24,26]:
(i)
Fairness ( D F ): alignment between who pays and who benefits; dispersion of burdens within and across groups.
(ii)
Economic efficiency ( D E ): cost-reflectiveness of price signals and avoidance of unnecessary cross-subsidies and distortions.
(iii)
Security/robustness ( D S ): stability of revenues and charges across scenarios, and contribution to adequacy and operational security [25,26].
(iv)
Development orientation ( D D ): consistency with long-term goals such as renewable integration, flexibility provision and demand response.
Each dimension is supported by several second-level indicators (e.g., burden dispersion, revenue volatility, curtailment-related penalties and flexibility incentives). All indicators are converted to benefit-type form, meaning that larger values always represent better performance after transformation.

2.3.2. Normalization and Dimension Scores

Let x i , j be the raw value of indicator j for scheme i. All benefit-type indicators are normalized to [0, 1] using min–max normalization:
z i , j = x i , j min i x i , j max i x i , j min i x i , j + ε ,
where ε > 0 is a small constant to avoid division by zero when the range is very narrow.
For each dimension d { F , E , S , D } , with indicator set J d and weights w j (satisfying j J d w j = 1 ), the dimension score of scheme i   is
D i ( d ) = j J d w j z i , j ,
The four scores form a performance vector
D i = D i ( F ) , D i ( E ) , D i ( S ) , D i ( D ) ,
which provides the basis for the multi-dimensional tables in Section 3.

2.3.3. TOPSIS Aggregation

To obtain an overall score, a standard TOPSIS aggregation is applied to D i . For each dimension d, define the ideal and negative-ideal values as
D max ( d ) = max i D i ( d ) , D min ( d ) = min i D i ( d ) ,
The distances of scheme i to the ideal and negative-ideal points are
d i + = d D i ( d ) D max ( d ) 2 , d i = d D i ( d ) D min ( d ) 2 ,
The closeness coefficient is then
C i * = d i d i + + d i , C i * [ 0 , 1 ] ,
A larger C i * means better overall performance. The C * values reported in Section 3 are computed in this way. The full indicator hierarchy and weighting details are provided in Supplementary S2.

2.3.4. Two-Dimensional Diagnostic of Fund Allocation

To see who pays and who benefits by fund category, a two-dimensional diagnostic is used.
Let F c , g be the net monthly cash flow of fund category c for participant group g under a given scheme (negative = net payer; positive = net beneficiary). Let B c , g 0 be a proxy for the corresponding responsibility or benefit (e.g., energy, deviations, capacity contributions and flexibility).
We normalize them into distributions:
F ˜ c , g = F c , g g F c , g + ε , B ˜ c , g = B c , g g B c , g + ε ,
where ε > 0 again avoids division by zero.
The directional matching index between payments and responsibilities for fund c is defined as
η c = g F ˜ c , g B ˜ c , g g F ˜ c , g 2 g B ˜ c , g 2 , η c [ 0 , 1 ] ,
This index is essentially the cosine similarity between the two distributions; a larger η c means better alignment between “who pays” and “who should pay”.
For completeness, two mismatch measures are also considered:
δ c = 1 2 g F ˜ c , g B ˜ c , g , γ c = max g F ˜ c , g B ˜ c , g ,
Here, δ c measures the overall difference between the two distributions, and γ c captures the worst-case mismatch for a single group. In the case studies, these indices are used qualitatively to flag fund categories and participant groups where rights–responsibilities alignment is poor or where extreme outliers appear.

2.3.5. Diagnostic-Guided Scheme Adjustment

In practice, the above indices are used in an iterative design loop:
  • Start from a candidate scheme, defined by a choice of allocation objects, bases, boundaries and temporal granularity.
  • Evaluate the scheme under multiple scenarios using the four dimension scores: the TOPSIS coefficient C * and the diagnostic indices η c , δ c and γ c .
  • Adjust scheme dimensions when diagnostics reveal clear mismatches, for example:
    (i)
    Changing allocation objects or boundaries for a given fund category;
    (ii)
    Moving from actual-energy allocation to deviation-based or DA-based allocation;
    (iii)
    Coarsening temporal granularity to reduce volatility and extreme burdens.
  • Re-evaluate until both the overall scores and the diagnostic indices are satisfactory.
The “corrected schemes” highlighted in Section 3, such as S12-h for running-cost compensation and S33-h for assessment funds, are obtained conceptually by such diagnostic-guided adjustments starting from simpler S11/S21/S31-type schemes. The full indicator hierarchy, third-level indicator definitions and the illustrative weighting procedure are summarized in Supplementary S2.

3. Results

3.1. Case Study Setup and Scenario Design

The case study is based on a provincial dual-track electricity market in which long-term contracts and spot trading coexist. The system includes multiple types of generation units—coal, gas, hydro, renewable and storage units—as well as a diversified user portfolio composed of direct-purchase industrial and commercial users, agency-purchase users, premium users and other retail customers. In practice, the market already implements a dual-track pricing framework and several imbalance-related funds as described in Section 2.1, but the detailed allocation rules are still under refinement.
To protect confidential information while preserving the essential characteristics of the market, the original operational data are anonymized and moderately aggregated. Generators are grouped into a limited number of representative units by technology type and location; users are grouped into several categories according to access mode and typical load profile. Load, renewable output and network constraints are taken from a typical operating month of the provincial system and then slightly scaled and adjusted so that different stress conditions can be represented in a controlled way. All monetary results in Section 3 are reported in per-unit or relative form, rather than in actual currency units.
Among the six major imbalance-related fund categories identified in Section 2.1, three representative categories are selected for detailed case studies: (i) variable-cost and operating compensation funds, representing cost-recovery type mechanisms; (ii) assessment funds, representing penalty and reward mechanisms linked to deviations and performance; and (iii) redistributive funds, including congestion-related items and other surplus/deficit funds that are recycled to users and generators. The remaining categories are still present in the background calculations but are not analysed individually in this section.
From the perspective of the settlement mechanisms, several representative schemes are drawn from the mechanism library in Section 2.2 (Table 1). For variable-cost and operating compensation funds, user-only schemes, deviation-based schemes and schemes that allocate part of the funds to renewable units are considered. For assessment funds, both real-time-responsibility and day-ahead-responsibility schemes are included. For redistributive funds, user-only and “users + generators” redistribution schemes are compared. Section 3.2 focuses on variable-cost and operating compensation funds, Section 3.3 on assessment funds, and Section 3.4 on redistributive funds. Section 3.5 then summarizes cross-category patterns and policy implications.

3.1.1. Data and Mechanism Portfolio

Case-study inputs are derived from anonymized historical EMS and settlement records from a provincial power grid in China (baseline month). These real-world records provide day-ahead schedules, real-time dispatch, metered injections/withdrawals and published clearing prices. Using these inputs, we conduct a data-driven offline “replay” to compute ex post settlements under alternative mechanisms. Therefore, the case study represents an offline evaluation based on empirical data rather than a live deployment in market operation. The datasets are obtained under an ongoing research project in collaboration with industry partners and are used here for methodological evaluation.
The underlying simulation platform reconstructs the day-ahead (DA) and real-time (RT) market outcomes of the provincial dual-track system. DA schedules and prices are derived from a security-constrained unit commitment model with uniform pricing at the provincial clearing point, while RT adjustments are obtained from a simplified real-time dispatch model that reflects load and renewable deviations, transmission congestion and reserve requirements. Based on these outcomes, the six major categories of imbalance-related funds defined in Section 2.1—dual-track unbalanced funds, generation–consumption imbalance funds, congestion-related imbalance funds, low-voltage and agency-user imbalance funds, compensation items and assessment items—are calculated at the system level for the baseline month.
On top of this baseline, several settlement schemes are implemented for comparison. For variable-cost and operating compensation funds, the schemes include (i) user-only allocation based on real-time settled energy (S11-h type); (ii) deviation-based allocation that shares part of the burden with generators according to positive deviations (S12-h type); and (iii) schemes that partially allocate the funds to renewable units together with users (S21-h type). For assessment funds, a real-time-responsibility scheme (S31-h type) and a day-ahead-responsibility scheme (S33-h type) are considered. For redistributive funds such as congestion-related surpluses and peak–valley balancing items, a user-only redistribution scheme (B0 type) and a “users + generators” redistribution scheme (B1 type) are compared.
All schemes share the same underlying market clearing results and fund totals; they differ only in how each fund category is allocated across participant groups, settlement periods and allocation bases, as formalized in Section 2.2. This design makes it possible to attribute differences in performance purely to settlement rules, rather than to changes in system operation.

3.1.2. Scenario Design

To reflect the diversity of operating conditions in a provincial dual-track market, four representative scenarios are constructed on the basis of the historical month:
Scenario N1—normal operation: Demand and renewable output follow their typical profiles; transmission constraints are occasionally binding but do not dominate system operation.
Scenario N2—tight supply and high peak load: Peak demand is increased, and several thermal units are temporarily unavailable, leading to higher DA and RT prices, more frequent reserve shortages and a stronger role of high-cost gas units.
Scenario N3—high renewable penetration and volatility: Renewable installed capacity and forecast errors are scaled up, resulting in larger DA–RT deviations, more frequent redispatch and curtailment episodes, and higher volatility of imbalance-related funds.
Scenario N4—congestion and boundary shock in redistributive funds: Several key transmission corridors are heavily loaded due to non-market generation and contract flows, so that congestion-related imbalance funds become more prominent; at the same time, the allocation boundary of the redistributive fund pool is exogenously expanded or contracted (for example, from “users only” to “users + generators” or vice versa), while keeping the total fund amount essentially unchanged. This allows us to examine how cross-subsidies flip when the set of participants inside the pool changes.
For each scenario, the DA/RT market models are run over the full month, and all imbalance-related funds are recalculated. The alternative settlement schemes described above are then applied to each scenario, producing a multi-scenario dataset of cash flows by fund category and participant group.

3.1.3. Evaluation Workflow

The evaluation workflow follows the framework in Section 2.3. For each scheme and each scenario, the cash flows of all fund categories are aggregated at the level of participant groups (generators by technology class, users by access mode). On this basis, the four evaluation dimensions—fairness, economic efficiency, security/robustness and development orientation—are quantified using the selected second-level indicators. After min–max normalization, dimension scores D i ( F ) , D i ( E ) , D i ( S ) and D i ( D ) are obtained for each scheme i , and an overall TOPSIS score C i * is computed.
In parallel, the two-dimensional diagnostic indices in Section 2.3 are applied to key fund categories. For each fund c , the distributions of payments and responsibilities across participant groups are compared through the directional matching index η c and the mismatch indices δ c and γ c . These diagnostics highlight categories and groups where “who pays” deviates significantly from “who should pay” in physical terms, or where extreme outliers appear.
Finally, the evaluation results are synthesized in a comparative way: Section 3.2 focuses on variable-cost and operating compensation funds, Section 3.3 on assessment funds, and Section 3.4 on redistributive funds. Within each section, the quantitative evaluation (dimension scores and TOPSIS ranking) is combined with the fund-flow diagnostics to identify the strengths, weaknesses and possible corrections of each scheme; Section 3.5 summarizes the cross-case patterns and policy implications.

3.2. Comparison of Running-Cost Compensation Schemes in the Baseline Scenario

This subsection compares alternative settlement schemes for the running-cost compensation fund in the baseline month. The focus is on how different allocation objects and bases affect the distribution of burdens across user groups and generators, and how these differences translate into fairness–efficiency trade-offs and rights–responsibilities alignment. This evaluation is conducted in an offline replay setting using empirical EMS/settlement records, rather than on-line implementation in the operational system.

3.2.1. Scheme Descriptions and Fund Totals

Three representative settlement schemes are considered for the running-cost compensation fund:
S21-h—users + generators, hourly energy basis: The fund is allocated to all industrial and commercial users (including direct-purchase, agency-purchase and other industrial/commercial users) and all generators, in proportion to their hourly actual settled energy. This corresponds to a broad “beneficiary pool” on both sides of the market, with an hourly settlement period and an actual-energy basis.
S11-h—user-only, hourly energy basis: The fund is allocated only to load-side market participants, i.e., the three industrial/commercial user groups, in proportion to their hourly actual settled energy. Generators do not directly share the burden. This represents a pure user-side cost recovery scheme, again with hourly settlement and an actual-energy basis.
S12-h—users + deviating generators, deviation-based allocation: The fund is allocated partly to users and partly to generators. On the user side, industrial and commercial users bear a substantial share of the fund, similar to S11-h; on the generation side, units with positive deviations (actual output exceeding day-ahead schedules) share part of the burden, using a combined basis of actual energy and positive deviations. The settlement period remains hourly.

3.2.2. Distributional Impacts by User Group

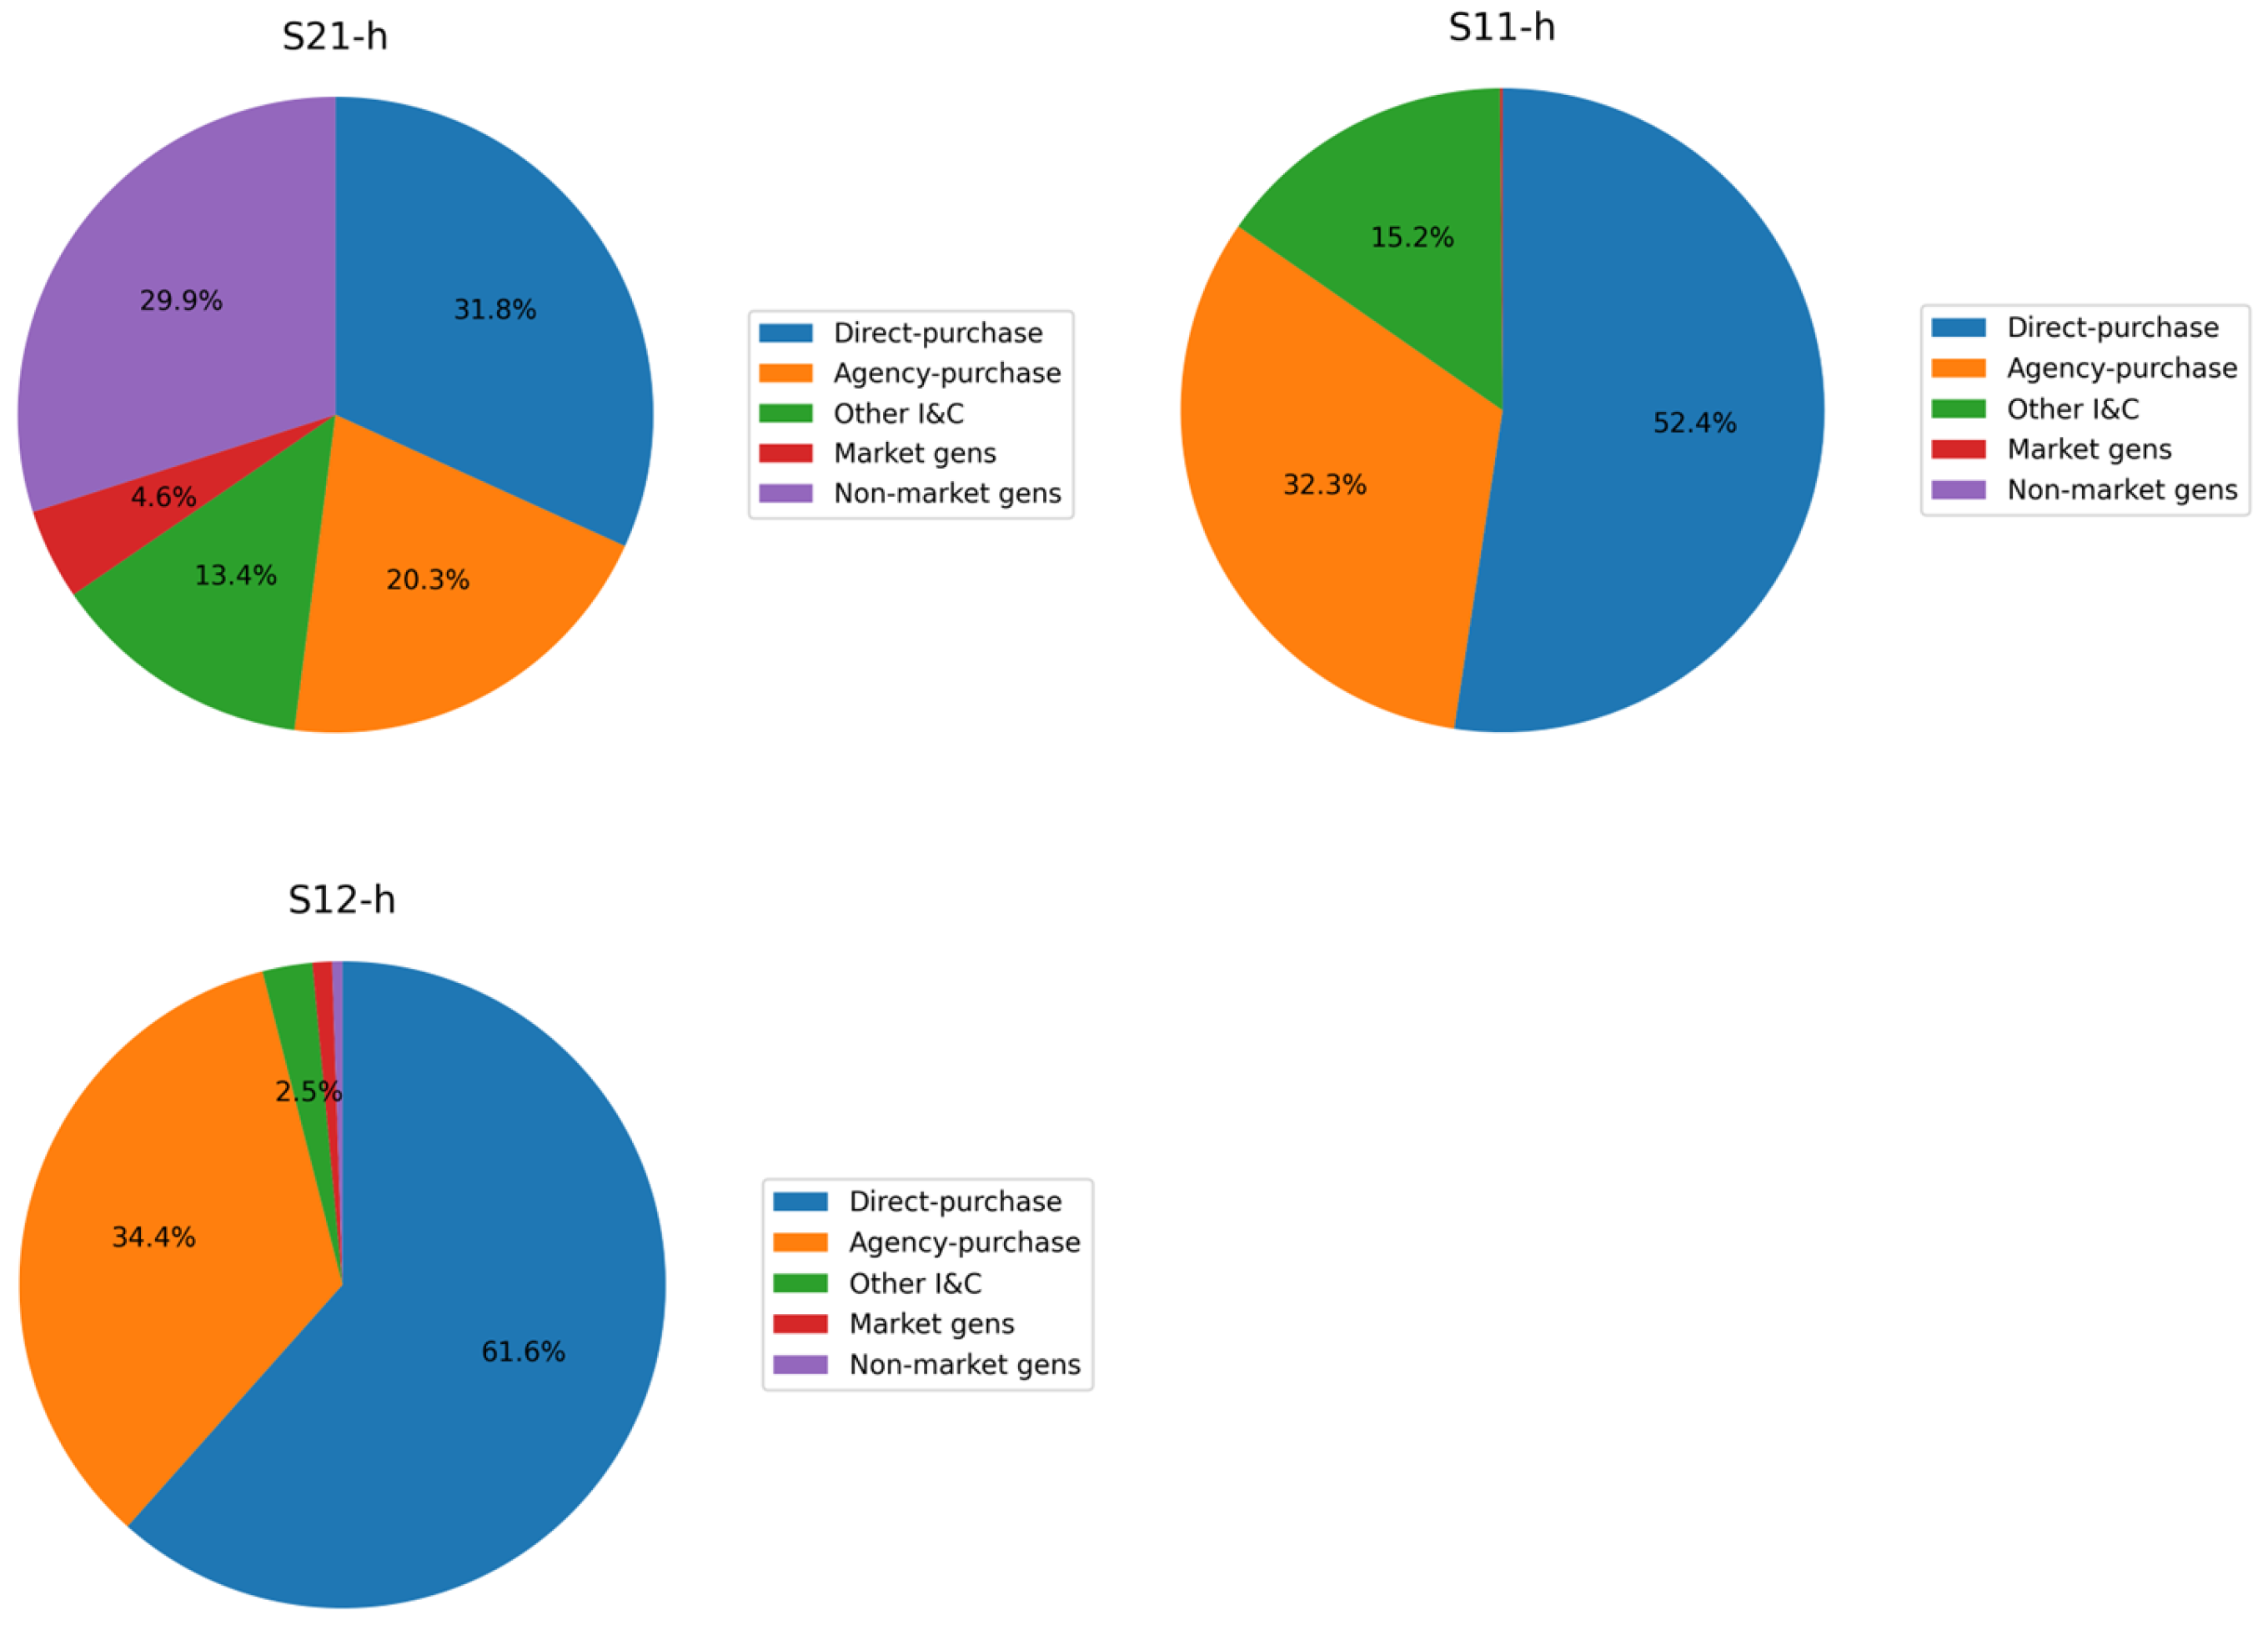
Figure 2 (pie-chart views) indicates that the broad-pool scheme S21-h leads to the most even distribution of the running-cost compensation fund across the four main groups (direct-purchase users, agency-purchase users, other industrial and commercial users, and generators). The burden on direct-purchase and agency-purchase users remains moderate, while a non-negligible share is borne by generators, consistent with the interpretation that they benefit from the availability of high-cost units and the resulting adequacy.
In quantitative terms, S21-h allocates 65.5% of the running-cost compensation fund to user-side groups (31.8% direct-purchase, 20.3% agency-purchase and 13.4% other industrial/commercial users) and the remaining 34.5% to generators (4.6% market and 29.9% non-market units). By contrast, S11-h shifts the burden almost entirely to users (≈100%), while S12-h still maintains a small but non-zero generator-side participation (about 1.5%).
Under S11-h, the entire running-cost compensation fund is shifted to the user side, with the three industrial and commercial user groups bearing the full amount in proportion to their hourly actual energy. Relative to S21-h, the total burden of each user group increases by roughly 60% (i.e., close to a factor of 1.6), while generators’ direct burden falls to zero (see Supplementary Table S1 for detailed numerical results). This design strengthens the “beneficiary-pays” principle on the user side but weakens the explicit contribution of generation units.
S12-h lies between these two extremes. Compared with S11-h, a portion of the fund is redirected to generators with positive deviations, so that generators as a whole bear a non-zero share of the burden. At the same time, users still contribute the majority, and their absolute contributions are only slightly lower than in S11-h. From a static distributional perspective, S12-h is more concentrated on users than S21-h, but slightly less so than S11-h.
Overall, the pie-chart representation in Figure 2 provides an intuitive comparison of the allocation structure across the three schemes: S21-h spreads the burden across both sides of the market, S11-h shifts nearly the entire burden to users and S12-h introduces a modest but visible participation of generators in cost recovery while keeping the user-side burden high.

3.2.3. Rights–Responsibilities Diagnostics

Beyond aggregate amounts by group, the rights–responsibilities perspective requires examining whether “who pays” aligns with “who benefits” or “who causes the need for compensation”. From Section 2.2, running-cost compensation is mainly justified by adequacy and reliability benefits provided by high-cost units (e.g., gas-fired plants) to the system as a whole, particularly to load-side participants and variable renewable generators.
At the level of broad participant groups, S21-h best reflects this view: both users and generators contribute, and the burden is relatively balanced among user groups. However, the share borne by generators is proportional to their actual energy, rather than to their adequacy contribution or ramping capability, so the match to physical responsibility is still imperfect.
Under S11-h, the rights–responsibilities balance is clearly tilted towards the load side. The running-cost compensation is treated as a pure tariff-like uplift on user energy, with no direct charge on generators. This is consistent with an interpretation that users are the ultimate beneficiaries of adequacy, but it underplays the role of renewable generators, who also benefit from the availability of flexible backup units.
S12-h introduces an explicit dependence on positive deviations. At a coarse level (by group), this means that some portion of the fund is borne by generators whose actual output exceeds day-ahead schedules, reflecting their contribution to flexibility and adequacy. At a finer level (by individual unit or user), the two-dimensional diagnostic matrix (“fund category × participant group”) introduced in Section 2.3 shows that, under S12-h, the running-cost compensation row remains concentrated on users but exhibits higher variance across generators with significant deviations. This indicates a stronger deviation-based incentive than S11-h and a closer, though still imperfect, link to the physical causes of flexibility needs.
Table 2 further quantifies the within-load distribution on the user side: under S11-h, the normalized shares are 0.50 (direct-purchase), 0.30 (agency-purchase) and 0.20 (other I and C), whereas under S12-h they become 0.46, 0.32 and 0.22, respectively. This indicates a modest rebalancing within the user side—direct-purchase users’ share decreases by 0.04, while agency-purchase and other I and C users increase by 0.02 each.

3.2.4. Multi-Criteria Evaluation and Preliminary Conclusions

Using the evaluation framework in Section 2.3, the three schemes are compared along four dimensions—fairness, economic efficiency, security/robustness and development orientation—and aggregated into a TOPSIS closeness coefficient C i * .
First, from the fairness perspective, S21-h performs best among the three. The burden dispersion indicators show relatively low variance across user groups, and the gap between users and generators is moderate. S11-h shows higher dispersion across user groups because all costs are concentrated on the load side; S12-h slightly improves over S11-h by introducing a non-zero generator contribution, but remains less balanced than S21-h.
Second, from the economic-efficiency perspective, S11-h has some advantages. Concentrating the running-cost compensation on users can be interpreted as a more transparent uplift to user prices, avoiding distortions to generator bidding behaviour. In contrast, S21-h and S12-h partly blur the boundary between energy-market revenues and compensation, which may weaken price signals for high-cost units and for investor decisions. Under the current parameterization, S11-h achieves the highest economic-efficiency score among the three.
Third, in terms of security and robustness, the three schemes are similar, because they share the same underlying adequacy and system operation. However, S21-h tends to exhibit slightly lower volatility of individual participants’ net payments across scenarios, due to the broader burden-sharing, while S11-h and S12-h produce more concentrated swings on the user side.
From the development-orientation perspective, S12-h is marginally preferred. By making running-cost compensation partially dependent on positive deviations and generator behaviour, it provides a clearer signal to flexible units and renewable generators about their role in adequacy and system balancing. S21-h is more neutral in this regard, and S11-h places the entire emphasis on the user side.
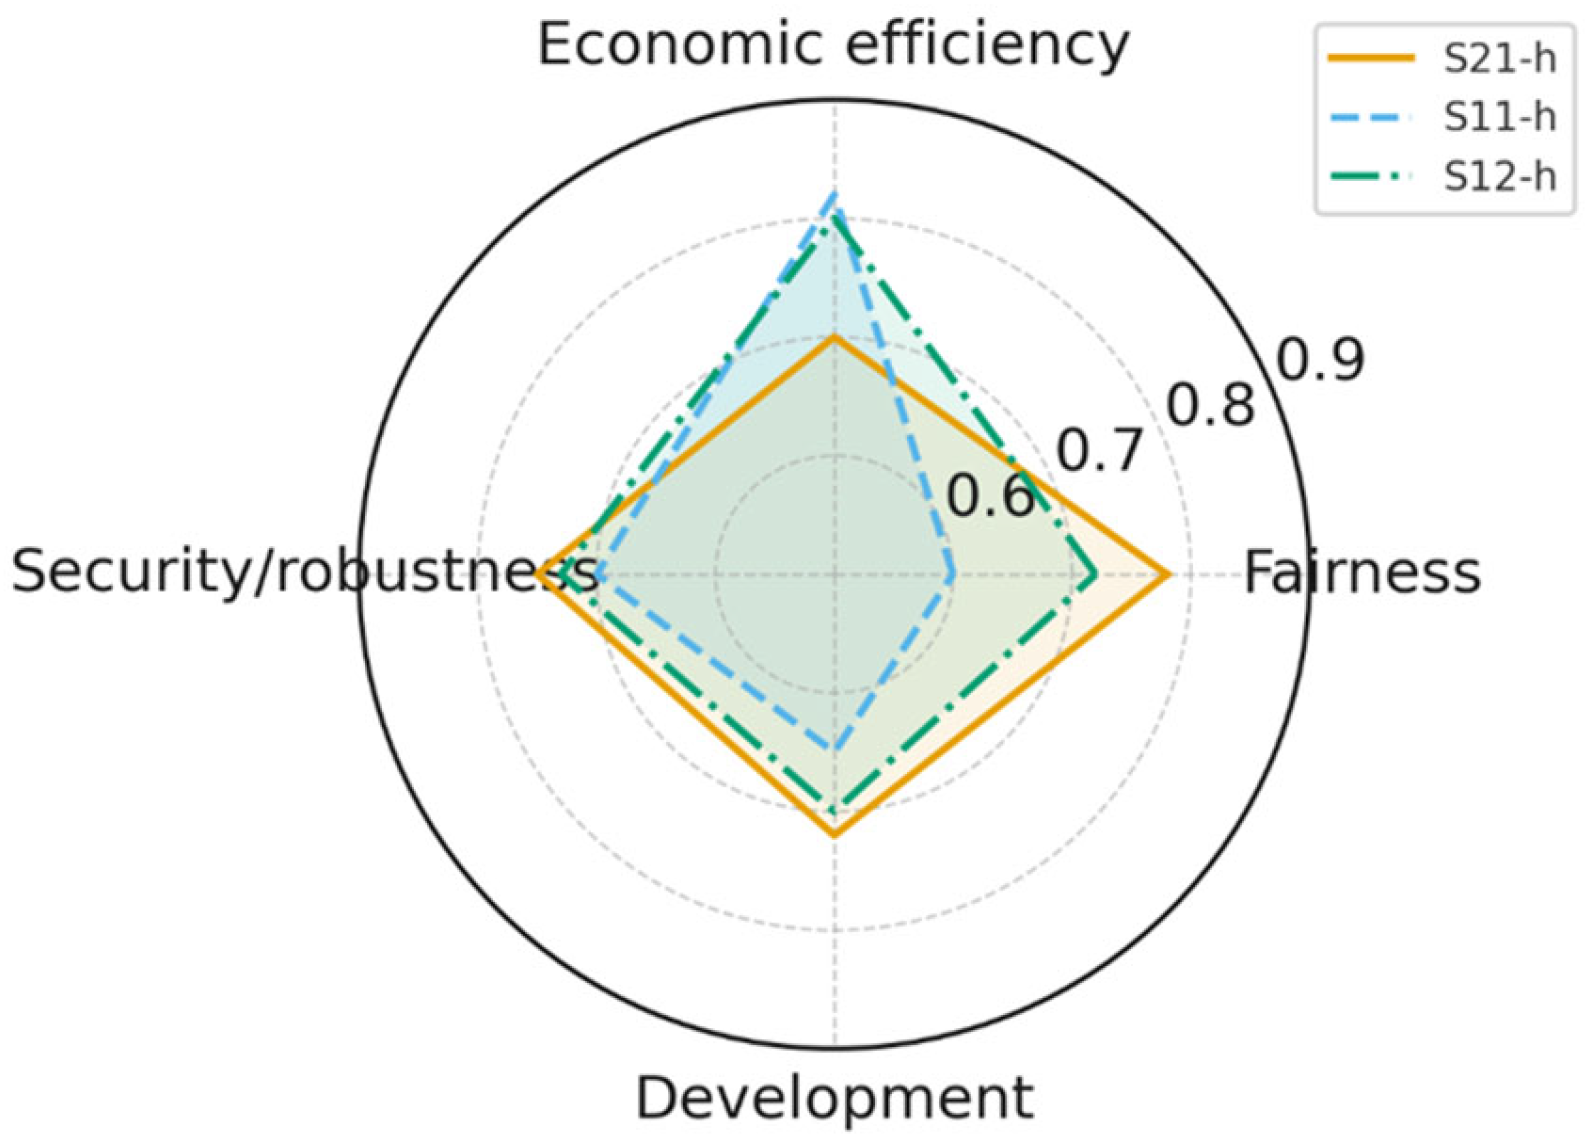
These trade-offs are visualized in Figure 3, which plots the four normalized scores for S21-h, S11-h and S12-h. The corresponding illustrative normalized scores (values in [0, 1]; higher is better) and the TOPSIS closeness coefficients are reported in Supplementary Table S2. In the baseline scenario, S21-h achieves the highest fairness score, S11-h the highest economic-efficiency score, and S12-h a balanced intermediate performance. The overall TOPSIS ranking typically places S12-h slightly ahead of the other two schemes, reflecting its compromise between fairness and efficiency and its better alignment with the rights–responsibilities logic for running-cost compensation.
From a practical standpoint, these results suggest that a pure user-side scheme such as S11-h is attractive from a short-term efficiency perspective but may raise fairness concerns and weaken behavioural signals on the generation side; a broad-pool scheme such as S21-h improves fairness but may blunt cost-reflective price signals; and a deviation-based mixed scheme such as S12-h offers a promising compromise, especially when embedded in a broader EMS-oriented design that explicitly values flexibility and adequacy contributions.

3.3. Case Study 2: Assessment Funds Under Alternative Schemes and Scenarios

3.3.1. Problem Description and Selected Schemes

Similar to running-cost compensation in Section 3.2, assessment funds are another key component of imbalance-related funds. They are designed to penalize excessive deviations and non-compliant behaviours, and to reward resources that help reduce imbalances. In the provincial dual-track market, assessment funds are mainly linked to the following:
(i)
Deviations between mid–long-term (MLT)/day-ahead (DA) contract quantities and real-time metered injections or withdrawals;
(ii)
Violations of dispatch instructions and performance requirements; and
(iii)
Imbalance charges and related rewards.
In the baseline month, the total assessment fund (net of rewards) is on the order of several tens of millions of CNY, and its allocation strongly affects the risk borne by generators and users in the real-time market. From an EMS-oriented perspective, assessment funds shape the incentives for accurate forecasting, disciplined execution of dispatch instructions and active participation in balancing actions.
To examine how different settlement schemes affect the distribution of assessment funds, we focus on three representative schemes from Section 2.2.3:
S31-h: market generators + industrial users, allocated by hourly actual settled energy (or deviations derived from it);
S11-h: load-side participants only, allocated by hourly actual consumption;
S33-h: market generators + industrial users, allocated by day-ahead cleared energy (or DA deviations).
These three schemes represent, respectively, a real-time responsibility scheme (S31-h), a load-only scheme (S11-h) and a DA-plan-based scheme (S33-h).

3.3.2. Baseline Scenario: Group-Level Redistribution

In order to keep the presentation consistent with Section 3.2, we first examine the group-level allocation of assessment funds in the baseline month. The detailed numerical allocations (in million CNY) under S31-h, S11-h and S33-h are reported in Supplementary Table S3. For comparability, the total assessment fund is fixed at CNY 68.4 million under all three schemes; only the allocation objects and bases change.
Several main patterns can be observed. Under S31-h, generators (market + non-market) and user groups share the assessment fund in a relatively balanced manner, reflecting a real-time responsibility view in which both sides are directly exposed to deviation-related charges (see Supplementary Table S3 for numerical details). Under S11-h, generators are removed from the allocation pool and the entire CNY 68.4 million is borne by the three user groups, reflecting a strong “user-pays” orientation. This sharpened demand-side signal may improve short-term economic efficiency but clearly shifts the rights–responsibilities balance towards the load side. Under S33-h, both generators and users contribute, but the burden is shifted towards day-ahead (DA) plan-related responsibility: generators pay slightly less than under S31-h, while direct-purchase and other users pay slightly more, reflecting larger DA schedule errors on the load side in the baseline month. From a rights–responsibilities perspective, S33-h reallocates part of the responsibility from purely real-time deviations to DA planning quality, which is often easier to manage with EMS tools and forecasting systems.
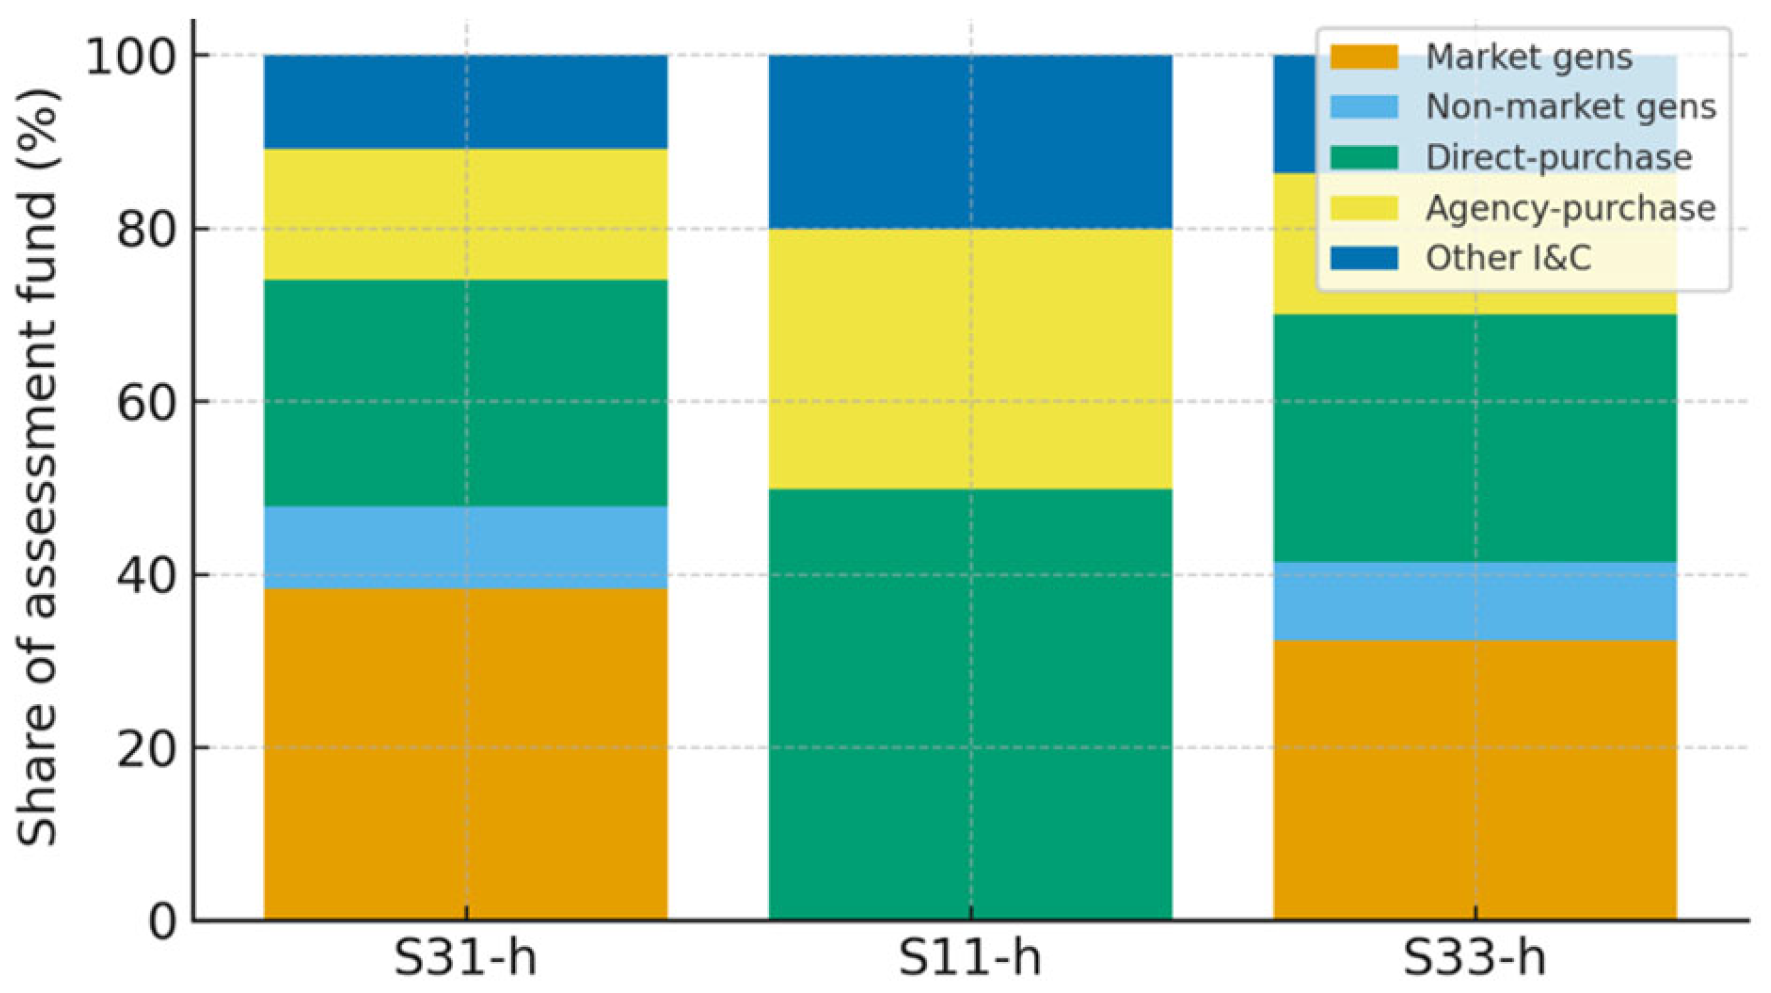
Figure 4 provides an intuitive comparison in relative terms by plotting the percentage share of assessment funds borne by each participant group under the three schemes. The stacked bars highlight the shift of responsibility from generators to users when moving from S31-h to S11-h, and the intermediate pattern under S33-h.

3.3.3. Behaviour Under Supply-Tight and Price-Volatility Scenarios

Assessment funds are particularly sensitive to supply-tight and price-volatility conditions, under which deviations, redispatch and emergency actions tend to increase. To capture this, three operating scenarios are considered, consistent with Section 3.1:
(i)
A baseline scenario with normal supply–demand conditions;
(ii)
A supply-tight scenario with high load and limited reserve margins;
(iii)
A price-volatility scenario with strong DA–RT price spreads and volatile renewable output.
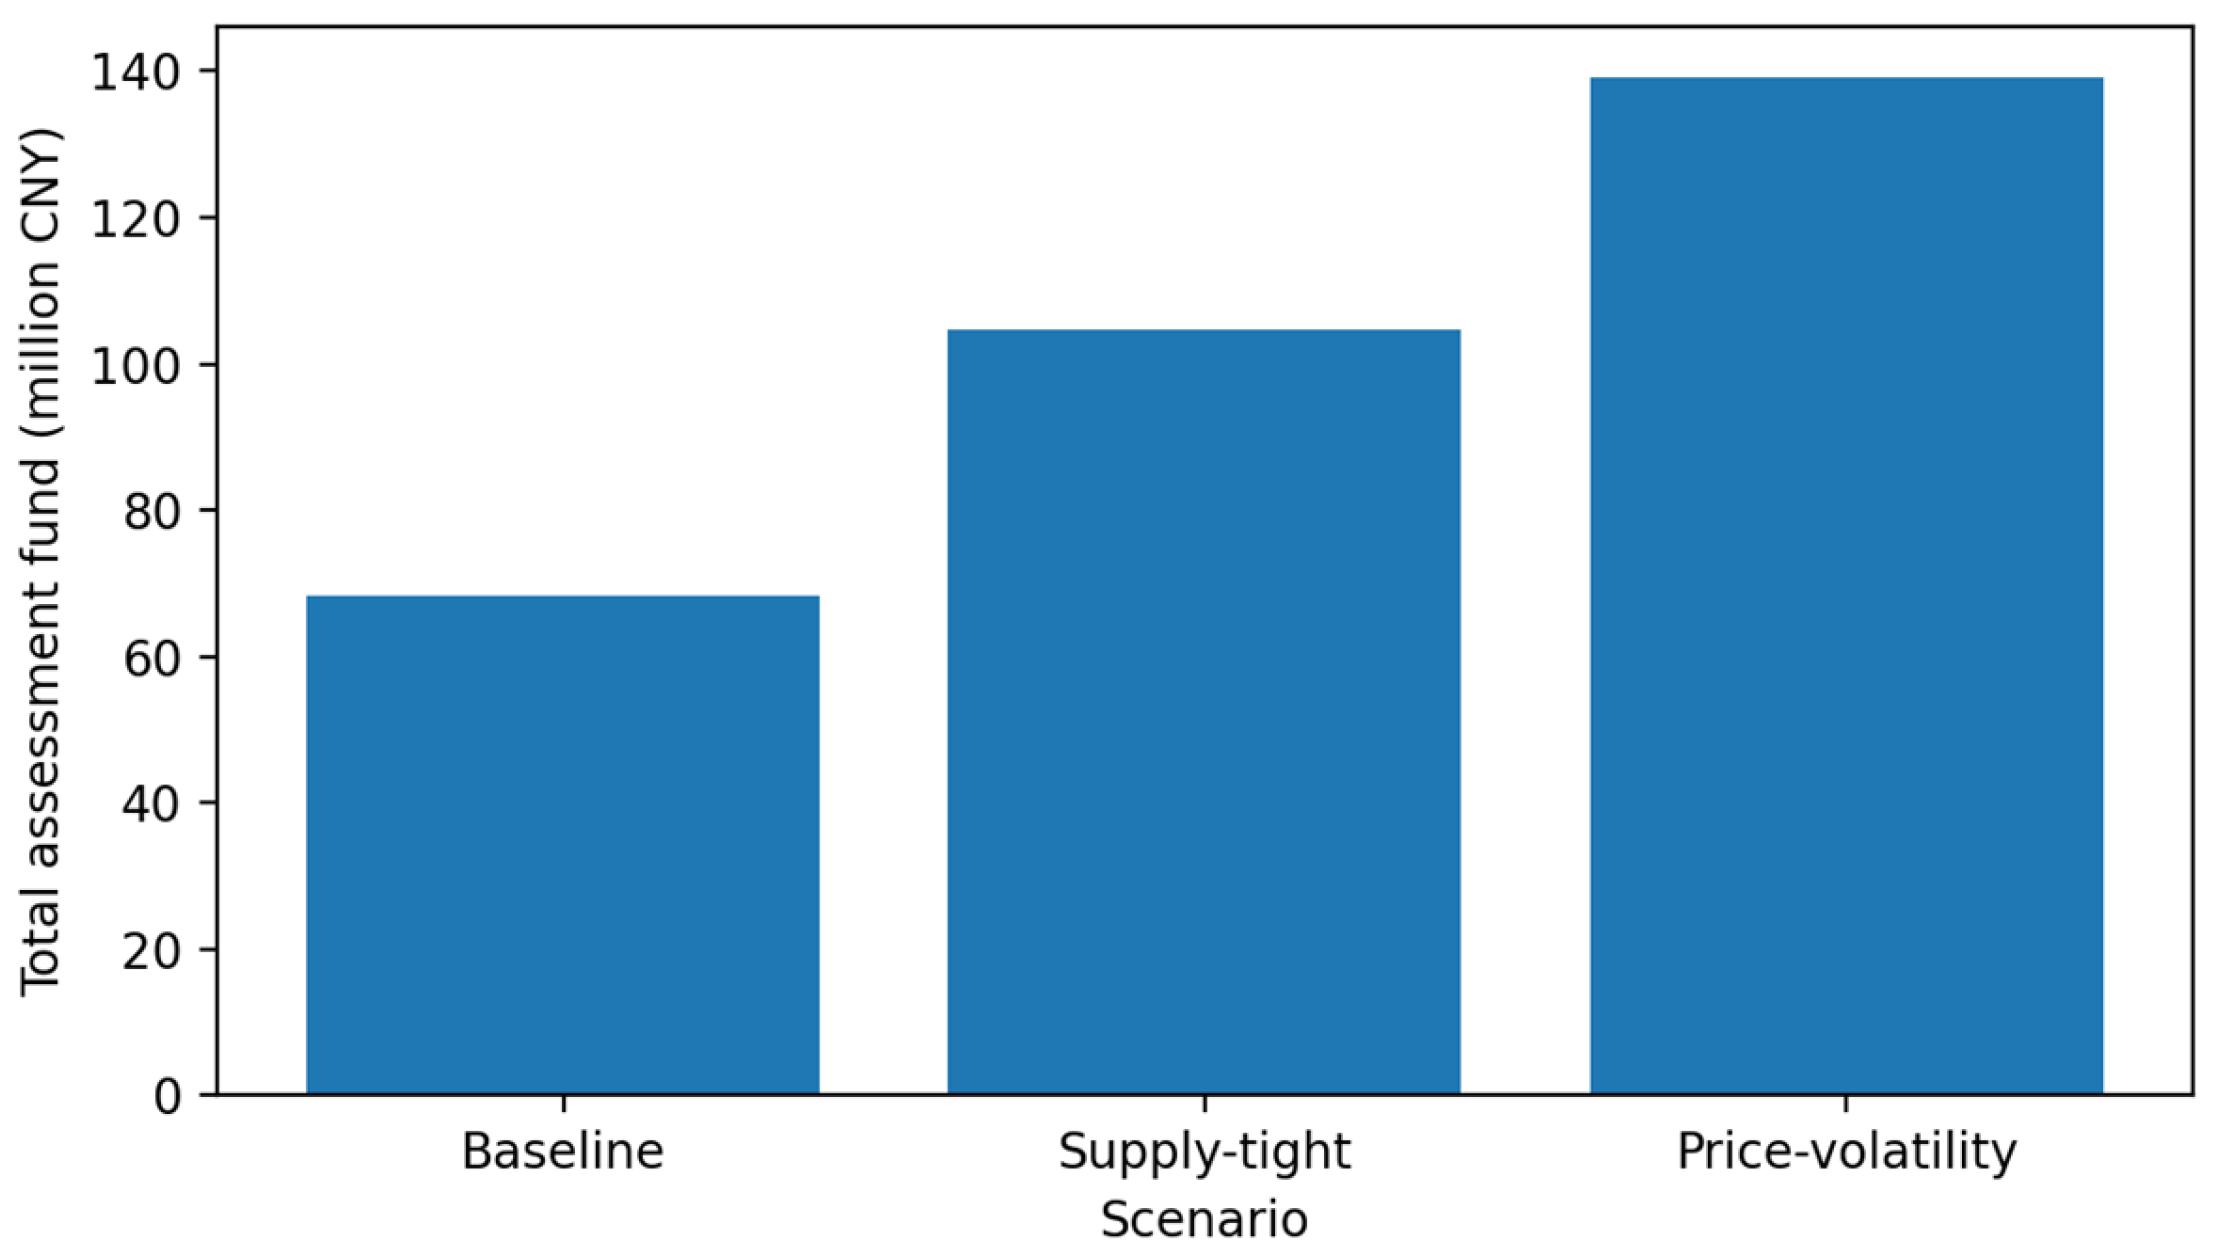
Table 3 reports the total monthly amount of assessment funds under these three scenarios. Again, values are given in million CNY and are consistent across schemes for a given scenario; schemes differ only in how these totals are redistributed across participant groups.
Compared with the baseline, the total assessment fund increases markedly in stressed scenarios. In the supply-tight scenario, higher utilization of flexible units, more frequent redispatch and tighter system conditions enlarge deviation-related penalties, increasing the total assessment fund from CNY 68.4 to 104.7 million (about +53%). In the price-volatility scenario, stronger DA–RT price spreads and more volatile outputs further amplify deviations and imbalance charges, raising the total amount to about CNY 139.2 million (roughly double the baseline).
For a clearer comparison across scenarios, Figure 5 visualizes the total assessment fund amounts reported in Table 3. The results indicate a substantial increase in the assessment fund from the baseline scenario to the stressed scenarios, highlighting the potential amplification of settlement pressure under adverse system conditions.
Under these enlarged totals, the distributional role of each scheme becomes more critical:
S31-h places a significant share of the additional burden on generators and large users with poor real-time performance, reinforcing real-time operational discipline but increasing revenue volatility for generators and potentially for exposed users.
S11-h shifts all the extra charges to users, which sharpens demand-side price signals but may cause tariff shocks and acceptance issues, especially in the price-volatility scenario, where the total charges are already high.
S33-h penalizes DA schedule errors rather than purely real-time deviations, moving part of the responsibility towards DA planning. This can smooth real-time volatility in net charges while still preserving incentives for accurate forecasting and contract management.
From the viewpoint of the two-dimensional diagnostic matrix (“fund category × participant group”), the row corresponding to assessment funds becomes darker (higher absolute values) in stressed scenarios for all three schemes, but the pattern of who pays and who receives differs substantially across S31-h, S11-h and S33-h.

3.3.4. Multi-Criteria Scores and Diagnostic Remarks

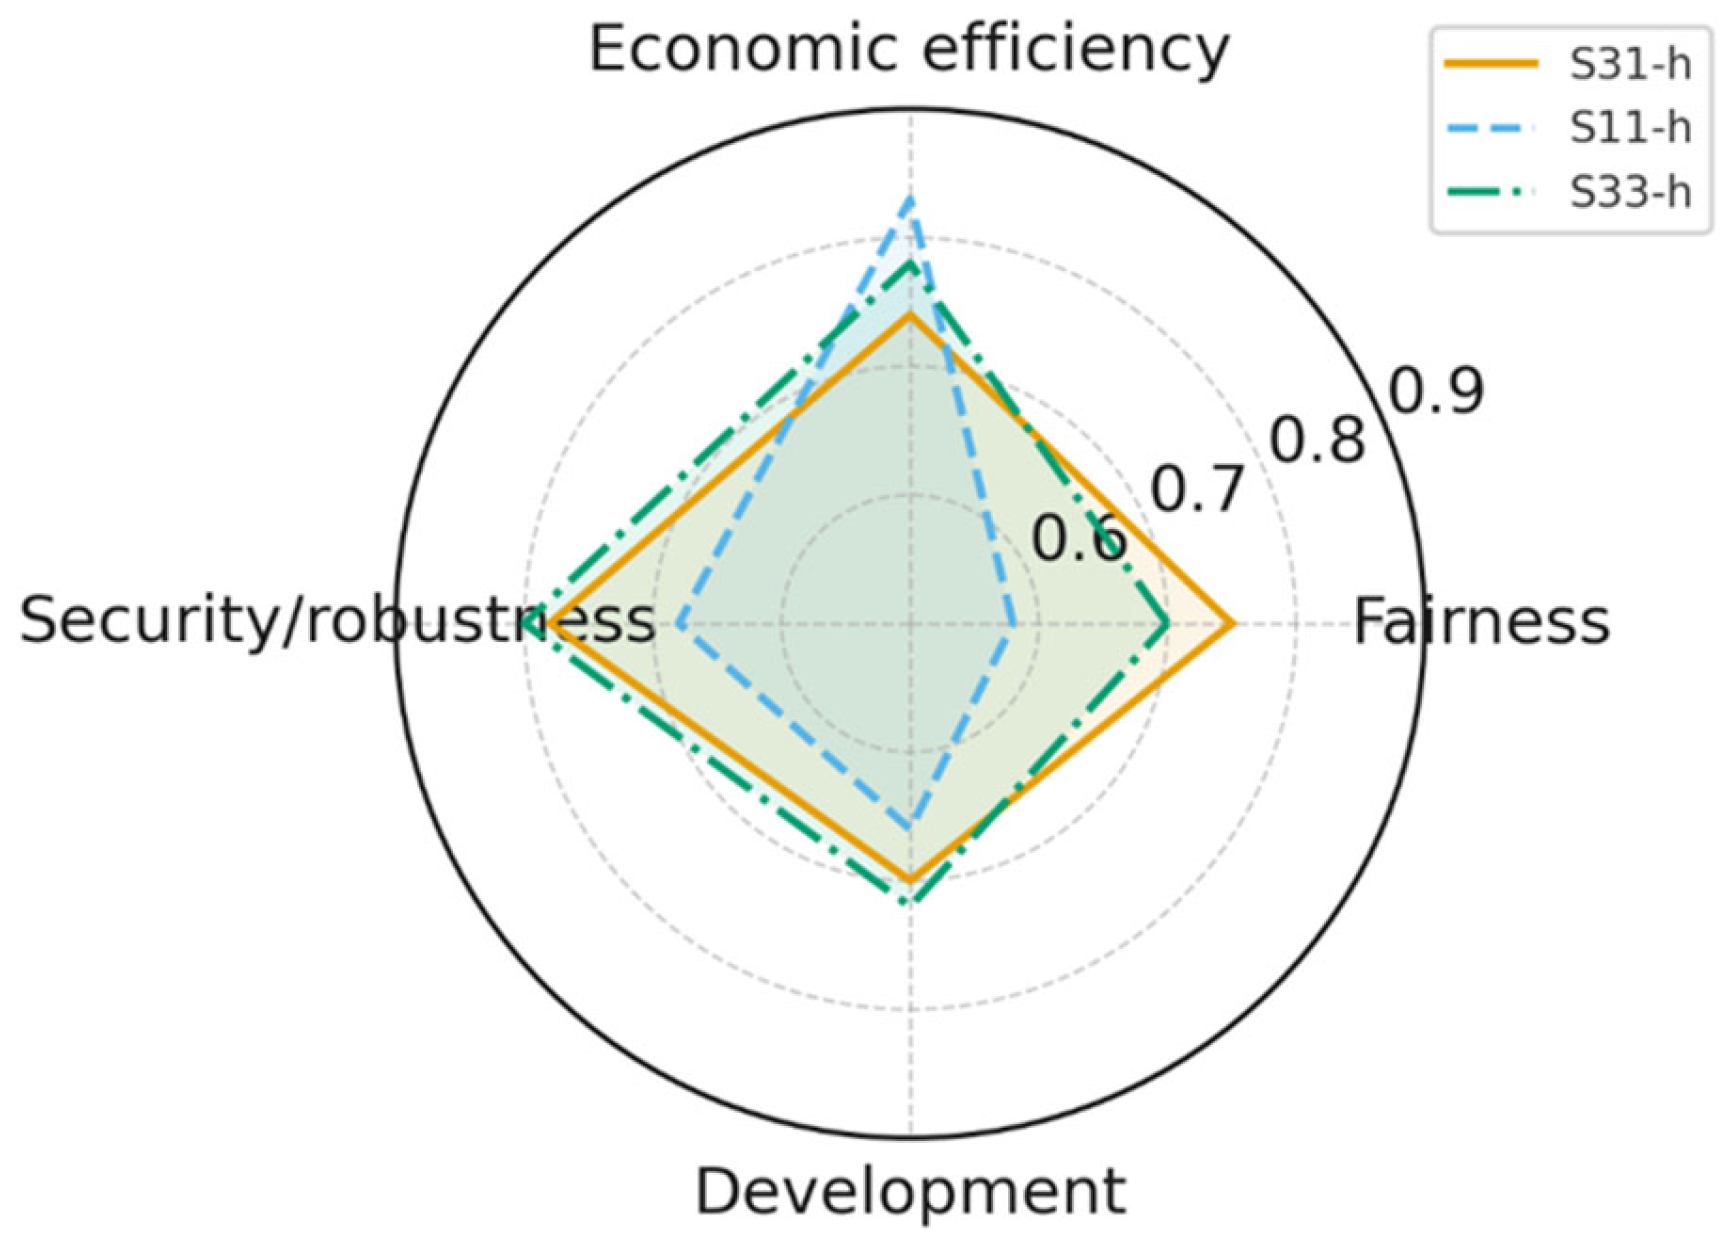
According to the evaluation model in Section 2.3, the three assessment schemes are scored along four dimensions—fairness, economic efficiency, security/robustness and development orientation—and aggregated into a TOPSIS closeness coefficient in the baseline scenario. An illustrative set of normalized scores (values in [0, 1]; higher is better) and the corresponding TOPSIS closeness coefficients are reported in Supplementary Table S4.
The main messages are as follows.
S31-h (actual, gens + users):
This scheme performs well on fairness (0.75), security/robustness (0.78) and development orientation (0.70), since both generators and users share assessment charges according to real-time participation (Supplementary Table S4). Its economic efficiency (0.74) is moderate: real-time signals are strong, but volatility in generator revenues and user payments can be relatively high, especially under stressed scenarios.
S11-h (actual, users only):
This scheme achieves the highest economic efficiency (0.83) by concentrating assessment burdens on users and sharpening their price signals. However, fairness is the lowest (0.58), and security/robustness (0.68) is also weaker, as generators are shielded from direct penalties while users may face large and hard-to-predict charges (Supplementary Table S4). This pattern is consistent with the group-level redistribution in Figure 4 and the scenario-level amplification in Table 3/Figure 5.
S33-h (DA-based, gens + users):
This scheme provides a balanced profile: fairness (0.70) and development orientation (0.72) are slightly below S31-h but higher than S11-h; economic efficiency (0.78) is improved relative to S31-h; and security/robustness is the highest among the three (0.80), reflecting the stabilizing effect of day-ahead-plan-based allocation (Supplementary Table S4). As a result, S33-h attains the highest overall TOPSIS closeness in this example, suggesting that DA-based assessment can offer a good compromise between real-time discipline, planning discipline and risk manageability.
These scores can be visualized in Figure 6 as a radar chart similar to Figure 3. S31-h appears as a real-time-responsibility-oriented scheme, S11-h as an efficiency-first but user-heavy scheme, and S33-h as a relatively balanced alternative that shifts part of the responsibility towards DA planning while containing volatility.
Taken together with the running-cost compensation results in Section 3.2, the assessment-fund case study confirms a recurring pattern: pure load-only schemes (S11-h type) are attractive in terms of economic efficiency but raise fairness and robustness concerns, whereas real-time sharing schemes (S31-h type) and DA-plan-based schemes (S33-h type) offer more balanced performance, especially when evaluated under multiple scenarios and viewed through the two-dimensional diagnostic of rights–responsibilities alignment.

3.4. Case Study 3: Redistributive Funds Under Boundary-Shock Scenarios

3.4.1. Problem Description and Selected Redistributive Funds

In addition to running-cost compensation and assessment funds, the provincial imbalance settlement system also contains several redistributive funds that are used to smooth tariffs and recycle congestion or imbalance surpluses. The most relevant items include the following:
(i)
The congestion imbalance fund when congestion rents exceed congestion-related costs (net surplus to be returned);
(ii)
The energy peak–valley balancing fund in energy tariffs;
(iii)
The T and D peak–valley balancing fund in transmission and distribution tariffs;
(iv)
Residual dual-track imbalance funds and LV/agency-user imbalance funds that are explicitly earmarked for tariff adjustment.
These funds are budget-balanced at the system level: they are collected from some participants and returned to others. Their economic and policy impact therefore depends critically on who is included in the allocation pool and how the allocation rules are parameterized.
To illustrate the sensitivity of redistributive funds to boundary changes, this case study focuses on the following:
A redistributive fund pool that aggregates the net surplus from congestion imbalance and peak–valley balancing items in the baseline month;
Three representative schemes from Section 2.2.3 for redistributive funds:
  • S11-h: load-side market participants and industrial/commercial users, allocated by hourly actual energy;
  • S21-h: all industrial/commercial users and generators, allocated by hourly actual energy;
  • S31-h: all industrial/commercial users and generators, allocated by hourly actual energy, but with a different grouping of objects (e.g., including certain non-market generators and policy-protected users).
We consider a boundary-shock scenario in which the coverage of redistributive funds is suddenly changed—for example, by including or excluding certain non-market generators and large industrial users—while the total fund remains unchanged. This corresponds to regulatory adjustments such as expanding or shrinking the set of participants that are eligible for tariff smoothing or surplus redistribution.

3.4.2. Baseline Boundary vs. Extended Boundary: Group-Level Effects

Let F R denote the net redistributive fund in the baseline month (e.g., the sum of congestion surplus and peak–valley balancing funds). In the numerical experiments, we first compare two boundary settings:
Boundary B0 (baseline): the redistributive fund is allocated only among market-facing users (direct- and agency-purchase users) and other industrial/commercial users;
Boundary B1 (extended): the allocation pool is extended to include market generators, non-market generators and certain policy-protected users, while keeping F R unchanged.
The detailed numerical allocation of redistributive funds under schemes S11-h and S21-h in the baseline month, for both B0 and B1, is reported in Supplementary Table S5 (positive values indicate net rebates, and negative values indicate net contributions; values are in million CNY).
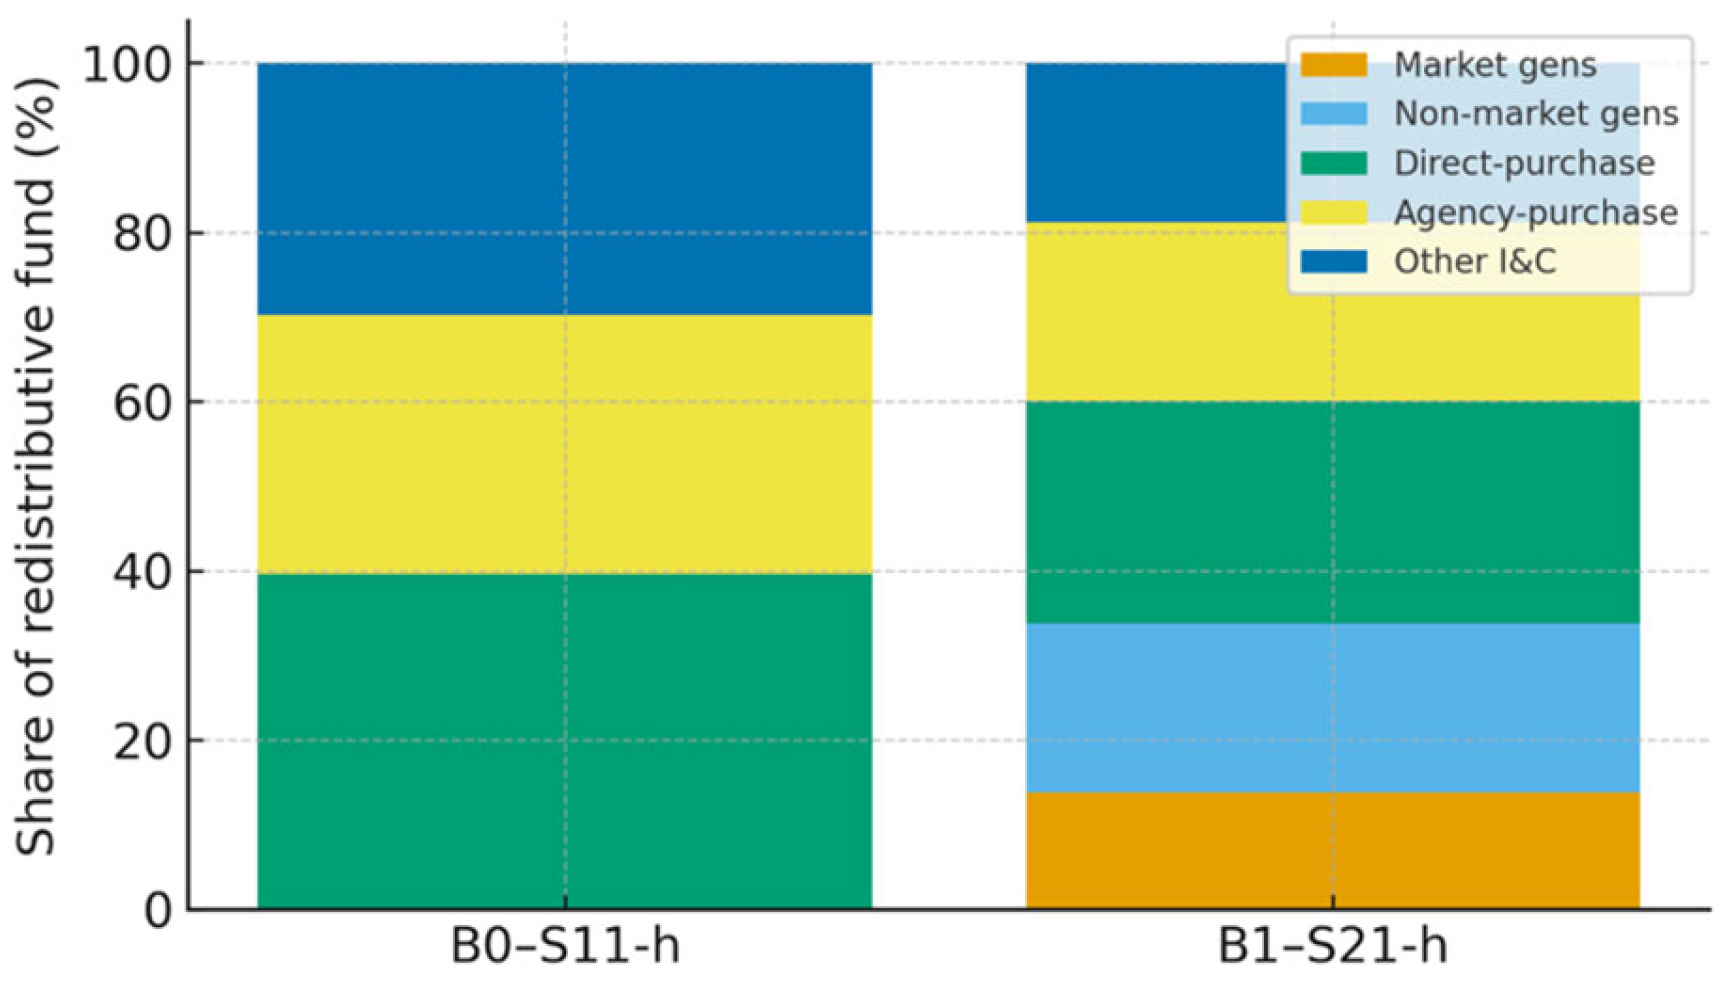
Under B0–S11-h, redistributive funds are returned exclusively to the three user groups, with no participation from generators. When the allocation boundary is extended to B1, a substantial share of the redistributive funds is redirected to generators, and user-side rebates decrease accordingly (e.g., the rebate to direct-purchase users decreases from CNY 36.7 to 24.3 million; see Supplementary Table S5). Although the total pool remains unchanged, the direction and intensity of cross-subsidies between users and generators differ markedly between B0–S11-h and B1–S21-h.
To provide a more intuitive view, Figure 7 plots the percentage shares of redistributive funds received by each participant group under B0–S11-h and B1–S21-h. The stacked bars highlight how the inclusion of generators in the allocation boundary reduces user-side rebates and reshapes the pattern of cross-subsidies between users and generators.
This example shows that boundary decisions (who is inside the pool) can be as important as the choice of scheme parameters, especially for redistributive funds whose total amount is fixed by physical and tariff conditions.

3.4.3. Participant-Level Flips: From Net Payer to Net Beneficiary

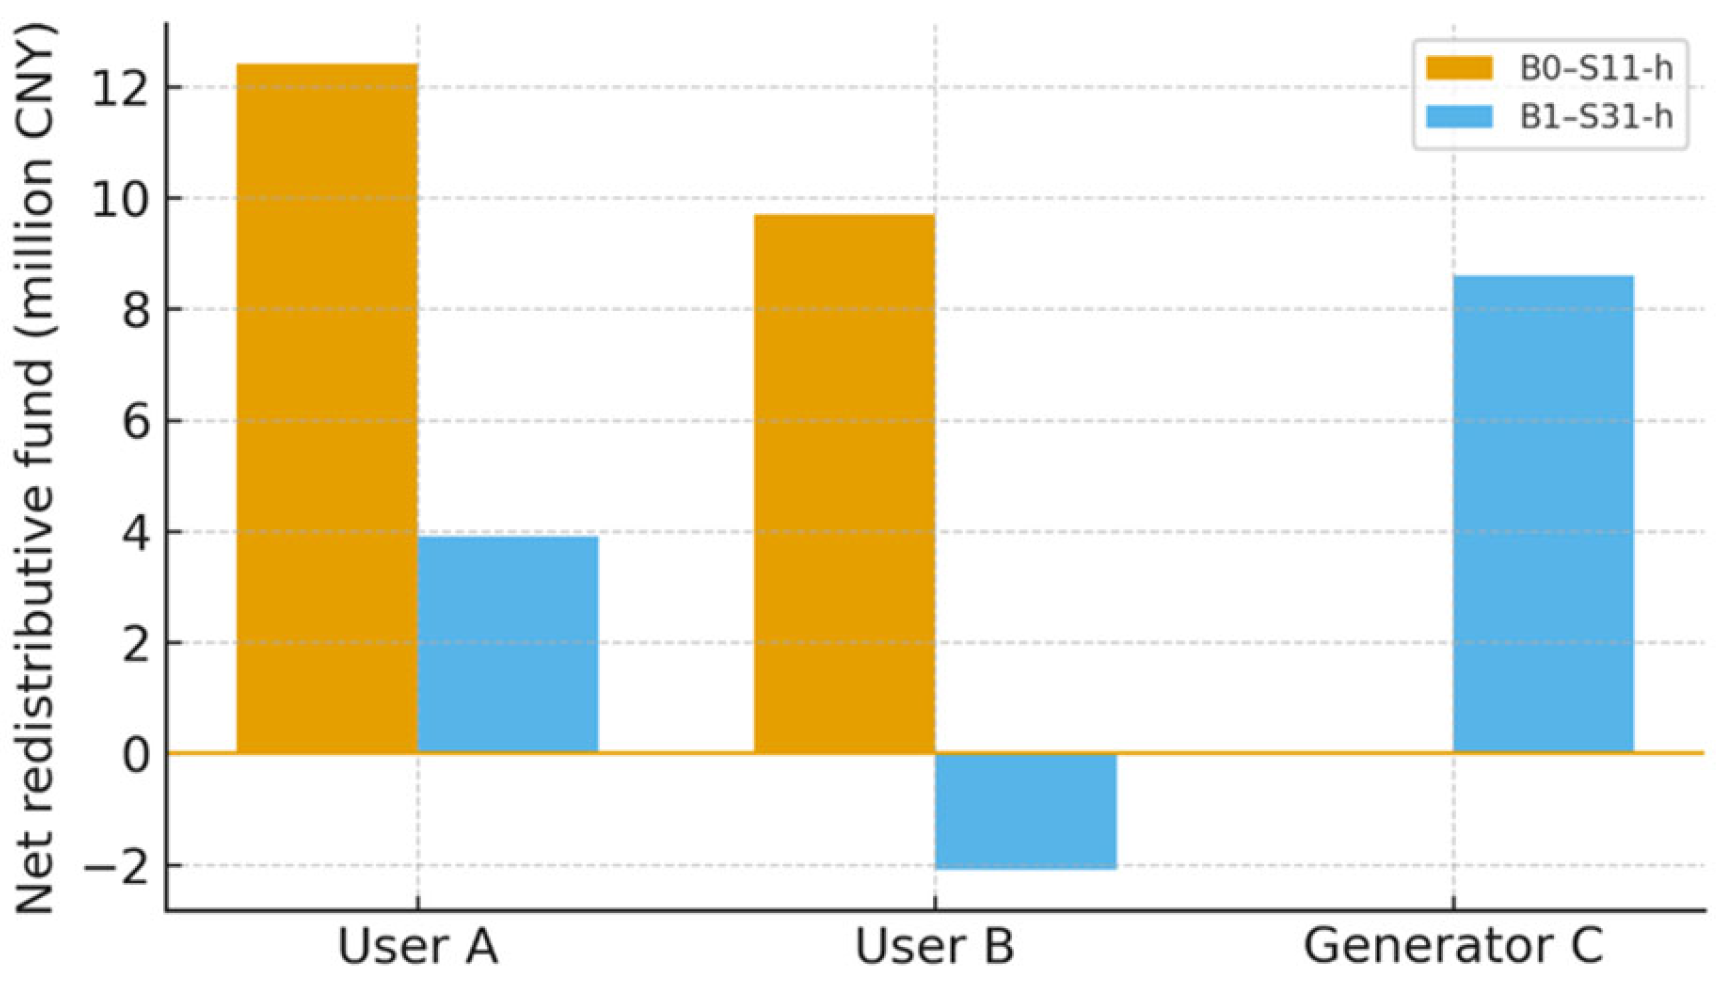
To highlight the micro-level impact of boundary shocks, the net redistributive fund allocations for three representative participants (two large users and one generator) under B0–S11-h and B1–S31-h are summarized in Supplementary Table S6 (values in million CNY; positive indicates a net rebate and negative indicates a net contribution). The results show three typical patterns.
User A (a large direct-purchase user) remains a net beneficiary under both boundaries, but its rebate drops from CNY 12.4 to 3.9 million, as part of the redistributive pool is now shared with generators.
User B (a large agency-purchase user) switches from a net beneficiary to a net contributor: under B0–S11-h, it receives CNY 9.7 million, whereas under B1–S31-h it pays CNY 2.1 million into the redistributive pool. This is because B1–S31-h adjusts the allocation weights using a broader set of bases (e.g., including deviation-related or location-related factors).
Generator C, which did not participate under B0–S11-h, becomes a net beneficiary under B1–S31-h, receiving about CNY 8.6 million. This can be interpreted as partially compensating for its role in providing flexibility or system support.
From the perspective of the two-dimensional diagnostic framework (“fund category × participant group”), the row corresponding to redistributive funds exhibits the following change: under B0–S11-h, high positive values are concentrated in user columns, and generator columns are close to zero; under B1–S21-h/B1–S31-h, positive entries appear in both user and generator columns, with some user entries turning negative, indicating a shift from uniform tariff smoothing on the user side to a more complex pattern of cross-subsidies between users and generators.
To visualize these “flips”, Figure 8 presents a before–after comparison of the three representative participants, showing their net redistributive positions under B0–S11-h and B1–S31-h. The bars clearly indicate how User B moves from a net rebate to a net payment position, while Generator C emerges as a new beneficiary once the boundary is extended.

3.4.4. Remarks on Boundary Design for Redistributive Funds

The above results suggest that, for redistributive funds such as congestion surplus and peak–valley balancing funds, boundary design is a first-order decision variable. The inclusion or exclusion of certain groups (e.g., non-market generators, large users and policy-protected users) can change not only the magnitude but also the sign of net transfers for typical participants, turning some from net payers into net beneficiaries or vice versa.
Pure load-only designs of the B0–S11-h type concentrate all redistributive effects on the user side, making cross-subsidies between different user groups more transparent but potentially ignoring the contributions of generators to congestion relief and flexibility provision. Extended designs of the B1–S21-h/B1–S31-h type allow generators and other resources to participate in redistributive funds, which can better recognize their role in creating or mitigating congestion and peak–valley imbalances. However, they also introduce more complex cross-subsidies between upstream and downstream participants.
The choice between B0- and B1-type boundaries should therefore be guided by the physical rights–responsibilities and beneficiary-pays principles in Section 2.2.2: if certain generators or user groups demonstrably contribute to congestion relief or tariff smoothing, there is a strong argument for including them in the redistributive pool as beneficiaries. In summary, the boundary-shock case study shows that redistributive funds are extremely sensitive to the definition of the allocation boundary, even when the total fund amount is unchanged. Boundary design should thus be treated as an explicit decision variable in the design of provincial imbalance settlement mechanisms, rather than as an implicit by-product of other rules.

3.5. Overall Comparison and Policy Implications

3.5.1. Cross-Case Comparison of Scheme Dimensions

The three case studies in Section 3.2, Section 3.3 and Section 3.4 jointly highlight that the performance of imbalance settlement mechanisms in a provincial dual-track market is largely driven by a small set of scheme design dimensions, including (i) allocation objects and boundaries (who is inside the pool); (ii) allocation bases (actual energy, deviations, day-ahead (DA) quantities and contract volumes); (iii) temporal granularity (hourly versus daily aggregation); and (iv) fund category (cost-recovery versus assessment versus redistributive funds), as summarized in Table 1.
Across running-cost compensation (Section 3.2), assessment funds (Section 3.3) and redistributive funds (Section 3.4), several consistent patterns emerge.
First, pure load-only schemes of the S11-h type tend to concentrate costs or charges on users. In the running-cost compensation case, Figure 2 shows that S11-h shifts nearly the entire burden to user groups, whereas S21-h spreads the burden more evenly across both users and generators; the within-load burden shift between S11-h and S12-h is further illustrated in Table 2. A similar “user-side concentration” pattern appears in the assessment-fund case: Figure 4 indicates that S11-h removes generators from the allocation pool and places the full burden on user groups. These designs may sharpen demand-side price signals, but they raise fairness and robustness concerns, particularly when system conditions deteriorate.
Second, broad-sharing real-time schemes of the S21-h/S31-h type are generally fairer and more symmetric between generators and users. Under running-cost compensation, S21-h achieves the most balanced distribution across participant groups (Figure 2), while in the assessment-fund case, S31-h yields a relatively balanced sharing of deviation-related charges between generators and users (Figure 4). However, such broad-sharing schemes may dilute price signals and may expose both sides to larger payment volatility when imbalance-related costs increase under stressed scenarios.
Third, deviation-based and DA-based schemes often deliver better compromises. In the running-cost compensation case, S12-h introduces a deviation-linked contribution from generators, providing a more incentive-consistent burden allocation compared with S11-h while remaining more user-oriented than S21-h (Figure 2 and Table 2). From a multi-criteria perspective, the radar comparison in Figure 3 suggests that S12-h tends to achieve a more balanced performance across fairness, efficiency, security/robustness and development orientation. In the assessment-fund case, S33-h reallocates part of the responsibility towards DA-plan-related bases and achieves a more balanced multi-criteria profile than the two extremes (Figure 6), particularly under stressed conditions where the total assessment fund grows substantially (Figure 5 and Table 3).
Finally, for redistributive funds, boundary design is a first-order decision variable. Figure 7 shows that expanding the allocation boundary from B0 to B1 substantially reshapes the distribution of redistributive funds across participant groups, while Figure 8 highlights that representative participants can flip from net beneficiaries to net contributors (or vice versa) once generators and additional entities are included. This confirms that, for redistributive funds, “who is inside the pool” can be as influential as the choice of allocation basis itself in determining cross-subsidies and net transfers.

3.5.2. Preferred Design Directions Under Multi-Scenario Objectives

Based on the numerical results and the multi-criteria evaluation in Section 3.2, Section 3.3 and Section 3.4, several design directions can be suggested for provincial imbalance settlement mechanisms under multi-scenario objectives.
(i)
Cost-recovery funds (e.g., running-cost and start-up compensation)
Pure load-only designs (e.g., S11-h) should be used with caution, since they can concentrate nearly the entire compensation burden on user groups and amplify acceptability concerns. In contrast, deviation-linked designs such as S12-h provide a more incentive-consistent alternative: while users remain the main cost bearers, part of the burden is shifted towards entities with controllable deviations, improving fairness and rights–responsibilities alignment without undermining efficiency (Figure 2 and Table 2). From a multi-criteria perspective, S12-h also tends to exhibit a more balanced profile than the two extremes, S21-h and S11-h (Figure 3).
(ii)
Assessment funds (deviation- and behaviour-related charges)
Real-time responsibility schemes (e.g., S31-h) and DA-plan-based schemes (e.g., S33-h) represent two complementary philosophies: the former emphasizes exposure to real-time deviations, while the latter strengthens planning and forecasting discipline. The group-level redistribution results show that S11-h removes generators from the allocation pool, whereas S31-h and S33-h retain generator participation and yield more symmetric responsibility sharing (Figure 4). Under stressed conditions, the total assessment fund increases markedly (Figure 5 and Table 3), which makes robustness and risk manageability more critical. In this setting, S33-h typically achieves a more balanced trade-off and higher multi-criteria performance in the illustrative evaluation (Figure 6). Hybrid designs that combine DA-based and real-time-based components may further enhance stability across scenarios.
(iii)
Redistributive funds (congestion surplus, peak–valley balancing and tariff smoothing)
For redistributive funds, the allocation boundary should be treated as an explicit design parameter rather than an implicit by-product. Boundary expansion from a user-only pool (B0) to a broader pool including generators and other entities (B1) substantially reshapes the distribution pattern across participant groups (Figure 7) and can even flip representative participants from net beneficiaries to net contributors (Figure 8). Therefore, extended-boundary designs can better recognize system-support contributions, but they require careful calibration to avoid unintended cross-subsidies and abrupt “sign flips” that reduce transparency and acceptance.
(iv)
Multi-scenario robustness
Mechanisms that perform reasonably well across baseline, supply-tight and price-volatility scenarios are preferable for practical provincial implementation. In particular, deviation-linked designs (such as S12-h for cost-recovery funds) and DA-based designs (such as S33-h for assessment funds) tend to provide more stable trade-offs when imbalance-related burdens grow under stress (Figure 5 and Table 3). The multi-scenario assessment and the two-dimensional diagnostics help avoid mechanisms that appear acceptable under average conditions but behave poorly in stressed scenarios, thereby improving the practical reliability of settlement-rule refinement in EMS-oriented market operation.

3.5.3. Implications for EMS-Oriented Provincial Imbalance Settlement

The three case studies also provide broader implications for the design of EMS-oriented imbalance settlement mechanisms in provincial dual-track markets.
First, the results highlight the usefulness of a library-based scheme design. As summarized in Table 1, imbalance settlement mechanisms can be modularized by explicit choices of allocation objects/boundaries, allocation bases and temporal granularity, allowing regulators and system operators to move beyond “one-off” rules for individual fund categories. The comparative evidence in Figure 2, Figure 3, Figure 4, Figure 5, Figure 6, Figure 7 and Figure 8 shows that different combinations of these design dimensions lead to systematically different distributional and incentive outcomes, especially under stressed scenarios.
Second, the proposed two-dimensional diagnostic framework (fund category × participant group) provides an operationally meaningful way to verify whether “who pays” aligns with “who benefits” or “who causes” imbalance-related costs. The running-cost compensation case (Figure 2 and Figure 3) illustrates how shifting from broad sharing (S21-h) to load-only allocation (S11-h) concentrates burdens on users, whereas deviation-based schemes (S12-h) partially restore generator participation. Similarly, the assessment-fund case (Figure 4, Figure 5 and Figure 6 and Table 3) shows that the total deviation-related charges can increase substantially under supply-tight and price-volatility scenarios, making the choice of allocation basis and object set critical for fairness and robustness. In the boundary-shock case (Figure 7 and Figure 8), extending the allocation boundary (B0 → B1) reshapes cross-subsidies and can flip typical participants from net beneficiaries to net contributors, indicating that boundary definition is a first-order design decision rather than a technical detail.
Third, from an EMS-data market perspective, these results suggest that imbalance settlement should be treated as part of a data-driven operational feedback loop, rather than a purely ex post accounting step. The required inputs—such as day-ahead schedules, real-time metering, deviations and settlement prices—are routinely produced by EMS and market platforms; therefore, settlement diagnostics can be integrated with EMS functions including forecasting, unit commitment, demand response, congestion management and tariff design. For instance, deviation-based (S12-h) and DA-based (S33-h) mechanisms naturally align settlement responsibility with controllable decision variables monitored by EMS, improving interpretability and allowing operators to trace “fund outcomes” back to operational behaviours.
Overall, the cross-case evidence indicates that no single scheme dominates across all objectives. However, mechanisms that combine deviation- or DA-based allocation, shared responsibilities between generators and users, and carefully designed boundaries tend to deliver more robust performance under multiple scenarios. These findings provide actionable guidance for provincial regulators and system operators when refining imbalance settlement mechanisms in dual-track electricity markets.

4. Conclusions

This paper proposed an EMS-oriented framework for the multi-scenario assessment of imbalance settlement mechanisms in provincial dual-track electricity markets. A unified settlement model was developed to represent multiple imbalance fund categories within a consistent accounting structure, and to construct alternative settlement schemes by combining allocation objects, allocation bases and temporal granularities. Based on a provincial-scale case study under normal operation, tight supply and high renewable volatility scenarios, the framework enables systematic comparison of settlement mechanisms and provides interpretable diagnostics on fund flows and rights–responsibilities alignment across participant groups.
The results show that settlement design choices can lead to markedly different distributional and incentive outcomes, especially under stressed scenarios. For running-cost compensation, schemes that include both generators and users in the allocation pool generally improve fairness and reduce extreme cross-subsidies, while user-only schemes strengthen demand-side cost signals but may amplify burden concentration on industrial and commercial users. For assessment funds, designs based on day-ahead-plan-related responsibility can achieve a more balanced trade-off between real-time discipline, planning discipline and risk manageability compared with purely real-time sharing or purely load-only allocation. Moreover, boundary expansions (e.g., including additional generator groups or policy-protected users in redistributive allocations) can significantly reshape who ultimately pays and who benefits, highlighting the importance of clearly defining allocation boundaries when interpreting ex post settlement outcomes.
Beyond the specific context of Chinese provincial dual-track markets, this study contributes a transferable EMS-oriented methodology for ex post assessment of imbalance settlement mechanisms in hybrid electricity markets where long-term contracting coexists with short-term clearing and uplift/imbalance payments. The proposed “scheme library + multi-scenario stress testing + multi-criteria ranking + category–agent diagnostics” workflow provides a structured way to (i) decompose settlement rules into modular design dimensions, (ii) quantify cross-subsidies and rights–responsibilities consistency at an aggregated participant level and (iii) compare robustness under stressed operating conditions such as scarcity and renewable volatility. As such, the framework can be adapted to other jurisdictions seeking transparent settlement diagnostics and policy calibration for imbalance charges, congestion surplus redistribution or reliability-related uplift mechanisms, especially when data access is limited and stakeholder acceptance requires interpretable, group-level evidence.
Overall, the proposed framework supports principled refinement of imbalance settlement rules by integrating multi-scenario settlement simulation, multi-criteria evaluation and a category–agent two-dimensional diagnosis of imbalance fund flows. In practical EMS settings, the accuracy of fine-grained participant-level attribution may be limited by data availability, confidentiality constraints and measurement noise; nonetheless, the framework remains applicable at the aggregated group level and can be further extended when more detailed portfolio and unit-level data become available. Future work will focus on expanding the fund library to additional settlement categories, improving empirical calibration with multi-province datasets and exploring dynamic behavioural feedback between settlement rules and market participants’ operational strategies.

Supplementary Materials

The following supporting information can be downloaded at: https://www.mdpi.com/article/10.3390/en19030683/s1, Supplementary S1 (engineering formulas for imbalance-related funds); Supplementary S2 (multi-criteria evaluation indicators and weights); Supplementary Tables S1–S6 (detailed numerical results).

Author Contributions

M.W.—conceptualization, methodology, software, writing—original draft, validation, data curation, formal analysis and visualization. H.C.—funding acquisition, writing—review and editing, supervision, project administration, resources and investigation. All authors have read and agreed to the published version of the manuscript.

Funding

This research was funded by the National Natural Science Foundation of China (NSFC) (Key Program), grant number 51937005 (Fundamental theory of dynamic modelling, planning, and operation of integrated energy systems).

Data Availability Statement

The EMS/settlement datasets used in this study contain commercially sensitive information and are not publicly available. Anonymized and aggregated data may be provided upon reasonable request, subject to approval by the data provider. Requests to access the datasets should be directed to ep23wmy@mail.scut.edu.cn.

Conflicts of Interest

The authors declare no conflicts of interest.

References

  1. Oprea, S.-V.; Bara, A.; Preotescu, D.; Bologa, R.A.; Coroianu, L. A Trading Simulator Model for the Wholesale Electricity Market. IEEE Access 2020, 8, 184210–184230. [Google Scholar] [CrossRef]
  2. Zhang, X.; Liu, W.; Chen, Y.; Bai, Y.; Li, J.; Zhong, J. Electricity Market Design and Operation in Guangdong Power. In Proceedings of the 2018 15th International Conference on the European Energy Market (EEM), Lodz, Poland, 27–29 June 2018; pp. 1–5. [Google Scholar]
  3. Jogunola, O.; Ajagun, A.S.; Tushar, W.; Olatunji, F.O.; Yuen, C.; Morley, C.; Adebisi, B.; Shongwe, T. Peer-to-Peer Local Energy Market: Opportunities, Barriers, Security, and Implementation Options. IEEE Access 2024, 12, 37873–37890. [Google Scholar] [CrossRef]
  4. Shortt, A.; O’Malley, M.J. Expanding Renewables and the Challenge of Designing Market Payments. In Proceedings of the 2nd IET Renewable Power Generation Conference (RPG 2013), Beijing, China, 9–11 September 2013; p. 2.67. [Google Scholar]
  5. Zhang, J.; Sun, J.; Wu, C. Enable a Carbon Efficient Power Grid via Minimal Uplift Payments. IEEE Trans. Sustain. Energy 2022, 13, 1329–1343. [Google Scholar] [CrossRef]
  6. Van Der Veen, R.A.C.; Hakvoort, R.A. Balance Responsibility and Imbalance Settlement in Northern Europe—An Evaluation. In Proceedings of the 2009 6th International Conference on the European Energy Market, Leuven, Belgium, 27–29 May 2009; pp. 1–6. [Google Scholar]
  7. Haring, T.W.; Kirschen, D.S.; Andersson, G. Incentive Compatible Imbalance Settlement. IEEE Trans. Power Syst. 2015, 30, 3338–3346. [Google Scholar] [CrossRef]
  8. Matsumoto, T.; Bunn, D.; Yamada, Y. Mitigation of the Inefficiency in Imbalance Settlement Designs Using Day-Ahead Prices. IEEE Trans. Power Syst. 2022, 37, 3333–3345. [Google Scholar] [CrossRef]
  9. Al-Abdullah, Y.M.; Abdi-Khorsand, M.; Hedman, K.W. The Role of Out-of-Market Corrections in Day-Ahead Scheduling. IEEE Trans. Power Syst. 2015, 30, 1937–1946. [Google Scholar] [CrossRef]
  10. Yang, Z.; Wang, Y.; Yu, J.; Yang, Y. On the Minimization of Uplift Payments for Multi-Period Dispatch. IEEE Trans. Power Syst. 2020, 35, 2479–2482. [Google Scholar] [CrossRef]
  11. Madani, M.; Papavasiliou, A. A Note on a Revenue Adequate Pricing Scheme That Minimizes Make-Whole Payments. In Proceedings of the 2022 18th International Conference on the European Energy Market (EEM), Ljubljana, Slovenia, 13 September 2022; pp. 1–6. [Google Scholar]
  12. Ni, H.; Chen, X.; Peng, Y. Analysis and Research on the Key Issues of Electricity Market Structure and Transmission Congestion Based on Financial Transmission Rights. In Proceedings of the 2023 International Conference on Power, Electrical Engineering, Electronics and Control (PEEEC), Athens, Greece, 25 September 2023; pp. 255–260. [Google Scholar]
  13. Ma, J.; Zhao, M.; Wu, J.; Gao, W.; Xue, H.; Pan, X. Elastic Clearing Model of Electricity Spot Market. In Proceedings of the 2023 IEEE 6th International Electrical and Energy Conference (CIEEC), Hefei, China, 12 May 2023; pp. 132–137. [Google Scholar]
  14. Yang, N.; Liu, Y.; Zhu, L. Imbalance Funds in a Dual-Track Electricity Spot Market: An Analysis. Power Demand Side Manag. 2021, 23, 37–40. [Google Scholar]
  15. Zhang, L. Allocation Mechanisms for Imbalance Costs in China’s Transitional Electricity Market. Master’s Thesis, North China Electric Power University, Beijing, China, 2022. [Google Scholar]
  16. Weng, G. An Analysis of Major Imbalance Funds in Electricity Spot Markets. 2025, pp. 69–72. Available online: https://kns.cnki.net/kcms2/article/abstract?v=VqE8_zhXCqXfFhLsHPmVI2d3aPrlzx5l7JUbmAXdeW8xMvAryEJx-zdmHTCPCJzdvA1QNmQTIDGrKx2R-6jtweWpVXX4Zejvou7-ckozg8ubMHCb2CnC3CrIEDKjSKIAGYedEioCMhtZYYNoVnBvHV2LqZ6UcLSprXIoUyoRuBokMTfTOBj1Ew==&uniplatform=NZKPT&language=CHS (accessed on 25 January 2026).
  17. Zhao, S.; Xia, N.; Kuai, J.; Hui, X.; Liang, Y.; Ding, P. Research on Unbalanced Funds Settlement Mechanism in Liaoning Electricity Spot Market. In Proceedings of the 2023 2nd Asian Conference on Frontiers of Power and Energy (ACFPE), Chengdu, China, 20 October 2023; pp. 344–350. [Google Scholar]
  18. Long, S.; Feng, K.; Xu, J.; Yang, Z.; Feng, S. Composition of Imbalance Costs and Allocation Mechanisms in Electricity Spot Markets. Power Syst. Technol. 2019, 43, 2649–2658. [Google Scholar] [CrossRef]
  19. Yao, X.; Zeng, Z.; Yang, W.; Wu, J.; Yang, L.; Zhong, H. Design and Practice of Settlement Mechanisms in the Guangdong Electricity Market. Power Syst. Prot. Control. 2020, 48, 76–85. [Google Scholar] [CrossRef]
  20. Guangdong Power Exchange Center Co., Ltd. Guangdong Electricity Spot Market Settlement Implementation Rules (2024 Revision); Guangdong Power Exchange Center Co., Ltd.: Guangzhou, China, 2024. [Google Scholar]
  21. Xie, X.; Liu, B.; Yu, L.; Shi, L.; Chen, X.; Cheng, C. Settlement Mechanisms for the Demand Side in China’s Electricity Spot Markets: A Comparative Study and Design Insights. Power Syst. Technol. 2022, 46, 57–62. [Google Scholar] [CrossRef]
  22. Wang, M. Allocation Methods for Imbalance Funds in Electricity Spot Markets. Master’s Thesis, Changsha University of Science & Technology, Changsha, China, 2023. [Google Scholar]
  23. Qi, S.; Wang, X.; Zhang, W.; Wu, X.; Wang, G.; Shi, X.; Wang, Y. Evaluation Index System for Clearing Models of Different Electricity Price Policies. In Proceedings of the 2018 2nd IEEE Conference on Energy Internet and Energy System Integration (EI2), Beijing, China, 20–22 October 2018; pp. 1–6. [Google Scholar]
  24. Song, J.; Liang, Y.; Zou, Q. Research on the Operational Evaluation Model of Electricity Spot Market Based on Fuzzy Analytic Hierarchy Process and Evaluation. In Proceedings of the 2024 3rd International Conference on Energy, Power and Electrical Technology (ICEPET), Chengdu, China, 17 May 2024; pp. 1254–1257. [Google Scholar]
  25. Zhang, H.; Yu, Y.; Li, Q.; Zhang, Z.; Liu, K.; Chang, D.; Zhang, M. Multi-Dimensional Risk Assessment of Regional Electricity Markets. In Proceedings of the 2025 IEEE 12th Joint International Information Technology and Artificial Intelligence Conference (ITAIC), Chongqing, China, 23 May 2025; pp. 113–117. [Google Scholar]
  26. Bao, M.; Ding, Y.; Zhou, X.; Guo, C.; Shao, C. Risk Assessment and Management of Electricity Markets: A Review with Suggestions. CSEE J. Power Energy Syst. 2021, 7, 1322–1333. [Google Scholar] [CrossRef]
  27. Hassan, I.; Alhamrouni, I.; Azhan, N.H. A CRITIC–TOPSIS Multi-Criteria Decision-Making Approach for Optimum Site Selection for Solar PV Farm. Energies 2023, 16, 4245. [Google Scholar] [CrossRef]
  28. Wang, C.-N.; Nguyen, N.-A.-T.; Dang, T.-T.; Bayer, J. A Two-Stage Multiple Criteria Decision Making for Site Selection of Solar Photovoltaic (PV) Power Plant: A Case Study in Taiwan. IEEE Access 2021, 9, 75509–75525. [Google Scholar] [CrossRef]
  29. Bie, Z.; Lin, Y.; Li, G.; Li, F. Battling the Extreme: A Study on the Power System Resilience. Proc. IEEE 2017, 105, 1253–1266. [Google Scholar] [CrossRef]
  30. Jing, Z.; Rong, Y.; Wang, Y.; Xie, W.; Zhou, L.; Ye, W.; Ji, T. A Review of Imbalance Funds in Electricity Markets: Causes, Countermeasures, and Outlook. Power Syst. Technol. 2023, 47, 3586–3600. [Google Scholar] [CrossRef]
  31. Zhou, Y.; Zheng, R.; Yang, J. Adaptive Introduction and Effect Analysis of Financial Transmission Rights in China’s Electricity Market. In Proceedings of the 2024 4th International Conference on Smart City and Green Energy (ICSCGE), Sydney, Australia, 10 December 2024; pp. 167–171. [Google Scholar]
  32. Yang, M.; Deng, T.; Xi, L. A Key Addition to China’s “1+N” Unified Electricity Market Rule System: An Interpretation of the Basic Rules for the Ancillary Services Market. Zhongguo Dianli Qiye Guanli 2025, 8–9. Available online: https://kns.cnki.net/kcms2/article/abstract?v=VqE8_zhXCqVo-qtrpn3ZOa_2iEiHlX7mXBywhnOD0WO6Z9tqRcwVOuJN9-Y3bYIrbSIcDlspXzd7dta9ZP_A_LscaTYHkcOLNdwG3tL_RVUQ-Md7ylN577dghijOsqAJedaK1DIjt68IHF1NNMRoFevxTVqpdUvEmh_2JbV0aIlQREaVXw0zEKevxgg4iUBj&uniplatform=NZKPT&language=CHS (accessed on 25 January 2026).
  33. Wu, M.; Su, C.; Sun, Y.; Zuo, C.; Yang, C.; Gao, G.; Zhang, S.; Yang, Y. Review and Enlightenment of Foreign Auxiliary Service Cost Allocation Mechanism in Power System. In Proceedings of the 2022 IEEE International Conference on Electrical Engineering, Big Data and Algorithms (EEBDA), Changchun, China, 25 February 2022; pp. 603–606. [Google Scholar]
  34. Hu, X.; Li, S.; Wang, D.; Yang, J.; Yang, J.; Chen, H. Horizontal Cost Allocation of Integrated Energy System Based on Generalized Energy Quality Coefficient. In Proceedings of the 2024 IEEE Power & Energy Society General Meeting (PESGM), Seattle, WA, USA, 21 July 2024; pp. 1–5. [Google Scholar]
  35. Chakraborty, P.; Baeyens, E.; Khargonekar, P.P. Cost Causation Based Allocations of Costs for Market Integration of Renewable Energy. IEEE Trans. Power Syst. 2018, 33, 70–83. [Google Scholar] [CrossRef]
  36. Reta, R.; Vargas, A.; Verstege, J. Allocation of Expansion Transmission Costs: Areas of Influence Method versus Economical Benefit Method. IEEE Trans. Power Syst. 2005, 20, 1647–1652. [Google Scholar] [CrossRef]
Figure 1. EMS-oriented multi-scenario assessment framework for imbalance settlement mechanisms in provincial dual-track electricity markets.
Energies 19 00683 g001
Figure 2. Percentage shares of the running-cost compensation fund under S21-h, S11-h and S12-h.
Energies 19 00683 g002
Figure 3. Normalized scores and TOPSIS closeness coefficients for S21-h, S11-h and S12-h.
Energies 19 00683 g003
Figure 4. Share of assessment funds by participant group under S31-h, S11-h and S33-h (baseline month).
Energies 19 00683 g004
Figure 5. Total assessment fund amounts under different scenarios (baseline month).
Energies 19 00683 g005
Figure 6. Normalized multi-criteria scores of S31-h, S11-h and S33-h in the baseline scenario.
Energies 19 00683 g006
Figure 7. Share of redistributive funds by participant group under B0–S11-h and B1–S21-h (baseline month).
Energies 19 00683 g007
Figure 8. Net redistributive fund positions of representative participants under B0–S11-h and B1–S31-h (baseline month).
Energies 19 00683 g008
Table 1. Candidate allocation options by fund category (objects, period and basis) and representative schemes used in this paper.
Fund CategoryCandidate Allocation Objects (Examples)Candidate Bases and Periods (Examples)Representative Schemes in This Paper (Illustrative)
Variable-cost compensation(a) All industrial/commercial users; (b) RES units; (c) users + RES unitsBasis: actual settled energy; period: hourly/daily/monthlyUser-only RT-energy scheme and users + RES RT/DA-based variants, used in variable-cost and operating compensation analysis
Generation–load energy imbalance fund(a) DA generators + RT users; (b) RT generators + DA usersBases: RT energy, DA energy, DA positive deviations, RT positive deviations; period: hourly/daily/monthlyDA-based vs. RT-based imbalance sharing schemes compared in the generation–load imbalance analysis
Congestion-related imbalance funds(a) Direct-purchase users + market generators; (b) direct + agency + premium users + market/non-market generators; (c) market generators onlyBases: RT energy; RT energy × max(uniform price − nodal price, 0); period: hourly/daily/monthlyUser-only vs. “users + generators” redistribution schemes, used in the redistributive funds case study (B0/B1 variants)
Start-up compensation(a) All market users; (b) users with load during start-up/shutdown periodsBases: monthly RT energy; RT energy during start-up/shutdown periods; period: hourly/monthlySimplified user-side allocation scheme, referenced conceptually in the case study
Operating compensation(a) All market users; (b) deviating generators + users; (c) users with load in start-up/constraint-binding periodsBases: RT energy (total or constrained periods), start-up-period energy; period: hourly/daily/monthlyUser-only RT scheme vs. deviation-based scheme (S11-h vs. S12-h type) in the operating/variable-cost compensation case
Assessment funds(a) All industrial/users; (b) market generators; (c) generators + usersBases: RT energy, long-term contract energy, DA cleared energy, demand declaration; period: hourly/daily/monthlyRT-based responsibility (S31-h type) vs. DA-based responsibility (S33-h type) in the assessment funds case
Other redistributive funds (incl. LV and agency-user-related items)(a) All industrial/users; (b) industrial users only; (c) generators + usersBasis: RT energy; period: hourly/daily/monthlyUser-only vs. users + generators redistribution in the redistributive funds case (Section 3.4)
Table 2. Relative shares of user groups under S11-h and S12-h (baseline month, normalized).
SchemeDirect-PurchaseAgency-PurchaseOther Industrial/Commercial
S11-h0.500.300.20
S12-h0.460.320.22
Table 3. Total assessment fund amounts under different scenarios (million CNY).
ScenarioTotal Assessment Fund (Million CNY)
Baseline68.4
Supply-tight104.7
Price-volatility139.2
Disclaimer/Publisher’s Note: The statements, opinions and data contained in all publications are solely those of the individual author(s) and contributor(s) and not of MDPI and/or the editor(s). MDPI and/or the editor(s) disclaim responsibility for any injury to people or property resulting from any ideas, methods, instructions or products referred to in the content.