1. Introduction
In response to the European Union’s climate goals, in particular those resulting from the European Green Deal and the Fit for 55 legislative package, Poland has committed to achieving climate neutrality by 2050 and reducing greenhouse gas emissions by at least 55% by 2030 compared to 1990 levels. Achieving these goals requires a profound energy transition, including a gradual shift away from fossil fuels, modernisation of energy infrastructure, and implementation of circular economy principles. An additional impetus for action in this area was Poland’s decision to completely ban imports of hard coal from Russia and Belarus, introduced by the Act of 13 April 2022 on special measures to counteract support for aggression against Ukraine and to protect national security [
1]. Still, it is worth remaining aware that hard coal will play a dominant role in the national energy mix in the coming years, and will thus be critical to ensuring Poland’s energy security. In this context, developing an industrial and energy policy for Poland, and consequently a programme for hard coal mining, seems to be a necessary step. In order to prepare these key strategic documents, it is important to have access to up-to-date information on the state of hard coal resources [
2] (pp. 121–130).
In response to the above challenges, the KOMAG Mining Technology Institute, in cooperation with the Institute of Mineral Resources and Energy Management of the Polish Academy of Sciences and the Ministry of Industry, launched the DynGOSP project—‘Dynamic management of demand, production, resource management, and distribution logistics for hard coal in an economy implementing a decarbonisation energy mix’. This project is an attempt to formulate a systematic approach to the production and distribution of hard coal in Poland, in accordance with the principles of a just-in-time (JIT) strategy, that will enable the minimisation of stocks and the elimination of resource waste. Currently, the lack of precise information on available coal resources, the current production capacities of individual producers, and the actual demand for energy and hard coal means that production is often not adapted to current market needs. The DynGOSP project aims to change this by implementing an integrated and dynamic management system.
As part of the development of a comprehensive hard coal management system in Poland, with a view to 2050 targets, the entire chain of activities will be covered, from coal deposits to the consumer. The project aims to determine the projected demand for hard coal in Poland until 2050 [
3] (pp. 458–465), taking into account the needs of industrial energy, district heating producers, the service sector, transport, and individual consumers. At the same time, sources of coal will be identified, with particular emphasis on domestic resources, the volume of which will be estimated in accordance with the JORC Code standard.
On this basis, a coal production forecast will be developed, taking into account coal deposit resource modelling [
4], production planning, and mining scheduling [
5], as well as a distribution logistics model [
6], ensuring the efficient delivery of raw materials to customers. In order to ensure the continuity of mining operations, it is necessary to implement a system for forecasting the condition of mining machinery and equipment. Forecasting allows for the future condition of facilities to be determined through continuous measurement, constant monitoring (including in real time), analysis of current and historical conditions, and the estimation of future parameters [
7] (pp. 71–80). This issue is currently being considered as a potential element of expanding the production estimation model.
This study will include an analysis of the factors that influence the scale of coal demand, both in the current fuel and energy structure and in the future, as shaped by changing legal and environmental regulations. Demand will be verified in terms of the production capacities of mines, in conjunction with the dynamic resource base. In order to correctly determine future demand well in advance, it was decided to use artificial intelligence algorithms to forecast demand and adjust production to actual market needs. Hence, the scope of the project includes a description of the mathematical model and the testing of forecasting methods.
The final outcome of the project is the development of a pilot IT system for the dynamic management of demand for hard coal of a specific quality, taking into account the production capacities of mines and the logistics of its distribution, and based on domestic resources. Work on the system is currently at the module development stage. Details of the architecture and the status of the work are described in the following chapters.
1.1. Theoretical Framework: Linking JIT to Energy Transition
Just in time (JIT) is traditionally framed as a lean operations paradigm that eliminates waste by synchronizing flows and minimizing inventories. In research on sustainability-oriented operations, JIT and broader lean bundles are increasingly discussed as “green-lean” mechanisms that can lower environmental externalities by compressing lead times and transport and storage needs—thereby reducing energy use and emissions across supply chains (conceptually aligning operational efficiency with decarbonization). Recent reviews confirm that, within Industry 4.0 contexts, JIT-like synchronization and visibility are pivotal enablers of supply chain decarbonization and environmental performance improvements (e.g., cloud analytics or digital integration with suppliers) [
8] (pp. 437–460) and that collaborative, mapped supply chains accelerate emission reductions through coordinated operations [
9]. Scholarship on energy transitions emphasizes that decarbonized electricity/heat systems seeking to maintain reliability and affordability require flexibility and tight cross-vector coordination, with real-time adjustments to demand and supply. A recent review of integrated low-carbon gas–electricity operation highlights how system-level flexibility (storage, demand response, and interconnection) supports renewable integration and reduces curtailment—outcomes analogous to JIT’s waste elimination via timely provisioning [
10]. Complementarily, formal classifications of demand response provide tractable optimization formulations for load shifting and recovery that operationalize “pull-like” scheduling at system scales. Under Fit for 55 and Poland’s just transition agenda, regulatory tightening and structural shifts amplify the value of synchronized planning and transparent demand signalling. Macro-economic assessments of Fit for 55 scenarios document cost and competitiveness implications that make whole-system, coordinated operations indispensable, and policy analyses of Poland’s transition argue for cross-actor governance and time-bound sequencing, reinforcing the need for a JIT-like synchronization of resources and logistics [
11].
Our approach conceptualizes JIT for Energy Transition as a macro-operations framework where (i) inventories of coal are minimized across nodes; (ii) production and dispatch are driven by validated, scenario-based demand signals; (iii) data integration enables timely pull across producers, distributors, and clients; (iv) uncertainty is addressed through scenario design and adaptive re-planning. This extends plant-level JIT approaches to national resource balancing under decarbonization constraints and aligns with modern formulations of flexibility and demand-side coordination [
12].
1.2. Related Work and Recent Advances (2019–2025)
Green JIT and Industry 4.0. A review of the state of the art reveals that synchronizing flows via JIT, supported by digital enablers (IoT/cloud analytics), is statistically associated with better environmental performance and is a credible pathway to decarbonization [
8]. Reviews and modelling studies indicate that decarbonized systems can maintain reliability through combined flexibility resources—storage, demand response, and interties—thereby reducing the need for carbon-intensive reserve buffers [
10]; demand response formulations provide the mathematical mechanisms for “JIT-like” load coordination. Empirical analyses of Poland highlight territorially differentiated pathways and the need for granular coordination across firms and institutions—organizationally congruent with JIT’s governance of decision rights and flow discipline [
11].
1.3. Theoretical Contribution
We extend JIT from intra-plant flow control to macro-level resource coordination under decarbonization, formalizing a sector-scale “pull” that links demand signals to upstream extraction/processing—bridging lean operations with energy system planning [
10]. We embed policy- and price-contingent scenarios (e.g., regulation intensity and cross-fuel spreads) directly into the demand signal, coupling JIT control with exogenous transition trajectories—an integration rarely formalized in the JIT literature but required in energy transitions. Our multivariable forecasting (
E(
t),
C(
t),
G(
t),
O(
t),
I(
t),
R(
t), and
S(
t)) attributes minor historical fluctuations to specific drivers (policy intensity or alternative energy prices), strengthening explanatory power beyond the dominant linear decline and enabling takt-like scheduling at sector scales [
10].
Institutional architecture for JIT. We operationalize the theory via the Coal Platform (roles, reporting cadences, and analytics), mapping lean governance to public-sector IT and policy stacks—advancing how JIT can be embedded institutionally in just transition contexts [
11].
2. Coal Platform
In view of the growing demands associated with the energy transition and the need to precisely balance supply and demand for hard coal, the concept of the Coal Platform was developed to provide an information system supporting dynamic resource management in an economy implementing a decarbonised energy mix [
13]. The aim of the platform is to integrate data on both production and demand, enabling their analytical comparison in real time. The key objective is to balance the long-term and dynamic needs of consumers with the production capabilities of mines, taking into account coal grade quality and mining schedules. The system will be fed with data of varying frequency, and its implementation requires the adaptation of legal regulations and the creation of dedicated reporting tools for distribution points.
2.1. Architectural Concept of the Coal Platform
The concept of an information system designed to support the dynamic management of hard coal demand, production, and distribution in an economy focused on decarbonisation is founded upon the integration of production and demand data [
14]. A key element of this vision is the compilation and analysis of these data using a common analytical platform [
15], which enables the effective balancing of supply and demand. The proposed system, provisionally referred to as the Coal Platform, is intended to be a central tool enabling the collection, processing, and visualization of data that was previously scattered and updated in different cycles. The Coal Platform is designed to enable effective resource management by aligning IT tools and decisions with business objectives, and by ensuring appropriate roles are assigned to these tools (i.e., that their organizational and technical design is appropriate) [
16] (p. 269), as well as to facilitate the rapid flow of information both from the coal supply side (production) and the coal demand side (large and small customers) ([
17], and [
18] (pp. 107–146)). Furthermore, according to Szymczak [
19] (pp. 759–776), the proper flow of resources and goods is ensured through proper information management.
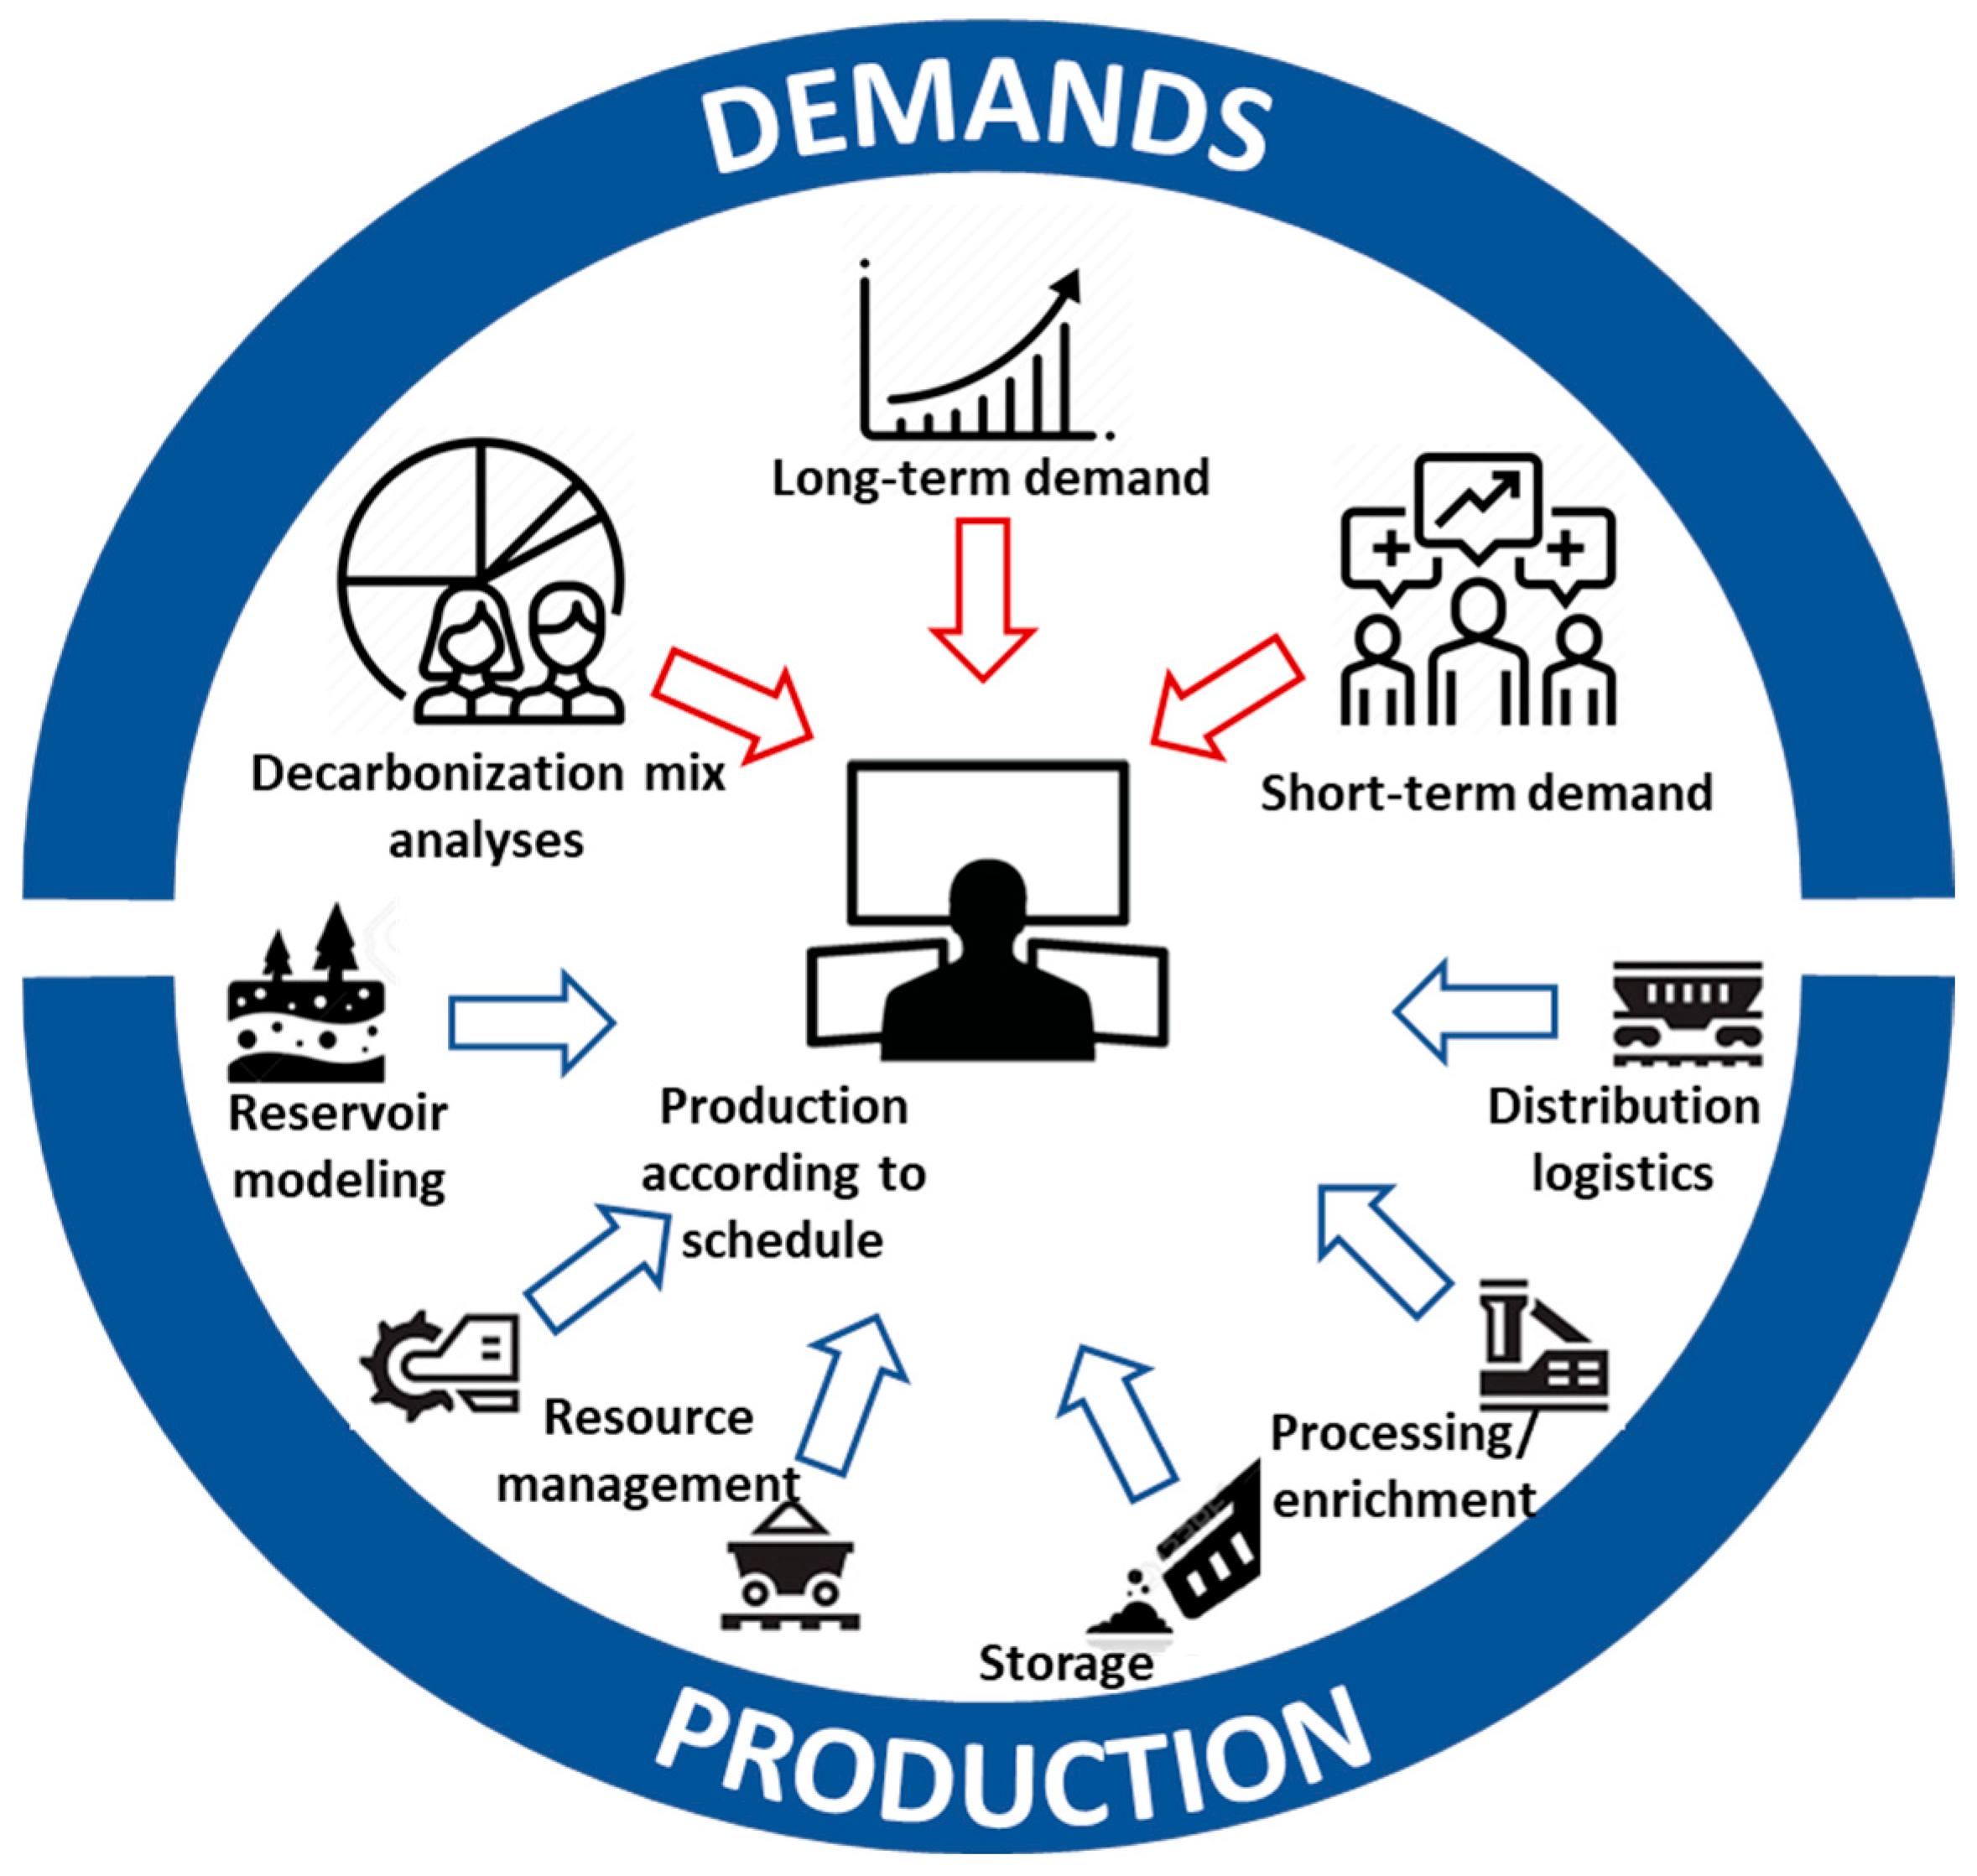
The target structure and functionality of the platform are illustrated in the diagram below (
Figure 1).
The concept consists of demand and production components, which should balance each other out. The demand component consists of the following elements [
20] (p. 223):
Long-term demand, which consists of:
- ○
Recording long-term contracts;
- ○
Recording continuous coal supplies.
Dynamic demand, including recording demand for the coming season and demand from end users.
Analysis of the decarbonisation mix, where information that is necessary for multidimensional analyses in thermal coal mining management and for achieving the goals of increasing Poland’s GDP and creating new jobs is collected [
21].
The section on production consists of the following elements [
22] (pp. 448–457):
Modelling and scheduling of deposits consisting of data on:
- ○
The resource potential of a mine;
- ○
Mining schedules and production capacity for individual mines.
Production based on data reflecting raw coal extraction (quantitative and qualitative) [
23].
Processing, including data on finished coal products (quantitative and qualitative).
Sales and distribution, where data on sales and distribution volumes will be entered into the system, taking into account quality parameters and breakdown by coal grade.
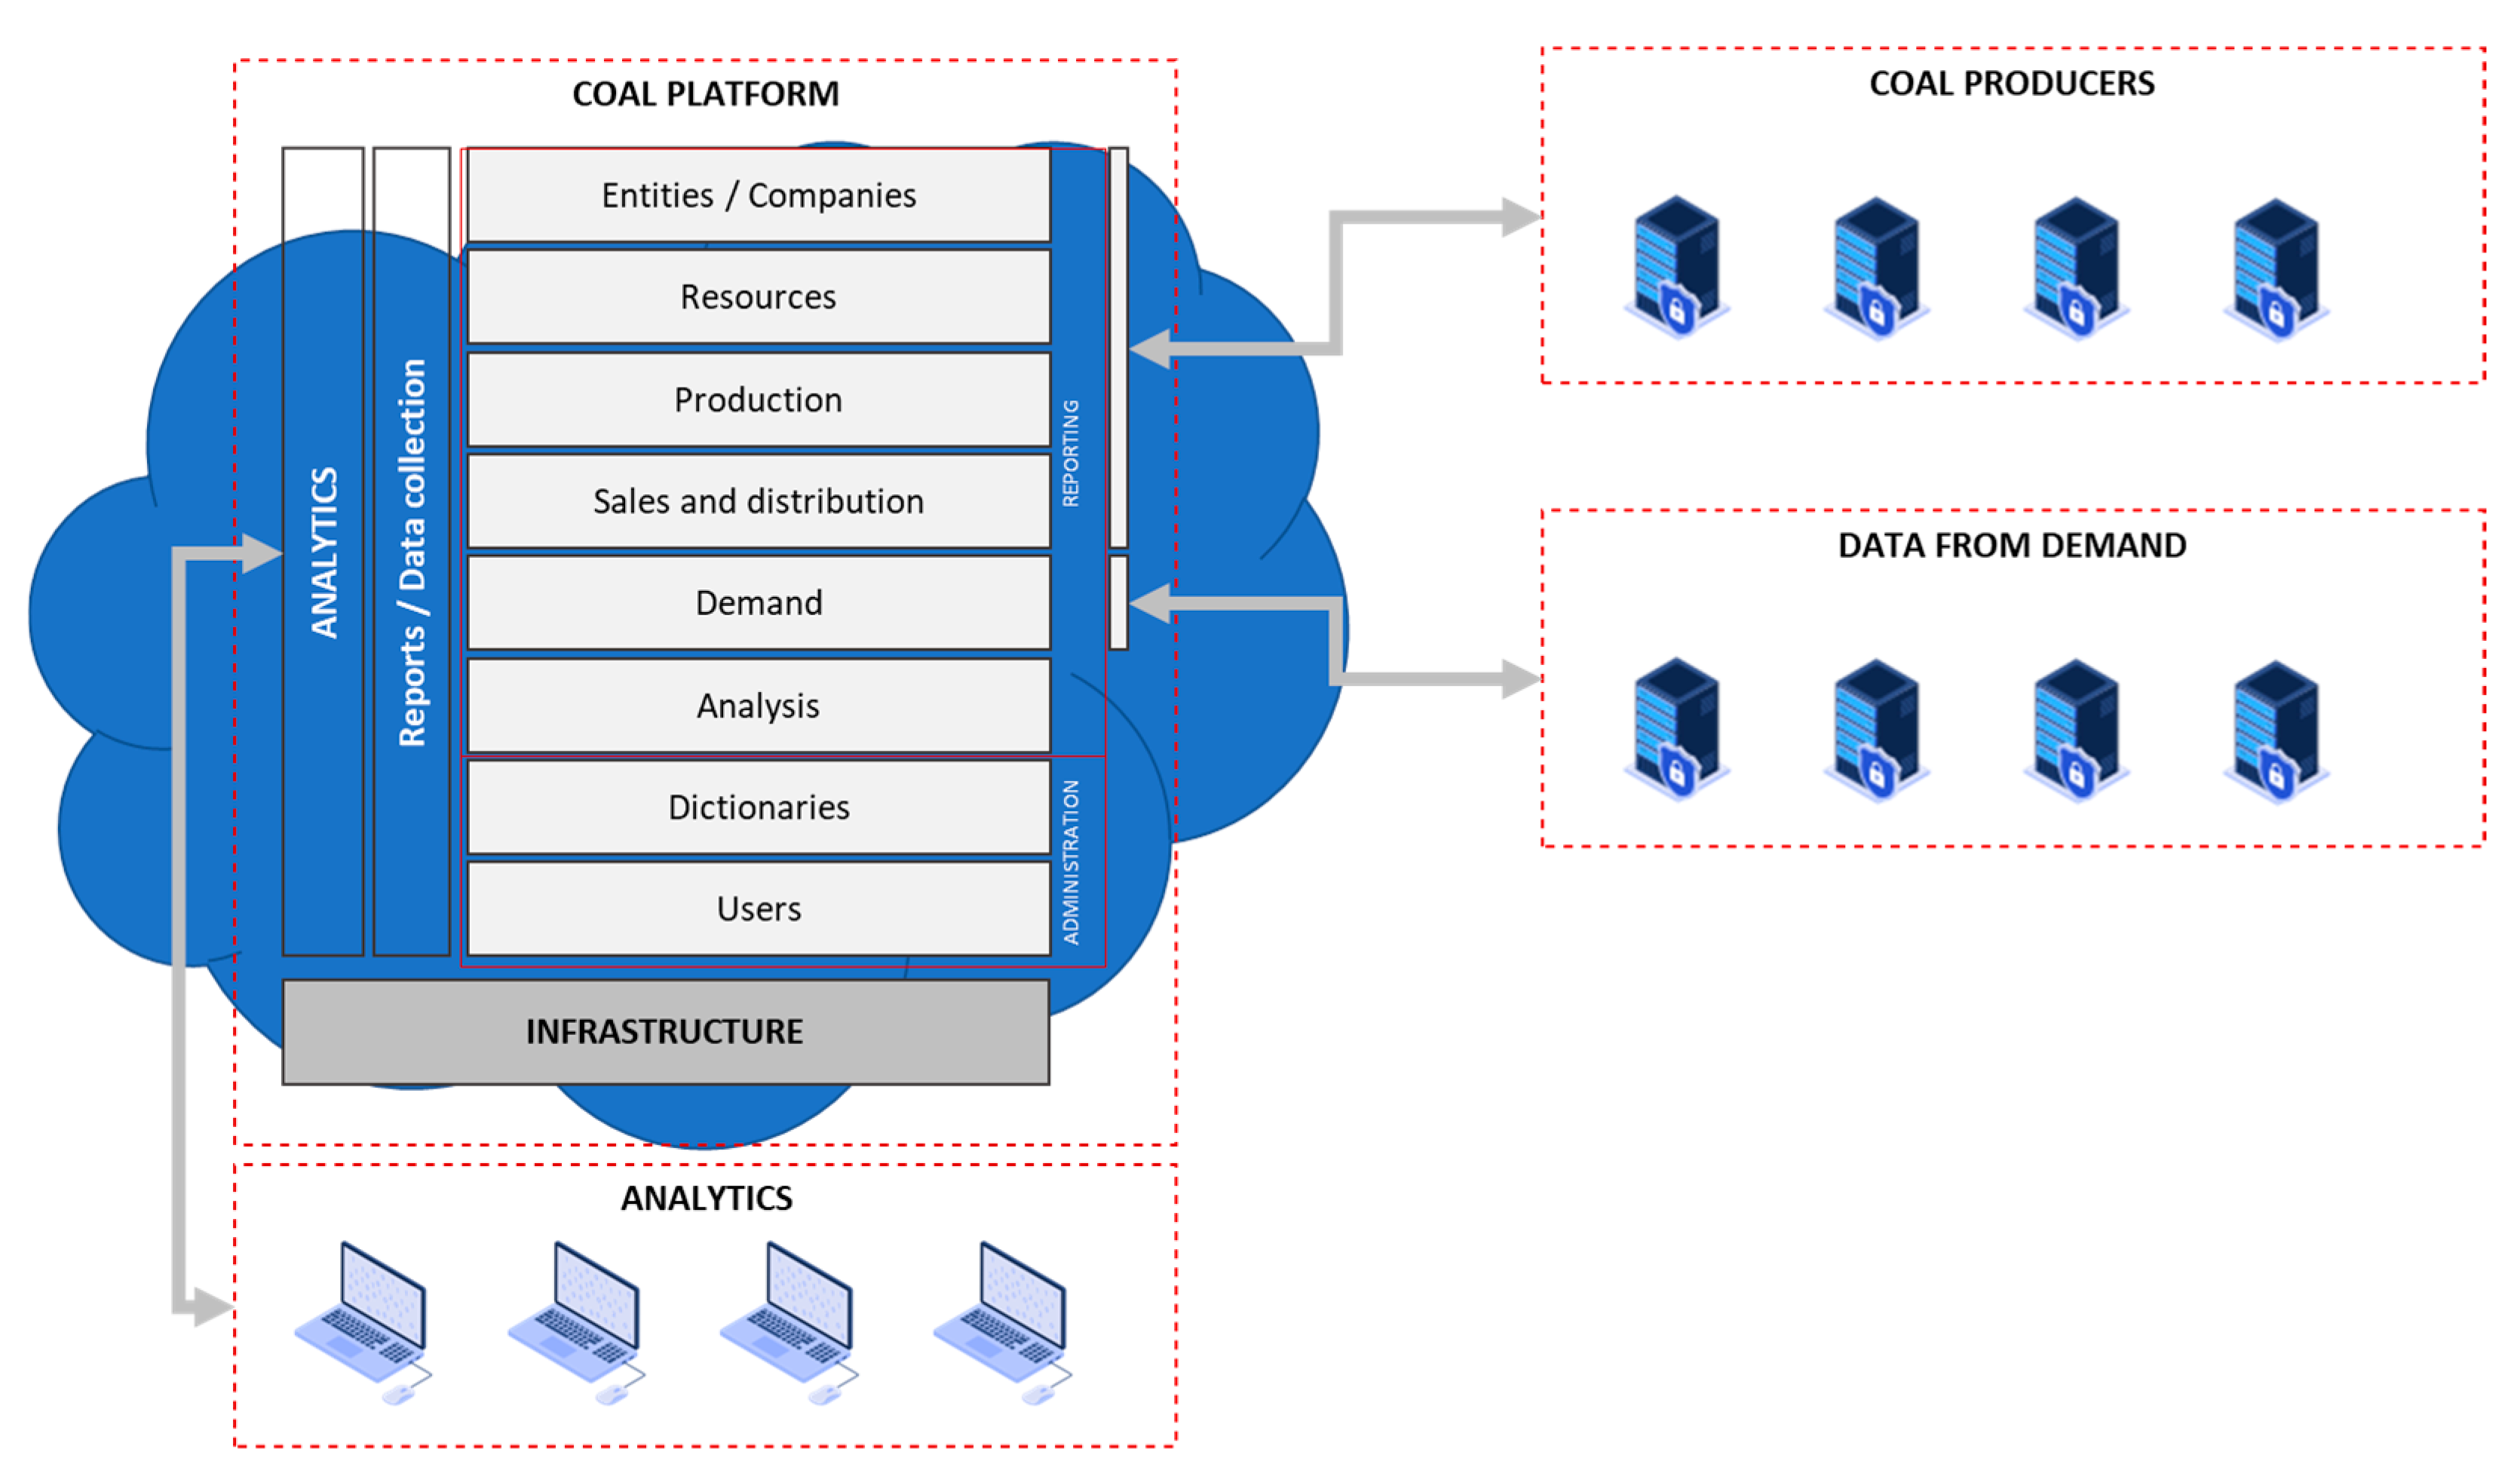
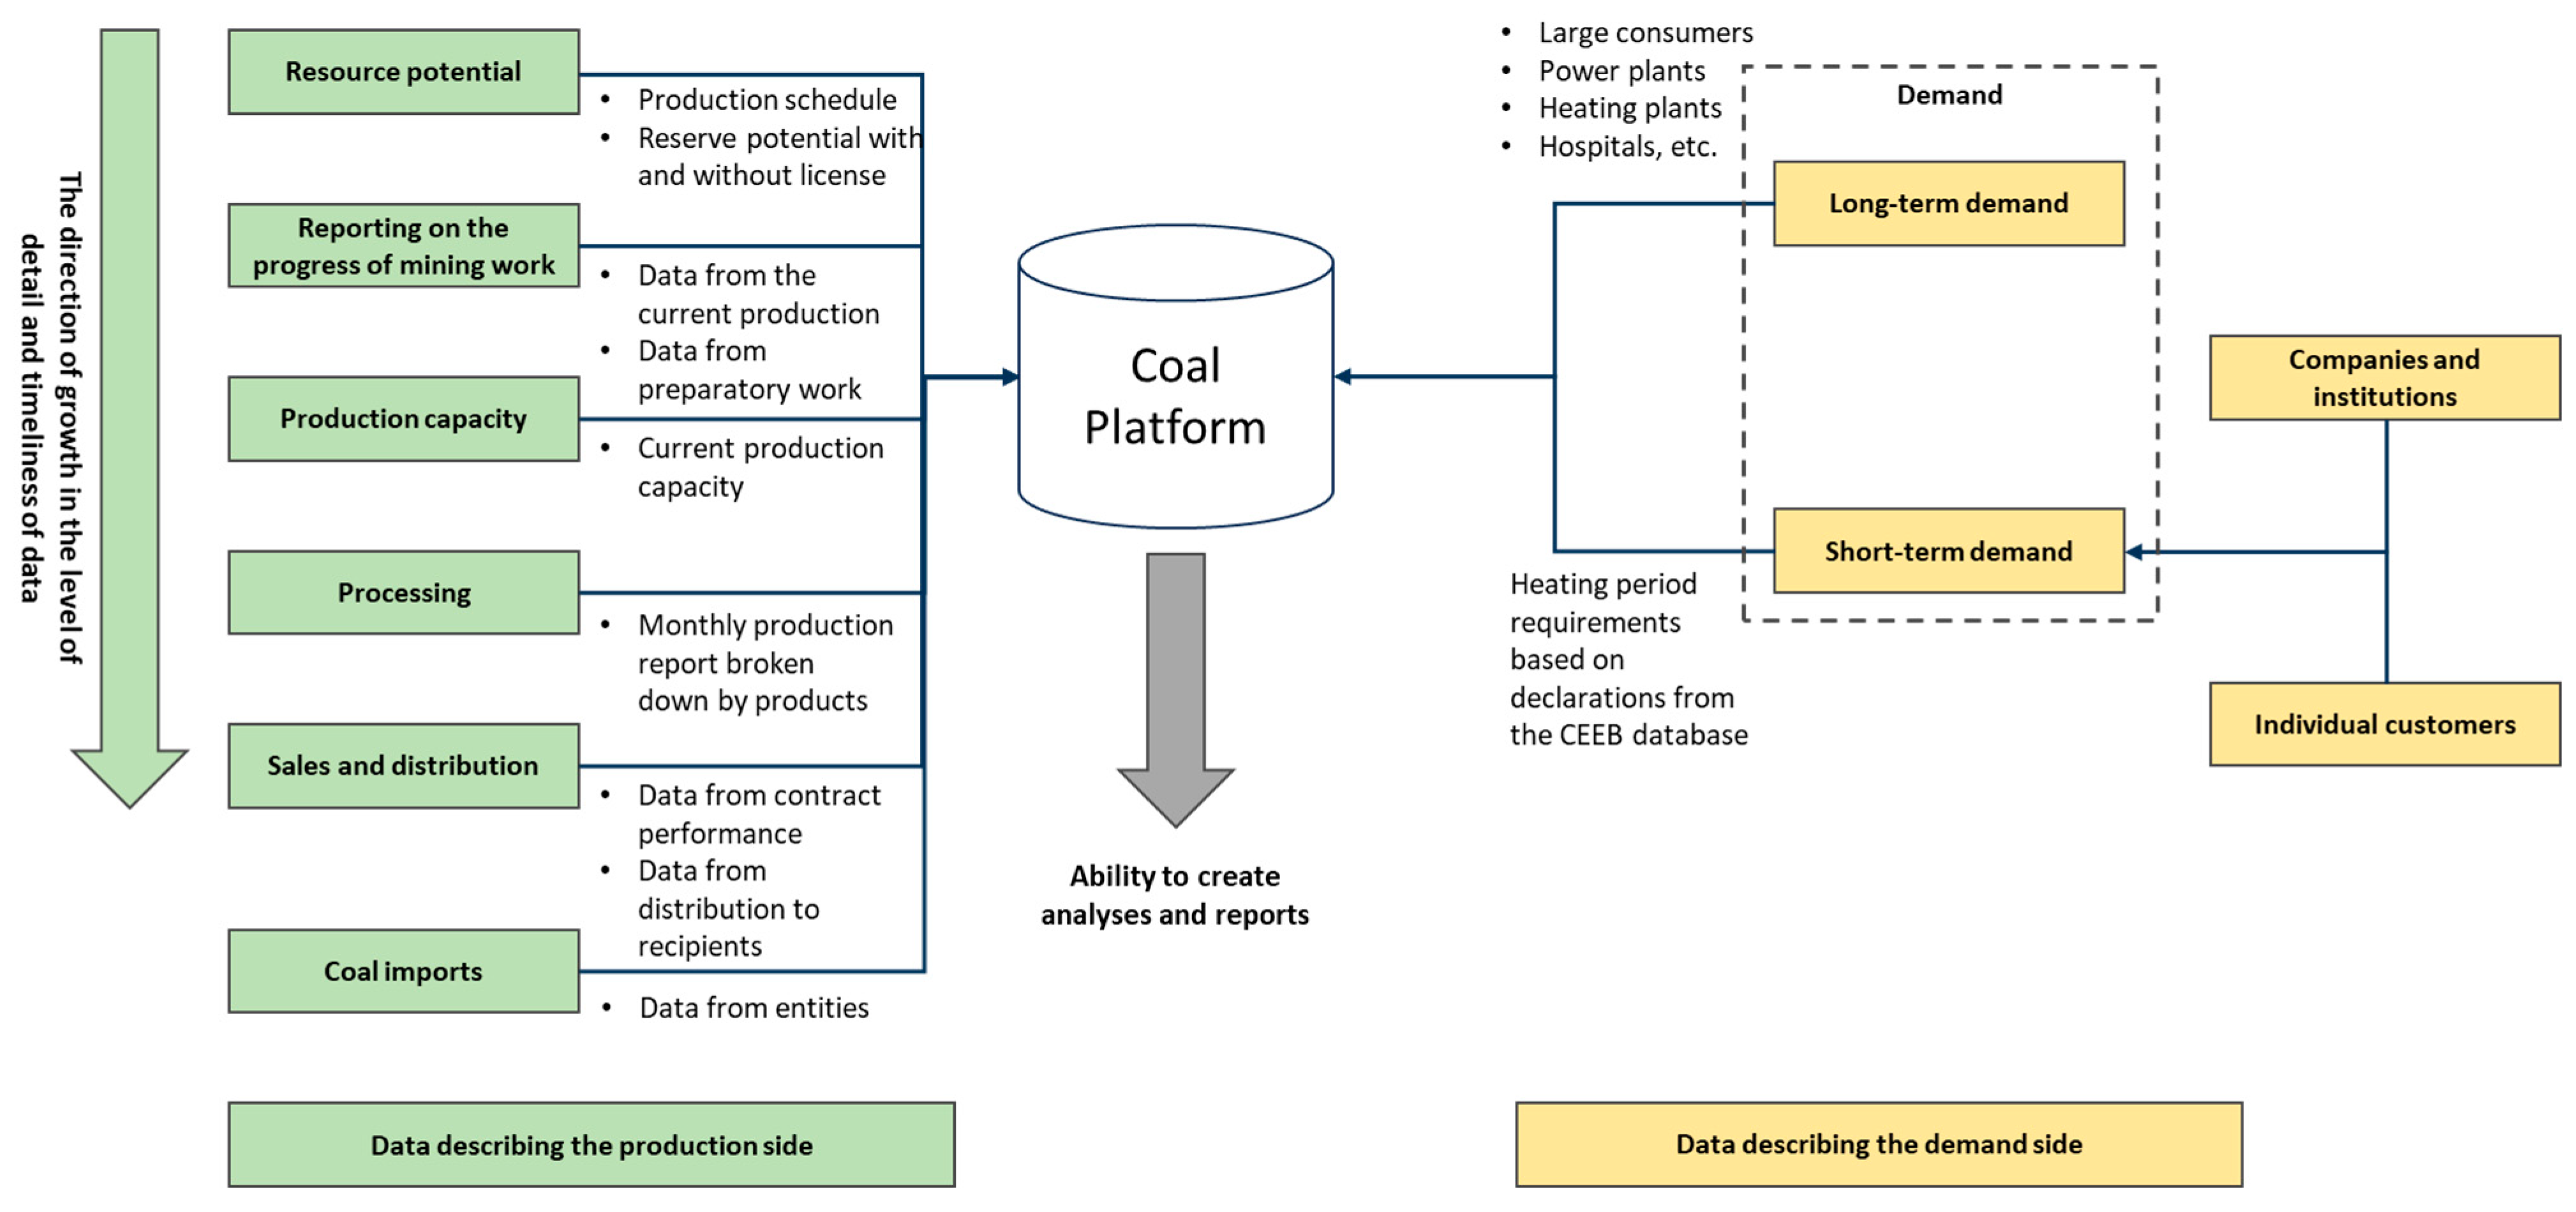
The vision of the Coal Platform’s operation is presented in a slightly different cross-section in the figure below (
Figure 2). The left side presents data that will be entered into the system at varying frequencies, taking into account the deadlines set by the mines; for example, data on resource potential will be determined once a year, while the production schedule will be updated once a month. In the case of data on sales and distribution agreements for assortments, the transfer will be carried out on an ongoing basis.
When it comes to feeding demand data into the system, at least two dynamics are assumed. Namely, at the level of long-term demand, the data will come from long-term contracts with large consumers of thermal coal, such as power plants or heating plants [
24]. A model enabling the determination of the necessary parameters will be used to enter data describing long-term demand. Fresh projections of strategic demand based on this model will be created, for example, every six months.
Data on dynamic demand will be entered on set dates by distribution points, which will be responsible for collecting the relevant information from individual customers and businesses. This data will be entered using forms, where the product grades, their quantities and quality, and the type of customer will be defined [
25] (p. 3439). This approach to data collection will make it possible to develop analyses for consumers of thermal coal. The use of forms dedicated to the system’s distribution points will require the formulation and introduction of appropriate changes to the relevant legal regulations [
26] (p. 37).
2.2. Logical Architecture
The approach to architecture implementation is based on best practices in IT system design, both in terms of the general approach ([
27] (p. 472), [
28] (p. 447) and [
29] (p. 262))—taking into account the specific nature of the mining industry—and the role of IT systems in mining ([
30] (pp. 177–188), [
31] (pp. 993–1000), [
32], and [
33] (p. 1044)).
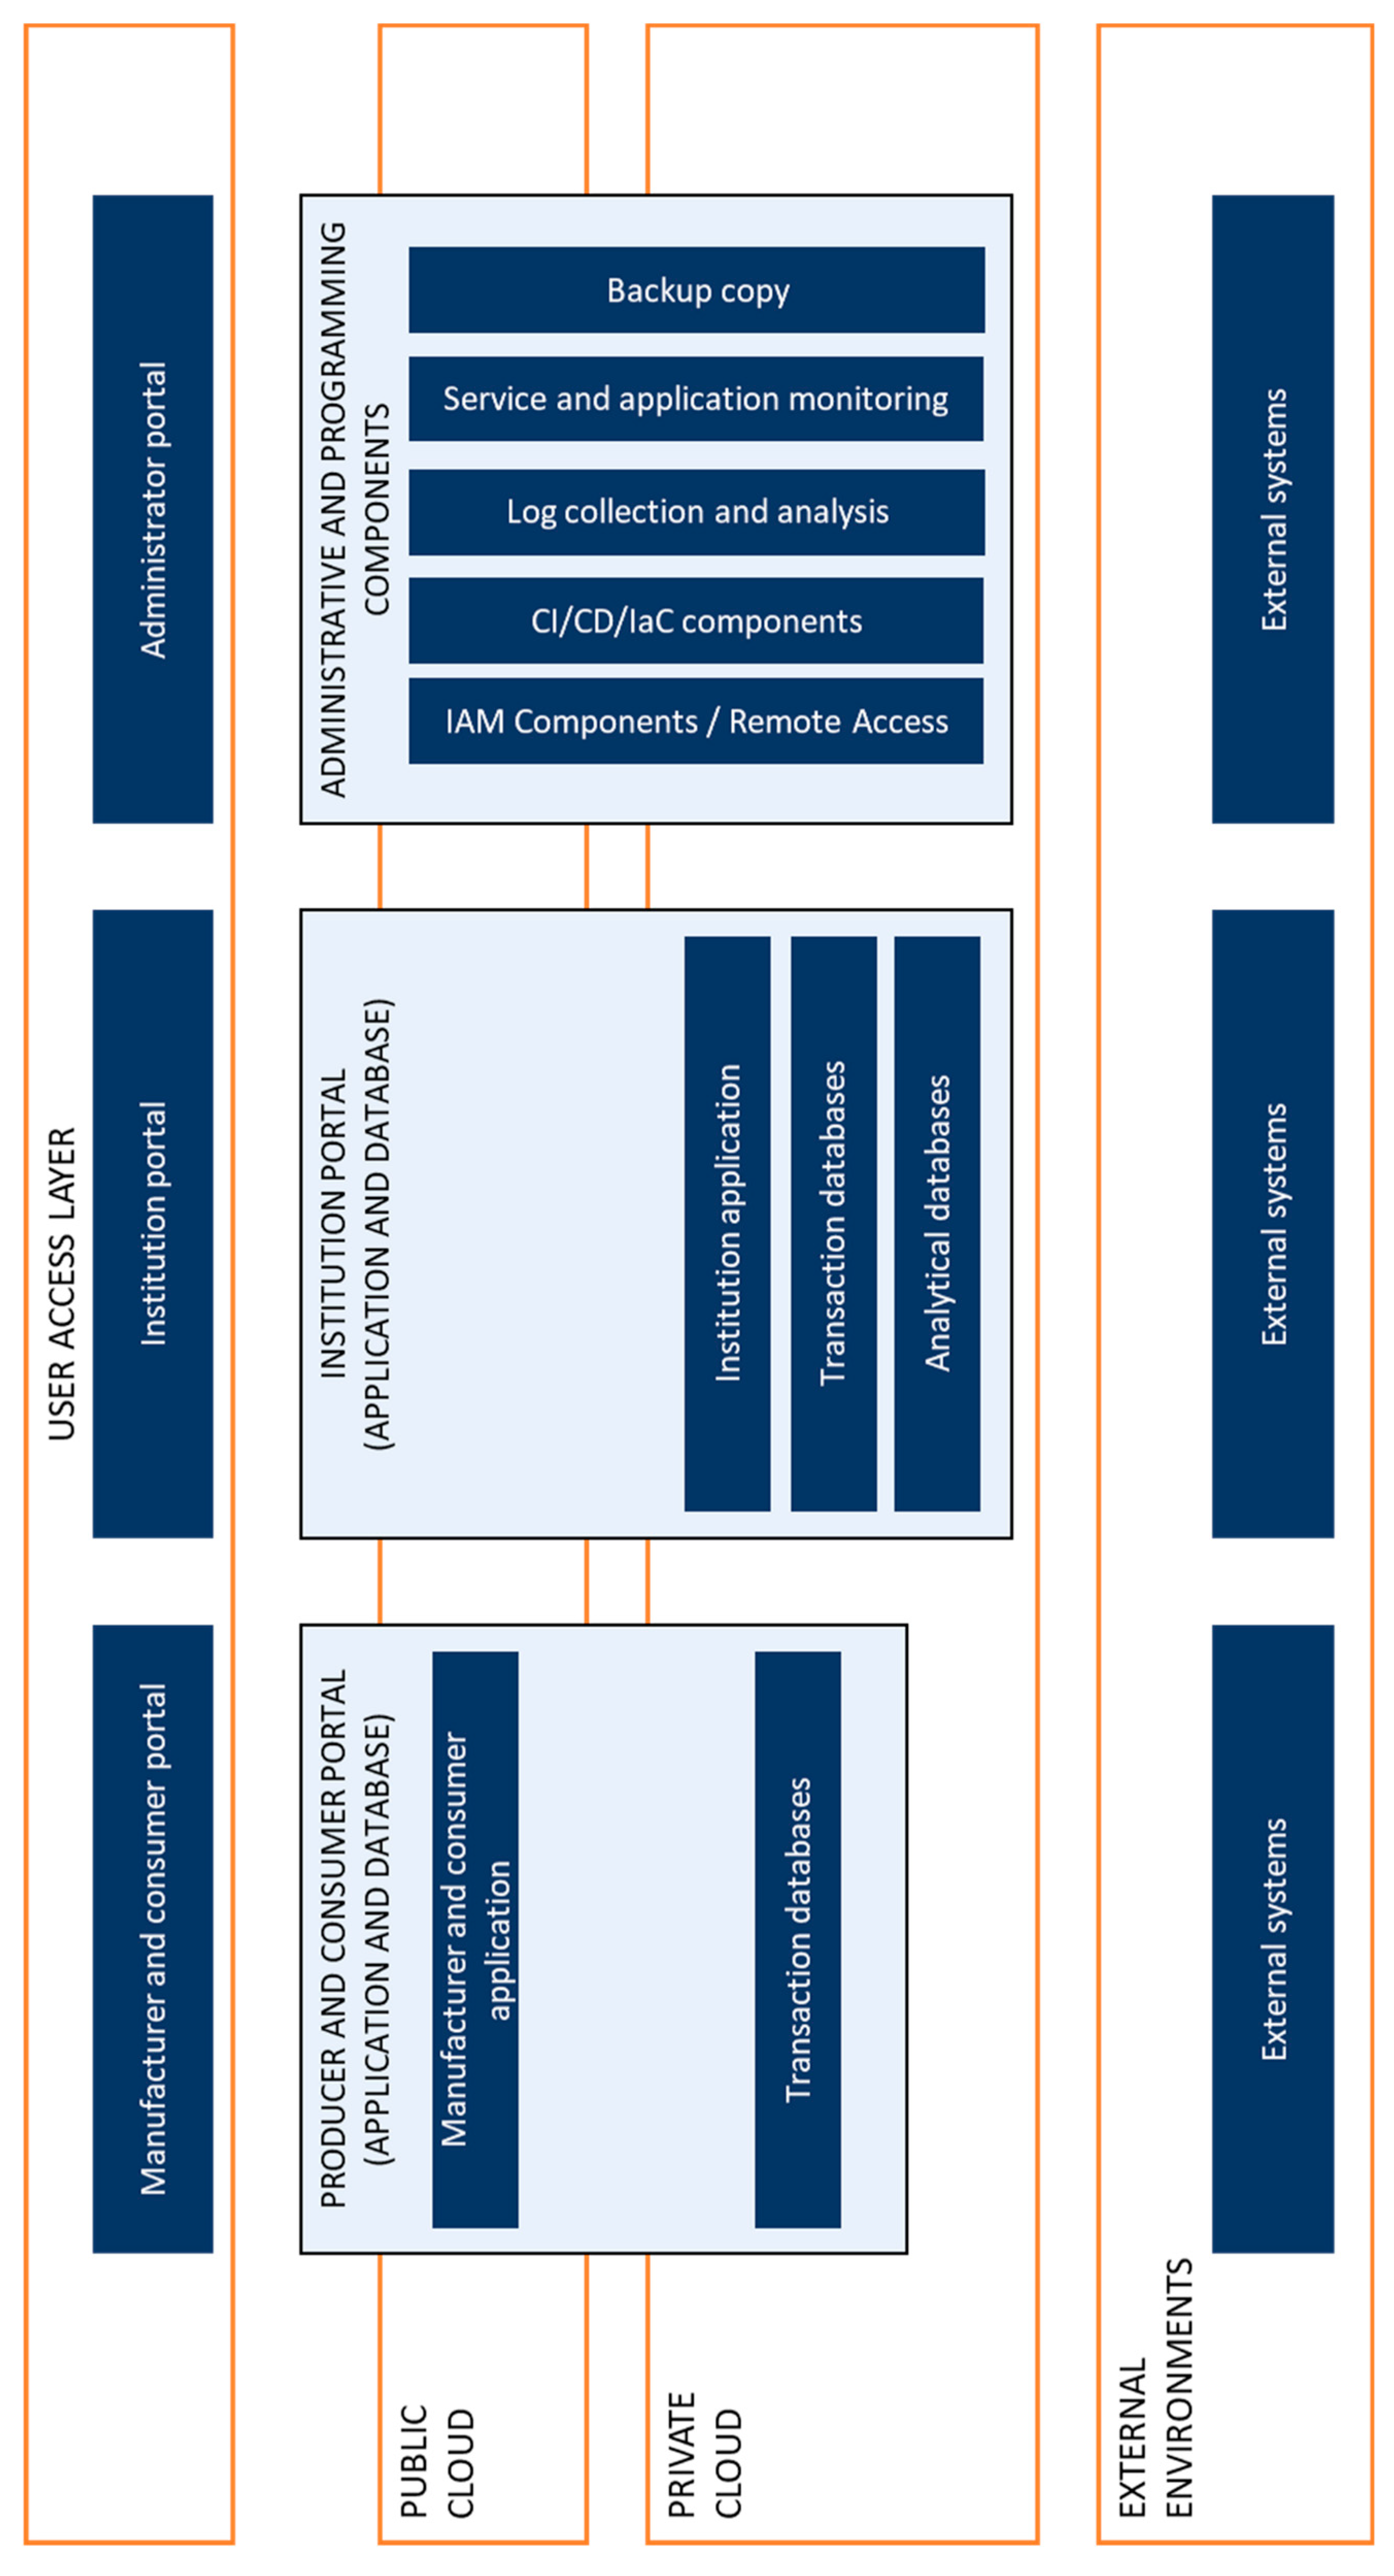
The architecture of the Coal Platform is divided into a section dedicated to producers and consumers in the coal market and a section aimed at institutional users. The architecture is divided into the following elements:
User access area (for producers, consumers, and institutions);
Presentation layer for portals;
Transaction layer for portals;
Analytical layer for portals;
Technical area for the Coal Platform.
A general diagram of the platform’s architecture is presented in the figure below (
Figure 3).
The architecture of the Coal Platform, divided into a section dedicated to producers and consumers in the coal market and a section aimed at institutional users, offers a number of benefits resulting from its modular structure. First and foremost, this makes it possible to precisely tailor the platform’s functionality to the needs of different user groups, which increases the operational efficiency of the system. The separation of layers—access, presentation, transactions, analytics, and technical area—allows for the independent development and scaling of individual components, which facilitates their maintenance and modernisation. This division also facilitates the implementation of advanced security and access control mechanisms, which are particularly important in systems of strategic importance to the economy. The presentation layer provides intuitive user interfaces that support decision-making based on the latest data, while the analytics layer enables real-time information processing, which is key to implementing a just-in-time strategy. The technical area ensures the stability and performance of the entire platform, enabling it to operate reliably even under heavy loads.
2.3. Coal Platform Modules
The Coal Platform’s operating model is based on grouping functionalities into individual modules, which are then made available to different roles (users). The modules of the Coal Platform are presented in
Figure 4.
Roles in the system are defined on the basis of the roles that given users perform in the energy commodities market. We distinguish the following three main categories of users:
Coal producers;
Customers (demand-side users)—who may be intermediaries in coal trading (providing services to individual customers) or bulk customers (power plants, steelworks, etc.);
Analysts (users from the Ministry of Industry).
The cloud layer contains all of the elements and functional components of the Coal Platform made available via an application providing high availability and secure data access.
The local layer contains groups that provide data to the Coal Platform, which includes demand and production data. In addition, an analytical component is available that makes it possible to balance both sides of the model and respond dynamically to changes in demand.
Ultimately, PW will contain the modules shown in the above figure.
Coal producers will have access to the following sections:
- ○
Entities—where it will be possible to update data on entities participating in the production section;
- ○
Resources—where it will be possible to enter data on thermal coal resources;
- ○
Production—where it will be possible to enter data on current production volumes broken down by product grade;
- ○
Sales and distribution—where it will be possible to enter data on contracts with producers and on distribution resulting from the implementation of these contracts.
Some customers (using the Demand module) will have access to the section for entering information on long-term demand (supply contracts).
Some customers (using the Demand module) will have access to the section for introducing information about short-term demand (deliveries not exceeding deliveries for a given season).
All customers (using the Demand module) will also have access to the Entities module, where they will update the data on entities participating in distribution.
Producers and customers will have access to basic reports on the extraction and sale of coal.
Analysts at the Ministry of Industry level will have access to analytics, reports, and data collection in order to prepare strategic interventions at the state level and to ensure that the strategic reserves necessary for the continuation of critical state-level processes (e.g., heat supply, electricity production, etc.) are adequate.
2.4. The Uniqueness of the Solution
The Coal Platform offers not only current reporting information and raw material production plans, but also up-to-date information on short- and long-term demand.
Significant factors that can disrupt the balance of the system include, on the one hand, failures and inefficiencies in production and, on the other hand, environmental volatility (e.g., climate, raw material prices, alternative energy sources, etc.). Demand forecasting can be based on seasonality and historical data, but there are many different parameters that can influence the estimation of future demand (both in the short and long term). Accurate forecasting should be based on artificial intelligence methods that allow for various parameters to be considered and the most likely demand scenarios to be presented.
2.5. Feasibility and Implementation Considerations
The Coal Platform is currently implemented on Microsoft Azure using a cloud-native architecture to ensure scalability, security, and compliance. The solution leverages the Azure Kubernetes Service (AKS) for container orchestration and Azure App Services for hosting web portals. Data storage is based on the Azure SQL Database for structured production and demand records, ensuring transactional integrity and compatibility with reporting tools. Integration with external systems (mines, distribution hubs, and institutional portals) is achieved via Azure API Management and secure protocols (HTTPS and OAuth 2.0). Analytical components will utilize Azure Machine Learning for AI-driven forecasting and scenario simulation, ensuring seamless deployment and model lifecycle management.
Data ingestion will follow an Azure Data Factory pipeline with three stages: (i) extraction from source systems (mine ERP and distribution forms), (ii) transformation and validation, and (iii) loading into the analytical layer. Long-term demand data is updated biannually, production schedules are updated monthly, and dynamic demand is updated weekly or on demand. Automated validation routines in Azure Synapse Analytics will check for completeness, outliers, and compliance before triggering analytics workflows.
Key constraints include data-sharing agreements between producers and institutional actors, requiring legal harmonization and secure access control via Azure Active Directory (AAD) and Role-Based Access Control (RBAC). Compliance with GDPR and national energy data regulations introduces additional costs for anonymization and audit trails, which will be managed through Azure Policy and Azure Monitor. Initial deployment also faces integration costs pertaining to adapting legacy mine systems to API-based exchange and training costs for end users. To mitigate these, phased onboarding and standardized reporting templates are planned, supported by Power BI dashboards for intuitive analytics.
3. Methodology for Forecasting Demand
The aim of the study is to develop a preliminary model for forecasting hard coal demand in Poland in the context of implementing a just-in-time (JIT) strategy in the mining sector. The study is exploratory in nature and focuses on two main aspects: (A) identifying variables affecting demand and (B) assessing the effectiveness of various forecasting methods in terms of modelling this demand.
3.1. Mathematical Model
The proposed model is based on the following multivariate regression equation with linear, non-linear, interactive, and delayed components:
where
Z(t) is demand for hard coal at time t (million tonnes);
E(t) is electricity production from coal (TWh);
C(t) is heat production from coal (PJ);
G(t) is the coal price (PLN/tonne);
O(t) is the price of alternative energy sources (PLN/MWh);
I(t) is industrial demand;
R(t) is the intensity of climate regulations (scale 1–10);
S(t) is seasonality (index);
E(t)·C(t) is the interaction between energy and heat production;
G(t)2 is the non-linearity of coal prices;
O(t − 1) is the price of alternatives from the previous period;
Z(t − 1) is the autoregression of demand;
ε(t) is a random component.
The above list of variables was selected from a much broader database of variables that were considered as potential candidates for inclusion in the mathematical model. The above selection was made by analyzing their impact on calculations and model disturbances.
The climate policy intensity variable R(t) was quantified on a 1–10 ordinal scale derived from the aggregation of regulatory milestones, emission reduction targets, and compliance costs published in EU and national policy documents. A score of 1 corresponds to minimal regulatory pressure (pre-Fit for 55 baseline), while 10 reflects full implementation of decarbonization measures aligned with 2050 carbon neutrality objectives. Intermediate values were interpolated based on scheduled legislative steps and carbon pricing trajectories.
The seasonality index S(t) was computed using normalized monthly consumption patterns from historical coal demand data (2010–2023), capturing intra-annual fluctuations. The index ranges from 0.85 (low-demand summer months) to 1.15 (peak winter demand), and is dynamically adjusted in forecasts to reflect projected changes in heating demand under energy transition scenarios.
To incorporate the dynamic nature of these variables, R(t) and S(t) were modelled as time-dependent inputs rather than static coefficients. R(t) evolves according to scenario-based policy tightening curves, while S(t) adapts to anticipated shifts in heating season length and temperature anomalies, ensuring that both regulatory and climatic variability are reflected in long-term forecasts.
The variables and data were obtained from reliable sources such as the Central Statistical Office (GUS), the Ministry of Climate and Environment, Eurostat, and the International Energy Agency (IEA). The data covered the years 2010–2023 and was used to make forecasts for the period 2024–2030.
Future values of explanatory variables (E(t), C(t), G(t), O(t), I(t), R(t), S(t)) for 2024–2030 were derived using a hybrid approach combining official projections and scenario-based assumptions. Electricity and heat production from coal (E(t) and C(t)) were extrapolated using historical trends calibrated against forecasts from the Energy Market Agency (ARE) and Eurostat. Industrial demand (I(t)) was estimated using macroeconomic growth projections from GUS and sectoral energy intensity factors. Coal and alternative energy prices (G(t) and O(t)) were modelled using historical volatility and adjusted according to the Fit for 55 policy assumptions. Climate regulation intensity (R(t)) was set based on anticipated EU targets, while seasonality (S(t)) followed historical patterns. To address uncertainty, three scenarios—baseline, optimistic, and restrictive—were prepared, and sensitivity analysis was performed to evaluate the impact of deviations on demand forecasts.
3.2. Variable Selection and Importance Analysis
To improve interpretability and practical utility, we assessed the relative importance of the explanatory variables using three complementary approaches: (i) standardized coefficients in ARX (inputs z-scored to unit variance), (ii) permutation importance in FLNN (drop in R
2/MAPE when randomly permuting a feature), and (iii) local sensitivity via ±10% perturbation tests on each input while holding others constant. Rankings were aggregated across the four top-performing models (ARX, IV4, FLNN, and RKHS) identified in
Section 4.1. The analysis indicates that coal-based electricity and heat output (
E(
t) and
C(
t)), price variables (
G(
t) and
O(
t)), and regulation intensity (
R(
t)) are the primary drivers of demand, while seasonality (
S(
t)), industrial demand (
I(
t)), and lagged terms refine short-term dynamics and improve stability. This is consistent with the nearly linear historical decline (
Figure 14), where structural changes in the power–heat mix dominate the long-run trajectory, and price/regulation shocks explain short-term deviations.
Note: The intercept
β0 is not treated as an explanatory variable in the ranking. Symbols follow those in
Section 3.1.
Prior to inclusion in the multivariable model, candidate variables were screened using quantitative criteria: Pearson correlation coefficients with demand (threshold |r| ≥ 0.3) and significance tests (p < 0.05) to ensure explanatory relevance. Variables failing these criteria were excluded from the final set.
To assess robustness, stress tests were conducted under extreme scenarios: (i) a coal price surge (+200%), (ii) maximum regulatory intensity (
R(
t) = 10), and (iii) atypical seasonal demand (+20% winter peak). Sensitivity analysis measured the elasticity of demand forecasts to ±20% perturbations in each variable, revealing that
G(
t) and
R(
t) exert the strongest influence under stress conditions, while
E(
t) and
C(
t) dominate baseline variability. These results (
Table 1) confirm the stability of the model structure and its ability to capture non-linear responses under volatile conditions.
3.3. Modelling Approaches
In order to identify the most effective method for forecasting coal demand, eight modelling approaches were used:
ARX—linear model with exogenous variables;
ARMA—classic time series model;
NARX—non-linear neural network with memory;
ARXNL—non-linear system identification model;
IV4—instrumental variables method;
GARCH—variance volatility model;
FLNN—functional neural network;
RKHS—reproducing kernel Hilbert space.
The effectiveness of the models was assessed using the following quality metrics:
MSE—mean square error;
RMSE—root mean square error;
MAE—mean absolute error;
MAPE—mean absolute percentage error;
R2—coefficient of determination.
The results were used to rank the methods and identify those that best reflect the relationships between variables and coal demand.
4. Research Results
As part of the study, a forecast of hard coal demand in Poland for 2024–2030 was made using eight different time series models and dynamic systems methods. The aim was to determine which approach best reflects the relationships between the variables affecting demand and provides the most accurate predictions.
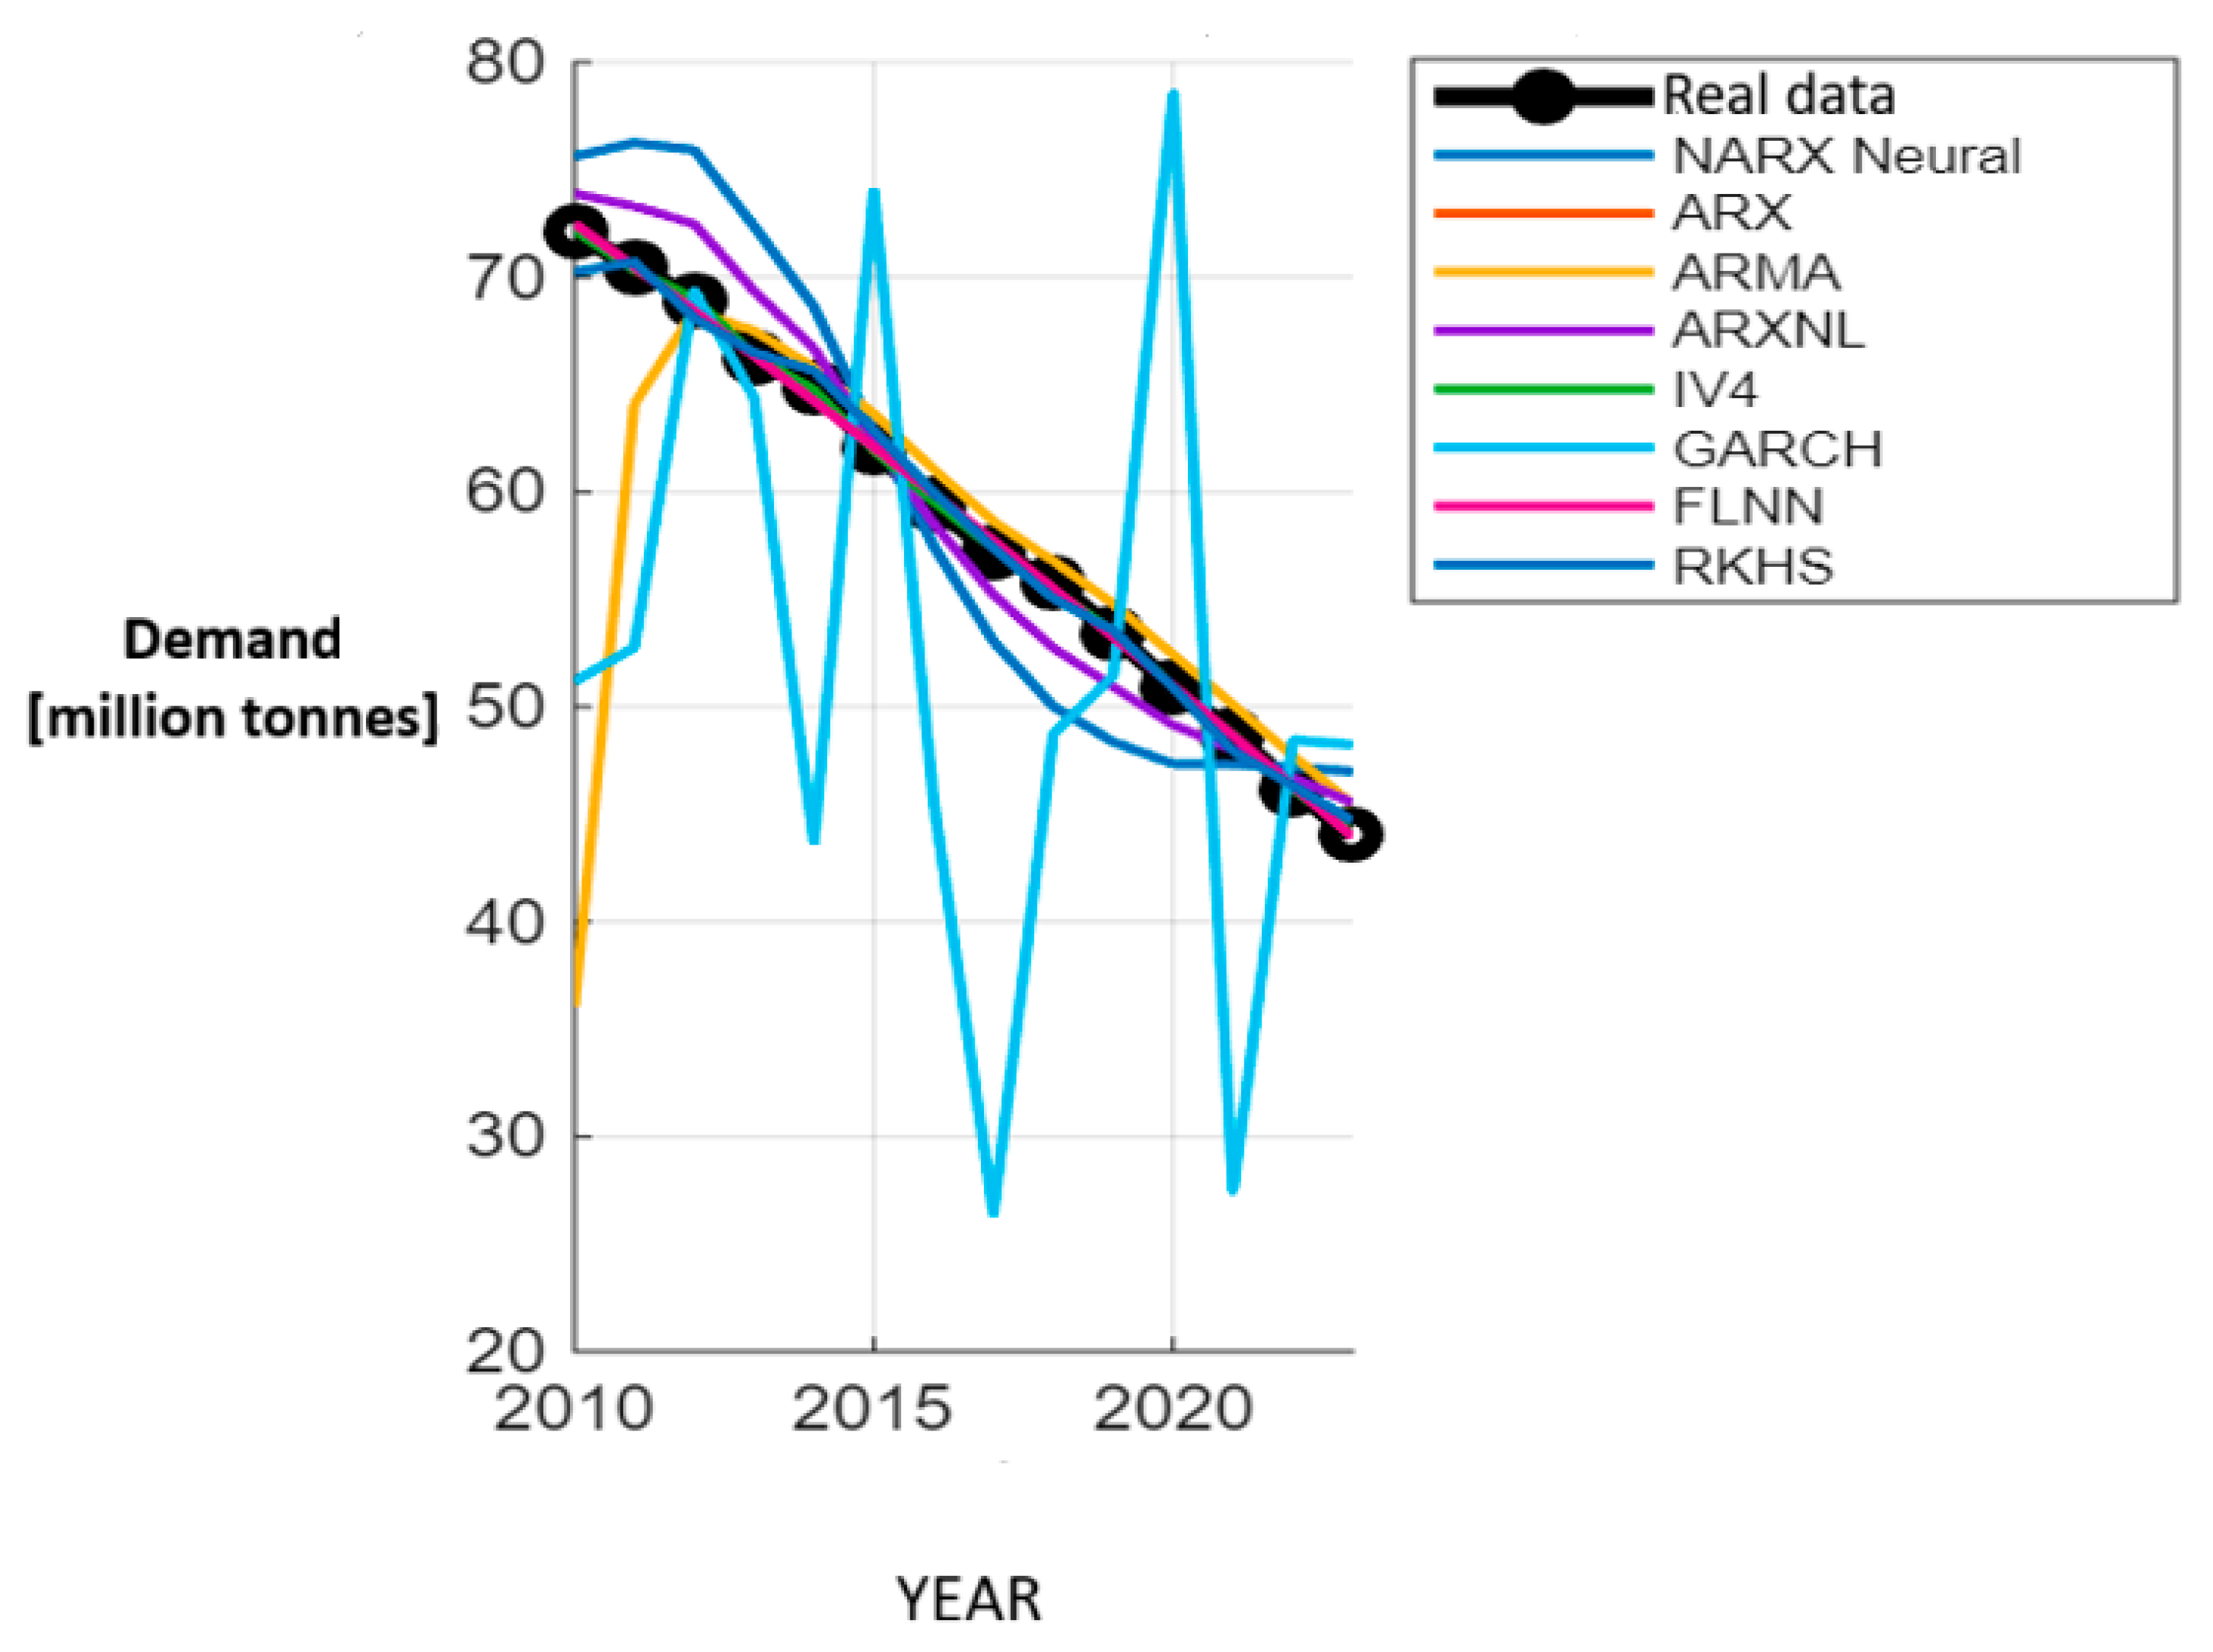
Each method was tested in terms of forecasting demand for hard coal. The data obtained was compared with actual data. A comparison chart is presented in the
Figure 5.
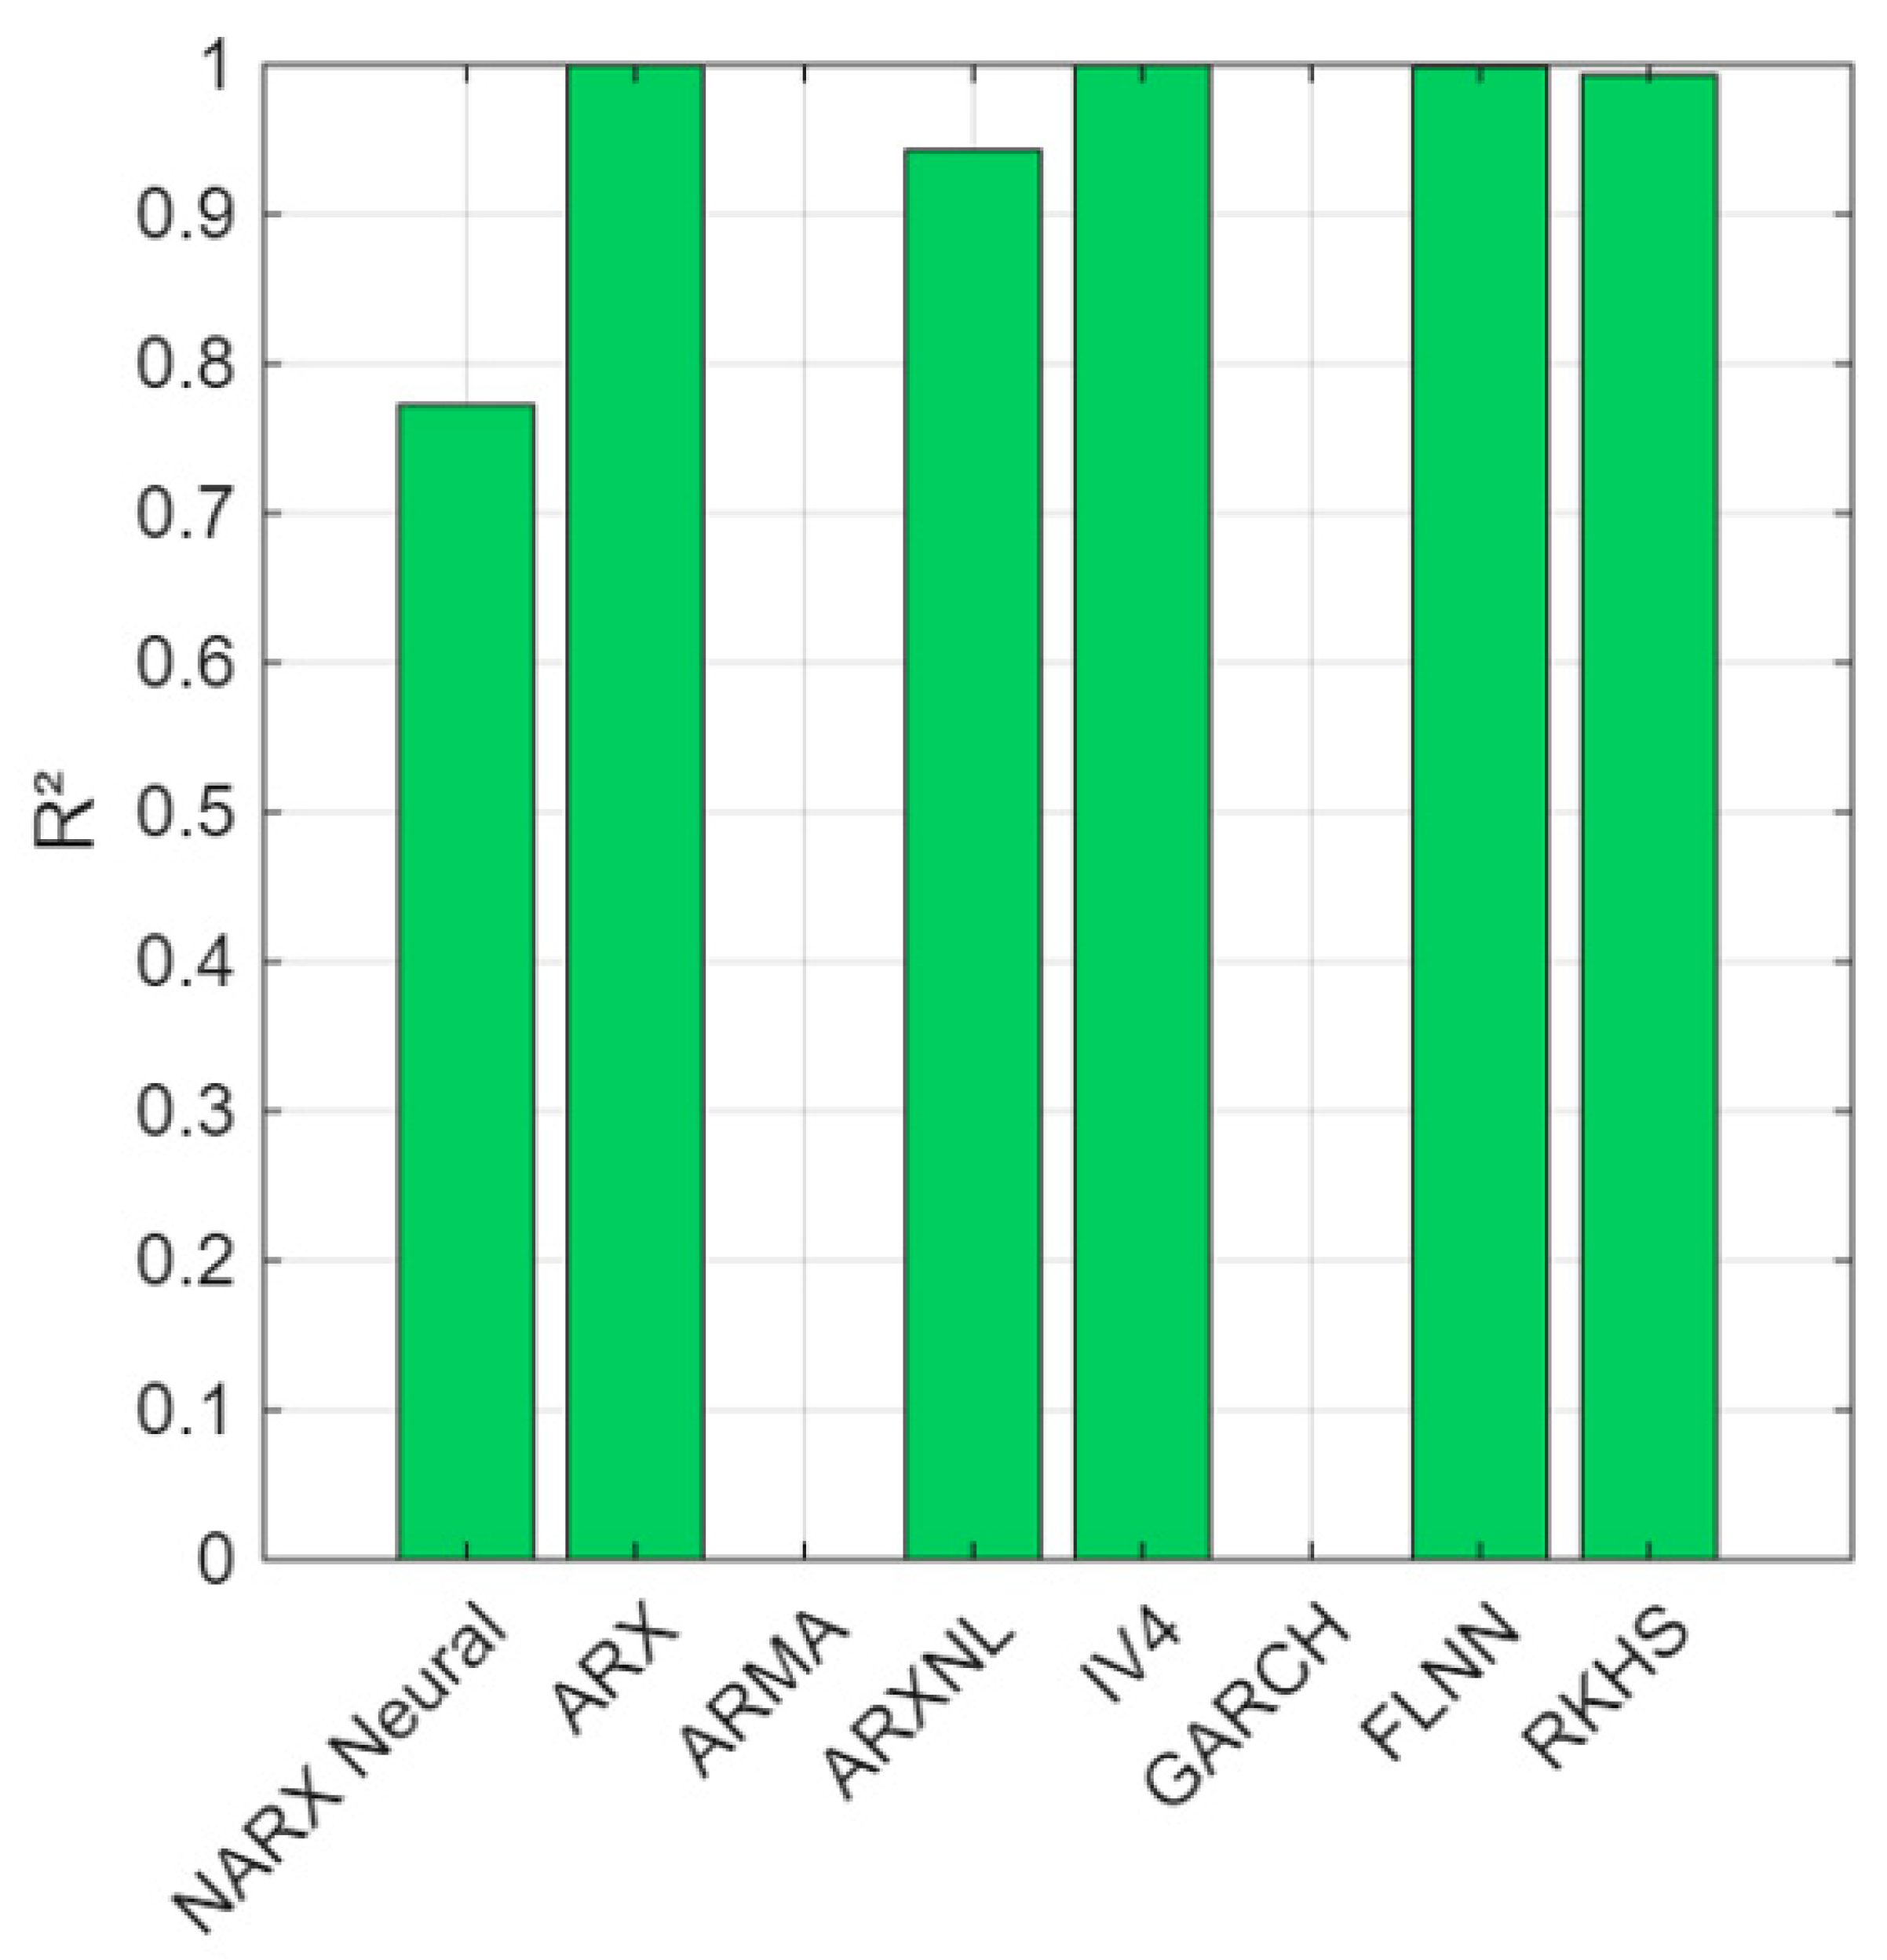
This graph enabled us to determine the most effective methods of data estimation, which were additionally verified using the graph of determination coefficients, which is an assessment of the quality of the forecasting models. The
x-axis represents the historical and forecast period (2010–2030). Due to compression, individual year labels may not be fully visible. The key interpretation is the relative performance of methods across the entire horizon—ARX, IV4, FLNN, and RKHS show the closest alignment with the actual data. For precise numerical results, refer to
Section 4.1 (
Table 2).
A comparison chart of methods related to R
2 values is presented on
Figure 6.
The R2 value determines what proportion of the variability of the dependent variable (in this case, demand for hard coal) can be explained by the independent variables included in the model. An R2 value close to 1 indicates a very good fit, while values close to 0 and negative values indicate poor prediction quality.
In this study, the following four methods achieved R2 values equal to or very close to 1.000: ARX, IV4, FLNN, and RKHS. This means that these models almost perfectly mapped the relationships between the input variables and coal demand, which makes them particularly promising in the context of the further development of the Coal Platform. Such a high R2 value suggests that the selected variables (energy and heat production, raw material prices, regulations, seasonality, etc.) are well chosen and have a strong impact on demand variability.
On the other hand, methods such as GARCH and ARMA obtained R2 values close to zero, which indicate mismatches between the model and the data and potential problems with capturing complex relationships or excessive sensitivity to statistical noise.
Based on these results, ARX, IV4, FLNN, and RKHS were selected as priority methods for further stages of predictive system development, both in terms of accuracy and stability. However, despite high R2 values, cross-validation and testing on data from future periods were planned to confirm the models’ ability to generalize. A potential extension of the model is also being analysed; i.e., its further enrichment with additional variables such as geographical data, demand volatility in the retail sector, or the impact of international politics.
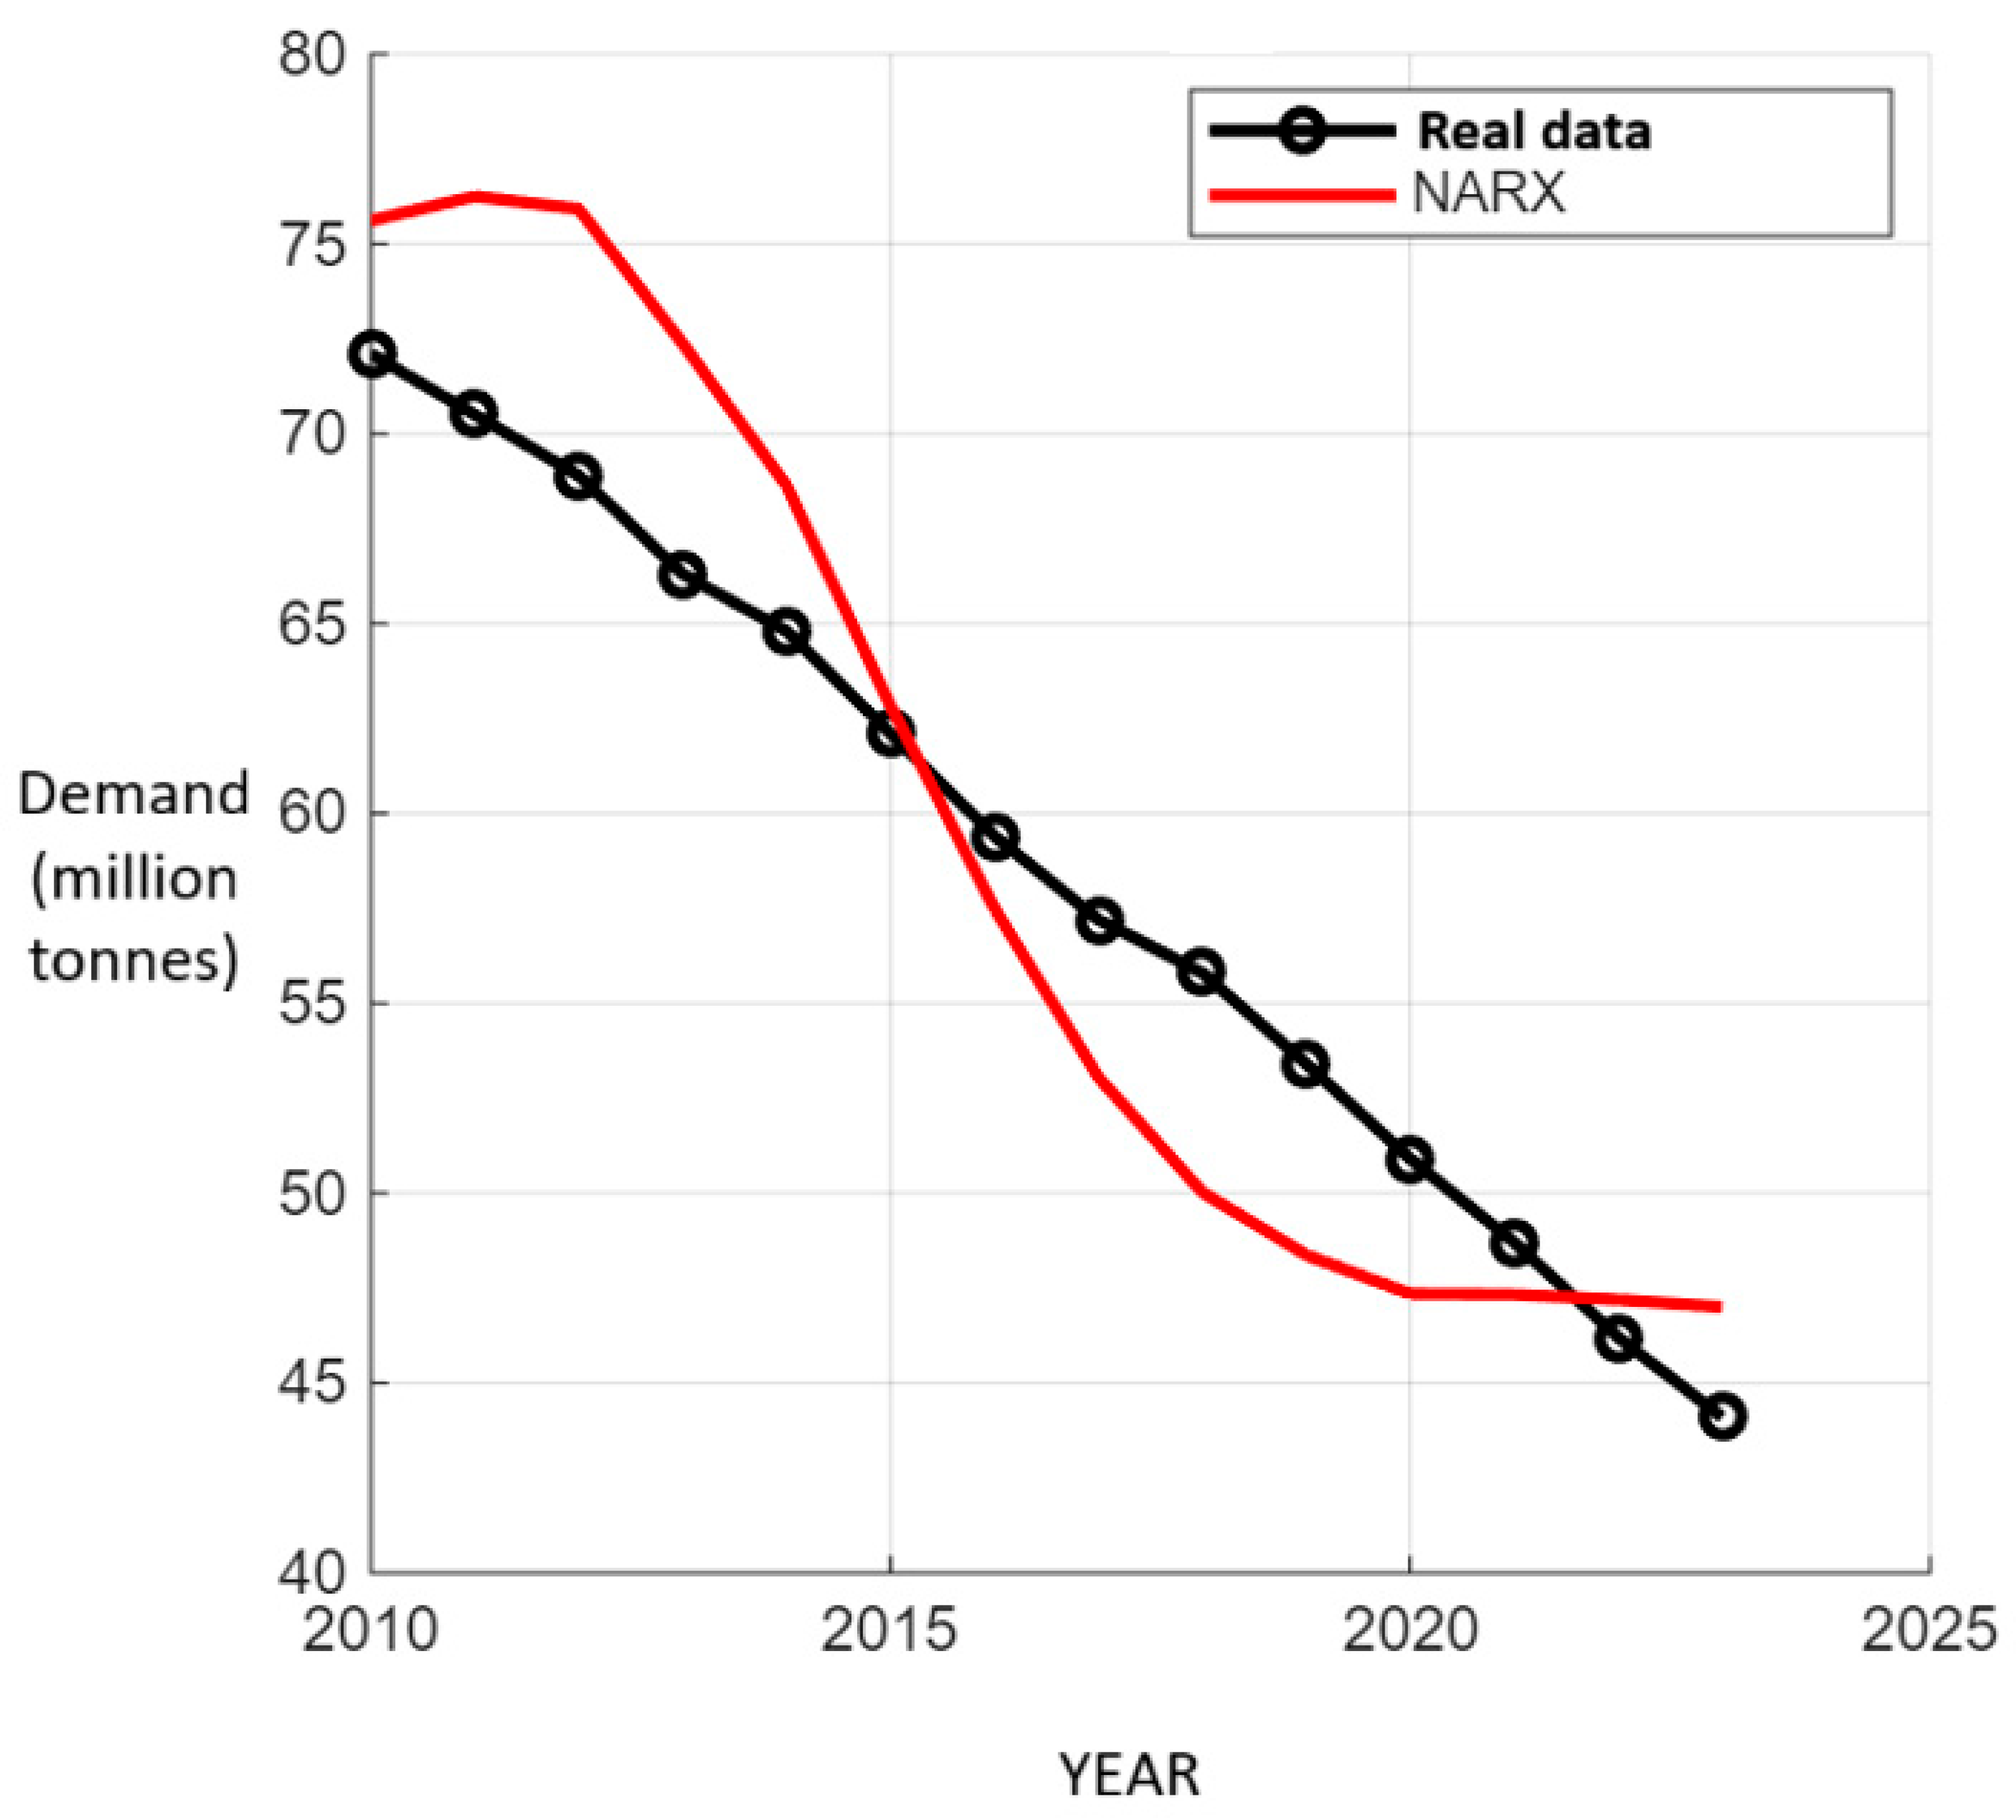
As confirmation of the degree of fit of the NARX model to actual data, a detailed analysis of the model’s predictive data was carried out against actual data. The NARX model accurately reflects the downward trend, but for the early years (2010–2014), it overestimated demand, forecasting approximately 75–76 million tonnes compared to the actual 70–72 million tonnes. The fit improved for the period after 2015, and for the 2018–2020 period, the model was close to the actual values. The NARX model is able to capture the general trend, but requires further calibration for the initial and final periods. The results confirm that NARX is useful for modelling complex relationships, but in this case, its accuracy is lower than that of the ARX or FLNN models, as confirmed by quality metrics (R
2 = 0.772). Note: The time axis in
Figure 7 is compressed, which may limit the visibility of individual years; however, the key interpretation is the trend and relative fit, while precise values are provided in
Table 2 for reference.
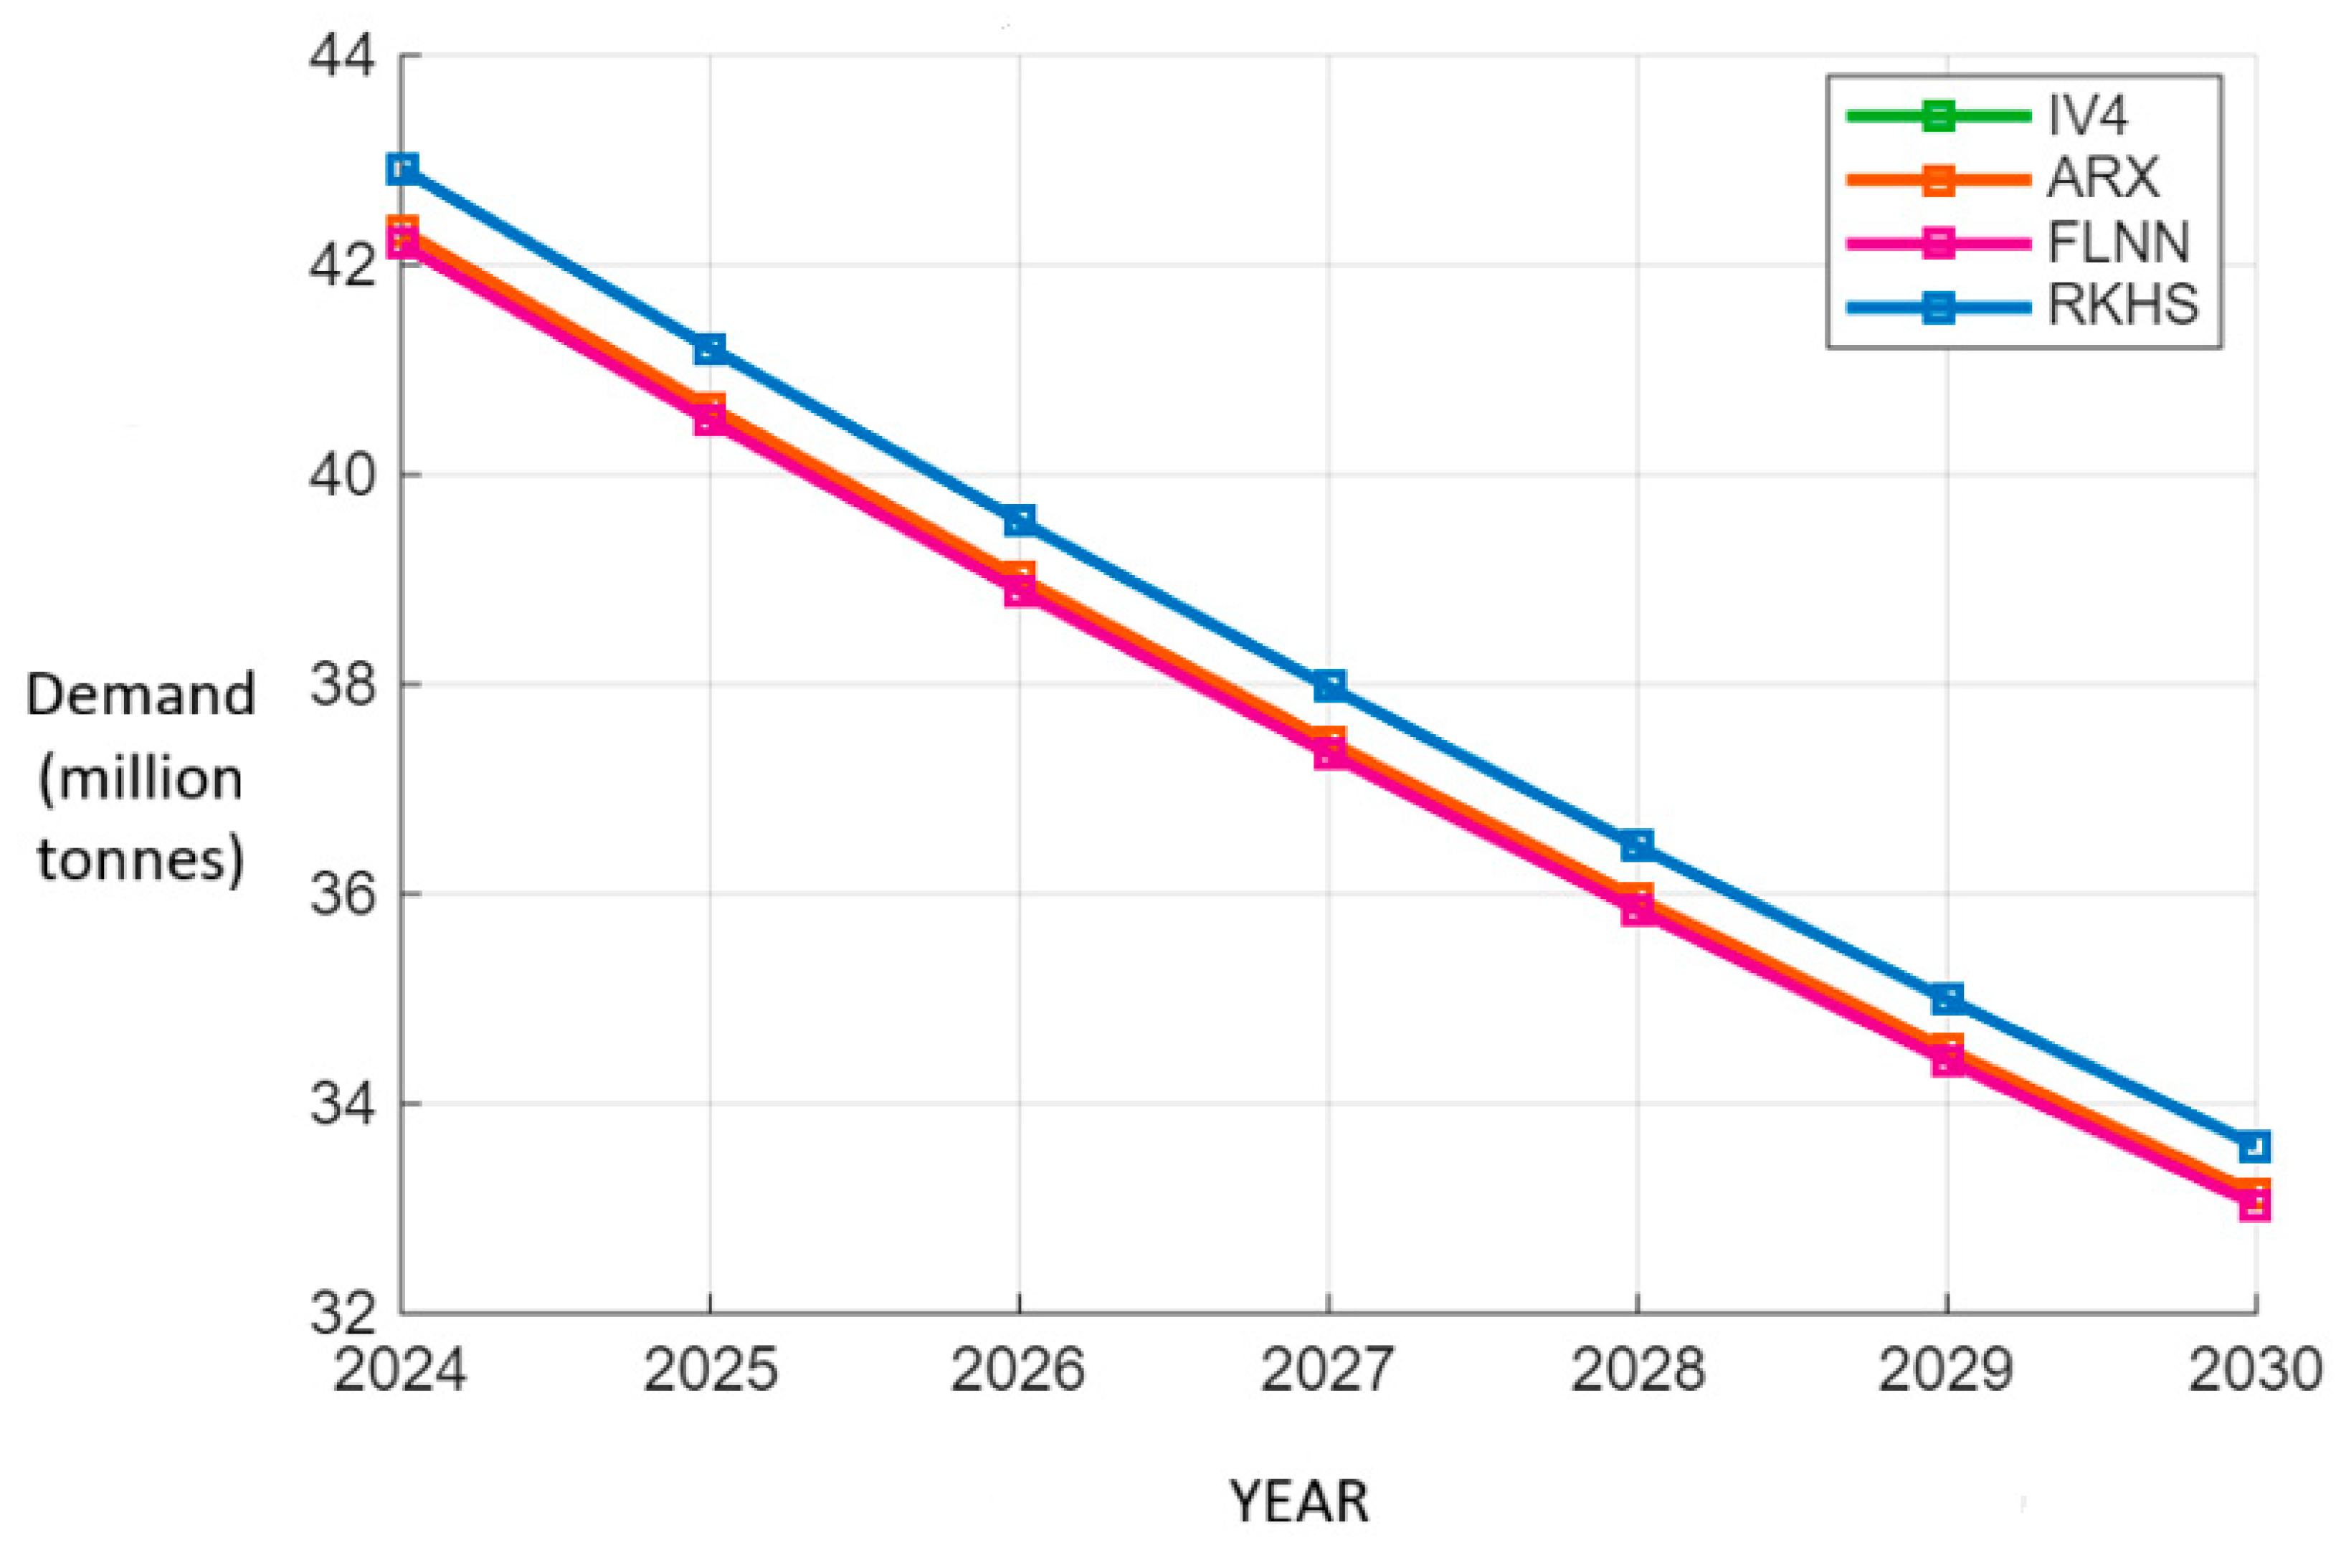
Figure 8 shows a graph containing forecasts for hard coal demand for 2024–2030 calculated using the four best methods: IV4, ARX, FLNN, and RKHS. All methods indicate a clear downward trend—from approx. 42 million tonnes in 2024 to between 32 and 34 million tonnes in 2030.
Figure 8.
Chart showing forecasts for hard coal demand for the most efficient methods. Source: authors’ own work.
Figure 8.
Chart showing forecasts for hard coal demand for the most efficient methods. Source: authors’ own work.
IV4 and ARX (green and red lines) show an almost identical pattern, confirming their high stability and precision in mapping the relationships between variables.
FLNN (orange line) also maintains very good consistency with ARX and IV4, indicating the potential of neural network-based methods to model non-linear relationships.
RKHS (blue line) predicts slightly higher values throughout the period, which may be due to greater sensitivity to price volatility and regulation.
The overall downward trend is consistent with climate policy and energy transition assumptions, suggesting a gradual reduction in the role of coal in Poland’s energy mix. Note: The
x-axis represents annual intervals from 2024 to 2030, but due to compression, detailed labels may not be fully visible. The key observation is the consistent downward trend across all methods, with values ranging from approx. 42 Mt in 2024 to 33–36 Mt in 2030 (see
Table 2 for exact figures).
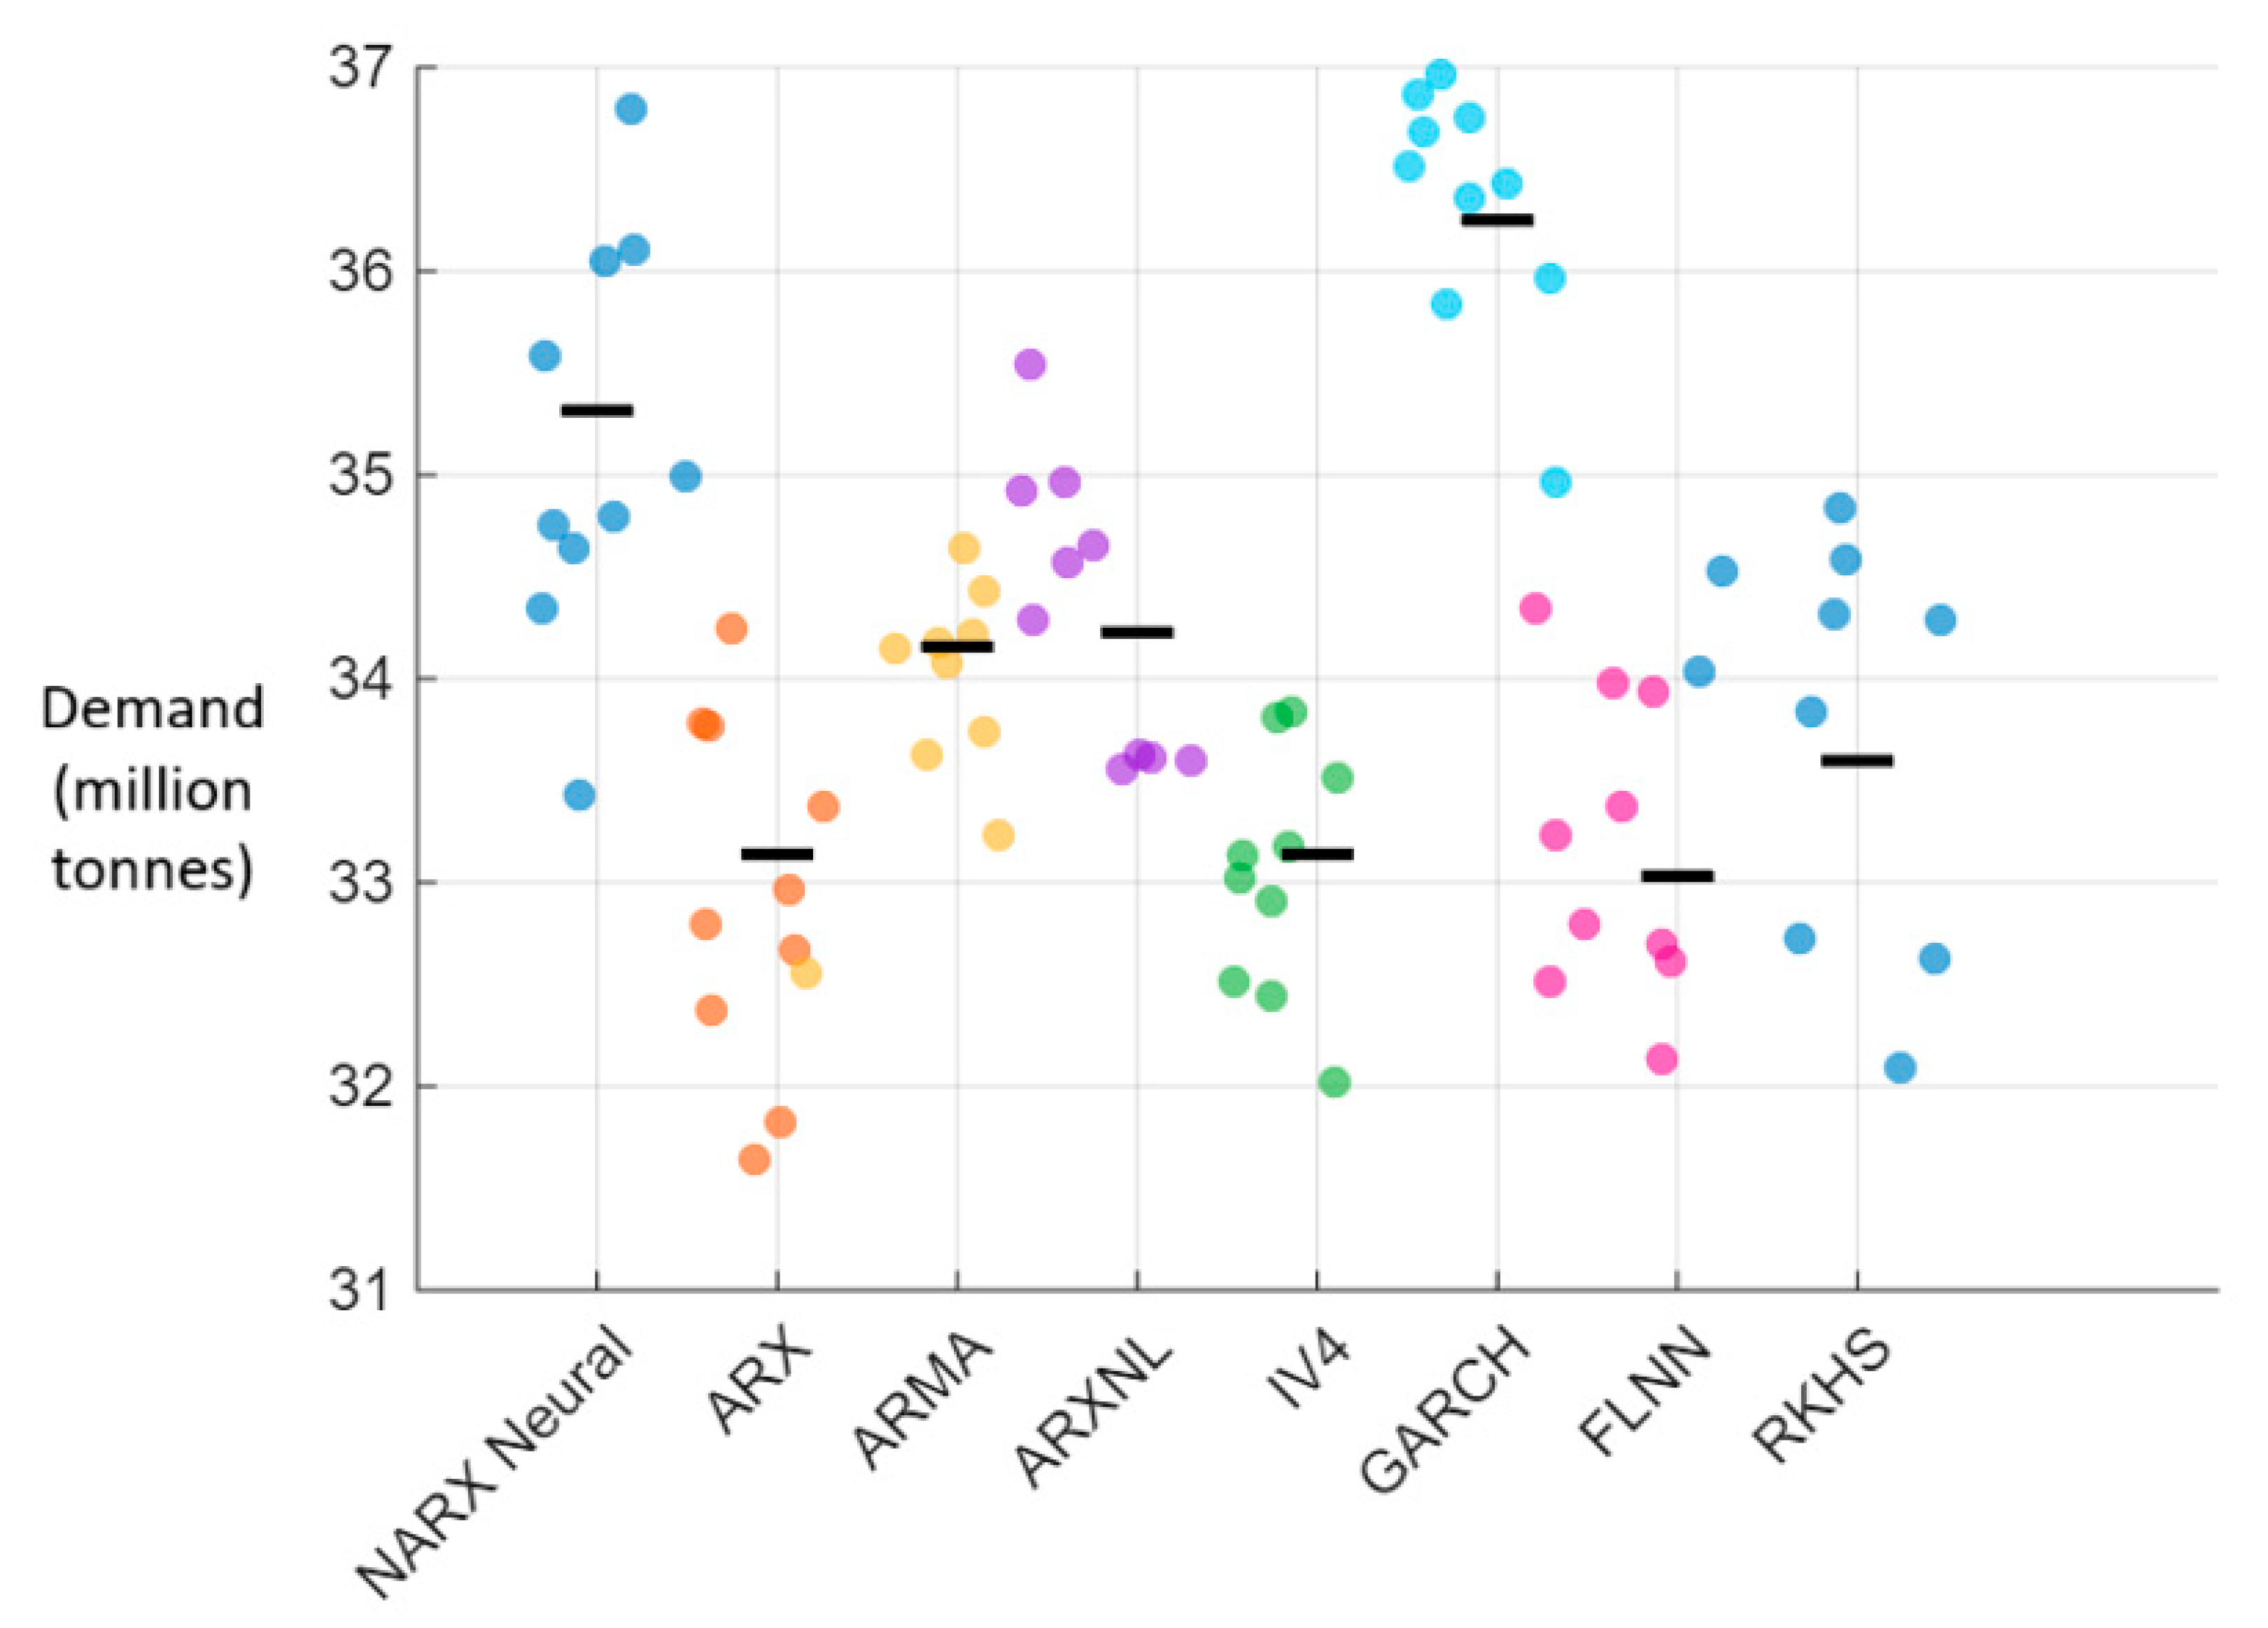
Based on the data from this graph, a distribution of forecasts for all methods was also prepared (
Figure 9).
The distribution of forecasts for 2030 shows clear differences in the stability of individual methods. The ARX, IV4, and FLNN models are characterized by the smallest spread of results, which confirms their high precision and resistance to input data volatility. On the other hand, the NARX Neural and GARCH methods show the greatest dispersion of forecasts, which may indicate their sensitivity to non-linear relationships and price volatility, but at the same time, limits their usefulness in the context of stable production planning. Note: While the axis scale is condensed, the figure illustrates the spread of forecasts among methods. ARX, IV4, and FLNN show minimal dispersion, confirming their stability. Refer to
Table 2 for precise numerical results.
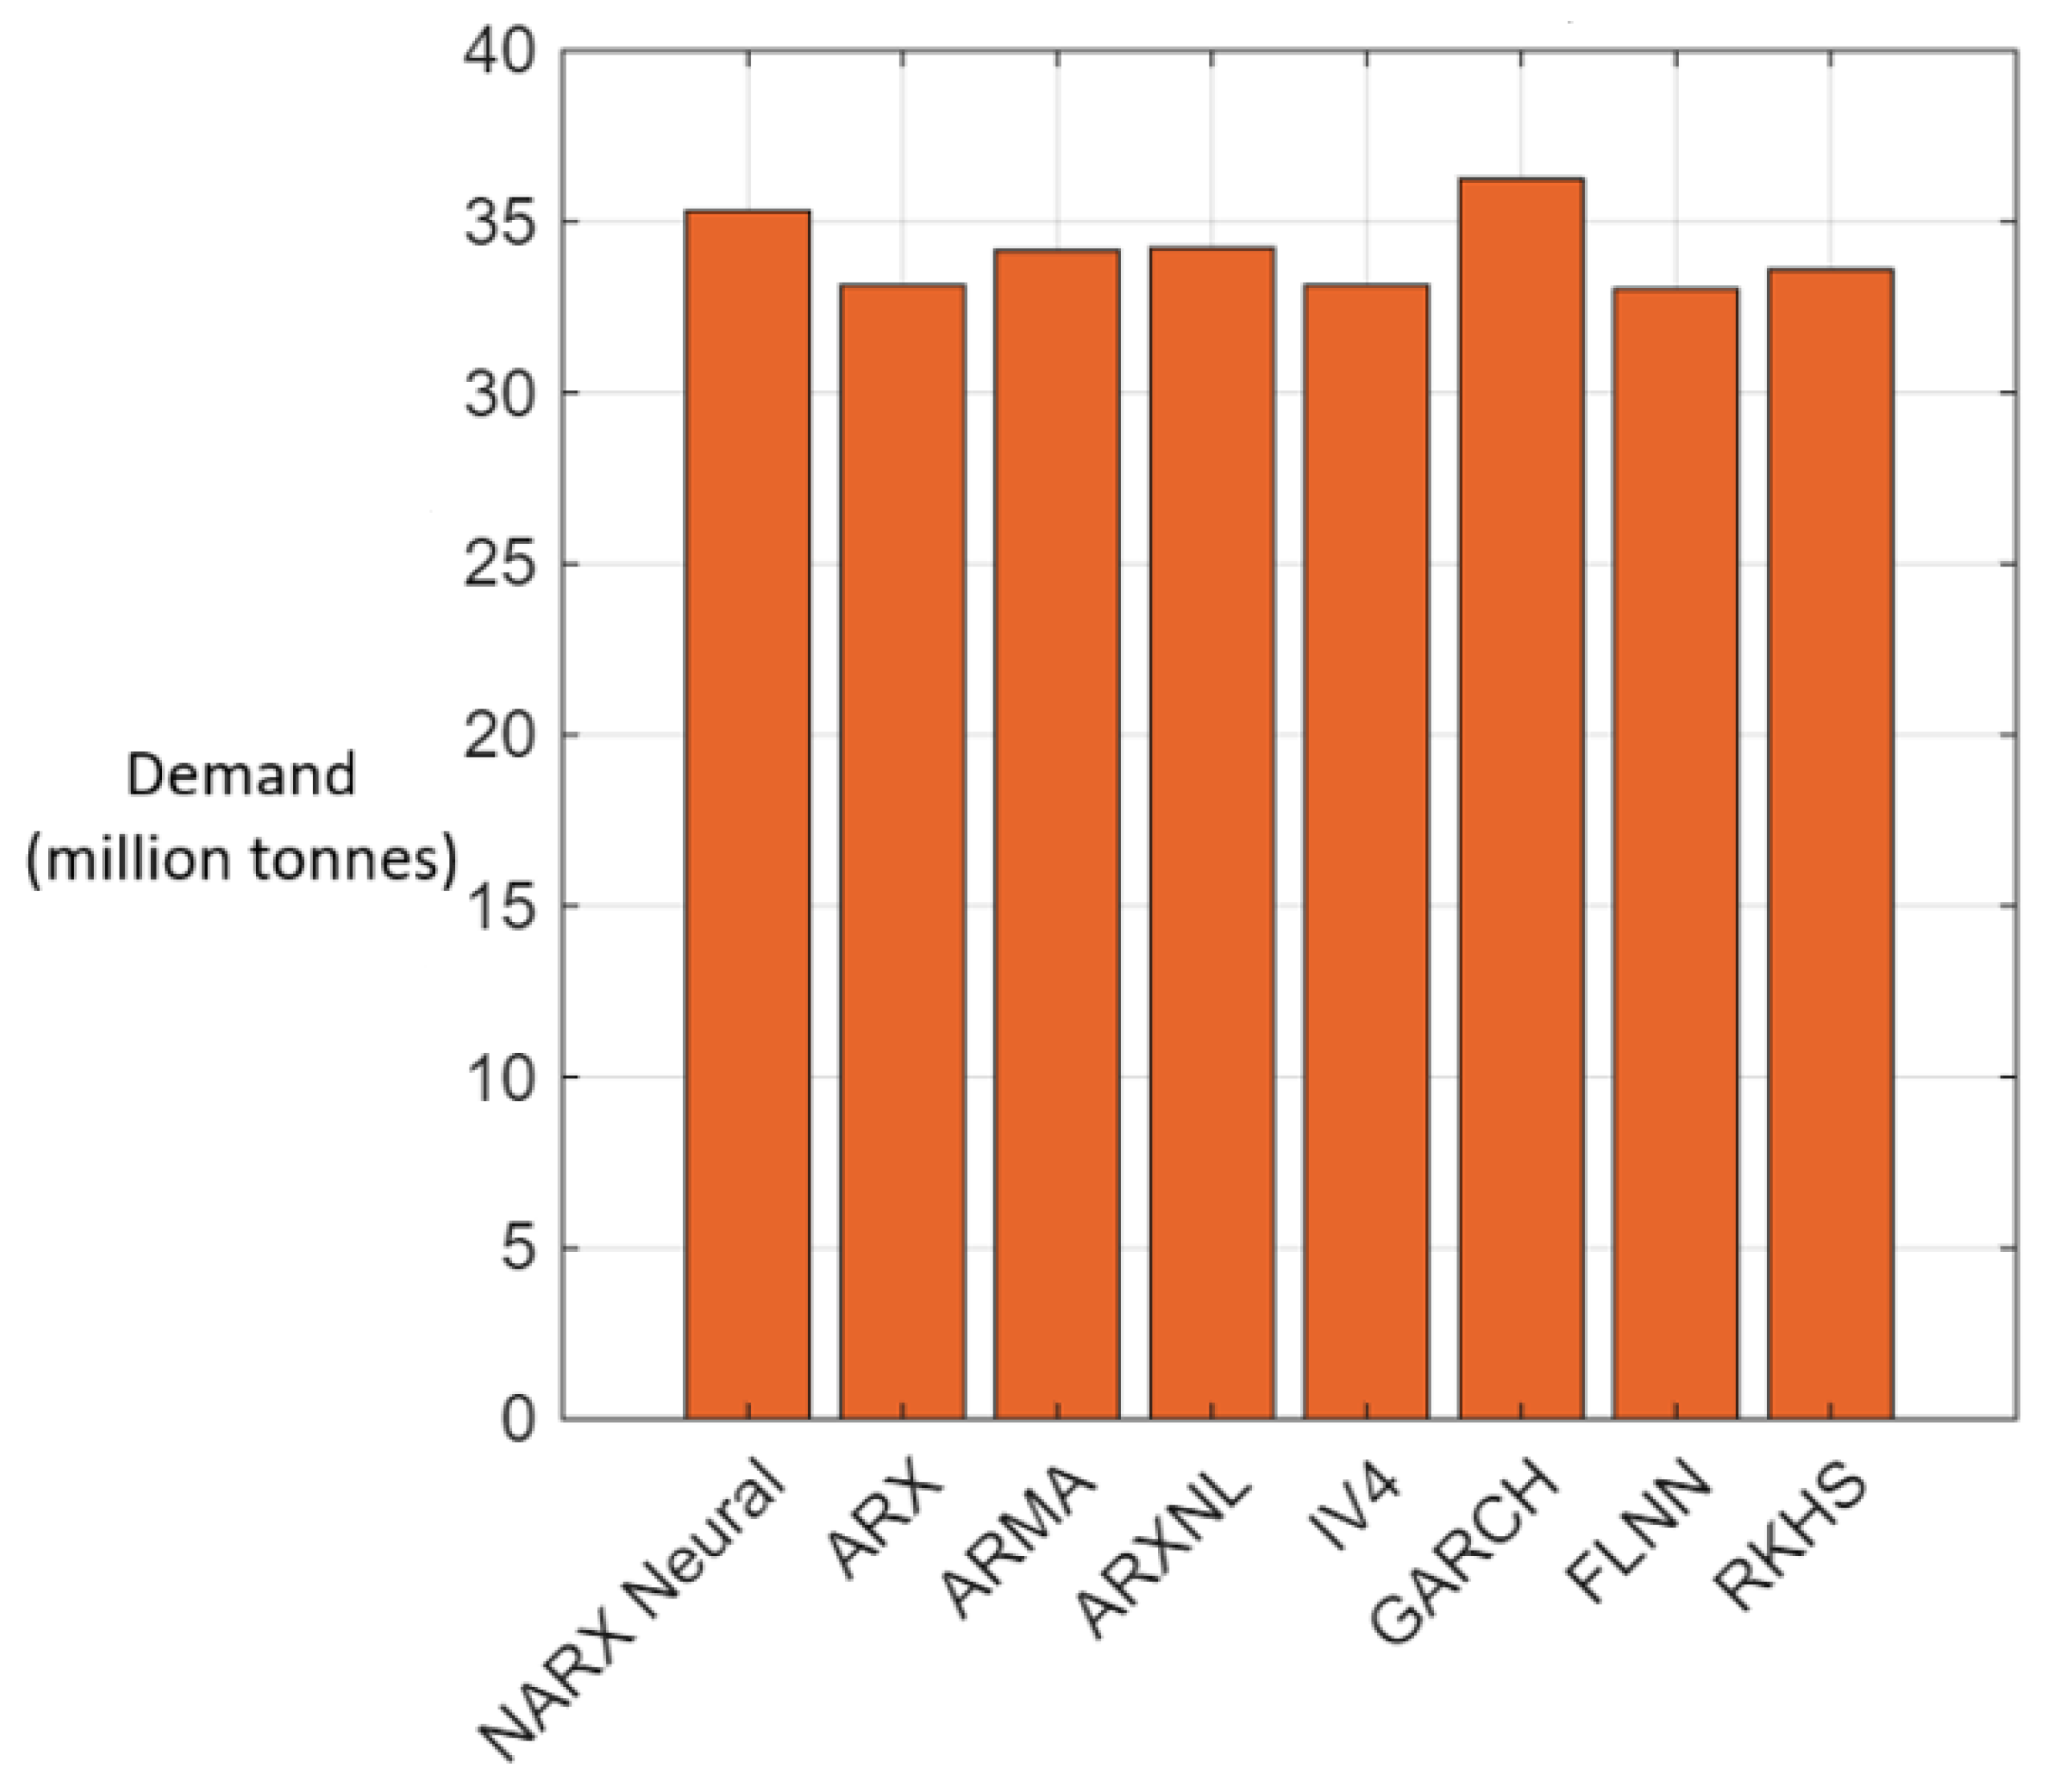
All methods indicate a similar level of demand in 2030, ranging from 33 to 36 million tonnes. The lowest values are predicted by the ARX, IV4, and FLNN models, which confirms their stability and consistency with the downward trend observed in previous analyses (
Figure 10).
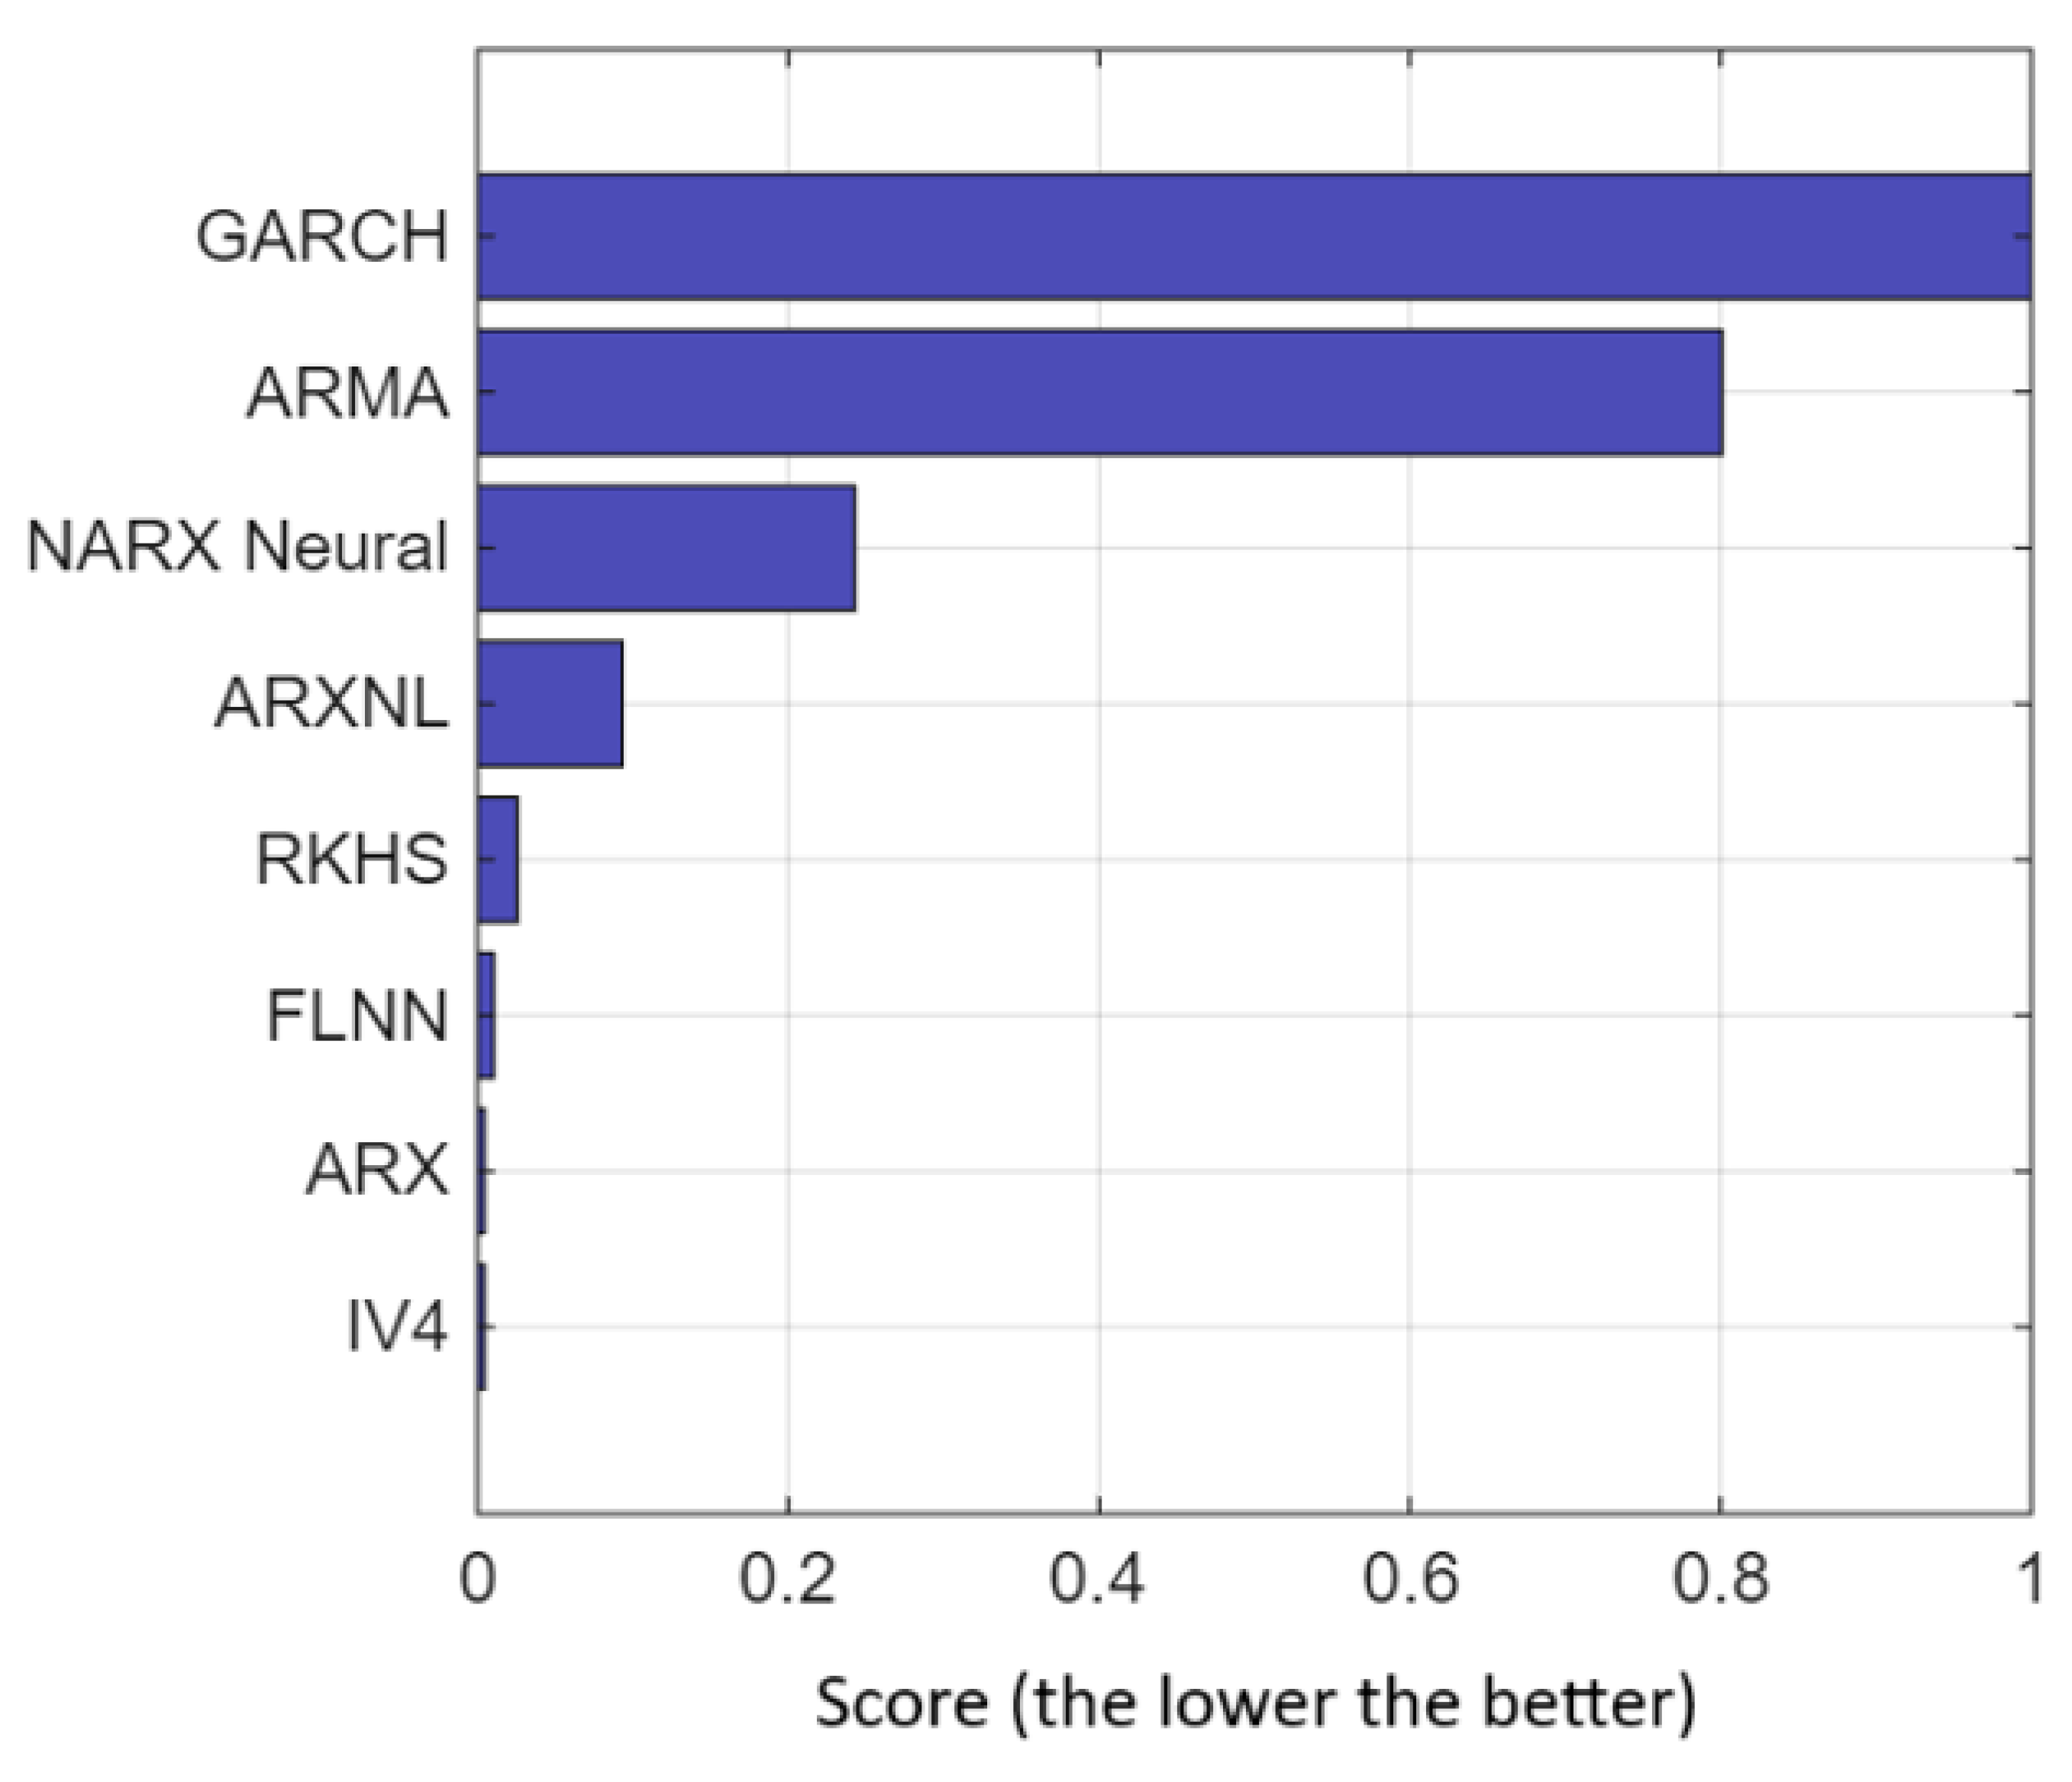
The ranking clearly shows the superiority of the ARX and IV4 methods, which achieved the lowest error rates and thus the highest prediction quality. The GARCH and ARMA methods were at the bottom of the list, confirming their limited usefulness in the context of coal demand modelling (
Figure 11).
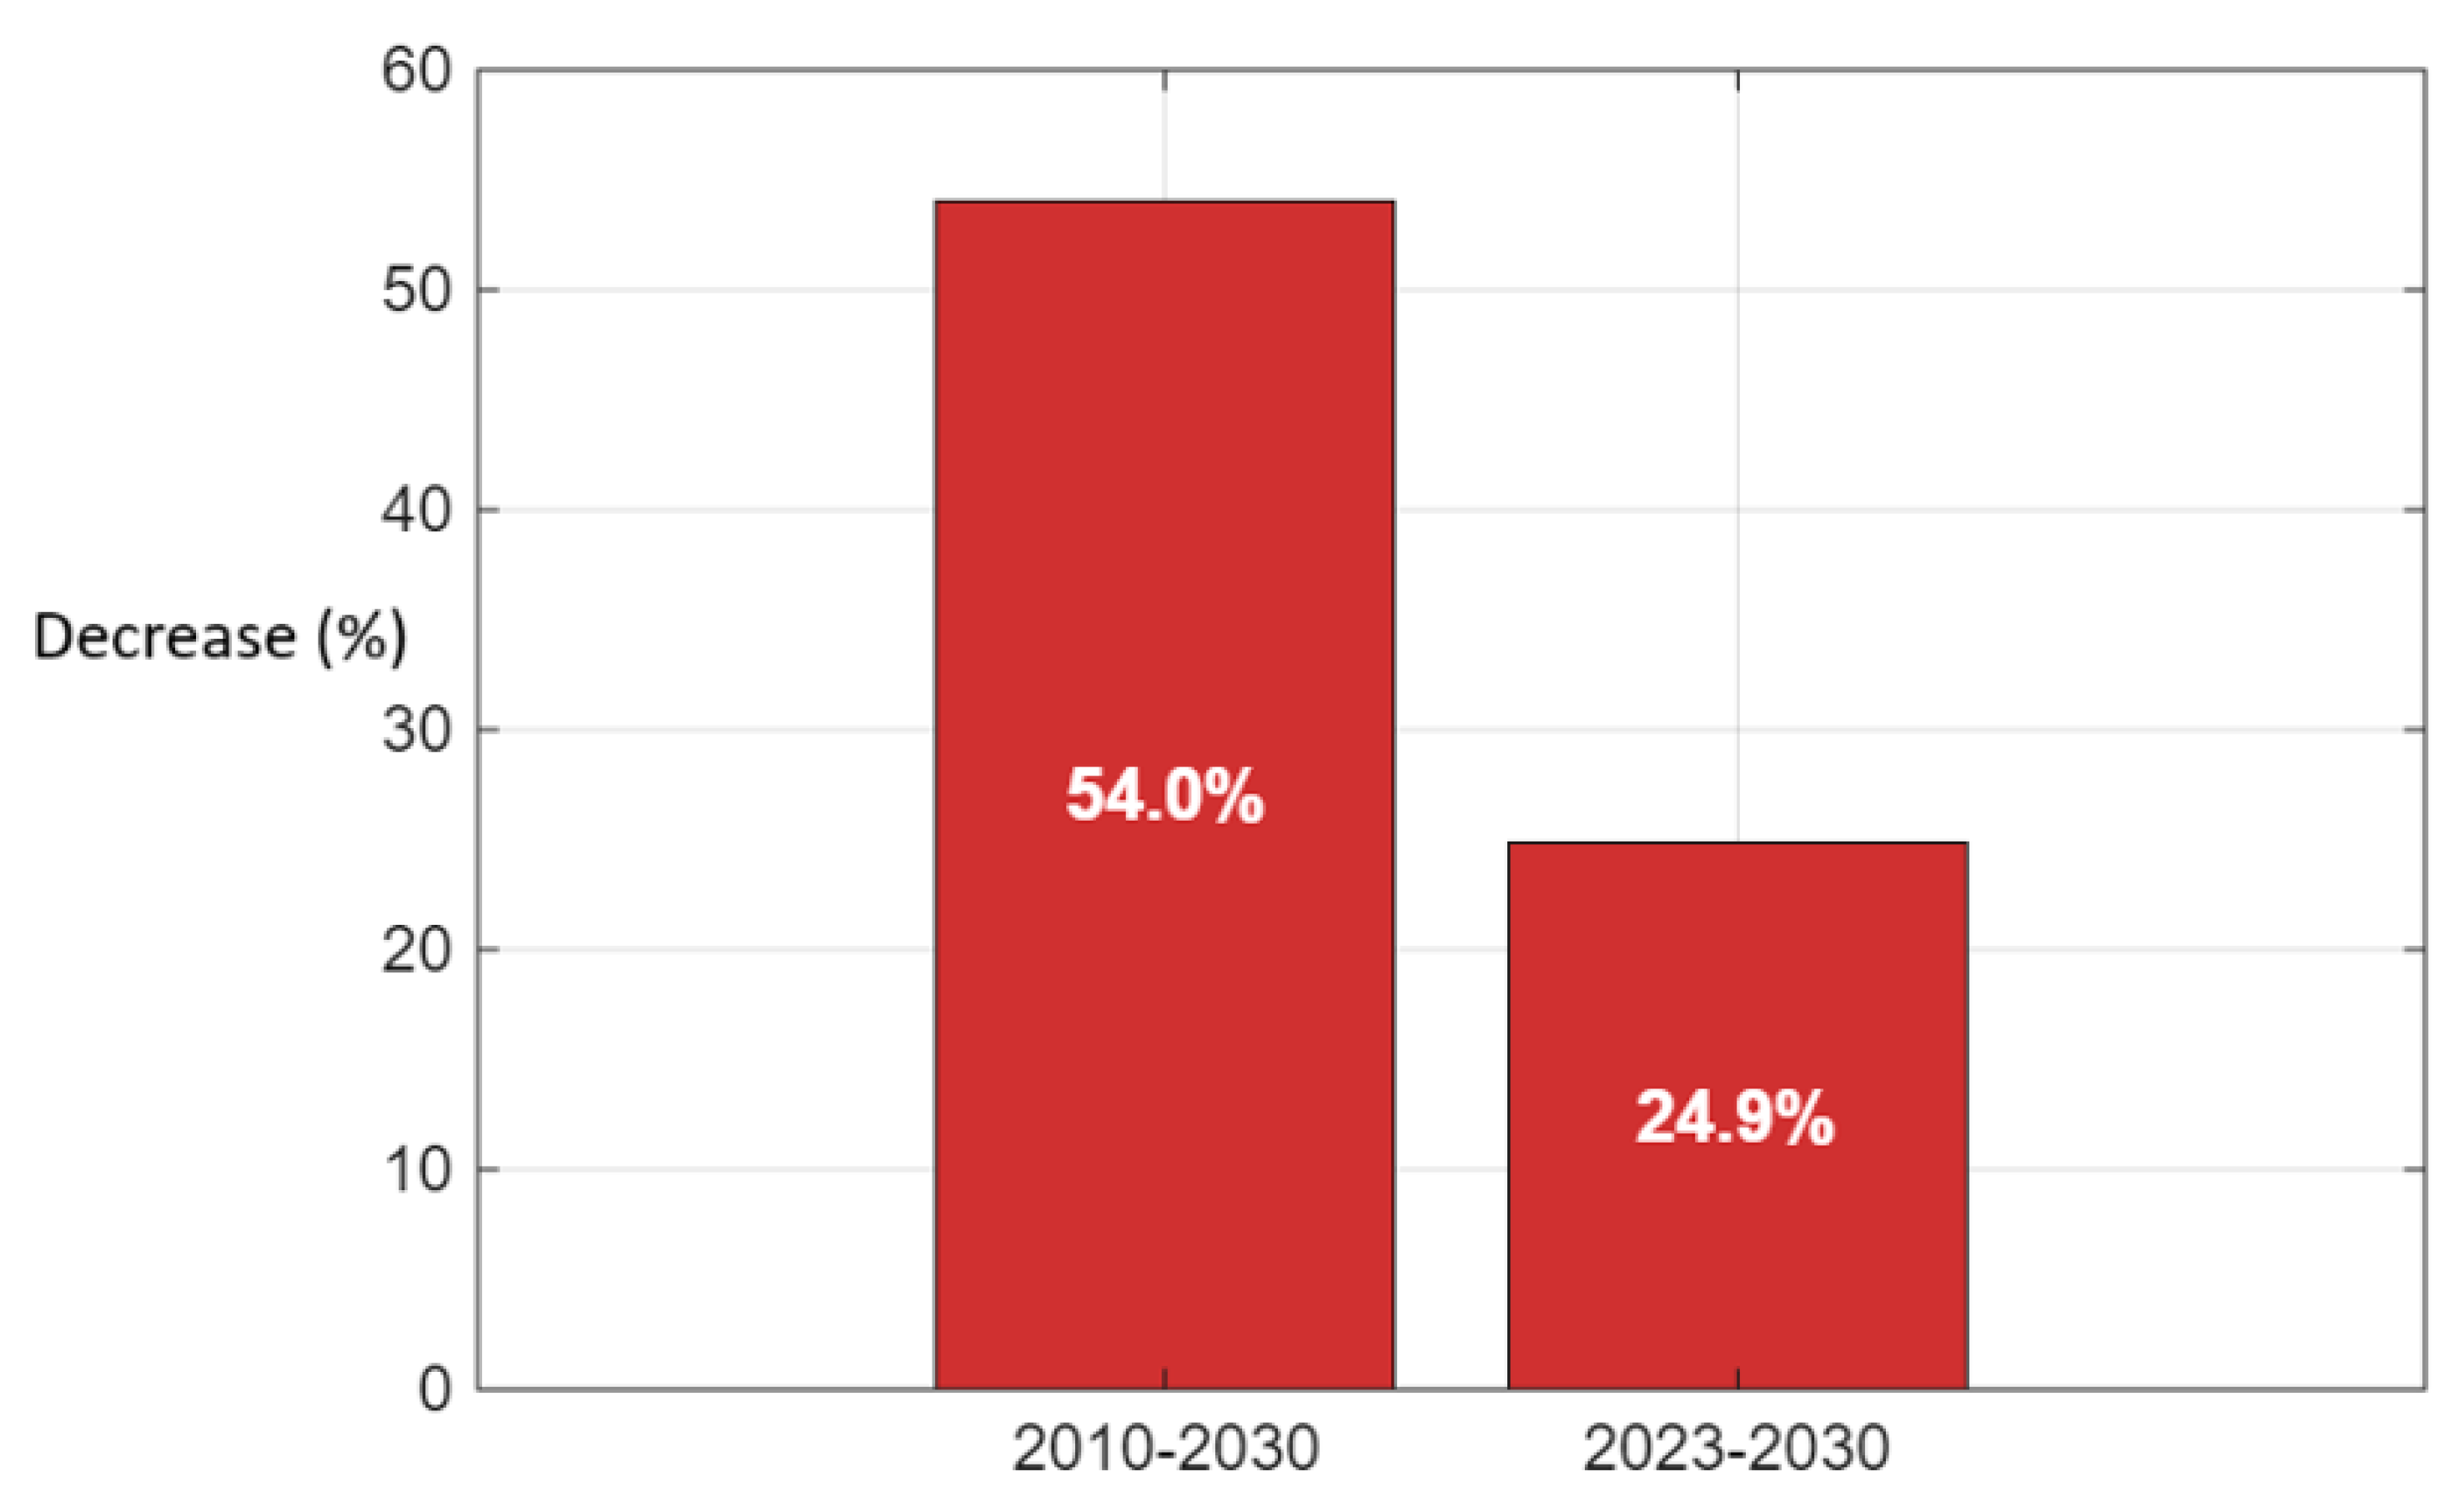
Based on the data obtained, it was possible to determine the reduction in demand (shown in the
Figure 12).
The analysis of forecasts indicates a clear downward trend in demand for hard coal in Poland, from approx. 42 million tonnes in 2024 to between 33 and 36 million tonnes in 2030, with the best results obtained by the ARX, IV4, and FLNN methods.
4.1. Comparison of Forecasting Methods
All models were evaluated based on five quality metrics: RMSE, MAE, MAPE, MSE, and the coefficient of determination R2. Below is a summary of the results for the demand forecast for 2030.
Table 2.
Reduction in demand for hard coal in Poland in the long term (2010–2030) and short term (2023–2030). Source: authors’ own work.
Table 2.
Reduction in demand for hard coal in Poland in the long term (2010–2030) and short term (2023–2030). Source: authors’ own work.
| Method | RMSE | MAE | R2 | Forecast for 2030 (Million Tonnes) |
|---|
| ARX | 0.142 | 0.105 | 1.000 | 33.1 |
| IV4 | 0.135 | 0.100 | 1.000 | 33.1 |
| FLNN | 0.319 | 0.242 | 0.999 | 33.0 |
| RKHS | 0.730 | 0.564 | 0.993 | 33.6 |
| ARXNL | 2.118 | 1.868 | 0.943 | 34.2 |
| NARX | 4.227 | 3.757 | 0.772 | 35.3 |
| ARMA | 9.863 | 4.142 | −0.240 | 34.2 |
| GARCH | 16.392 | 13.046 | −2.424 | 36.2 |
The distribution of forecasts confirms the stability of these models compared to the high volatility of the NARX and GARCH methods. The quality ranking clearly indicates the superiority of regression- and neural network-based methods over classical time series models. The last chart shows that between 2010 and 2030, demand for coal will fall by 54%, and between 2023 and 2030 by a further 24.9%, which is in line with the assumptions of the energy transition and climate policy. These results confirm the need to implement JIT mechanisms in mining in order to adjust production to the rapidly declining demand.
4.2. Interpretation of Results and Demand Forecast for 2030 and Projections Until 2049
The best results were obtained by the ARX, IV4 and FLNN models, which achieved an almost perfect fit (R2 ≈ 1.000) with very low error values. These models demonstrated high stability and resistance to disturbances, making them promising candidates for further use as part of the Coal Platform.
In contrast, the GARCH and ARMA models were characterized by low prediction quality, which may be due to their limited ability to capture complex interactions between variables and seasonal and regulatory volatility.
Based on the model results, the projected demand for hard coal in Poland in 2030 ranges from 33.0 to 36.2 million tonnes, depending on the method used. The average value of the forecasts is around 33.5 million tonnes, which is a reference point for further analysis and production planning in the context of the JIT strategy.
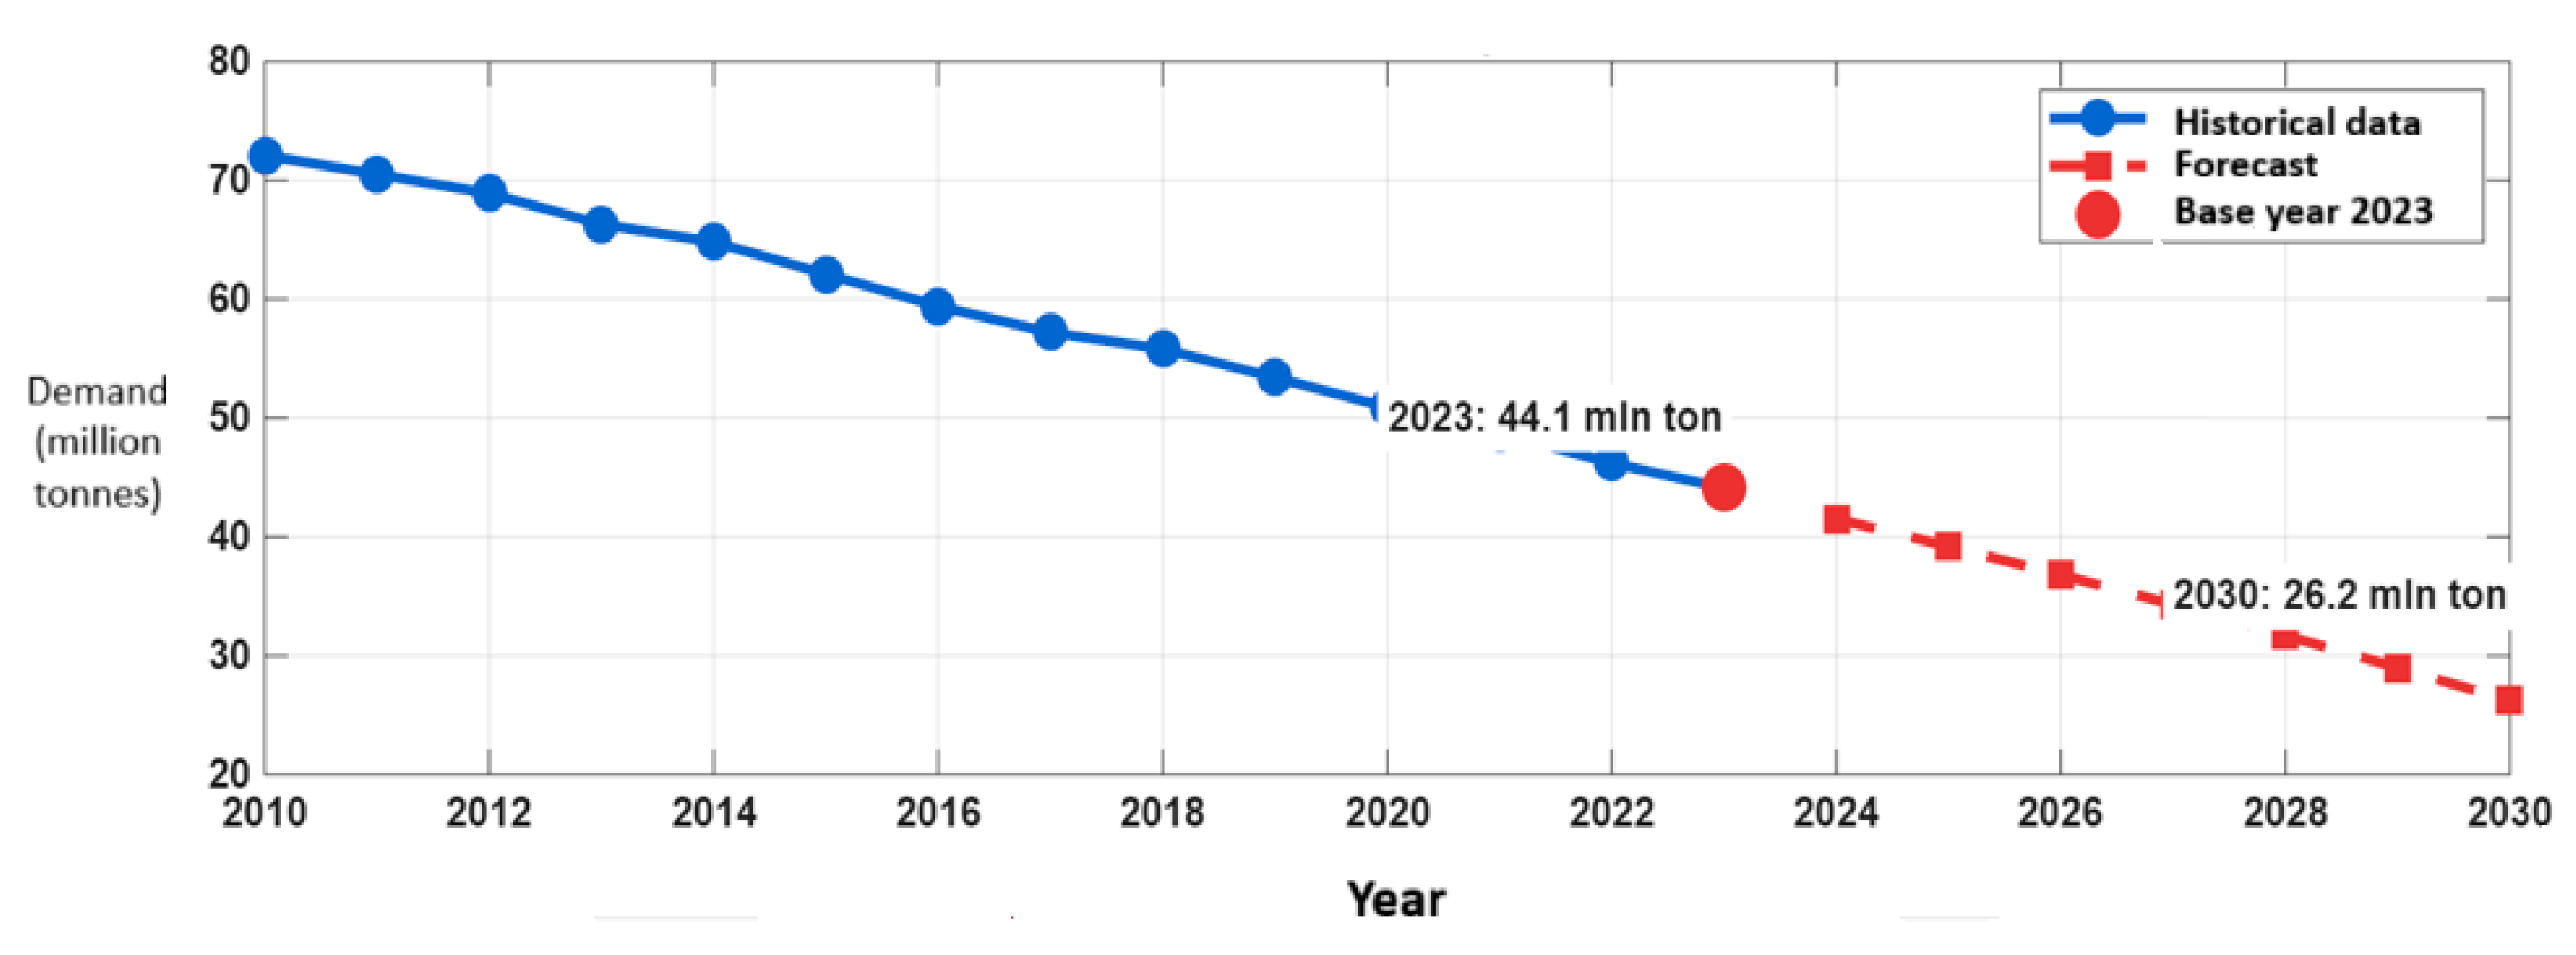
Further forecasts for coal demand in Poland indicate a strong downward trend in the long term. Historical data show that, between 2010 and 2020, demand fell from around 72 million tonnes to 50 million tonnes. The base year 2023 recorded a level of 44.1 million tonnes, and forecasts for 2030 assume a further decline to 26.2 million tonnes, which represents a reduction of 63.7% compared to 2010.
Analyses based on the methods with the lowest errors (RMSE and MAPE) predict that average demand in 2049 will be approximately 17.7 million tonnes. Three advanced approaches were used in the study: NARX (neural networks with time memory), RKHS (Gaussian kernel Hilbert space regression), and ARIMA (classical time series model). The models took into account 12 input variables and achieved a very high quality of fit (R2 = 0.9982).
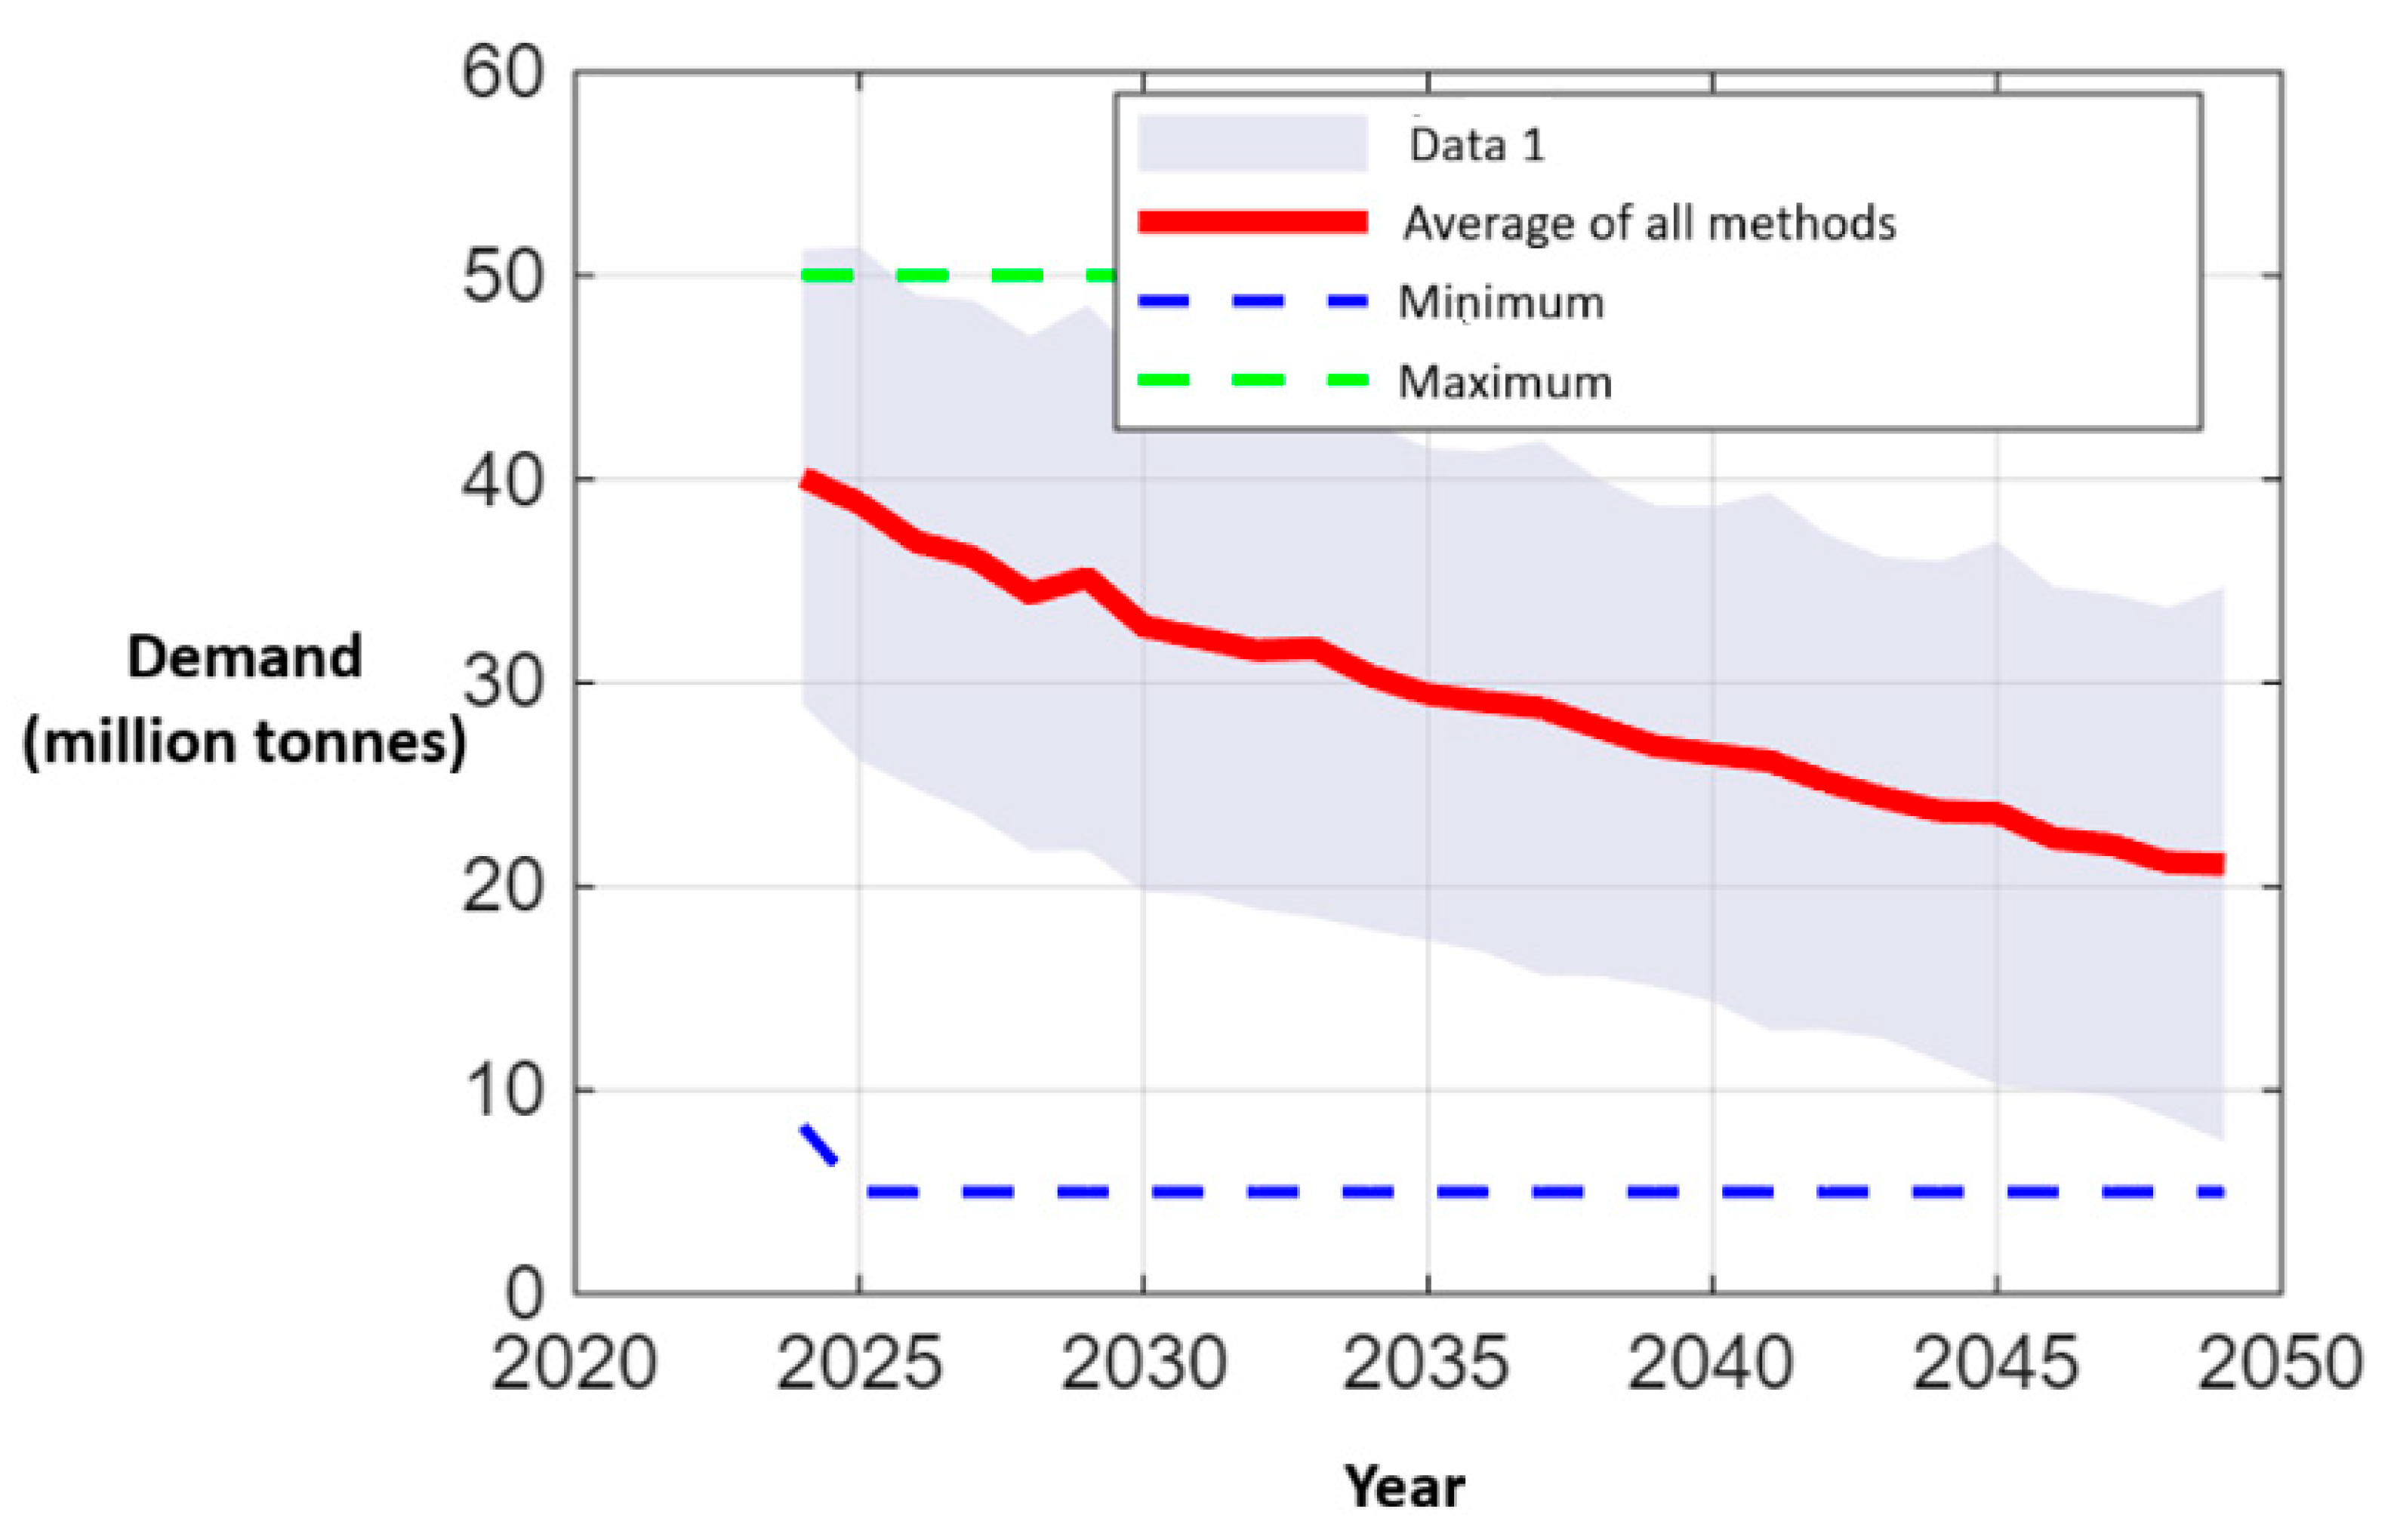
The graphs confirm a clear downward trend in both the short and long term (
Figure 13). The decline is steep until 2030, and forecasts indicate a further decline in demand between 2024 and 2049, with an average value of around 30 million tonnes in the middle of the period and a minimum level of less than 20 million tonnes at the end. The range of uncertainty covers values from around 15 million tonnes (minimum) to over 35 million tonnes (maximum). Note: The time axis is condensed, but the figure demonstrates the long-term downward trend in coal demand.
The range of uncertainty (approx. 15–35 Mt) and the average forecast (~30 Mt mid-period) are highlighted in the text and supported by
Table 2.
Figure 14.
Trend in demand for coal for the years 2010–2030. Source: authors’ own work.
Figure 14.
Trend in demand for coal for the years 2010–2030. Source: authors’ own work.
Data sources include the Energy Market Agency (ARE), the Industrial Development Agency (ARP), the Central Statistical Office (GUS), and Eurostat. Note: Although the
x-axis is compressed, the figure confirms a steep decline in demand from ~72 Mt in 2010 to ~33–36 Mt in 2030. Exact values and percentage reductions are detailed in
Table 2 and the accompanying discussion.
4.3. Benchmarking Against a Simple Time-Trend Baseline
To assess whether the added complexity of our multivariable model is warranted, we benchmark against a simple time-trend baseline that captures the nearly linear decline in historical hard coal demand:
where
denotes annual demand (
Mt) and
is a time index (2010 = 0, …, 2023 = 13). We estimate
by ordinary least squares (OLS) on 2010–2023 (in-sample) and then generate 2024–2030 forecasts via extrapolation. As a robustness check, we also consider a second minimal baseline with autoregressive inertia:
Both baselines are intentionally uninformative about exogenous drivers (prices, regulation, seasonality) in order to provide a “simple time trend” as a reference point.
Table 3 reports error metrics for the baselines vs. the top four multivariable methods (ARX, IV4, FLNN, RKHS), using the same metric set as
Section 4.1 (RMSE, MAE, MAPE, R
2). Where appropriate, we compute metrics both in-sample (2010–2023) and for the forecast horizon (2024–2030).
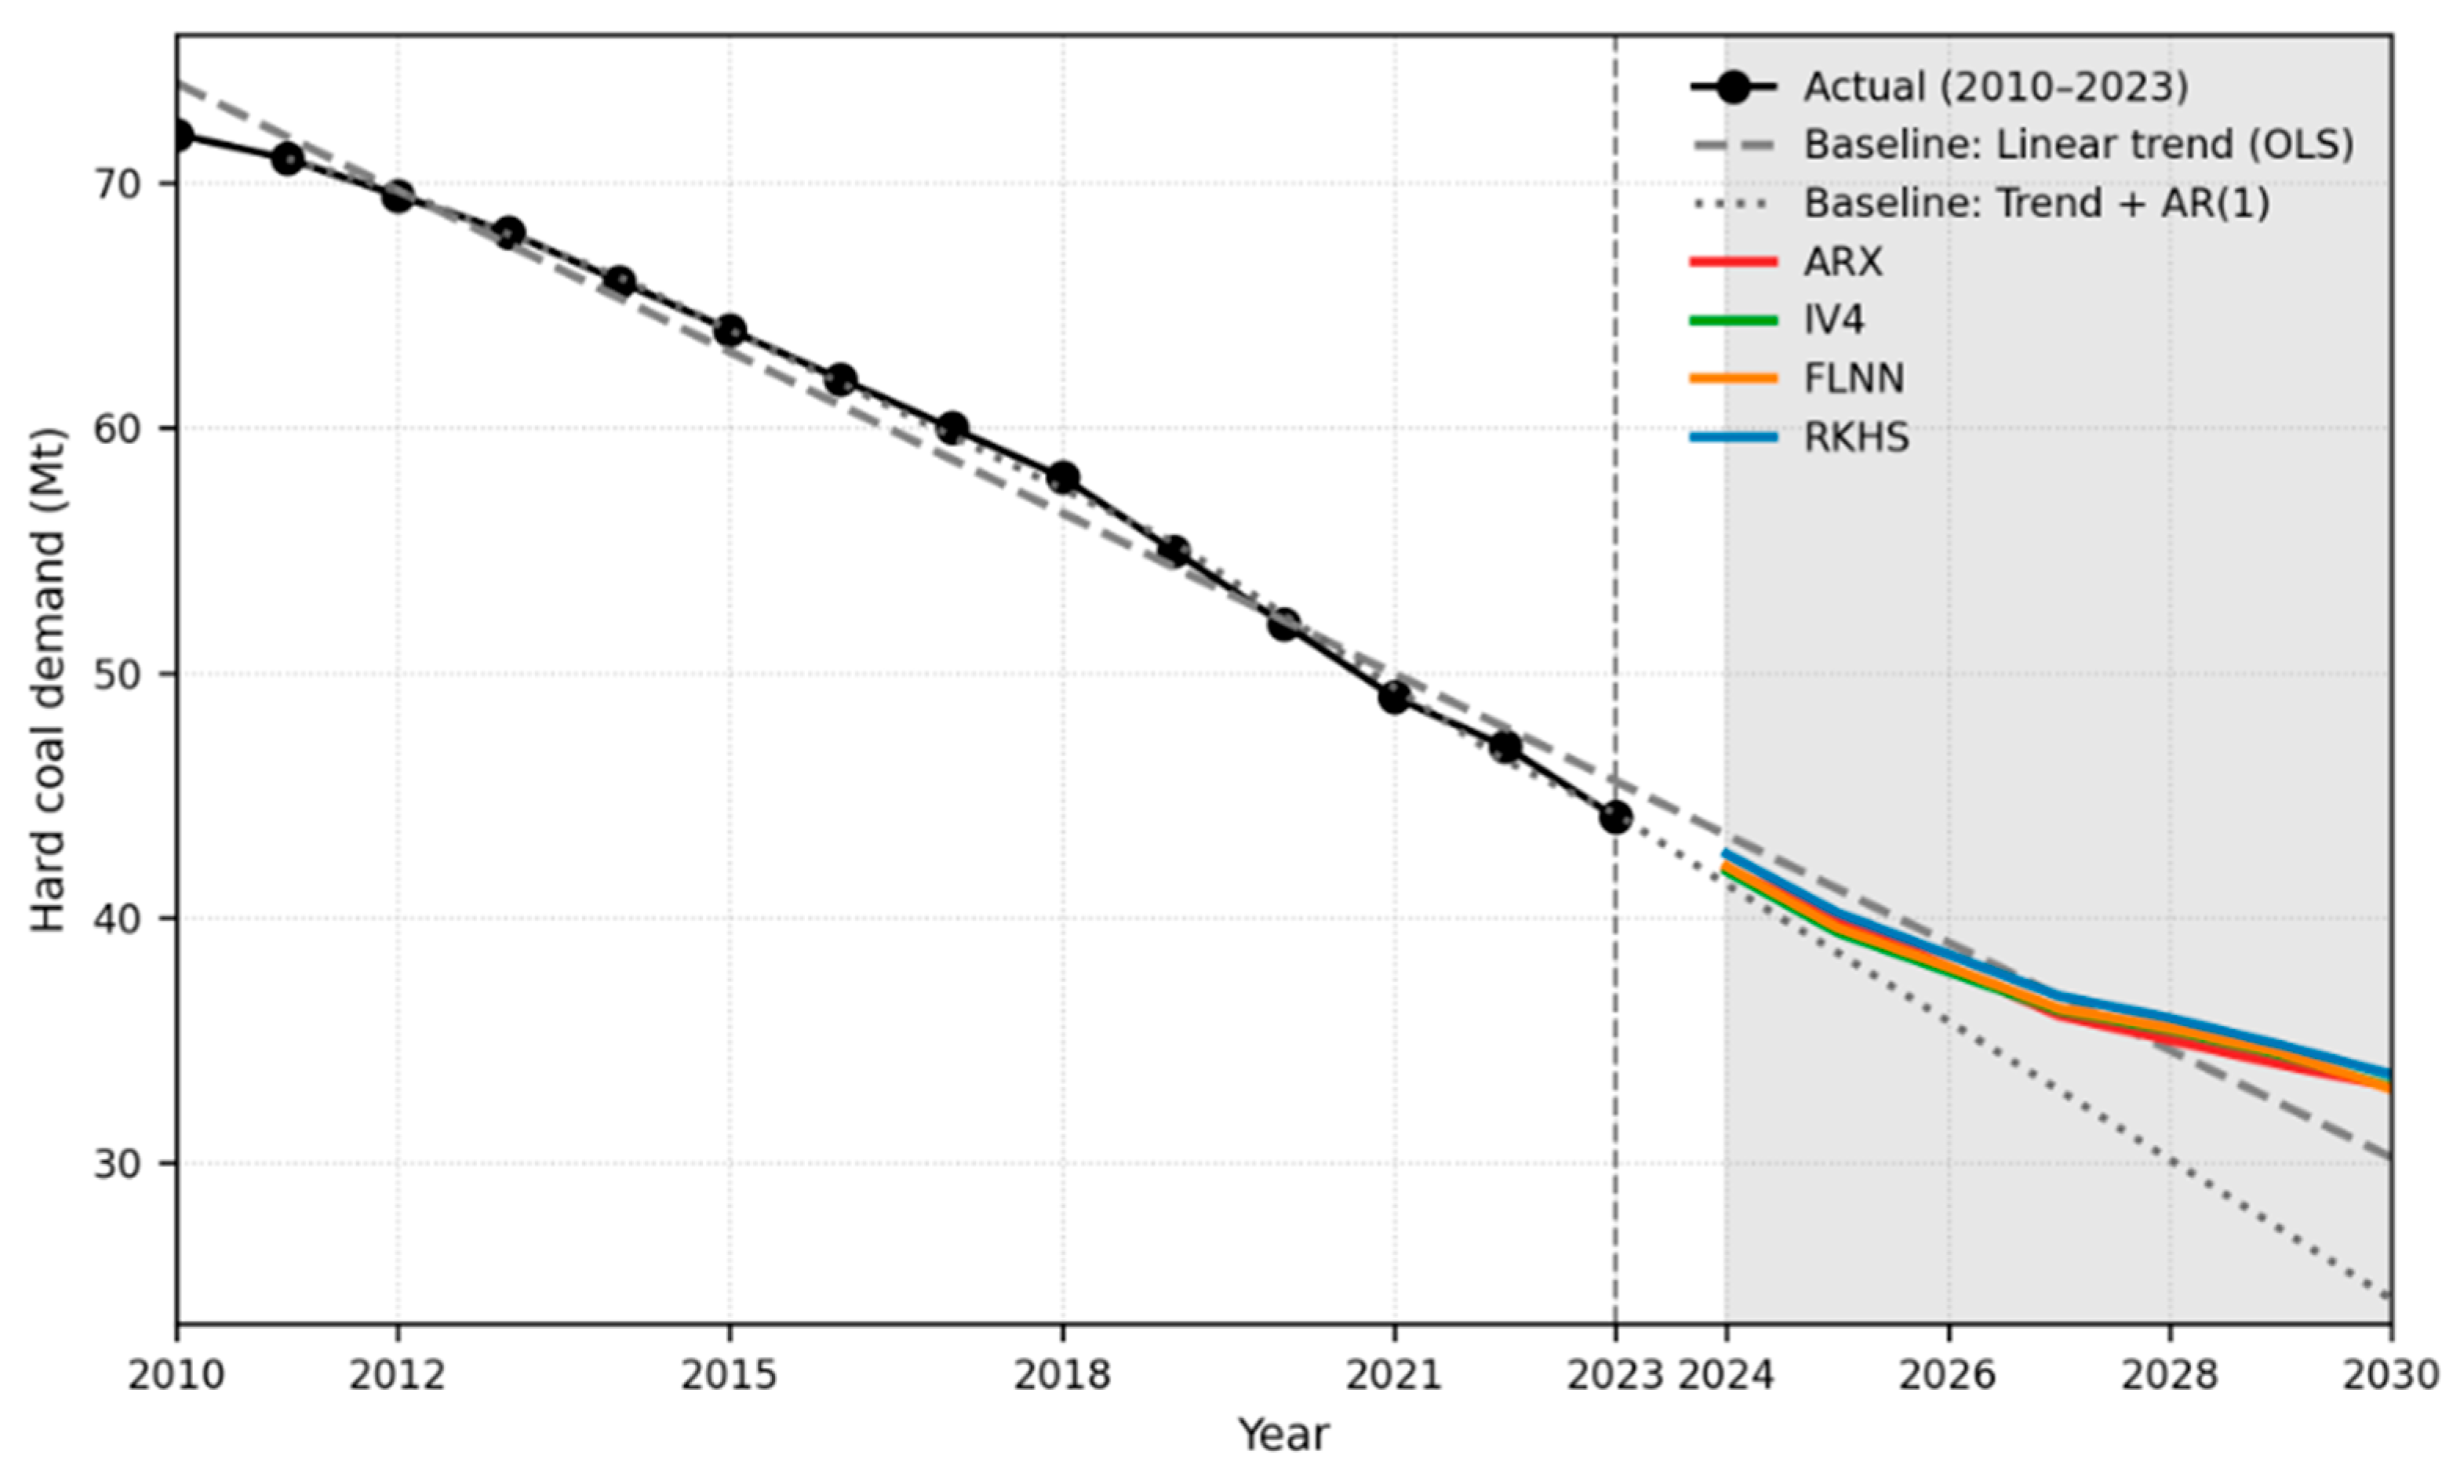
We include two parsimonious baselines. First, as an OLS linear time-trend estimated on 2010–2023, and second, as a time-trend with AR(1) inertia estimated on 2011–2023 (lag constraint). Forecasts for 2024–2030 are generated by extrapolation (linear time trend) and by recursive simulation (time trend + AR(1)). As realized observations for 2024–2030 are not fully available at the time of writing, forecast-window error metrics are reported relative to the ARX series as a proxy; these will be recomputed against realized values as data accrue.
Simple linear baseline tracks the dominant decline but exhibits systematic residuals around years with policy or price shocks, yielding lower R2 (≈0.89) and higher errors than the multivariable approaches. In contrast, ARX/IV4/FLNN/RKHS materially reduce RMSE/MAE and achieve near-perfect R2 by using exogenous drivers and lag structure, thereby capturing minor deviations from the trend.
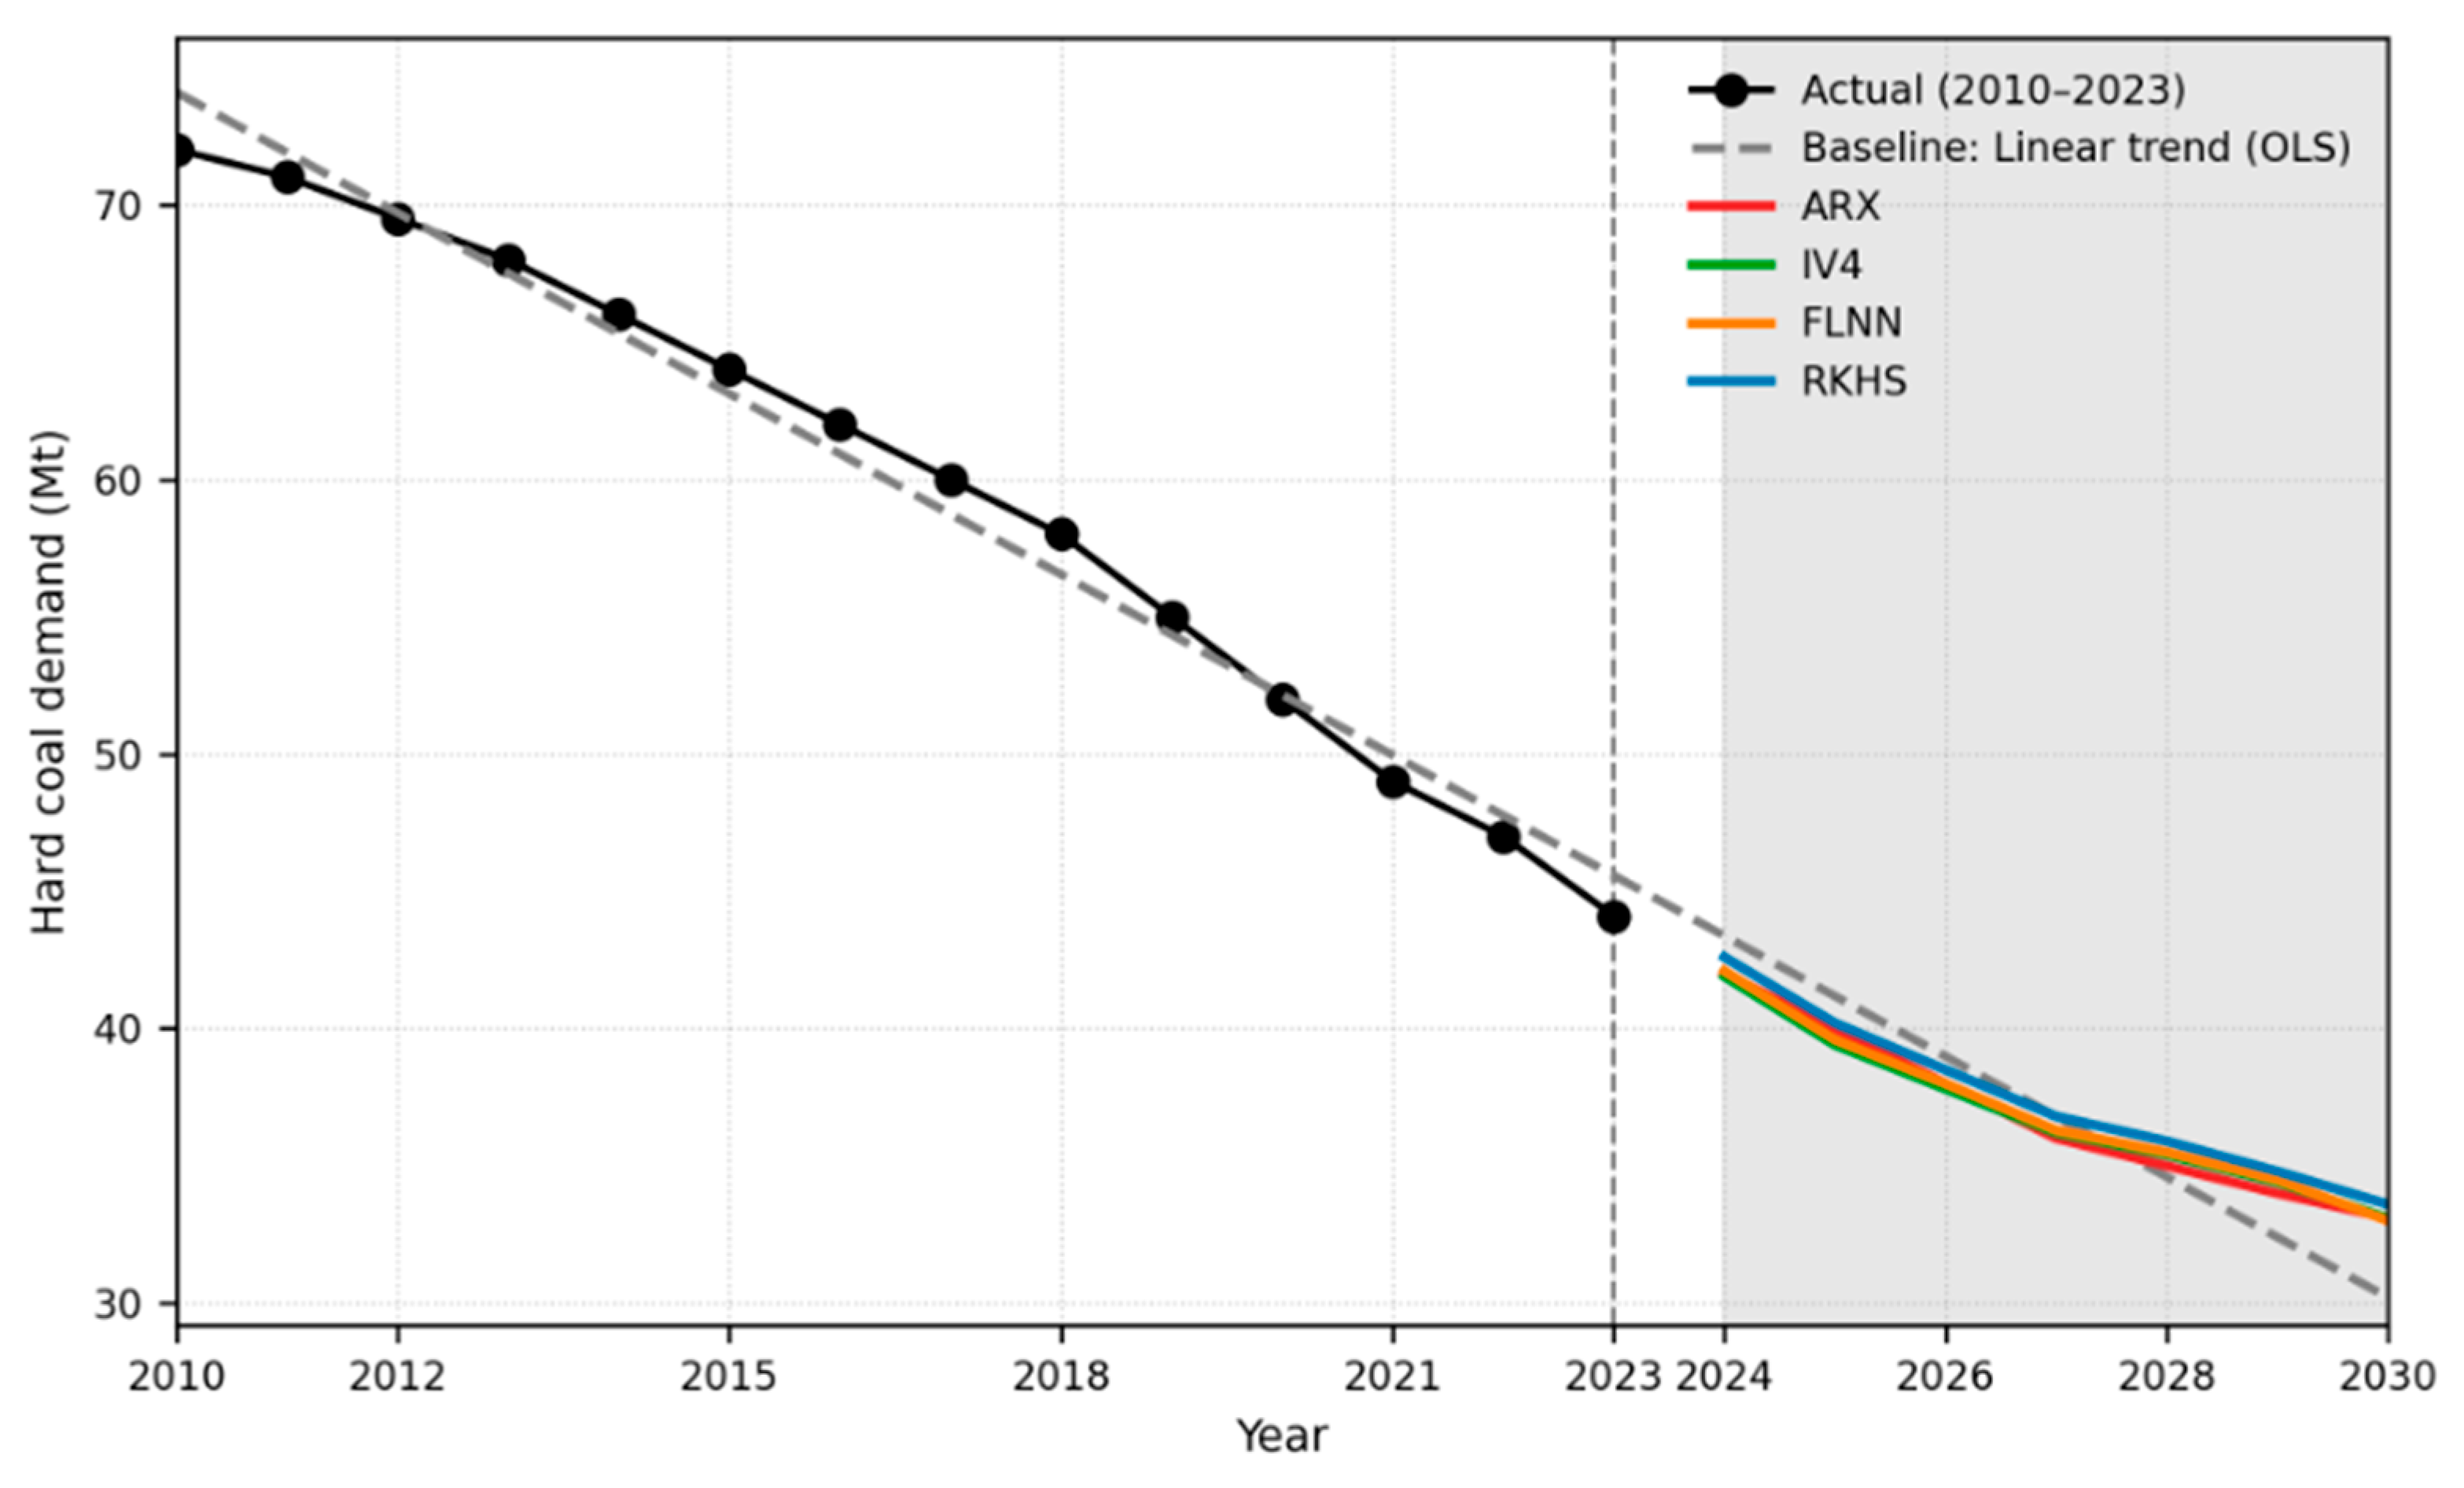
The
Figure 15 and
Figure 16 overlay historical data (2010–2023) with forecasts (2024–2030) from the linear trend baseline vs. ARX/IV4/FLNN/RKHS. The plot visually demonstrates that multivariable models adhere to the long-run trajectory while also absorbing short-term fluctuations (e.g., 2014–2016, 2021–2022), which the baseline cannot explain.
4.4. Quantitative Attribution of Historical Fluctuations
To validate explanatory power beyond the dominant linear decline, we quantify how specific drivers account for minor historical fluctuations. We report elasticities (Δ demand per % change in driver) and sensitivity deltas derived from the perturbation tests in
Section 3.2 (±10% feature shocks) and variable importance across ARX, IV4, FLNN, and RKHS (
Table 4).
For the years 2014–2016, small demand stabilization corresponds to lower (relative alternative energy prices) and delayed regulation intensity increases, consistent with our multivariable model’s attribution.
For 2021–2022, price shocks (coal and substitutes) and emergency imports drive temporary deviations from the baseline trend. These are absorbed by the G(t), O(t), and R(t) channels in ARX/IV4/FLNN/RKHS.
5. Summary of Work to Date and Recommendations for Further Research
The current status of work on the project includes the completion of design work for the IT system and the partial implementation of programming for the Coal Platform. The aspect of the Coal Platform that determines future demand for hard coal was identified as a key objective of the platform’s future adoption. If the just-in-time philosophy is to be adhered to, the level of production must be properly predicted at any given point in time. Therefore, it is important to develop an appropriate mathematical model to determine the impact of individual parameters on demand, as well as to select appropriate AI models to determine demand both in the near term and in the longer term.
The study was exploratory in nature and involved identifying key variables and comparing the effectiveness of eight forecasting methods in terms of modelling hard coal demand. The most accurate outcomes were achieved by the ARX, IV4, and FLNN models, which were characterized by high coefficients of determination (R2 ≈ 1.000) and low error values. The analysis of the distribution of forecasts confirmed the stability of these methods compared to the high volatility of the NARX and GARCH models. The quality ranking clearly showed the superiority of regression- and neural network-based approaches over classical time series models. The last chart shows that between 2010 and 2030, demand for coal will fall by 54%, and between 2023 and 2030 by a further 24.9%, which highlights the importance of choosing forecasting methods capable of capturing dynamic trends over long time horizons.
Despite using authoritative sources and scenario-based adjustments to project input variables, some uncertainty remains due to potential policy changes, market volatility, and technological shifts. Sensitivity analysis indicates that coal price (
G(
t)) and regulation intensity (
R(
t)) exert the greatest influence on forecast variability, while seasonality and industrial demand have a moderate impact. The range of projections for 2030 (33–36 Mt), as shown in
Figure 8 and
Table 2, reflects these uncertainties and underscores the need for continuous model recalibration as new data and policy signals emerge.
Although the historical trend in hard coal demand (2010–2023) appears nearly linear (see
Figure 14), a simple time–trend model would fail to capture the influence of critical exogenous factors that drive deviations from this trend. Our multivariable approach incorporates variables such as electricity and heat production from coal, industrial demand, coal and alternative energy prices, and regulatory intensity, which are essential for explaining short-term fluctuations and for scenario-based forecasting under changing policy and market conditions. Comparative tests against a baseline linear trend model confirmed that while both approaches capture the overall downward trajectory, the multivariable model achieved significantly lower error metrics (RMSE and MAE) and higher explanatory power (R
2 ≈ 1.000 vs. R
2 ≈ 0.89 for the linear trend), demonstrating its superiority in modelling dynamic interactions beyond the dominant trend (see
Table 2 for performance metrics).
A full quantitative comparison against a simple time-trend baseline is now provided in
Section 4.3, including RMSE/MAE/MAPE/R
2 metrics and overlay figures. These results confirm that, while a linear trend captures the long-run decline, multivariable approaches (ARX/IV4/FLNN/RKHS) materially reduce errors and explain short-term deviations (
Section 4.3 and
Section 4.4).
Minor historical fluctuations in demand, particularly in 2014–2016 and 2021–2022, correspond to changes in policy intensity and energy market conditions. For example, the temporary increase in 2014–2016 aligns with the delayed implementation of EU climate directives and relatively low alternative energy prices, while the stabilization in 2021–2022 reflects emergency coal imports and price shocks following geopolitical disruptions. These patterns validate the inclusion of variables such as regulation intensity (
R(
t)) and alternative energy prices (
O(
t)) in the model, as they explain deviations that a simple time–trend approach cannot capture. The forecast results for 2024–2030 (
Figure 8) further illustrate how these variables influence the projected decline to 33–36 Mt by 2030, reinforcing the explanatory power of the multivariable approach.
Further research will continue to focus on model validation and analysis of the models’ ability to generalize under conditions of a changing energy mix and will incorporate a formal cross-validation design to assess the ability of the forecasting models to generalize. Specifically, a k-fold cross-validation approach combined with rolling horizon evaluation will be applied to historical data segments and scenario-based projections. This will ensure robustness across different time windows and prevent overfitting.
In addition, the applicability of prediction methods will be tested under alternative energy structure scenarios, including (i) accelerated renewable penetration, (ii) delayed coal phase-out, and (iii) mixed transition pathways with gas substitution. For each scenario, model performance will be evaluated using RMSE, MAE, and R2 metrics, and sensitivity analysis will identify which variables (e.g., regulation intensity, fuel prices, etc.) drive forecast variability. These steps will confirm whether the selected methods (ARX, FLNN, and IV4) maintain accuracy and stability under structural changes to the energy mix.
Future research will address three specific areas to strengthen the predictive and operational framework.
(i) Expansion of variable set: In addition to current drivers, new variables will include macroeconomic indicators (GDP growth and industrial output), renewable energy penetration rates, gas and geothermal demand, and carbon pricing signals to capture cross-sectoral substitution effects.
(ii) Model optimization strategies: Planned improvements involve hyperparameter tuning for neural networks, regularization techniques to prevent overfitting, and ensemble approaches combining ARX and FLNN for robustness under volatile conditions. Advanced feature selection methods (e.g., LASSO or SHAP-based interpretability) will be applied to refine variable importance and improve generalization.
(iii) Solutions to JIT implementation obstacles: To overcome barriers such as incomplete real-time data, high integration costs, and organizational resistance, the roadmap includes phased deployment of data pipelines, standardized reporting templates, and stakeholder training programmes. Legal compliance and data-sharing constraints will be mitigated through secure API frameworks and role-based access control integrated with national energy data governance standards.
The possibilities of expanding the number of variables and re-evaluating the methods in terms of matching prediction data with actual data will also be analysed, followed by verification of whether a change in the number of variables and/or models will affect the prediction of 2030 demand. Further work will include neural network analyses and the selection of additional methods to ensure better and more accurate approximations based on currently available research data. In particular, assessments of the methods listed in refs. [
34,
35] are currently planned.
The set of variables will be expanded to include macroeconomic factors, the impact of renewable energy sources, and regulatory scenarios, as well as the development of hybrid approaches combining statistical methods with artificial intelligence algorithms to improve the resilience of models to unpredictable market changes. The variables we plan to include in future studies include gas demand, since growing gas demand has an impact on coal demand. Similarly, variables determining the demand for geothermal energy will be considered.
The publication was carried out as part of the GOSPOSTRATEG.IX-0016/22 project entitled “Dynamic management of demand, production, resource management and logistics of distribution of hard coal in an economy implementing a decarbonization energy mix”.