Article

Determinants of Green Energy Penetration in N-11 Countries: A Machine Learning Analysis

by
Najabat Ali
1,2,* and
Md Reza Sultanuzzaman
3,4,*
1
School of Business, Soochow University, Suzhou 215021, China
2
Faculty of Management Sciences, Hamdard University, Islamabad 45550, Pakistan
3
School of Management, Wuhan Technology and Business University, Wuhan 430065, China
4
Department of Environmental Science and Disaster Management (ESDM), Daffodil International University, Daffodil Smart City 1216, Bangladesh
*
Authors to whom correspondence should be addressed.
Energies 2026, 19(2), 541; https://doi.org/10.3390/en19020541
Submission received: 26 December 2025 / Revised: 15 January 2026 / Accepted: 19 January 2026 / Published: 21 January 2026
(This article belongs to the Special Issue Energy Transition and Economic Growth)

Abstract

This study investigates the determinants of green energy penetration in the Next Eleven (N-11) economies over the period 2000–2022, with a particular focus on the roles of foreign direct investment (FDI), green transition, governance quality, industrial growth, and urbanization. The primary objective of the study is to assess how investment flows, structural transformation, and institutional capacity jointly shape the adoption of renewable energy in fast-growing emerging economies. To achieve this goal, the study employs a second-generation panel econometric and machine-learning framework that accounts for cross-sectional dependence, slope heterogeneity, and long-run equilibrium relationships. Specifically, cross-sectional dependence and slope homogeneity tests are conducted, followed by CADF and CIPS unit root tests and the Westerlund cointegration approach. Long-run effects are then estimated using Partialing-Out LASSO and Cross-Fit machine-learning estimators, complemented by SHAP analysis to interpret nonlinear and heterogeneous effects. The results indicate that green transition, governance quality, and urbanization significantly promote green energy penetration. In contrast, FDI and industrial growth exert adverse effects, reflecting carbon-intensive investment and production structures. The findings highlight the importance of coordinated investment strategies, institutional strengthening, and urban planning in accelerating renewable energy transitions in emerging economies. These results provide policy-relevant insights for achieving sustainable energy development while supporting long-term economic growth in the N-11 countries.

1. Introduction

The worldwide energy system is changing drastically, as nations work harder to curb climate change, reduce carbon emissions, and ensure long-term energy security [1]. The rise in the frequency of climate-related tragedies, the increase in atmospheric carbon levels, and the growing instability in fossil fuel markets have heightened the urgency of shifting to clean, renewable energy systems [2]. In this regard, the green energy penetration, which is the proportion of renewable energy to the total final energy consumption, is becoming a key parameter of sustainable progress in energy [3]. Increasing the share of renewables not only helps reduce greenhouse gas emissions and air pollution but also increases energy security, stabilizes long-term energy costs, and supports the development of new technologies and green jobs [4]. Consequently, the growing penetration of green energy has been seen as a pillar of national and international sustainable development policies [5].
Although the shift towards renewable energy is a global concern, success in this area is increasingly influenced by ongoing changes in emerging economies. Out of them, a strategically important role in the global energy arena is taken by the Next Eleven (N-11) countries, i.e., Bangladesh, Egypt, Indonesia, Iran, Mexico, Nigeria, Pakistan, the Philippines, South Korea, Turkey, and Vietnam. Rapid industrialization, accelerating urbanization, increased energy consumption, and further involvement in global investment chains are characteristic of such economies. Concurrently, they have considerable potential for renewable energy [6]. Nevertheless, the development of green energy in the N-11 has been uneven, revealing disparities in economic structures, policy commitments, institutional capacities, and investment conditions. Given their growing manufacturing output, large populations, and increasing contributions to global emissions, the future trajectory of green energy penetration in the N-11 will be critical to mitigating climate change worldwide.
Foreign direct investment (FDI) is one of the most significant drivers of energy change in emerging economies [7]. The international transfer of capital, technology, and managerial skills occurs through FDI, which, in turn, shapes production systems and energy structures in host countries [8]. FDI can accelerate the adoption of renewable energy technologies, energy-efficient production processes, and low-carbon innovations through technological spillovers, supply-chain linkages, and demonstration effects. In doing so, FDI can boost the supply of renewable energy and increase the share of green energy [9]. Simultaneously, the environmental impact of the same remains highly contextual. Although green-oriented FDI enhances the implementation of renewable energy, investment in sectors that rely heavily on fossil fuels can slow the pace of the energy transition, especially where environmental regulation is weak [10].
In addition to investment flows, green transition policies play a key role in the redesign of national energy systems [11]. The institutional support for the green transition includes policy tools such as renewable energy targets, subsidy reforms, carbon pricing, and government investment in clean technologies [12]. These will lower the cost barriers to renewable implementation, increase investor confidence, and enable rapid, large-scale implementation of clean energy infrastructure [13]. With growing climate commitments worldwide, green transition plans continue to dictate the pace and intensity of renewable energy penetration into national energy systems [14].
Simultaneously, the dynamics of green transitions heavily depend on the processes of industrial structure and urbanization [15]. The expansion of industries contributes significantly to energy demand. It may trigger the use of renewable energy sources through clean technologies, or may strengthen reliance on fossil fuels in the absence of regulations aimed at sustainability [16]. On the same note, urbanization transforms consumption patterns, infrastructure demands, and energy demands. Although rapid urban growth can lead to increased reliance on traditional energy sources, well-planned urbanization offers practical opportunities to adopt green energy through intelligent grids, mass transit, and energy-saving buildings [17]. Accordingly, industrialization and urbanization are both simultaneous drivers and potential facilitators of the infiltration of green energy [18].
The quality of governance and institutional effectiveness eventually determines the success of these processes. Good governance guarantees stable regulations, credibility, and the effectiveness of energy and environmental policies, which are necessary for investing in renewable energy sources and sustaining long-term change [19]. Conversely, incentives may be misaligned due to weak governance, regulatory uncertainty, and institutional inefficiencies, thereby discouraging private investment and slowing the adoption of renewable energy [20]. Thus, the quality of governance is a basic determinant of the success of investment, transition, and structural change policies in achieving high green energy penetration [21].
Despite the growing literature on renewable energy and environmental sustainability, important gaps remain in understanding how investment flows, structural transformation, and institutional quality jointly shape green energy penetration. Existing studies, such as Haseeb et al. [22], rely on second-generation panel estimators applied mainly to developed-country contexts and do not capture nonlinear or high-dimensional interactions, while Uddin & Shahbaz [23] employ causal machine-learning frameworks that omit key structural and institutional determinants of green energy outcomes. Moreover, rapidly growing emerging economies particularly the Next Eleven (N-11) countries have not been systematically examined under a unified analytical framework, despite their rising energy demand, industrial expansion, and increasing contribution to global emissions.
This study makes three original contributions. First, it provides the first comprehensive analysis of green energy penetration in the N-11 economies over the period 2000–2022, focusing on the joint roles of foreign direct investment, green transition policies, governance quality, industrial growth, and urbanization. Second, it integrates second-generation panel econometric diagnostics with advanced causal machine-learning methods such as Partialing-Out LASSO and Cross-Fit estimators to address cross-sectional dependence, heterogeneity, endogeneity, and nonlinear relationships within a single empirical framework. Third, it employs SHAP-based interpretability techniques to decompose machine-learning predictions and quantify the relative contribution of each determinant to green energy penetration, thereby enhancing transparency and policy relevance. Collectively, these contributions extend the energy transition literature by offering robust, policy-relevant evidence on how emerging economies can align rapid economic growth with sustainable energy transitions.
The remainder of this paper is organized into five sections. Section 2 reviews the relevant literature on the penetration of green energy and its major determinants. Section 3 presents the theoretical framework, develops the research hypotheses, and describes the data and methodology. Section 4 reports and discusses the empirical findings. Finally, Section 5 concludes with key policy implications and directions for future research.

2. Literature Review

2.1. Integrated Literature Overview and Theoretical Foundations

The growing urgency of climate change mitigation and energy security has positioned green energy penetration (GEP) at the center of sustainable development strategies worldwide [24]. A substantial body of literature recognizes that a single factor does not drive the expansion of renewable energy; rather, it arises from the complex interplay of international capital flows, structural economic transformation, urban dynamics, and institutional quality [25]. Among these drivers, foreign direct investment (FDI) has received considerable attention for its role in facilitating technology transfer, knowledge spillovers, and access to modern energy infrastructure, thereby supporting the deployment of renewable energy in host economies [26]. At the same time, green transition, including renewable energy targets, carbon regulations, and clean energy subsidies, is increasingly seen as the institutional backbone shaping long-term energy restructuring [27]. Complementing these forces, industrial growth and urbanization significantly alter national energy demand patterns and investment needs, potentially accelerating the adoption of renewables through scale effects, infrastructure expansion, and market deepening, while also posing risks of fossil-fuel lock-in [28]. Finally, the effectiveness of all these mechanisms is fundamentally conditioned by governance quality, which determines regulatory credibility, policy enforcement, and investor confidence. Together, this literature suggests that the penetration of green energy results from an integrated system in which investment, transition strategies, structural change, urban expansion, and institutional capacity jointly shape the pace and direction of renewable energy development [29].
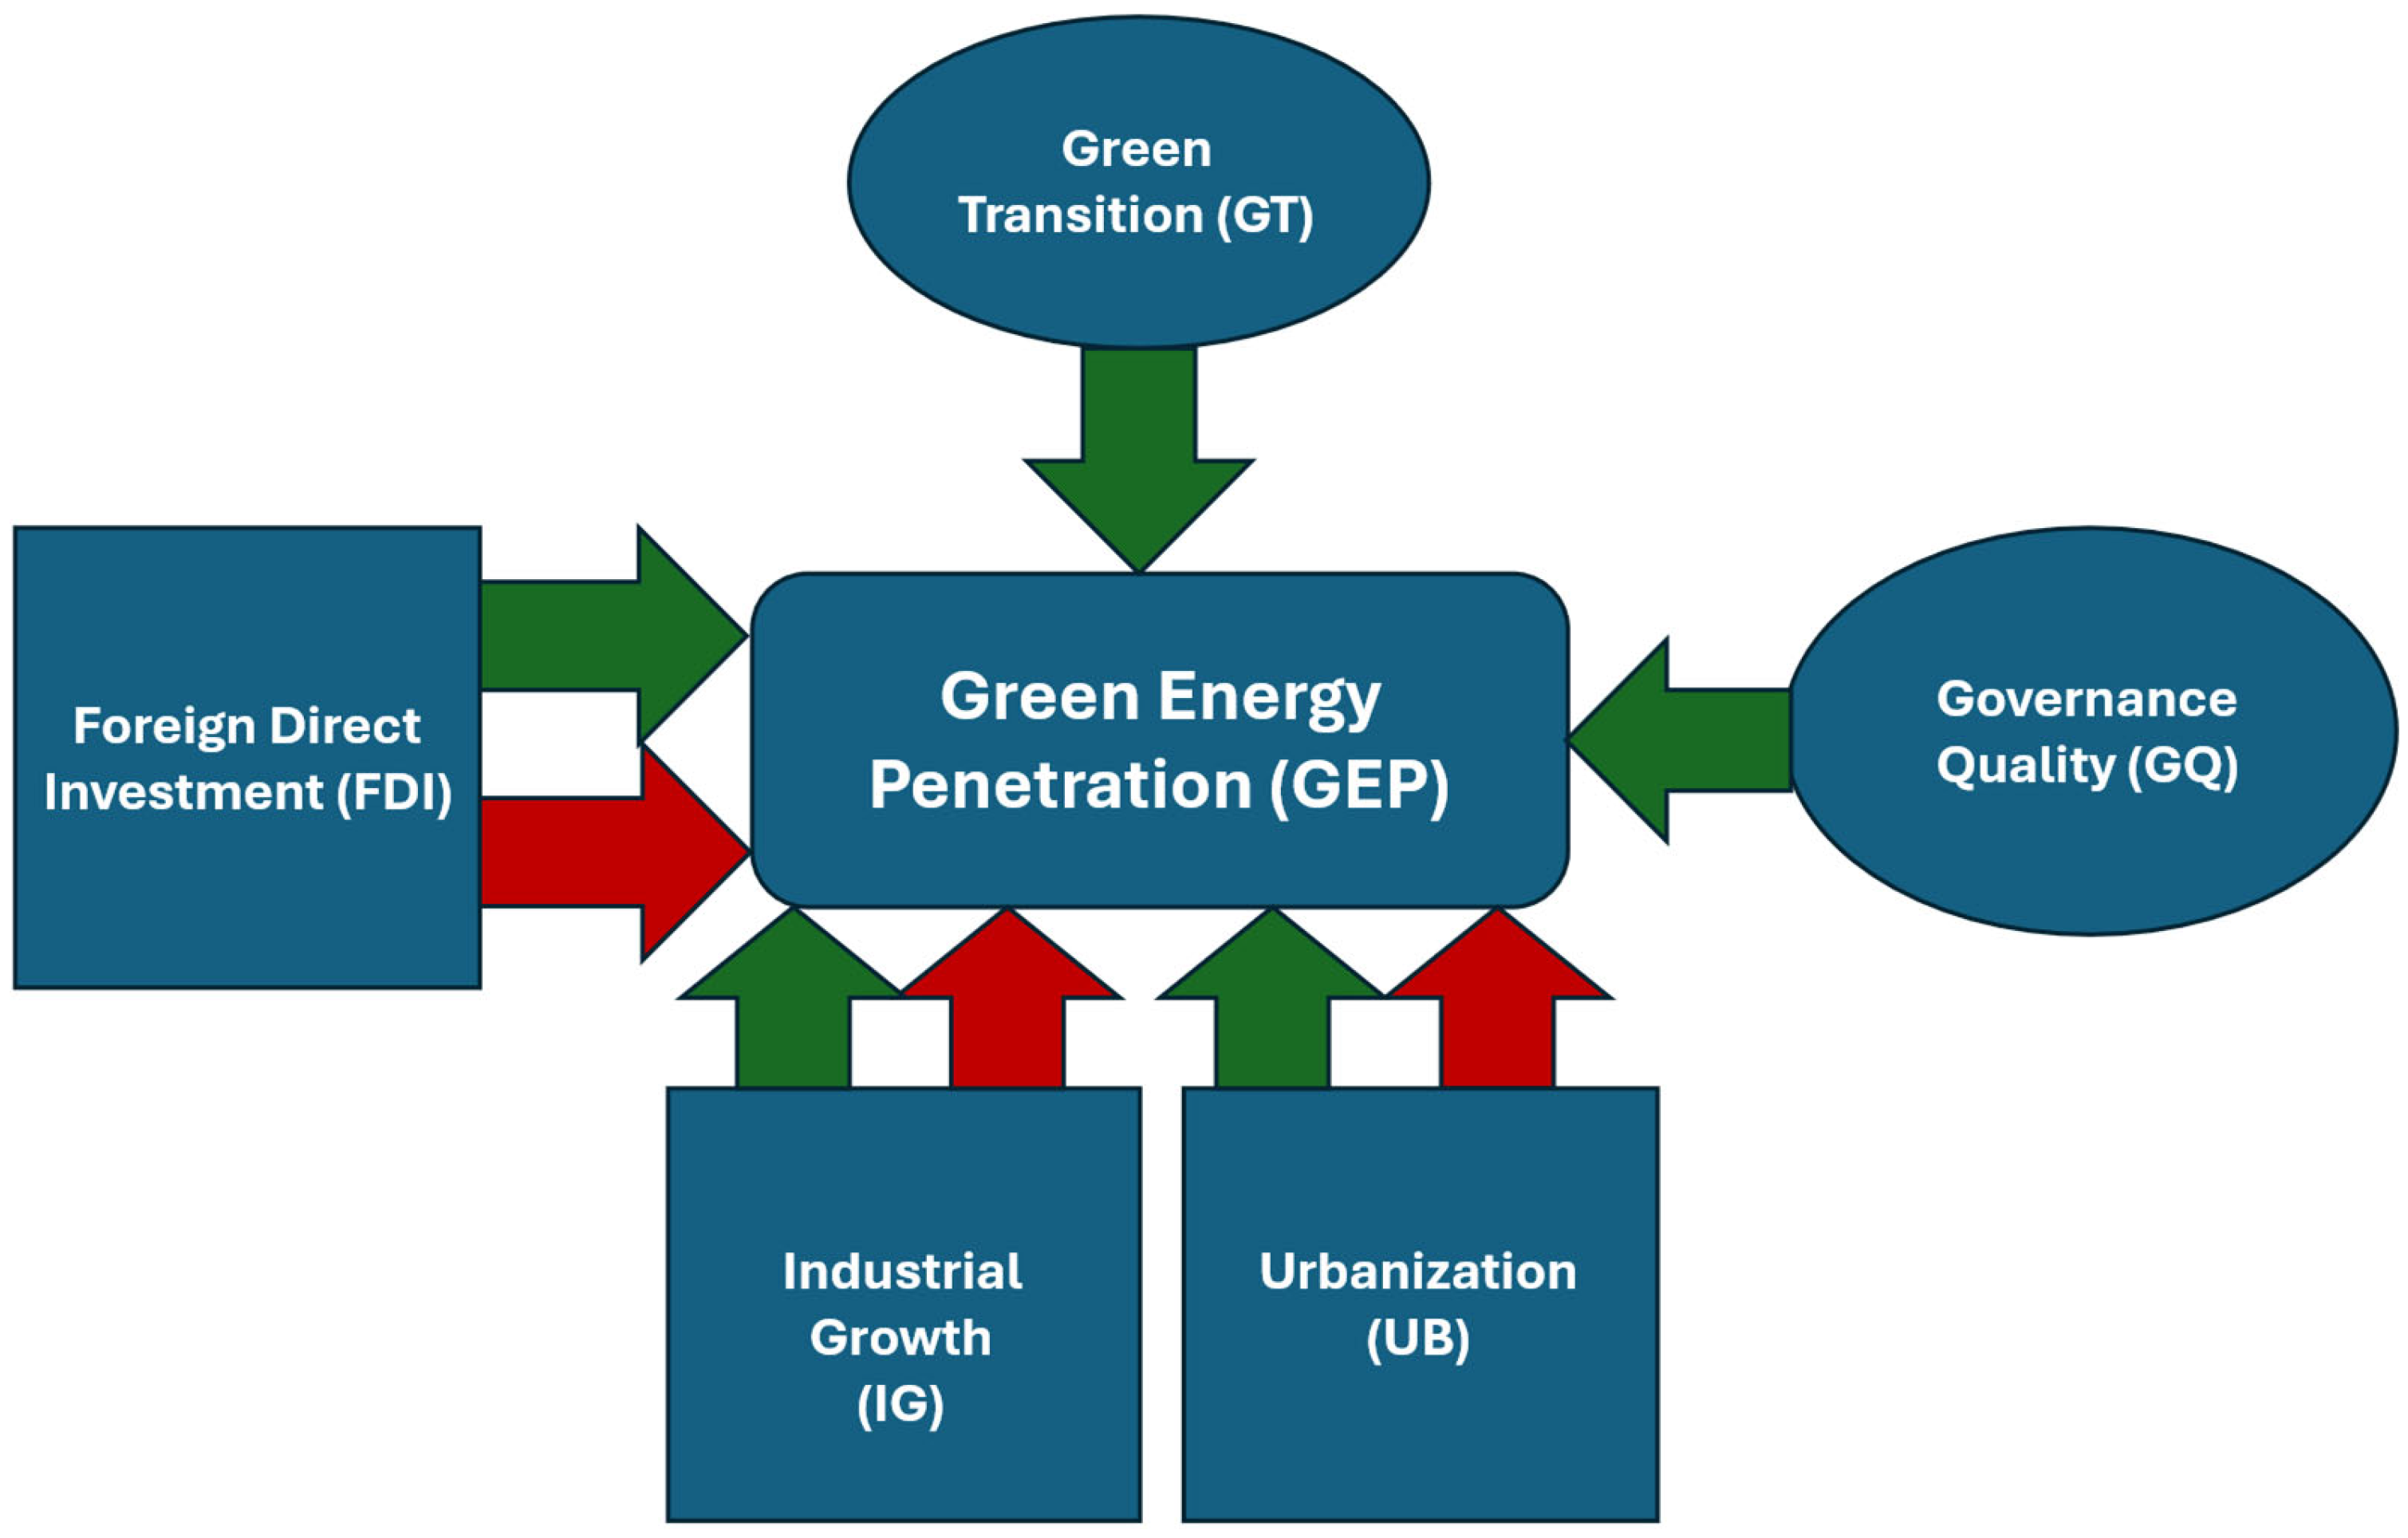
This study is grounded in structural change theory, ecological modernization theory, urban transition theory, and investment-led technology diffusion theory, which together explain how foreign direct investment, green transition policies, governance quality, industrialization, and urbanization jointly shape green energy penetration. Building on this theoretical foundation, Figure 1 presents the conceptual framework linking key economic, policy, structural, and institutional factors to green energy penetration. The following subsections review the literature on each determinant individually to motivate hypothesis development.

2.2. FDI and Green Energy Penetration

The existing literature offers diverse opinions on the association between FDI and renewable energy penetration. Two schools of thought exist that explain the relationship between FDI and renewable energy penetration. The first school of thought follows the pollution haven hypothesis, which posits that enterprises that pollute the environment shift their operations to countries with weaker environmental regulations to avoid such restrictions, and that these enterprises then set up operations in developing countries that depend mainly on non-renewable energy sources, thereby contributing to environmental degradation. From this perspective, FDI is considered a significant factor in reducing the penetration of renewable energy. Recent studies in the literature confirm this hypothesis and show that FDI significantly reduces the use of renewable energy, particularly when regulatory stringency is not up to standard [10]. Certain mechanisms explain the association between FDI and renewable energy consumption. These mechanisms specifically involved the Scale effect, technique effects, and regulatory effect [30]. The scale effects support the pollution haven hypothesis and indicate that increased FDI in the host country is associated with greater production. To reduce production costs, firms typically rely on low-cost non-renewable energy sources, thereby decreasing renewable energy use and contributing to environmental degradation [31]. Additionally, the regulatory effects revealed that the developing economies face both challenges of economic growth and environmental sustainability, and to improve the economic growth, they have relaxed environmental regulations and attracted polluting FDI that discourages the use of renewable energy and compromises environmental sustainability [32]. In addition to these results, many studies report an inverse association between FDI and renewable energy penetration, as in Kang et al. [33], who used data on South Asian economies from 1990 to 2019. This study revealed that increasing FDI reduces renewable energy penetration by 3.36%. Similar results are reported by Grabara et al. [34] in Kazakhstan and Uzbekistan, who found that FDI is negatively associated with renewable energy penetration because it is primarily used in highly polluting industries, such as mining. In addition, numerous studies in the literature document a negative association between FDI and renewable energy penetration [35].
On the other hand, the pollution halo hypothesis holds that FDI brings technological innovation to the host country and is involved in green transformation and the use of renewable energy resources, thereby promoting environmental sustainability [36]. Many studies in the existing literature support this hypothesis and reveal that, due to technical effects, FDI drives technological innovation and uses renewable energy resources in economic activities, thereby promoting environmental sustainability [37]. Recently, many studies investigated the role of FDI on economic growth and environmental quality in China and found that FDI brings positive change in promoting sustainable economic development by introducing technological innovation in the country [38].
Although these studies make significant contributions to the existing literature on the effects of FDI on renewable energy penetration, there is no consensus among scholars on the association between FDI and renewable energy penetration; therefore, further studies are warranted to investigate the impact of FDI on renewable energy penetration across different regions and economies. Based on the above discussion, the present study hypothesized that
H1. 
FDI has a positive effect on the renewable energy penetration.

2.3. Green Transition Policies and Renewable Energy Penetration

The green energy transition refers to the shift from traditional, carbon-intensive energy sources to renewable, environmentally friendly sources. This transition has a significant impact on environmental preservation [39]. Recently, Haseeb et al. [22] examined the effects of the green transition on renewable energy penetration, using data from five developed European economies from 2000 to 2022. This study revealed that green transition initiatives significantly enhance the penetration of renewable energy. Zhang et al. [40] investigated the impact of green transition policies on energy firms in China from 2004 to 2021. The study documented that policies relevant to the green transition are significantly helpful in green energy development. Yeboah et al. [41] suggested that targeted green policies are necessary to establish renewable energy infrastructure. These results are also reported by Xue et al. [42], who argue that green industrial policies are essential to the green transition and decarbonization. This study also revealed that green investment is helpful for green transition and global decarbonization. Another study by Javed et al. [43] also investigated the impact of green policies and green technological innovation on renewable energy consumption and sustainable economic development. This study revealed that stringent renewable energy policies in G-7 countries significantly increase the consumption of renewable energy relative to non-renewable energy. Moros-Daza et al. [44] demonstrate that targeted policy instruments such as subsidies, tax incentives, and environmental regulations are essential for advancing the green transition and promoting renewable energy penetration. Ma et al. [45] recently conducted a study using data on the top and least green economies for the period 1990 to 2021. This study found that environmental protection policies are effective in achieving the carbon-neutrality target. This study further suggested that the least green economies require strict implementation of green policies to achieve sustainability targets. Based on the above discussion, we hypothesize that
H2. 
Green transition policies have a positive impact on renewable energy penetration.

2.4. Governance Quality and Renewable Energy Penetration

Governance quality is generally referred to as the effectiveness of governance, the rule of law, regulatory quality, accountability, and overall performance. Effective governance is essential for facilitating economic activities and leveraging environmental technologies to address environmental concerns. It is also involved in a smooth taxation system that supports innovative technologies, promotes the use of renewable energy resources, and ensures sustainable growth [46]. Many studies in existing literature found governance quality to be an essential determinant of green transformations. For instance, Shang et al. [47] revealed that effective governance not only sets policies for green energy utilization but also implements them and adopts renewable energy resources effectively. Haseeb et al. [22] revealed that effective governance is necessary for the transition from conventional carbon-emitting energy resources to renewable, environmentally friendly energy resources. This study further revealed that policies such as environmental taxes, cost-effective energy resources, and green financing direct resources towards green energy and environmental sustainability. Similar results are also reported by Mahmood et al. [48], who revealed that good governance increases energy consumption across all sectors and leads to a preference for renewable energy over non-renewable energy.
On the other hand, some studies report diverse results regarding the impact of governance quality on green transition. For example, Asongu et al. [49], using data from African economies, found an inverse relationship, indicating that high governance quality is associated with a slower green transition. Similar findings are reported by Gyimah et al. [50] who document an adverse association between governance quality and environmental sustainability, indicating that higher governance effectiveness is linked to increased carbon emissions through greater reliance on non-renewable energy sources.
Based on the above discussion, it is evident that governance quality has diverse effects on energy utilization. In some regions, it increases the use of non-renewable energy, whereas in others it promotes the use of renewable energy. These findings suggest that further studies should be conducted to explore its impact across areas and then compare these regions. This study aims to identify the effect of governance quality on renewable energy penetration in the Next eleven countries. The study hypothesized that
H3. 
Governance quality has a positive impact on renewable energy penetration.

2.5. Industrial Structure and Renewable Energy Penetration

Industrial structure is another major determinant of renewable energy penetration in an economy. When countries make a transition from a traditional to a green economy, they make major legislative and policy decisions and invest in technologies to reshape the industrial structure that supports the penetration of renewable energy. Zhao et al. [51] revealed that the upgradation of industrial structure helps to alter the change in energy resources and results in the adoption of renewable energy in China. Fu et al. [52] suggested that countries with high economic growth should pay more attention to changing the industrial structure to reduce carbon emissions. Countries should restructure their industrial base and adopt renewable energy to improve environmental quality. This study concludes that industrial structure and renewable energy penetration are interconnected and significantly contribute to environmental sustainability. Liu [53] reported that the use of robots in industries significantly reduces the use of fossil fuels and changes the industrial structure, resulting in the optimization of the energy structure of highly industrialized countries. Recently, Haseeb et al. [22] revealed that rapid industrial growth has a significant positive impact on the penetration of renewable energy. Further analysis showed that governments should develop industrial planning to transition from traditional energy resources to environmentally efficient ones.
These results suggest that industrial structure is another major determinant of the use of traditional energy resources or the shift from these to environmentally efficient renewable energy resources. Based on this discussion, we hypothesized that
H4. 
Industrial structure has a positive impact on renewable energy penetration.

2.6. Urbanization and Renewable Energy Penetration

Existing literature presents diverse views on the relationship between urbanization and the penetration of renewable energy. Overall, the literature identifies two competing perspectives on the relationship between urbanization and renewable energy penetration. One school of thought argues that urbanization promotes renewable energy adoption, while the other suggests that it hampers the transition toward clean energy. For instance, Zhao et al. [54] demonstrate that urbanization plays a pivotal role in advancing the green energy transition in China by facilitating the adoption of clean energy resources, thereby increasing renewable energy penetration and reducing environmental degradation. Similar evidence is provided by [55] who show that urbanization increases overall energy demand, thereby stimulating the use of renewable energy and contributing positively to environmental sustainability.
Conversely, recent studies report that rapid urbanization may hinder renewable energy adoption. For instance, ref. [22] find that accelerated urbanization in China reduces the use of renewable energy and argue that substantial industrial restructuring and stronger green energy policies are necessary to support renewable energy penetration. Similar evidence is provided by Salim et al. [56] who show that urbanization significantly constrains renewable energy use and reinforces reliance on traditional industrial structures. Their findings further indicate that urbanization promotes dependence on non-renewable energy sources, thereby exacerbating environmental degradation [57]. Vo et al. [58] report that urbanization adversely affects renewable energy penetration in the short run but exerts a positive effect in the long run across ASEAN countries, highlighting dynamic adjustment effects. In line with this long-run perspective, Dilanchiev et al. [59] found a positive association between urbanization and renewable energy penetration.
The above discussion of the association between urbanization and renewable energy penetration demonstrates the diversity of scholarly opinion. These results indicate that further studies are warranted to obtain additional evidence and to conclude the discussion. For this purpose, the present research hypothesized that
H5. 
Urbanization has a positive impact on the penetration of renewable energy in the Next 11 countries.

3. Data and Methodology

3.1. Variables of the Study

The study aims to examine the effects of foreign direct investment, green transition, Industrial Growth, Urbanization, and Governance quality on the green energy penetration of Next Eleven (N-11) countries, including Vietnam, Turkey, South Korea, the Philippines, Pakistan, Nigeria, Mexico, Iran, Indonesia, Egypt, and Bangladesh. Due to data availability, we used data from the World Development Indicators (WDI) database (World Bank, Washington, DC, USA), the World Governance Indicators (WGI) database (World Bank, Washington, DC, USA), and the International Renewable Energy Agency (IRENA) database (IRENA, Abu Dhabi, United Arab Emirates) for the period 2000–2022. Table 1 presents the definitions of the variables, their units of measurement, and the data sources.

3.2. Descriptive Statistics

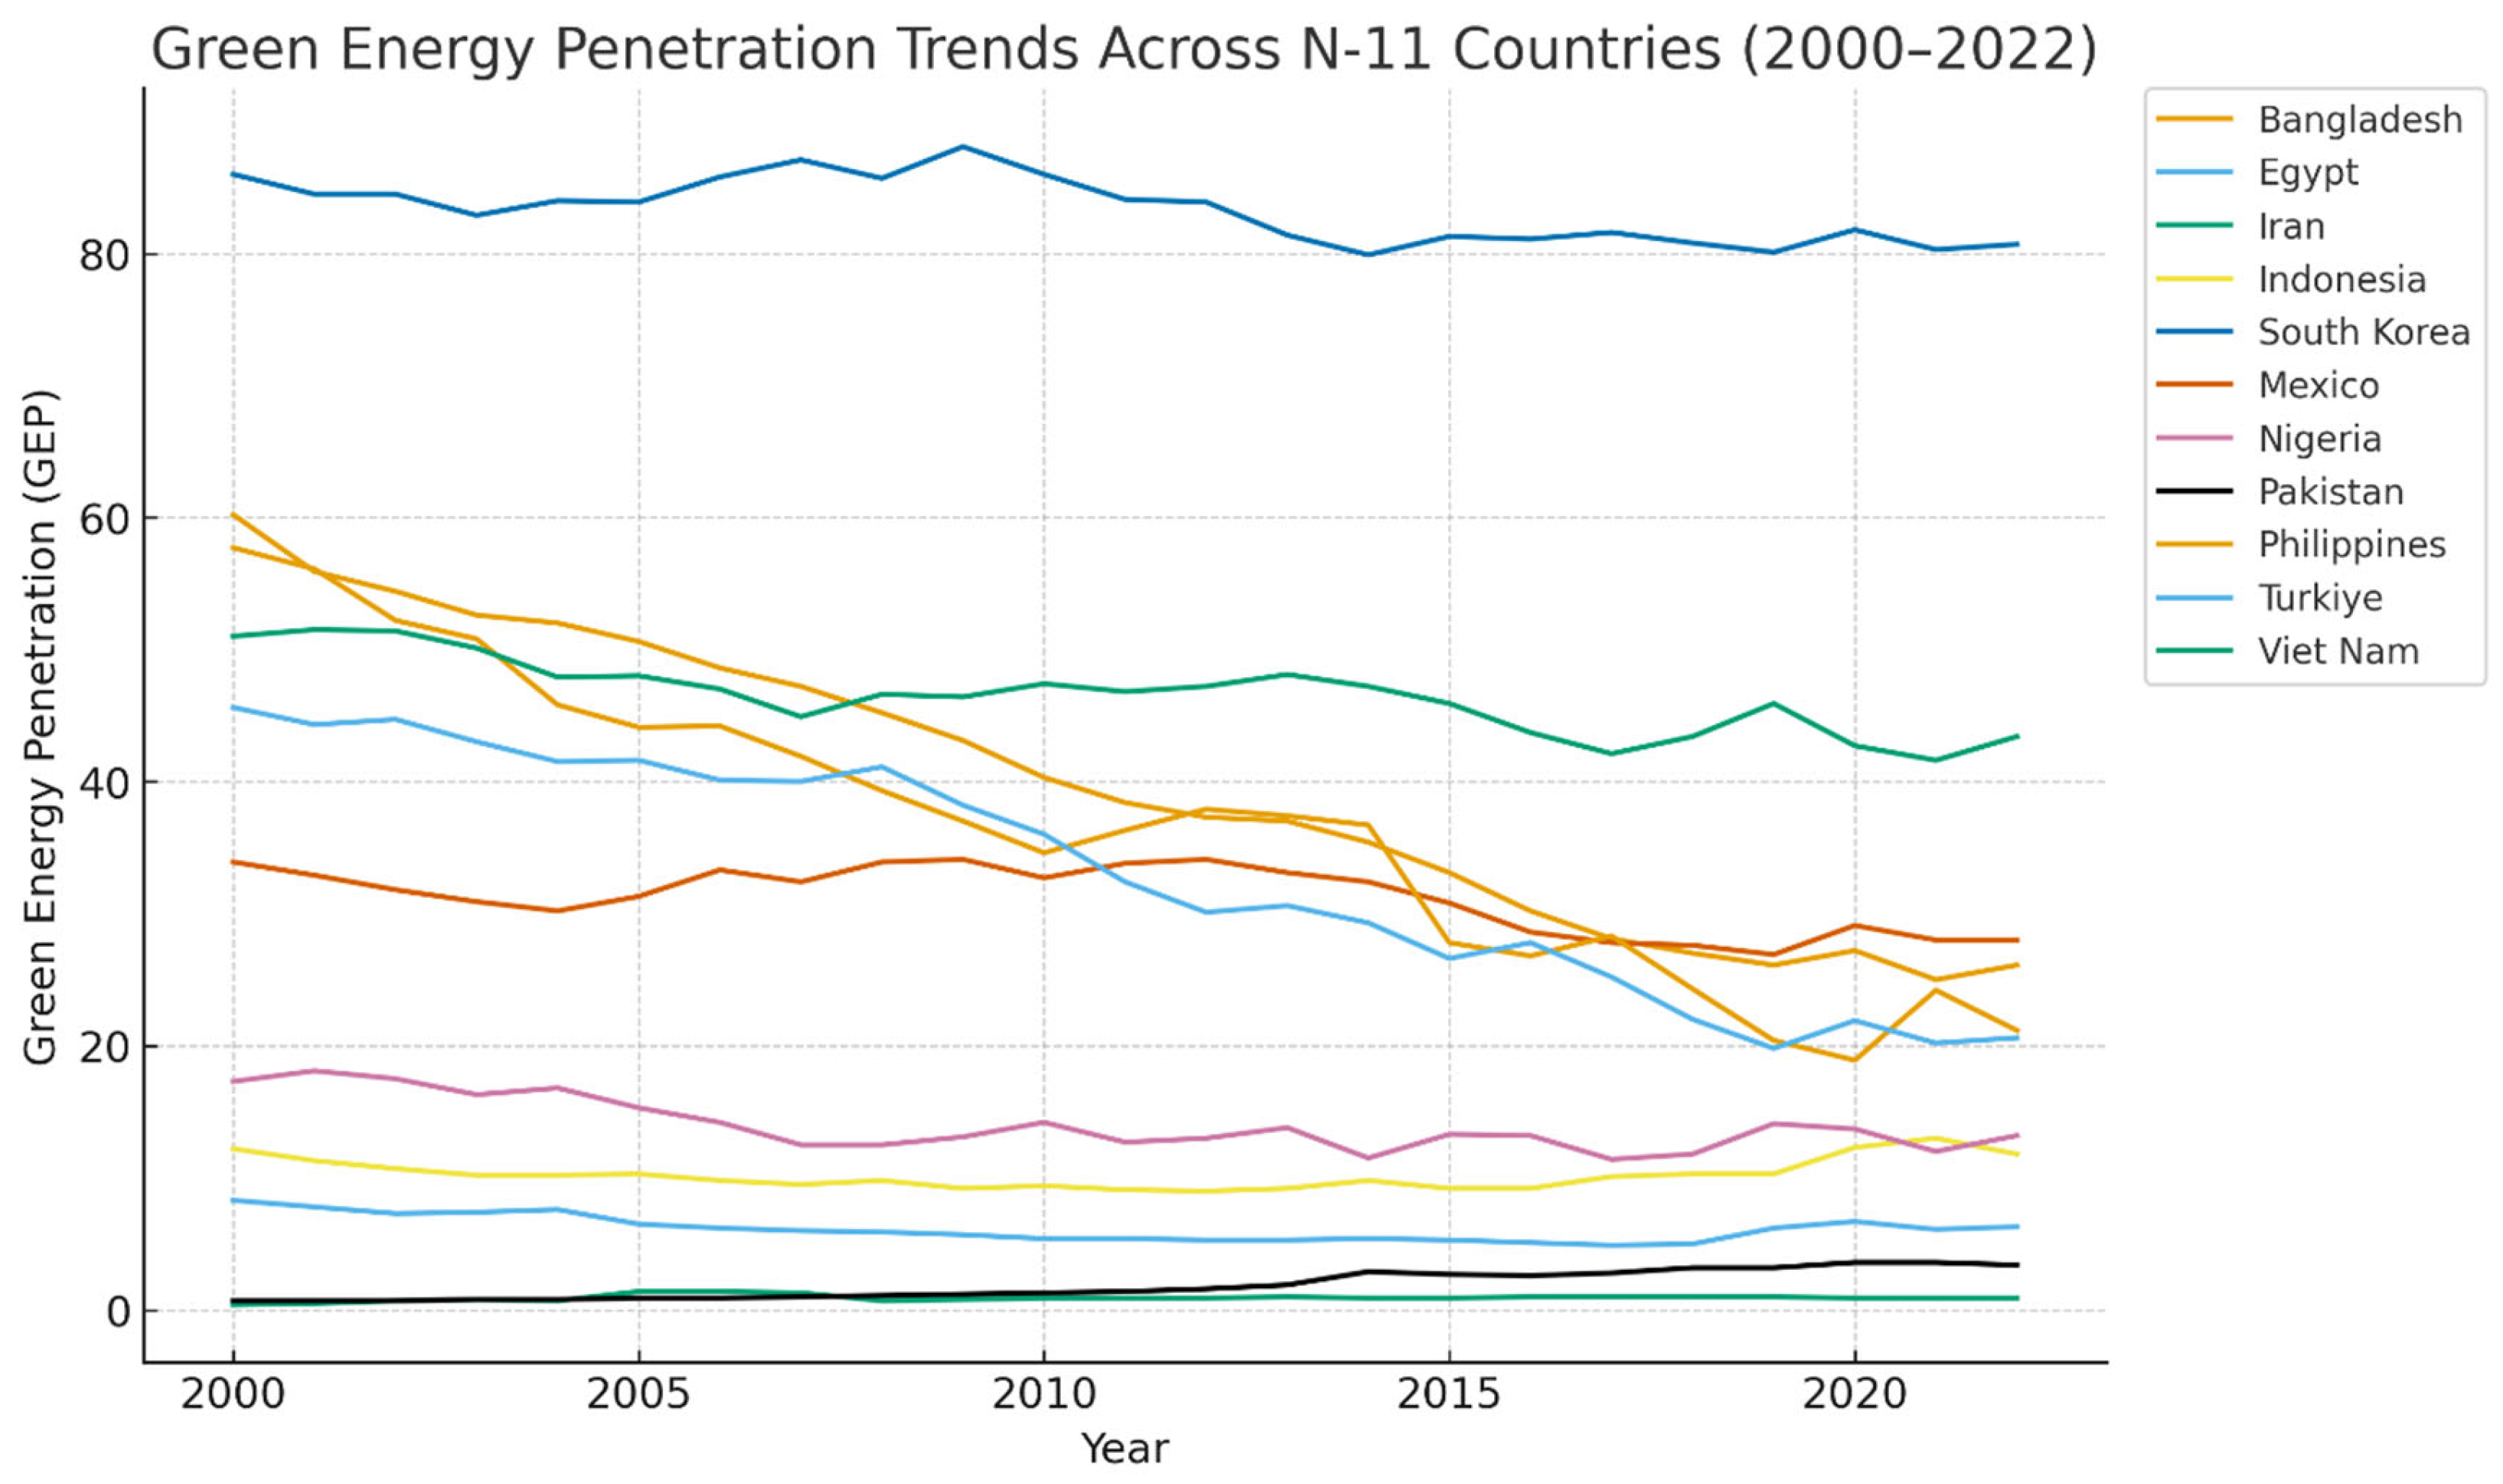
Table 2 reports descriptive statistics for all variables across the N-11 economies over the period 2000–2022, including the mean, median, standard deviation, minimum, and maximum values. The statistics summarize key characteristics of green energy penetration (GEP), foreign direct investment (FDI), green transition (GT), industrial growth (IG), urbanization (URB), and governance quality (GQ). The penetration of green energy averages 28.7%, ranging from 0.4% to 88.1%. The increasing penetration of green energy over time indicates sectoral progress. The mean value of outward foreign direct investment is 0.66, with a minimum of −1.24 and a maximum value of 3.93. The average share of green transition is 20.66, with a minimum of 0.99 and a maximum of 52.67. This trend indicates a significant shift from nonrenewable to renewable energy. Industrial growth averages 30.6 and ranges from 17.16 to 49.64, with a standard deviation of 7.67. This implies relatively stable industrial development across countries; however, notable structural changes and shifts in industrial capacity were observed. Urbanization has a mean of 48.72 and a high range of 23.59 to 81.73. Standard deviation was calculated at 18.63. These values highlight a significant disparity in population density and urban population patterns across the panel of N-11 countries. Finally, governance quality averages at −0.76, with a minimum of −1.54, a maximum of 1.02, and a standard deviation of 0.49. The negative mean value of governance quality indicates a lower level of governance quality across the panel, and the high range suggests significant variation in governance effectiveness and institutional structures across the N-11 countries. For completeness, country-level trends in green energy penetration are illustrated in Figure A1 in the Appendix A.

3.3. Model Specification

This study adopts a second-generation panel econometric and machine-learning estimation strategy. The empirical model is specified with green energy penetration (GEP) as the dependent variable, foreign direct investment (FDI), green transition (GT), and governance quality (GQ) as the main regressors, and industrial growth (IG) and urbanization (URB) as control variables. Cross-sectional dependence is examined using the Breusch–Pagan LM [60], Pesaran scaled LM [61], bias-corrected LM [62], and Pesaran CD tests [61], followed by the Pesaran and Yamagata [62] slope homogeneity test to assess parameter heterogeneity. Given the presence of cross-sectional dependence, second-generation CADF and CIPS unit root tests are applied to determine the order of integration [63]. Long-run equilibrium relationships are then examined using Westerlund’s (2007) [64] error-correction-based panel cointegration test, using both group-mean and panel statistics. Conditional on cointegration, long-run effects are estimated using Least Absolute Shrinkage and Selection Operator (LASSO) [65] based Partialing-Out LASSO Regression (POLR) [66] and its Cross-Fit (double machine learning) [67] extension to allow for causal inference under high-dimensional controls. To address potential endogeneity and reverse causality, an instrumental variable two-stage least squares (IV–2SLS) approach is implemented using lagged values of FDI and GT as instruments, and consistency between the machine-learning and IV estimates is used to confirm the robustness and causal stability of the results [68].
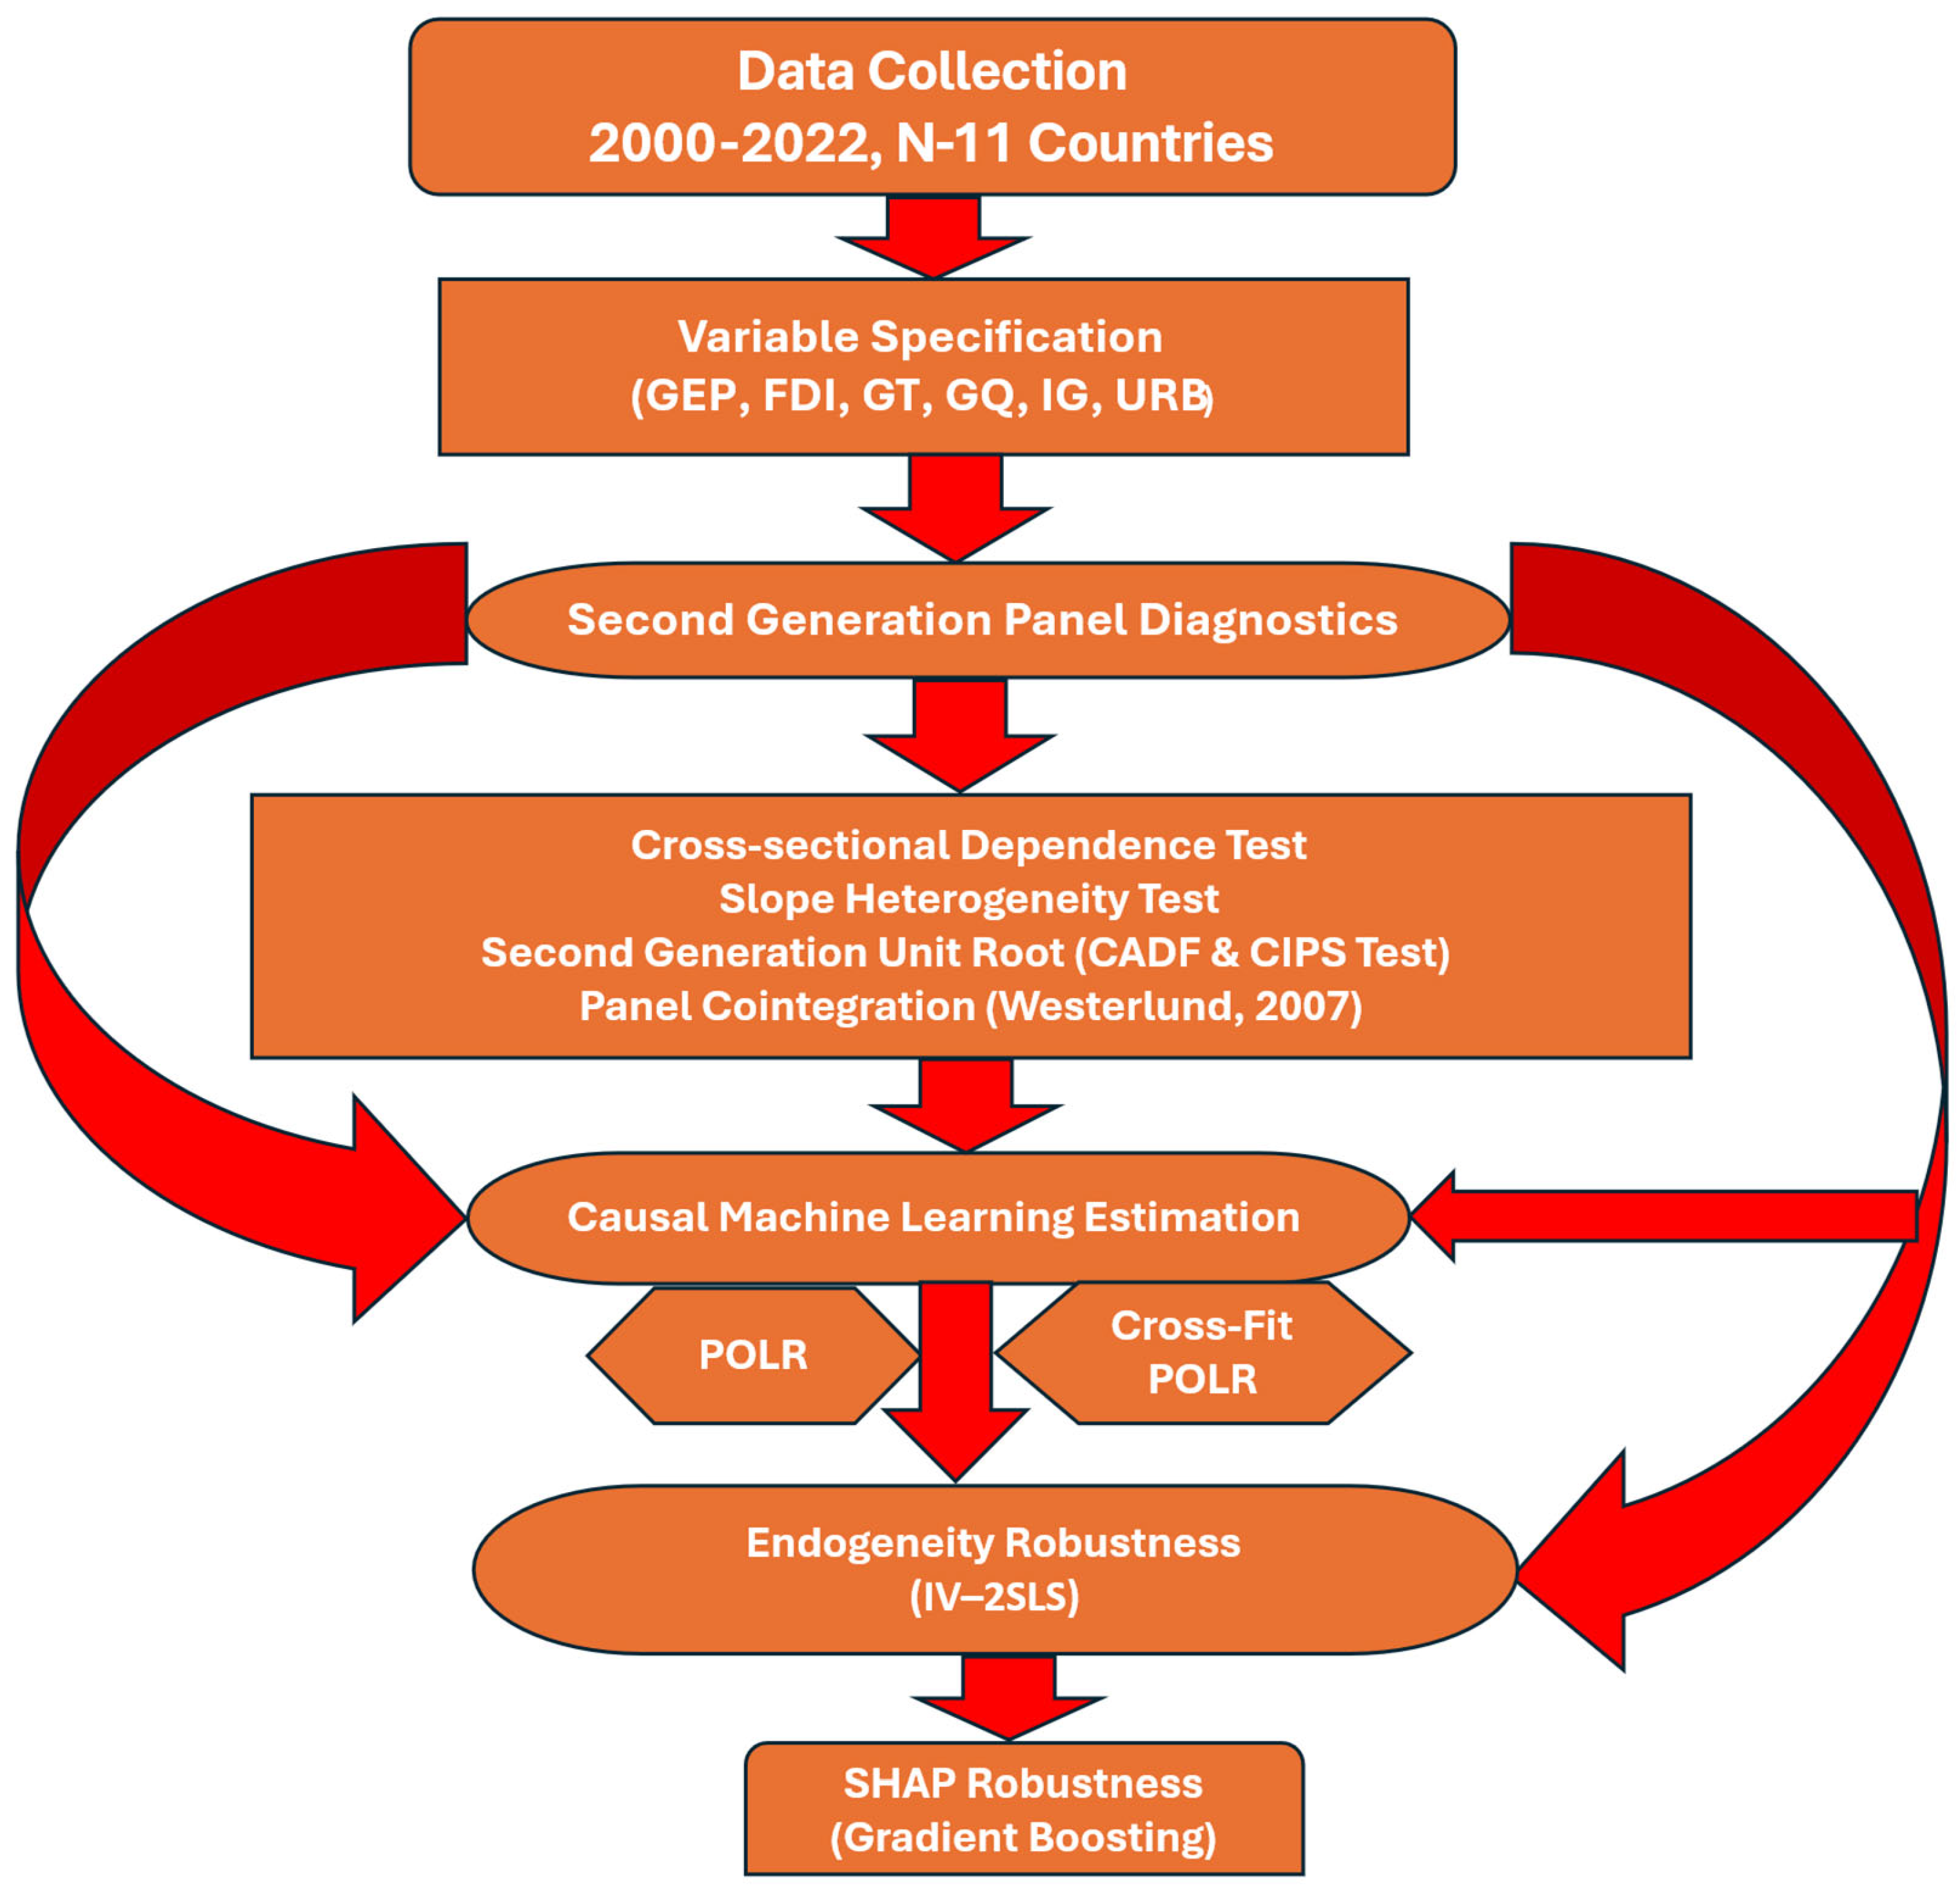
Lastly, to increase the transparency and applicability of the machine-learning estimates, the paper uses Shapley Additive Explanations (SHAP) [69] to decompose the estimated green energy penetration into variable-specific explanations. The SHAP model enables the determination of the relative significance, direction, and nonlinear impact of FDI, the green transition, industrial growth, urbanization, and governance quality. To ensure robustness, an alternative tree-based boosting algorithm is used to validate the SHAP estimates, and consistency in dominance rankings across models indicates that the estimates are not sensitive to the choice of algorithm. For completeness, a schematic overview of the empirical estimation strategy is provided in Figure A2 in Appendix A.
Haseeb et al. [22] adopt a dynamic panel framework that allows for both short-run and long-run relationships among the variables. The study examines the effects of foreign direct investment, the green transition, governance quality, industrial growth, and urbanization on green energy penetration, integrating a comprehensive empirical framework. The mentioned explanatory variables are essential for capturing their associations with the dynamics of green energy penetration. Accordingly, the econometric model underlying this investigation is presented in Equation (1).
G E P i t = f F D I i t , G T R i t , G Q T i t , I G R i t , U R B i t
where i denotes the country, and t represents time. GEP denotes green energy penetration, which represents the share and diffusion of renewable energy within the total energy system. FDI denotes foreign direct investment, GT represents the green transition, and GQ denotes governance quality; together, these constitute the core explanatory variables. Meanwhile, IG and URB represent industrial growth and urbanization, respectively, and are included as control variables to capture structural economic and demographic influences on the penetration of green energy.
For econometric estimation, the functional relationship in Equation (1) is further expressed in a linear panel data framework as follows:
G E P i t = α 0 + β 1 F D I i t + β 2 G T i t + β 3 G Q i t + β 4 I G i t + β 5 U R B i t + ε i t
where i = 1,2 , , n , denotes countries, i = 1,2 , , n shows the time period and α 0 is the intercept term. β 1 , . . ,   β 5 are the slope parameters to be estimated. ε i t is the error term.

3.3.1. Cross-Sectional Dependence Test

Countries are closely interconnected through socio-economic activities such as trade, foreign direct investment, financial integration, and energy market interactions, which generate strong interdependencies across economies. These linkages may give rise to cross-sectional dependence (CD) in panel data due to common global shocks, spillover effects, and model misspecification, as highlighted by Chudik et al. [70]. Ignoring such dependence can lead to biased and inconsistent parameter estimates, as documented by Breusch et al. [60], Pesaran [61], and Phillips et al. [71]. Therefore, testing for cross-sectional dependence is a crucial prerequisite for producing reliable and robust panel data estimates.
The general panel regression model used to test cross-sectional dependence is specified as:
Y i t = α i + β i X i t + ε i t
where X i t is a vector of explanatory variables.
To detect cross-sectional dependence, the Lagrange Multiplier (LM), introduced by Breusch et al. [60], is employed, which is defined as:
L M = T i = 1 N 1 j = i + 1 N ρ i j 2 ^
where ρ i j 2 ^ represents the estimated pairwise correlation coefficient of the residuals obtained from the OLS estimation of Equation (3), N denotes the number of cross-sectional units, and T is the time period.
The null hypothesis of the LM test assumes no cross-sectional dependence, which is expressed as:
H 0 : Cov ε i t , ε j t = 0
while the alternative hypothesis assumes the existence of cross-sectional dependence:
H 1 : Cov ε i t , ε j t 0
For panels with large cross-sectional dimensions, an adjusted version of the LM test proposed by Pesaran is applied to correct for size distortions. The Pesaran CD test is given as:
C D = 2 T N N 1 i = 1 N 1 j = i + 1 N ρ i j ^
where ρ i j ^ refers to the pairwise correlation coefficient obtained from the residuals of Equation (3). The CD statistic follows a standard normal distribution under the null hypothesis of cross-sectional independence.

3.3.2. Slope Homogeneity

In conventional panel data models, it is often assumed that slope coefficients are homogeneous across cross-sectional units. However, this assumption is highly restrictive in practice, particularly in multi-country panels where economies differ substantially in institutional structures, economic development, energy systems, and policy frameworks. Ignoring slope heterogeneity can lead to biased and misleading inferences, emphasized by Pesaran and Yamagata [62]. To examine whether the slope coefficients are homogeneous across countries, this study applies the Pesaran and Yamagata slope homogeneity test, which is based on the Swamy (1970) [72] test statistic. The standardized Delta test is defined as:
Δ ~ = N S ¯ K 2 K
where S ¯ represents Swamy’s test statistic, N denotes the number of cross-sectional units, and K is the number of explanatory variables.
To improve the small-sample properties of the test, Pesaran and Yamagata further propose an adjusted Delta statistic, which is given by:
Δ a d j ~ = N S ¯ E K V a r K
where E K and V a r K denote the expected value and variance of K, respectively.
The null hypotheses for both tests assume slope homogeneity, which can be expressed as:
H 0 : β 1 = β 2 = = β N
while the alternative hypothesis allows for slope heterogeneity across cross-sectional units:
H 1 : β i β j for   at   least   one   i j
Rejection of the null hypothesis implies that the slope coefficients vary across countries, thereby justifying the use of heterogeneous panel estimators and machine-learning-based methods in subsequent estimations.

3.3.3. Unit Root Test

Before proceeding to long-run estimation, it is essential to examine the stationarity properties of the variables, as the presence of non-stationary series may lead to spurious regression results. Since the cross-sectional dependence test indicates strong interdependence among countries, the use of first-generation unit root tests is inappropriate. Hence, consistent with the recent panel econometrics literature, this study employs second-generation unit root tests that explicitly account for cross-sectional dependence, namely the Cross-Sectionally Augmented Dickey–Fuller (CADF) and Cross-Sectionally Augmented Im–Pesaran–Shin (CIPS) tests, as proposed by Pesaran [63].
The CADF regression is specified as follows:
Δ y i t = α i + β i y i , t 1 + γ i y t 1 ¯ + j = 1 p θ i j Δ y i , t j + j = 0 p δ i j Δ y t j ¯ + ε i t
where y i t denotes the series under consideration, y t ¯ is the cross-sectional average of y _ t , α i individual-specific intercept, and is the error term. The inclusion of cross-sectional averages and their first differences enables the CADF test to control for unobserved common factors and cross-sectional dependence effectively.
Based on the individual CADF statistics, the CIPS test is constructed as the simple average across all cross-sections:
C I P S = 1 N i = 1 N C A D F i
The null hypothesis of both the CADF and CIPS tests assumes the presence of a unit root in the series:
H 0 : β i = 0 ( n o n - s t a t i o n a r i t y )
while the alternative hypothesis implies that the variable is stationary:
H 1 : β i < 0 ( s t a t i o n a r i t y )
These tests are applied to all variables included in the model, including green energy penetration (GEP), outward foreign direct investment (OFDI), green transition (GT), governance quality (GQ), industrial growth (IG), and urbanization (URB), both at levels and first differences. The results determine the integration order of each series and provide the basis for subsequent panel cointegration analysis.

3.3.4. Panel Co-Integration Test

After confirming that all series are non-stationary and integrated of order one, the next step is to investigate whether a long-run equilibrium relationship exists among the variables. Given cross-sectional dependence and slope heterogeneity, first-generation panel cointegration tests may yield biased and inconsistent results. Therefore, this study adopts the second-generation panel cointegration test proposed by Westerlund (2007) [64], which is based on an error-correction mechanism (ECM) and is robust to both cross-sectional dependence and heterogeneous slope coefficients.
The Westerlund cointegration test is based on the following error-correction representation:
Δ y i t = α i + δ i t + ϕ i y i , t 1 β i x i , t 1 + j = 1 p γ i j Δ y i , t j + j = 0 q θ i j Δ x i , t j + ε i t
The Westerlund framework provides four test statistics, namely two group-mean statistics and two panel statistics, which are defined as follows:
Group-Mean Statistics
G τ = 1 N i = 1 N ϕ i ^ S E ϕ i ^
G α = 1 N i = 1 N T ϕ i ^ σ i 2 ^
The group-mean statistics G τ and G α test the null hypothesis of no cointegration for at least one cross-sectional unit.
Panel Statistics
P τ = i = 1 N S E ϕ i ^ 1 ϕ i ^ i = 1 N S E ϕ i ^ 2  
P α = i = 1 N ϕ i ^
The panel statistics P τ and P α   test the null hypothesis of no cointegration for the entire panel.
The null hypothesis of the Westerlund cointegration test is expressed as:
H 0 : ϕ i = 0 ( n o   c o i n t e g r a t i o n )
while the alternative hypothesis implies the existence of a long-run cointegrating relationship:
H 1 : ϕ i < 0   ( c o i n t e g r a t i o n )
Rejection of the null hypothesis indicates the presence of a stable long-run equilibrium relationship among green energy penetration (GEP), outward foreign direct investment (OFDI), green transition (GT), governance quality (GQ), industrial growth (IG), and urbanization (URB). Establishing cointegration justifies estimating long-run elasticities using advanced econometric and machine-learning-based methods in the subsequent sections.

3.3.5. Machine Learning Regression Methods

After establishing the presence of cross-sectional dependence, slope heterogeneity, non-stationarity, and cointegration, this study employs a causal machine-learning framework to estimate the determinants of green energy penetration. Specifically, the analysis relies on Partialing-Out LASSO Regression (POLR) and its Cross-Fit (Double Machine Learning, DML) extension, which are well-suited for causal inference in high-dimensional panel settings characterized by many controls, potential endogeneity, and nonlinear relationships.
The POLR framework allows consistent estimation of causal effects by separating the variables of primary interest from a potentially large set of control variables, thereby reducing omitted-variable bias while avoiding overfitting. This approach is particularly advantageous when conventional parametric estimators may suffer from regularization bias or model misspecification due to complex interactions among regressors. The conditional expectation function of the model is specified as:
E G E P i t d i t , x i t = d i t ρ + x i t
where d i t is a vector of core explanatory variables, which includes foreign direct investment (FDI), green transition (GT), and governance quality (GQ), and x i t denotes the vector of control variables, namely industrial growth (IG) and urbanization (URB).
To isolate the causal effect of the core regressors on green energy penetration, the POLR approach residualizes both the dependent variable and the core regressors with respect to the control variables as follows:
Y i t ~ = G E P i t E ^ G E P i t x i t
D i t ~ = d i t E ^ d i t x i t
The final estimation equation is then obtained by regressing the residualized dependent variable on the residualized core regressors:
Y i t ~ = D i t ρ ~ + u i t
To eliminate overfitting bias and ensure orthogonality between nuisance functions and structural parameters, this study applies the Cross-Fit (Double Machine Learning) framework based on repeated sample splitting. The sample is divided into K folds, and nuisance functions are estimated on training subsamples, while causal parameters are calculated on the corresponding hold-out samples. The final estimator is
θ C F ^ = 1 K k = 1 K θ k ^

3.3.6. SHAP-Based Model Explainability

To ensure model transparency, Shapley Additive Explanations (SHAP) are employed to decompose the predicted values of green energy penetration into the marginal contributions of each explanatory variable. Formally, the machine-learning prediction is expressed as
GEP i t ^ = ϕ 0 + j = 1 5 ϕ j X j i t
where ϕ 0 represents the baseline prediction and ϕ j   denotes the Shapley value, measuring the contribution of a variable j { FDI ,   GT ,   GQ ,   IG ,   URB } . The SHAP framework computes these contributions as weighted marginal effects across all possible feature coalitions, ensuring fair attribution and allowing consistent interpretation of variable importance, nonlinear effects, and directional influence.
SHAP framework computes these contributions as weighted marginal effects across all possible feature coalitions, ensuring fair attribution and allowing consistent interpretation of variable importance, nonlinear effects, and directional influence.

3.3.7. Robustness and Endogeneity

Although causal machine-learning estimators provide flexible and robust estimates in high-dimensional environments, concerns related to endogeneity and reverse causality may still arise. In particular, foreign direct investment (FDI) and green transition (GT) may be endogenously determined with respect to green energy penetration (GEP) due to simultaneity, omitted variables, or feedback effects. To address these concerns and further validate the robustness of the main findings, this study employs an instrumental variable (IV) estimation strategy within a two-stage least squares (2SLS) framework.
Lagged values of the potentially endogenous regressors are used as instruments, defined as:
Z i t = { L . F D I i t , L 2 . O F D I i t , L . G T i t , L 2 . G T i t }
These instruments satisfy the relevance condition, as past values of FDI and GT are highly correlated with their current realizations, and the exogeneity condition, as lagged values are assumed to be uncorrelated with the contemporaneous error term.
The IV–2SLS estimation proceeds in two stages. In the first stage, the potentially endogenous regressors are projected onto the instrument set:
O F D I i t = π 1 L . O F D I i t + π 2 L 2 . O F D I i t + v i t
G T i t = θ 1 L . G T i t + θ 2 L 2 . G T i t + η i t
In the second stage, the fitted values obtained from the first stage are used to estimate the structural equation:
G E P i t = ρ 1 F D I i t ^ + ρ 2 G T i t ^ + ρ 3 G Q i t + ρ 4 I G i t + ρ 5 U R B i t + u i t
To ensure statistical reliability and to control for heteroskedasticity and serial correlation, cluster-robust standard errors are employed. The consistency of coefficient signs and statistical significance across the machine learning estimators (POLR and Cross-Fit POLR) and the IV–2SLS framework confirms the robustness and causal stability of the estimated relationships.
Furthermore, the IV estimates serve as a robustness check for the machine learning results, demonstrating that the positive effects of the green transition and governance quality, as well as the adverse effect of outward foreign direct investment, on green energy penetration persist after explicitly correcting for endogeneity. This convergence across estimation techniques strengthens confidence in the validity and policy relevance of the study’s core empirical findings.
Beyond statistical robustness, this study further validates the stability of its core findings using Shapley Additive Explanations (SHAP) as a complementary machine-learning-based tool for robustness and interpretability. While the IV–2SLS approach corrects for endogeneity within a parametric framework, SHAP provides a nonparametric assessment of variable influence based on marginal contributions to predicted outcomes. The SHAP decomposition is expressed as:
GEP i t ^ = ϕ 0 + j = 1 5 ϕ j X j i t , j { FDI ,   GT ,   GQ , IG ,   URB }
The relative magnitudes, signs, and stabilities of the SHAP values across observations confirm whether the variables that are statistically significant in the IV–2SLS and Cross-Fit POLR estimations also dominate the machine-learning prediction mechanism. The convergence of evidence from IV-based causal estimation, causal machine learning, and SHAP-based explainability analysis provides strong triangulated validation that the effects of FDI, green transition, governance quality, industrial growth, and urbanization on green energy penetration are structurally embedded, robust, and policy-relevant.

4. Empirical Results and Robustness Checks

4.1. Preliminary Tests

The results of the multicollinearity test indicate that all Variance Inflation Factors (VIFs) are well below the commonly accepted threshold of 10. This confirms the absence of multicollinearity among the explanatory variables, validating the stability and reliability of the estimated regression coefficients.
Table 3 reports the multicollinearity diagnostics for the explanatory variables to assess the stability and reliability of the estimated coefficients. The results indicate that multicollinearity is generally not a serious concern in the model. Specifically, the results of the Variance Inflation Factor (VIF) test values reported in the table indicate that multicollinearity is generally within acceptable bounds, with VIF values for foreign direct investment (FDI: 2.47), green transition (GT: 4.22), industrial growth (IG: 9.72), urbanization (URB: 11.26), and governance Quality (GQ: 2.64) mostly below the critical threshold of 10. Only urbanization marginally exceeds this threshold, suggesting that, although most coefficients are stable, the URB variable should be interpreted with caution due to potential multicollinearity.
Table 4 provides strong evidence of cross-sectional dependence across the N-11 economies, as indicated by the statistically significant Breusch–Pagan LM, Pesaran scaled LM, bias-corrected LM, and Pesaran CD test statistics. These results confirm the presence of cross-country interdependence among the variables, thereby justifying the use of second-generation panel econometric and machine-learning techniques. ***, **, and * denote statistical significance at the 1%, 5%, and 10% levels, respectively.
Table 5 reports the Pesaran and Yamagata slope homogeneity test results. The Delta (8.38) and adjusted Delta (6.25) statistics are both significant at the 1% level (p = 0.000), leading to rejection of the null hypothesis of homogeneous slopes across cross-sectional units. These findings confirm the presence of heterogeneous country-specific effects, indicating that changes in foreign direct investment, green transition, industrial growth, urbanization, or governance quality do not exert uniform impacts on green energy penetration across the N-11 economies. This heterogeneity justifies the application of heterogeneous panel estimators and highlights the importance of country-specific policy considerations.
Table 6 reports the CADF and CIPS second-generation panel unit root test results, which account for cross-sectional dependence across the N-11 economies. The findings indicate that none of the variables are stationary in levels, as most test statistics fail to reject the null hypothesis of non-stationarity. However, after first differencing, all CADF and CIPS statistics become significantly more negative and exceed the relevant critical values, confirming stationarity. These results indicate that green energy penetration (GEP), foreign direct investment (FDI), green transition (GT), industrial growth (IG), urbanization (URB), and governance quality (GQ) are all integrated of order one, I(1), thereby satisfying the necessary conditions for panel cointegration analysis and justifying the application of Westerlund’s (2007) [64] error-correction-based cointegration test.

4.2. Panel Cointegration Results

Table 7 presents the Westerlund (2007) [64] error-correction-based panel cointegration test results. All four test statistics (Gt, Ga, Pt, and Pa) are highly significant at the 1% level, leading to a decisive rejection of the null hypothesis of no cointegration. These findings provide strong evidence of a stable long-run equilibrium relationship between green energy penetration and its key determinants, foreign direct investment, green transition, governance quality, industrial growth, and urbanization across the N-11 economies. Consequently, the results validate the application of long-run estimation techniques in the subsequent analysis.

4.3. Machine Learning Regression

Table 8 reports the long-run coefficient estimates obtained from the baseline machine-learning estimators, namely Partialing-Out LASSO (POLR) and Cross-Fit POLR. The results show a high degree of consistency in coefficient magnitudes and statistical significance across both estimators, indicating stable and causally reliable relationships.
Foreign direct investment (FDI) exhibits a negative and statistically significant effect on green energy penetration, with coefficients of −1.834 in the POLR model and −1.485 in the Cross-Fit POLR model. The persistence of this adverse effect across both estimators suggests that FDI inflows in the N-11 economies remain predominantly oriented toward carbon-intensive activities rather than renewable energy development. In contrast, green transition (GT) and governance quality (GQ) display strong positive and highly significant effects on green energy penetration across all specifications. Improvements in the green transition index are associated with an increase in green energy penetration of approximately 0.28–0.29 units, highlighting the effectiveness of renewable energy policies and clean energy investments. Governance quality shows the largest marginal effect, with coefficients ranging from 22.7 to 23.0, underscoring the critical role of institutional capacity and regulatory effectiveness in facilitating long-term energy system transformation.
Among the control variables, urbanization (URB) has a positive and statistically significant impact on green energy penetration, with coefficients between 0.33 and 0.36, indicating that urban expansion supports renewable energy integration when supported by adequate infrastructure. Industrial growth (IG), however, exhibits a small and statistically insignificant negative effect, suggesting that industrial activity in the N-11 economies remains largely fossil-fuel dependent.
Overall, the close alignment of estimates across POLR and Cross-Fit POLR confirms the robustness and causal stability of the key results. The findings indicate that green transition policies and governance quality are the dominant drivers of green energy penetration, while the composition of FDI remains a critical constraint in the N-11 region.

4.4. Robustness and Endogeneity Checks

Table 9 reports robustness checks based on alternative estimation strategies and model specifications. The consistency of coefficient signs and statistical significance across estimators confirms the stability of the main findings and indicates that the results are not driven by reverse causality or omitted-variable bias.
Under the IV–2SLS framework, foreign direct investment (FDI) maintains a negative and statistically significant effect on green energy penetration (−1.60), suggesting that FDI inflows in the N-11 economies remain concentrated in carbon-intensive activities even after correcting for endogeneity. This finding is further supported by the Cross-Fit Machine Learning (CF-ML) estimator, which produces a closely comparable coefficient (−1.51), highlighting the robustness of the adverse FDI–GEP relationship across both conventional econometric and machine-learning-based IV approaches. In contrast, green transition (GT) consistently exerts a positive and statistically significant effect on green energy penetration across both estimators, reinforcing the effectiveness of renewable energy policies, clean energy investments, and transition-oriented reforms. Governance quality (GQ) emerges as the most influential determinant, with large and highly significant coefficients ranging from 23.50 to 23.84, underscoring the critical role of institutional effectiveness, regulatory enforcement, and policy credibility in facilitating long-term energy system transformation.
Regarding the control variables, industrial growth and urbanization display negative effects, indicating that rapid industrial expansion and urban concentration in the N-11 economies continue to rely predominantly on fossil-fuel-based energy systems in the absence of sufficient green infrastructure. The absence of weak-instrument concerns further strengthens the credibility of the IV estimates. Overall, the close alignment between the IV–2SLS and CF-ML results confirms the causal robustness and policy relevance of the study’s main conclusions.

4.5. SHAP Robustness Analysis

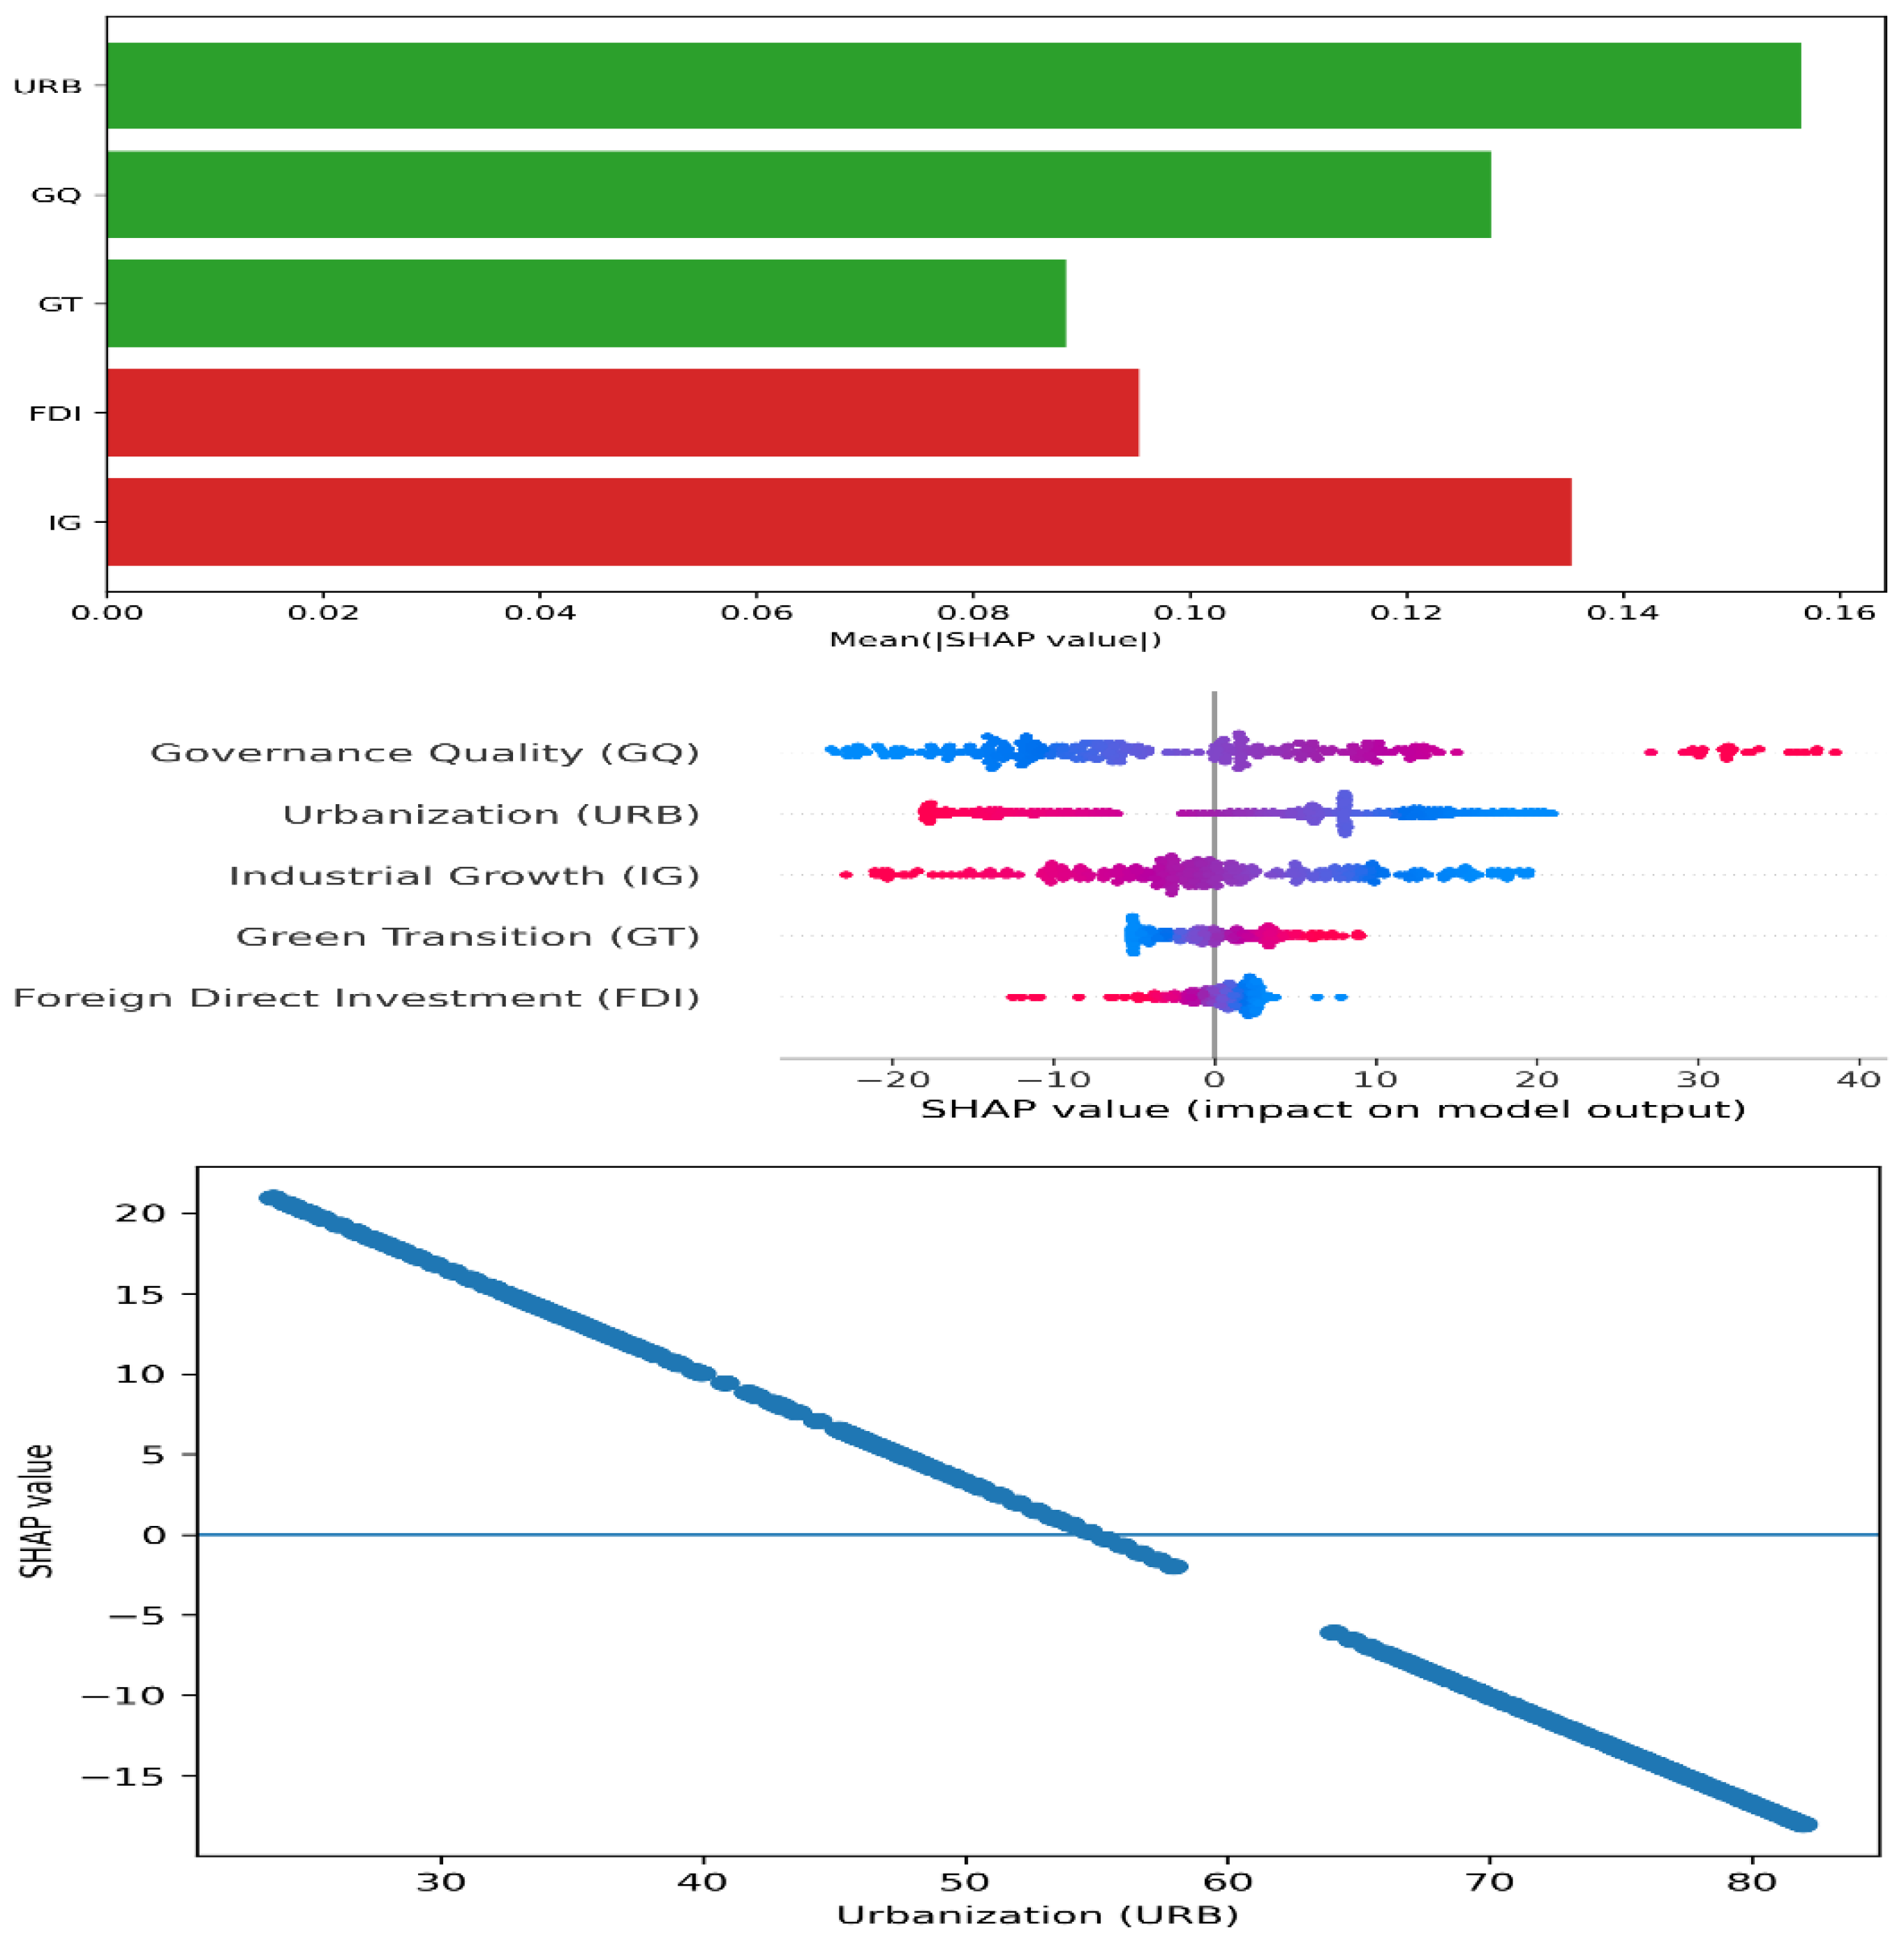
Table 10 reports SHAP-based importance measures derived from the machine-learning model, illustrating the relative contribution, direction, and heterogeneity of each explanatory variable’s effect on green energy penetration across the N-11 economies. By decomposing predicted green energy penetration into variable-specific marginal contributions, the SHAP analysis enhances the interpretability and robustness of the machine-learning estimates. Figure 2 visually complements these results by illustrating the SHAP-based decomposition and the dispersion of marginal effects across observations.
The results indicate that urbanization is the most influential determinant of green energy penetration, exhibiting the highest mean absolute contribution (Mean |SHAP| = 0.1564). On average, urbanization exerts a positive effect (Mean SHAP = 0.0532), suggesting that higher population density, improved infrastructure, and scale economies in urban areas facilitate renewable energy deployment. However, the wide impact range (−0.482 to 0.821) highlights substantial cross-country and temporal heterogeneity, indicating that the positive effects of urbanization depend on supportive policy and institutional conditions.
Industrial growth ranks second in importance (Mean |SHAP| = 0.1352) and contributes negatively to green energy penetration, as reflected by its negative mean SHAP value (−0.0891). This finding suggests that industrial expansion in the N-11 economies remains largely fossil-fuel dependent, constraining renewable energy diffusion. The broad range of effects (−0.734 to 0.514) further points to nonlinearities, implying that cleaner industrial upgrading may partially offset this adverse influence in certain contexts.
Governance quality emerges as a critical enabling factor, ranking third in importance (Mean |SHAP| = 0.1278) with a positive average contribution (Mean SHAP = 0.0824). This result underscores the role of institutional effectiveness, regulatory quality, and policy credibility in promoting renewable energy adoption by reducing investment uncertainty and strengthening policy implementation. In contrast, foreign direct investment shows a negative average contribution (Mean SHAP = −0.0247; Mean |SHAP| = 0.0953), indicating that FDI inflows in the N-11 economies remain biased toward carbon-intensive activities in the absence of stringent environmental regulations. Finally, green transition policies exhibit a positive but comparatively smaller marginal contribution (Mean SHAP = 0.0153; Mean |SHAP| = 0.0886), suggesting that their effectiveness depends on complementarities with governance quality, urban structure, and industrial composition rather than on isolated policy interventions.
Overall, the SHAP results reinforce the main findings obtained from the POLR, Cross-Fit POLR, and IV–2SLS estimations, while providing additional insights into nonlinear and heterogeneous effects that conventional econometric models cannot capture. The consistency in dominance rankings and directional effects across SHAP and causal estimators confirms the robustness of the empirical results and highlights the pivotal role of structural and institutional conditions in shaping green energy transitions in fast-growing emerging economies.

4.6. Discussions

This study extends the growing literature on green energy transitions by integrating second-generation panel econometric techniques with machine-learning methods to examine the determinants of green energy penetration in the N-11 economies. By jointly analyzing foreign direct investment, green transition policies, industrial growth, urbanization, and governance quality, the study provides a comprehensive assessment of both average causal effects and heterogeneous nonlinear dynamics shaping renewable energy adoption in fast-growing emerging markets.
The results consistently show that foreign direct investment exerts an adverse effect on green energy penetration in the N-11 economies, even after accounting for endogeneity, cross-sectional dependence, and nonlinearities. This finding aligns with the argument that FDI inflows into emerging economies are often directed toward energy-intensive manufacturing, construction, and extractive activities rather than renewable energy sectors [73]. In many N-11 countries, including Bangladesh, Pakistan, Nigeria, and Vietnam, foreign investment has played a central role in export-oriented industrialization, reinforcing electricity demand that is predominantly met through fossil fuels. The SHAP analysis further confirms that, although the impact of FDI is heterogeneous across countries and time, its average contribution remains negative, supporting the “dirty investment” or “pollution haven” hypothesis in the absence of stringent environmental regulation [74]. These findings suggest that FDI quality and sectoral composition, rather than aggregate inflows, are critical for advancing renewable energy transitions in the N-11 context.
Green transition policies are found to positively contribute to the penetration of green energy across the N-11 economies, underscoring the importance of policy-driven support for renewable energy deployment. This result is consistent with the literature emphasizing the role of renewable energy targets, incentive schemes, and public investment in accelerating clean energy adoption [75]. Countries such as South Korea and Turkey, which have adopted relatively comprehensive renewable energy frameworks, demonstrate more substantial progress in integrating renewables into their energy mix. However, the SHAP results indicate that the marginal contribution of green transition policies is smaller than that of some structural variables, suggesting that policy effectiveness depends heavily on implementation capacity and institutional support. This finding echoes previous studies showing that policy instruments alone are insufficient without adequate financing, grid readiness, and regulatory enforcement [76].
Governance quality is a key enabling factor for the penetration of green energy in the N-11 economies. Both econometric and SHAP-based results indicate that stronger institutions, greater regulatory effectiveness, and higher policy credibility significantly enhance renewable energy adoption. This finding is in line with studies emphasizing that good governance reduces investment uncertainty, improves coordination across agencies, and strengthens enforcement of energy and environmental regulations [77]. In N-11 countries with relatively stronger institutional frameworks, such as South Korea and, to some extent, Turkey, renewable energy policies tend to translate more effectively into tangible outcomes. Conversely, weak governance limits the effectiveness of both green transition policies and investment inflows. Overall, governance quality acts as a conditioning variable, amplifying positive policy effects while mitigating the adverse impacts of industrial growth and FDI.
The analysis indicates that industrial growth negatively influences the penetration of green energy in the N-11 economies, reflecting the fossil-fuel-dependent nature of their industrialization trajectories. Many N-11 countries rely heavily on energy-intensive industries, such as textiles, cement, chemicals, and heavy manufacturing, to drive economic growth and exports. This pattern increases electricity demand that is supplied mainly by conventional energy sources, particularly in countries with limited renewable capacity [78]. The SHAP results highlight substantial heterogeneity in the impact of industrial growth, suggesting that cleaner production technologies and energy-efficient industrial upgrading can reduce its adverse effects. Nevertheless, the overall findings indicate that, without deliberate industrial decarbonization strategies, industrial expansion will continue to constrain the penetration of renewable energy in the N-11 economies.
Urbanization plays a complex and conditional role in shaping the penetration of green energy across the N-11 countries. While IV-based estimates suggest an adverse average effect reflecting increased energy demand, transportation needs, and pressure on existing energy systems, the machine-learning and SHAP analyses reveal a positive contribution at higher levels of urbanization. This duality is consistent with the literature on urban energy transitions, which emphasizes that unplanned urban expansion often reinforces dependence on fossil fuels [79]. In contrast, well-managed urbanization can facilitate the deployment of renewable energy through smart grids, energy-efficient buildings, and decentralized energy systems [80]. In rapidly urbanizing N-11 countries such as Indonesia, the Philippines, and Nigeria, inadequate infrastructure and planning limit the green potential of urban growth. In contrast, more structured urban development, as observed in South Korea, catalyzes the integration of renewable energy through urbanization. These findings highlight the importance of urban planning and governance in determining whether urbanization supports or hinders green energy penetration.
Taken together, the results suggest that green energy penetration in the N-11 economies is not an automatic outcome of economic growth or investment inflows, but rather a conditional process shaped by institutional quality, policy coherence, and structural transformation. While FDI and industrial growth tend to constrain renewable energy adoption under current conditions, green transition policies and governance quality play a critical role in redirecting development toward sustainability. Urbanization further amplifies both risks and opportunities, depending on planning and institutional capacity. By combining causal econometric evidence with machine-learning-based heterogeneity analysis, this study provides a nuanced understanding of why progress in renewable energy remains uneven across the N-11 economies and identifies key leverage points for accelerating sustainable energy transitions.

5. Conclusions and Policy Implications

This study investigates the determinants of green energy penetration in the Next Eleven (N-11) economies using an integrated empirical framework that combines second-generation panel econometric techniques with advanced machine-learning methods. By employing Partialing-Out LASSO (POLR), Cross-Fit POLR, instrumental-variable estimation, and SHAP-based interpretability analysis, the study provides robust and comprehensive evidence on how foreign direct investment, green transition policies, industrial growth, urbanization, and governance quality jointly shape renewable energy adoption in fast-growing emerging economies. The integration of causal econometric inference with machine-learning-based heterogeneity analysis enables a deeper understanding of both average effects and nonlinear, context-specific dynamics.
The empirical findings consistently indicate that foreign direct investment exerts an adverse effect on green energy penetration in the N-11 economies, suggesting that investment inflows remain predominantly concentrated in carbon-intensive sectors. Industrial growth is also found to constrain green energy penetration, reflecting the fossil-fuel-dependent nature of industrial expansion across these economies. In contrast, green transition policies and governance quality emerge as strong and positive drivers, underscoring the critical role of credible institutions, effective regulation, and sustained policy commitment in facilitating renewable energy adoption. The results further reveal that urbanization plays a conditional and heterogeneous role. While instrumental-variable estimates point to a negative average effect driven by rising energy demand and fossil-fuel reliance, machine-learning and SHAP analyses show that urbanization can support green energy penetration at higher levels under favorable policy and institutional environments. This divergence highlights the importance of accounting for nonlinearities and country-specific conditions when evaluating the role of urban development in energy transitions.
Taken together, the convergence of results across econometric and machine-learning approaches confirms that green energy penetration in the N-11 economies is not an automatic outcome of economic growth or investment inflows. Rather, it is a conditional process shaped by institutional quality, policy effectiveness, and structural transformation. These findings carry important policy implications. Reorienting foreign direct investment toward environmentally sustainable sectors through green investment screening, environmental conditionality, and targeted incentives is essential to prevent the reinforcement of fossil-fuel dependence. Similarly, industrial decarbonization must be integrated into national energy transition strategies through policies that promote energy efficiency, cleaner production technologies, and the use of renewable energy in industrial activities. Strengthening governance quality remains a fundamental prerequisite, as effective regulatory frameworks, enforcement capacity, and policy credibility enhance the impact of green transition policies and attract responsible investment. Moreover, the conditional role of urbanization suggests that urban planning and energy policy should be closely coordinated, with investments in smart grids, energy-efficient buildings, and decentralized renewable systems to transform urban growth into a catalyst for green energy penetration.
Despite its contributions, this study has several limitations that open avenues for future research. The use of aggregate national-level data may obscure sub-national and sectoral heterogeneity in renewable energy adoption, suggesting the value of future studies employing regional, city-level, or firm-level data. In addition, extending the framework to include indicators of green innovation, financial development, or energy pricing mechanisms could provide a more comprehensive understanding of the drivers of green energy penetration. While SHAP analysis reveals nonlinear and heterogeneous effects, future research could further explore dynamic thresholds and interaction effects within structural econometric models. Expanding the analysis to other groups of emerging economies or incorporating firm-level investment data would also deepen insights into the microfoundations of green energy transitions. Addressing these extensions would further enhance understanding of how emerging economies can reconcile rapid economic growth with long-term environmental sustainability.

Author Contributions

Methodology, N.A. and M.R.S.; Software, N.A.; Validation, N.A. and M.R.S.; Formal analysis, N.A.; Investigation, N.A.; Data curation, N.A.; Writing—original draft, N.A. and M.R.S.; Writing—review & editing, M.R.S.; Visualization, N.A.; Supervision, M.R.S. All authors have read and agreed to the published version of the manuscript.

Funding

This research received no external funding.

Data Availability Statement

The data presented in this study are openly available in [World Development Indicators (WDI), International Renewable Energy Agency (IRENA), Worldwide Governance Indicators (WGI)] [https://databank.worldbank.org/source/world-development-indicators, accessed on 18 January 2026].

Conflicts of Interest

The authors declare no conflict of interest.

Appendix A

Figure A1. Green Energy Penetration Trends Across N-11 Countries. Note: The figure illustrates country-specific evolution of green energy penetration, highlighting heterogeneous transition paths across N-11 economies.
Energies 19 00541 g0a1
Figure A2. Empirical estimation scheme for the N-11 countries. Note: Empirical estimation scheme illustrating the econometric and machine-learning framework for the N-11 countries [64].
Energies 19 00541 g0a2

References

  1. Mamat, R.; Erdiwansyah; Ghazali, M.F.; Rosdi, S.M.; Syafrizal; Bahagia. Strategic Framework for Overcoming Barriers in Renewable Energy Transition: A Multi-Dimensional Review. Next Energy 2025, 9, 100414. [Google Scholar] [CrossRef]
  2. Liu, W.; Tang, M.; Zhao, P. The Effects of Attention to Climate Change on Carbon, Fossil Energy and Clean Energy Markets: Based on Causal Network Learning Algorithms. Energy Strategy Rev. 2025, 59, 101717. [Google Scholar] [CrossRef]
  3. Soto, G.H.; Martinez-Cobas, X. Does Outward Foreign Direct Investment and the Green Transition Affect Renewable Energy Penetration among European Union Countries? Renew Energy 2025, 241, 122306. [Google Scholar] [CrossRef]
  4. Dai, L.; Xiong, Y. Does the Green Finance Development and Renewable Energy Affect the Economic Recovery in Asian Economies. Renew. Energy 2023, 216, 118922. [Google Scholar] [CrossRef]
  5. Triki, R.; Mahmoud, S.; Bahou, Y.; Boudabous, M. Assessing Renewable Energy Adoption to Achieve Sustainable Development Goals in Ha’il Region. Sustainability 2025, 17, 6097. [Google Scholar] [CrossRef]
  6. Javed, A.; Shabir, M.; Rao, F.; Uddin, M.S. Effect of Green Technological Innovation and Financial Development on Green Energy Transition in N-11 Countries: Evidence from the Novel Method of Moments Quantile Regression. Renew. Energy 2025, 242, 122435. [Google Scholar] [CrossRef]
  7. Gafsi, N. Foreign Finance and Renewable Energy Transition in D8 Countries: The Moderating Role of Globalization. J. Risk Financ. Manag. 2025, 18, 545. [Google Scholar] [CrossRef]
  8. Soto, G.H.; Balsalobre-Lorente, D.; Martinez-Cobas, X. Environmental Legislative Shaping or Green Competitive Advantages? The Role of FDI among Environmental Regulations. Energy Econ. 2025, 145, 108445. [Google Scholar] [CrossRef]
  9. Amendolagine, V.; Hansen, U.E.; Lema, R.; Rabellotti, R.; Ribaudo, D. Do Green Foreign Direct Investments Increase the Innovative Capability of MNE Subsidiaries? World Dev. 2023, 170, 106342. [Google Scholar] [CrossRef]
  10. Tan, Y.; Uprasen, U. The Effect of Foreign Direct Investment on Renewable Energy Consumption Subject to the Moderating Effect of Environmental Regulation: Evidence from the BRICS Countries. Renew. Energy 2022, 201, 135–149. [Google Scholar] [CrossRef]
  11. Shobande, O.A.; Tiwari, A.K.; Ogbeifun, L. Repositioning Green Policy and Green Innovations for Energy Transition and Net Zero Target: New Evidence and Policy Actions. Sustain. Futures 2025, 9, 100594. [Google Scholar] [CrossRef]
  12. Rehman, A.; Sanjari, M.J.; Elavarasan, R.M.; Jamal, T. Sustainability-Aligned Pathways for Energy Transition: A Review of Low-Carbon Energy Network Solutions. Renew. Sustain. Energy Rev. 2026, 226, 116428. [Google Scholar] [CrossRef]
  13. Omri, A.; Ben Jabeur, S. Climate Policies and Legislation for Renewable Energy Transition: The Roles of Financial Sector and Political Institutions. Technol. Forecast. Soc. Change 2024, 203, 123347. [Google Scholar] [CrossRef]
  14. Yang, G.; Zha, D.; Cao, D.; Zhang, G. Time for a Change: Rethinking the Global Renewable Energy Transition from the Sustainable Development Goals and the Paris Climate Agreement. Innovation 2024, 5, 100582. [Google Scholar] [CrossRef] [PubMed]
  15. Khan, I.; Xin, C. The Intersection of Energy Transition and Urban Planning for Sustainable Development: Enhancing Energy Efficiency and Sustainability. Gondwana Res. 2025, in press. [Google Scholar] [CrossRef]
  16. Luan, Y.; Tang, D.; Aderemi, T.; Osabohien, R. Clean Energy Adoption, Industrialization and Sustainable Development: A System GMM Approach. Energy Strategy Rev. 2025, 59, 101740. [Google Scholar] [CrossRef]
  17. Hui, C.X.; Dan, G.; Alamri, S.; Toghraie, D. Greening Smart Cities: An Investigation of the Integration of Urban Natural Resources and Smart City Technologies for Promoting Environmental Sustainability. Sustain. Cities Soc. 2023, 99, 104985. [Google Scholar] [CrossRef]
  18. Johri, S.; Selvakumar, P.; Satyanarayana, P.; Das, A.; Gupta, S.; Bhattacharya, S. Urbanization and Energy. In Geopolitical Landscapes of Renewable Energy and Urban Growth; IGI Global Scientific Publishing: Hershey, PA, USA, 2025; pp. 453–478. [Google Scholar]
  19. Halldén, F.; Hultberg, A.; Ahmed, A.; Uddin, G.S.; Yahya, M.; Troster, V. The Role of Institutional Quality on Public Renewable Energy Investments. Renew. Sustain. Energy Rev. 2025, 215, 115585. [Google Scholar] [CrossRef]
  20. Chen, W.; Song, Z.; Xie, Y. Why Incentive-Regulatory Policy Synergy Underperforms in Driving Energy Transition: Evidence from China. Energy Convers. Manag. X 2025, 27, 101206. [Google Scholar] [CrossRef]
  21. Murshed, M. Can Renewable Energy Transition Drive Green Growth? The Role of Good Governance in Promoting Carbon Emission-Adjusted Economic Growth in Next Eleven Countries. Innov. Green Dev. 2024, 3, 100123. [Google Scholar] [CrossRef]
  22. Haseeb, M.; Shuaib, M.; Emran Hossain, M.; Fan, F. Unveiling the Green Revolution: Exploring the Impact of Outward FDI, Green Transition, Governance Quality, and Industrial Structure on Renewable Energy Penetration. Renew. Energy 2026, 256, 124554. [Google Scholar] [CrossRef]
  23. Uddin, M.; Shahbaz, M. Evaluating the Influence of Chinese Investment, FDI and Digitalization on Renewable Energy Dynamics in Africa. Renew. Energy 2026, 256, 124051. [Google Scholar] [CrossRef]
  24. Michailidis, M.; Zafeiriou, E.; Kantartzis, A.; Galatsidas, S.; Arabatzis, G. Governance, Energy Policy, and Sustainable Development: Renewable Energy Infrastructure Transition in Developing MENA Countries. Energies 2025, 18, 2759. [Google Scholar] [CrossRef]
  25. Faizi, A.; AK, M.Z.; Alsabhan, T.H.; Shahzad, M.R.; Alshagri, R.; Khan, S. Evaluating the Role of Renewable Energy Natural Resources and Globalization in Environmental Quality in OIC Countries. Sci. Rep. 2025, 15, 33496. [Google Scholar] [CrossRef]
  26. Kilinc-Ata, N.; Camkaya, S.; Topal, S. What Role Do Foreign Direct Investment and Technology Play in Shaping the Impact on Environmental Sustainability in Newly Industrialized Countries (NIC)?: New Evidence from Wavelet Quantile Regression. Sustainability 2025, 17, 4966. [Google Scholar] [CrossRef]
  27. Nassary, E.K.; Magubika, A.J.; Mwampashi, L.L.; Fukah, F.K.; Kahangwa, C.A.; Tryphone, G.M. Transitioning to Clean Energy and Opportunities for Developing Countries. Energy Strategy Rev. 2025, 62, 101909. [Google Scholar] [CrossRef]
  28. Yang, J.; Zhang, W.; Zhang, Z. Impacts of Urbanization on Renewable Energy Consumption in China. J. Clean. Prod. 2016, 114, 443–451. [Google Scholar] [CrossRef]
  29. Solangi, Y.A.; Magazzino, C. Evaluating Financial Implications of Renewable Energy for Climate Action and Sustainable Development Goals. Renew. Sustain. Energy Rev. 2025, 212, 115390. [Google Scholar] [CrossRef]
  30. Xu, S.-C.; Li, Y.-F.; Zhang, J.-N.; Wang, Y.; Ma, X.-X.; Liu, H.-Y.; Wang, H.-N.; Tao, Y. Do Foreign Direct Investment and Environmental Regulation Improve Green Technology Innovation? An Empirical Analysis Based on Panel Data from the Chinese Manufacturing Industry. Environ. Sci. Pollut. Res. 2021, 28, 55302–55314. [Google Scholar] [CrossRef]
  31. Qin, Z.; Ozturk, I. Renewable and Non-Renewable Energy Consumption in Brics: Assessing the Dynamic Linkage between Foreign Capital Inflows and Energy Consumption. Energies 2021, 14, 2974. [Google Scholar] [CrossRef]
  32. Nauman, M.; Corresponding, S.; Ali, N. Digital Financial Inclusion and Environmental Sustainability Nexus: Evidence from South Asian Economies. Pak. J. Commer. Soc. Sci. 2024, 18, 134–156. [Google Scholar] [CrossRef]
  33. Kang, X.; Khan, F.U.; Ullah, R.; Arif, M.; Rehman, S.U.; Ullah, F. Does Foreign Direct Investment Influence Renewable Energy Consumption? Empirical Evidence from South Asian Countries. Energies 2021, 14, 3470. [Google Scholar] [CrossRef]
  34. Grabara, J.; Tleppayev, A.; Dabylova, M.; Mihardjo, L.W.W.; Dacko-Pikiewicz, Z. Empirical Research on the Relationship amongst Renewable Energy Consumption, Economic Growth and Foreign Direct Investment in Kazakhstan and Uzbekistan. Energies 2021, 14, 332. [Google Scholar] [CrossRef]
  35. Shahbaz, M.; Nasir, M.A.; Roubaud, D. Environmental Degradation in France: The Effects of FDI, Financial Development, and Energy Innovations. Energy Econ. 2018, 74, 843–857. [Google Scholar] [CrossRef]
  36. Uzar, U.; Eyuboglu, K. Is Foreign Direct Investment an Engine for Energy Consumption? An Empirical Investigation for Turkey. Environ. Sci. Pollut. Res. 2019, 26, 28092–28105. [Google Scholar] [CrossRef]
  37. Samour, A.; Baskaya, M.M.; Tursoy, T. The Impact of Financial Development and FDI on Renewable Energy in the UAE: A Path towards Sustainable Development. Sustainability 2022, 14, 1208. [Google Scholar] [CrossRef]
  38. Wei, X.; Mohsin, M.; Zhang, Q. Role of Foreign Direct Investment and Economic Growth in Renewable Energy Development. Renew Energy 2022, 192, 828–837. [Google Scholar] [CrossRef]
  39. Koeva, D.; Kutkarska, R.; Zinoviev, V. High Penetration of Renewable Energy Sources and Power Market Formation for Countries in Energy Transition: Assessment via Price Analysis and Energy Forecasting. Energies 2023, 16, 7788. [Google Scholar] [CrossRef]
  40. Zhang, J.; Yu, S.; Zhang, Y.J.; Su, B.; Sun, Y.F. How Do Renewable Energy Policies Affect Energy Green Development? Evidence from Chinese Listed Energy Firms. Energy Econ. 2025, 142, 108154. [Google Scholar] [CrossRef]
  41. Yeboah, K.E.; Feng, J.; Jamatutu, S.A.; Amoako, P.Y.O.; Nyarko, F.E.; Amin, N. Green Growth in Africa: The Role of Renewable Energy, Biocapacity, Government Policies, and R&D on CO2 Emissions Reductions. J. Environ. Manag. 2024, 371, 123089. [Google Scholar] [CrossRef]
  42. Xue, J.; Poon, J.; Yang, Y.; Ji, Q. Effect of Green Industrial Policy on China’s Outward Renewable Energy Investment. Energy Econ. 2024, 138, 107830. [Google Scholar] [CrossRef]
  43. Javed, A.; Rapposelli, A.; Khan, F.; Javed, A.; Abid, N. Do Green Technology Innovation, Environmental Policy, and the Transition to Renewable Energy Matter in Times of Ecological Crises? A Step towards Ecological Sustainability. Technol. Forecast. Soc. Change 2024, 207, 123638. [Google Scholar] [CrossRef]
  44. Moros-Daza, A.; Moros-Marcillo, A.; Pacheco-Bustos, C.A. Greening Seaports: Evaluating Impacts and Policies for Renewable Energy Systems. Renew. Sustain. Energy Rev. 2025, 213, 115475. [Google Scholar] [CrossRef]
  45. Ma, F.; Saleem, H.; Ding, X.; Nazir, S.; Tariq, S. Do Natural Resource Rents, Green Technological Innovation, and Renewable Energy Matter for Ecological Sustainability? Role of Green Policies in Testing the Environmental Kuznets Curve Hypothesis. Resour. Policy 2024, 91, 104844. [Google Scholar] [CrossRef]
  46. Yasmeen, R.; Hao, G.; Ye, Y.; Hassan Shah, W.U.; Kamal, M.A. The Role of Governance Quality on Mobilizing Environmental Technology and Environmental Taxations for Renewable Energy and Ecological Sustainability in Belt and Road Economies: A Methods of Moment’s Quantile Regression. Energy Strategy Rev. 2023, 50, 101258. [Google Scholar] [CrossRef]
  47. Shang, M.; Aleesa, N.; Zakari, A. Sustainable Energy Supplies in Developing Countries: Does National Governance Matter? Energies 2023, 16, 6607. [Google Scholar] [CrossRef]
  48. Mahmood, H.; Tanveer, M.; Omerović, E.; Furqan, M. Rule of Law, Corruption Control, Governance, and Economic Growth in Managing Renewable and Nonrenewable Energy Consumption in South Asia. Int. J. Environ. Res. Public Health 2021, 18, 10637. [Google Scholar] [CrossRef]
  49. Asongu, S.; Odhiambo, N. Governance and Renewable Energy Consumption in Sub-Saharan Africa. SSRN Electron. J. 2022, 16, 209–223. [Google Scholar] [CrossRef]
  50. Gyimah, J.; Han, Y.; Yao, X. Renewable Energy Consumption, Good Governance System, Economic Growth, and FDI: The Pathway towards Environmental Quality in European Countries. Energy 2025, 337, 138708. [Google Scholar] [CrossRef]
  51. Zhao, S.; He, X.; Faxritdinovna, K.U. Does Industrial Structure Changes Matter in Renewable Energy Development? Mediating Role of Green Finance Development. Renew. Energy 2023, 214, 350–358. [Google Scholar] [CrossRef]
  52. Fu, J.; Qu, X.; Huang, X. Does the Reduction of CO2 Emissions from Renewable Energy Generation Vary Depending on Economic and Industrial Structure? Empirical Evidence from Major CO2 Emitting Countries. Energy 2025, 330, 136794. [Google Scholar] [CrossRef]
  53. Liu, T.Y. Do Industrial Robots Optimize the Energy Structure? Evidence from Fossil Energy Consumption. Energy Econ. 2025, 148, 108638. [Google Scholar] [CrossRef]
  54. Zhao, C.; Wang, B. How Does New-Type Urbanization Affect Air Pollution? Empirical Evidence Based on Spatial Spillover Effect and Spatial Durbin Model. Environ. Int. 2022, 165, 107304. [Google Scholar] [CrossRef] [PubMed]
  55. Nabaweesi, J.; Kaawaase, T.K.; Buyinza, F.; Adaramola, M.S.; Namagembe, S.; Nkote, I.N. Urbanization and Modern Renewable Energy Consumption among East African Community (EAC) Countries: An Empirical Analysis. Int. J. Energy Sect. Manag. 2024, 18, 1378–1399. [Google Scholar] [CrossRef]
  56. Salim, R.A.; Shafiei, S. Urbanization and Renewable and Non-Renewable Energy Consumption in OECD Countries: An Empirical Analysis. Econ. Model. 2014, 38, 581–591. [Google Scholar] [CrossRef]
  57. Nguea, S.M. Combining the Role of Urbanization and Renewable Energy in Sustainable Development: Testing the EKC Hypothesis for Africa. Environ. Sci. Pollut. Res. 2024, 31, 29595–29609. [Google Scholar] [CrossRef]
  58. Vo, D.H.; Vo, A.T.; Ho, C.M. Urbanization and Renewable Energy Consumption in the Emerging ASEAN Markets: A Comparison between Short and Long-Run Effects. Heliyon 2024, 10, e30243. [Google Scholar] [CrossRef]
  59. Dilanchiev, A.; Nuta, F.; Khan, I.; Khan, H. Urbanization, Renewable Energy Production, and Carbon Dioxide Emission in BSEC Member States: Implications for Climate Change Mitigation and Energy Markets. Environ. Sci. Pollut. Res. 2023, 30, 67338–67350. [Google Scholar] [CrossRef]
  60. Breusch, T.S.; Pagan, A.R. The Lagrange Multiplier Test and Its Applications to Model Specification in Econometrics. Rev. Econ. Stud. 1980, 47, 239. [Google Scholar] [CrossRef]
  61. Pesaran, M.H. General Diagnostic Tests for Cross-Sectional Dependence in Panels. Empir. Econ. 2021, 60, 13–50. [Google Scholar] [CrossRef]
  62. Pesaran, M.H.; Ullah, A.; Yamagata, T. A Bias-Adjusted LM Test of Error Cross-Section Independence. Econom. J. 2008, 11, 105–127. [Google Scholar] [CrossRef]
  63. Pesaran, M.H. A Simple Panel Unit Root Test in the Presence of Cross-section Dependence. J. Appl. Econom. 2007, 22, 265–312. [Google Scholar] [CrossRef]
  64. Westerlund, J. Testing for Error Correction in Panel Data*. Oxf. Bull. Econ. Stat. 2007, 69, 709–748. [Google Scholar] [CrossRef]
  65. Tibshirani, R. Regression Shrinkage and Selection Via the Lasso. J. R. Stat. Soc. Ser. B Stat. Methodol. 1996, 58, 267–288. [Google Scholar] [CrossRef]
  66. Belloni, A.; Chernozhukov, V.; Hansen, C. Inference on Treatment Effects after Selection among High-Dimensional Controls. Rev. Econ. Stud. 2014, 81, 608–650. [Google Scholar] [CrossRef]
  67. Chernozhukov, V.; Chetverikov, D.; Demirer, M.; Duflo, E.; Hansen, C.; Newey, W.; Robins, J. Double/Debiased Machine Learning for Treatment and Structural Parameters. Econom. J. 2018, 21, C1–C68. [Google Scholar] [CrossRef]
  68. Wooldridge, J.M. Econometric Analysis of Cross Section and Panel Data; The MIT Press: London, UK, 2010. [Google Scholar]
  69. Lundberg, S.M.; Allen, P.G.; Lee, S.-I. A Unified Approach to Interpreting Model Predictions. arXiv 2017, arXiv:1705.07874. [Google Scholar] [CrossRef]
  70. Chudik, A.; Pesaran, M.H. Common Correlated Effects Estimation of Heterogeneous Dynamic Panel Data Models with Weakly Exogenous Regressors. J. Econom. 2015, 188, 393–420. [Google Scholar] [CrossRef]
  71. Phillips, P.C.B.; Sul, D. Dynamic Panel Estimation and Homogeneity Testing under Cross Section Dependence. Econom. J. 2003, 6, 217–259. [Google Scholar] [CrossRef]
  72. Swamy, P.A.V.B. Efficient Inference in a Random Coefficient Regression Model. Econometrica 1970, 38, 311. [Google Scholar] [CrossRef]
  73. Osuma, G.; Bonga-Bonga, L. The Effects of Foreign Direct Investment and Technological Innovation on Renewable Energy Consumption Under Varying Market Conditions in the EU. Energies 2025, 18, 1353. [Google Scholar] [CrossRef]
  74. Akter, S.N.; Bi, S.; Shoyeb, M.; Salah Uddin, M.; Haque, M.M. Belt and Road Initiative and Sustainable Development: Evidence from Bangladesh. Sustainability 2025, 17, 6234. [Google Scholar] [CrossRef]
  75. Ramos Farroñán, E.V.; Farfán Chilicaus, G.C.; Cruz Salinas, L.E.; Correa Rojas, L.; Chuquitucto Cotrina, L.K.; Licapa-Redolfo, G.S.; Vera Zelada, P.; Vera Zelada, L.A. Green Finance and the Energy Transition: A Systematic Review of Economic Instruments for Renewable Energy Deployment in Emerging Economies. Energies 2025, 18, 4560. [Google Scholar] [CrossRef]
  76. Chaturvedi Shharma, P.; Bansal, R.; Luqman Aziz, A.; Propheto, A. Can Renewable Energy Investments Alone Deliver Energy, Emissions, and Employment Gains? A State-Level Systems Analysis from India. Soc. Sci. Humanit. Open 2025, 12, 102248. [Google Scholar] [CrossRef]
  77. Bergougui, B.; Ben-Salha, O. The Impact of Environmental Governance on Energy Transitions: Evidence from a Global Perspective. Sustainability 2025, 17, 8759. [Google Scholar] [CrossRef]
  78. Van Tran, T.; Le, H.V.; Tran, T.N.D.; Duong, K.D. How Foreign Direct Investment and Economic Growth Affect Renewable Energy Consumption Globally: Insights from Dynamic Panel Estimators. Soc. Sci. Humanit. Open 2025, 12, 101713. [Google Scholar] [CrossRef]
  79. Tunio, F.H.; Nabi, A.A.; Memon, R.U.R.; Fraz, T.R.; Haluza, D. Sustainability in High-Income Countries: Urbanization, Renewables, and Ecological Footprints. Energies 2025, 18, 1599. [Google Scholar] [CrossRef]
  80. Zhao, W. Smart City Technologies for Sustainable Urban Planning: Evidence and Equity Lessons from Shenzhen. Sustain. Futures 2025, 10, 101198. [Google Scholar] [CrossRef]
Figure 1. Theoretical Framework for N-11 Countries. Note: Green arrows indicate positive effects, while red arrows denote negative effects.
Energies 19 00541 g001
Figure 2. SHAP Analysis. Note: Green and red colors indicate positive and negative impact, respectively.
Energies 19 00541 g002
Table 1. Variable Definitions and Data Sources.
VariablesSymbolsDefinitions/MeasurementsSources
Green Energy PenetrationGEPShare of renewable energy consumption in total final energy use (%)World Development Indicators (WDI)
Foreign Direct InvestmentFDIFDI stock as a percentage of GDPWorld Development Indicators (WDI)
Green transitionGTShare of renewable electricity generation (%)International Renewable Energy Agency (IRENA)
Industrial growthIGIndustry value added as a percentage of GDPWorld Development Indicators (WDI)
UrbanizationURBUrban population as a percentage of total populationWorld Development Indicators (WDI)
Governance qualityGQComposite index of government effectiveness, regulatory quality, and control of corruptionWorldwide Governance Indicators (WGI)
Note: This table summarizes variable definitions, measurements, and data sources used in the analysis.
Table 2. Descriptive Statistics.
GEPOFDIGTIGURBGQ
Mean28.760.6620.6030.6048.72−0.76
Minimum0.4−1.240.9917.1623.59−1.54
Maximum88.13.9352.6749.6481.731.02
Median26.10.2617.1231.4042.84−0.82
Std. Dev.21.700.9514.707.6718.630.49
Obs.253253253253253253
Note: The table presents descriptive statistics for all variables for the N-11 economies over 2000–2022.
Table 3. Results of the multicollinearity test.
VariableVIF
Foreign Direct Investment (FDI)2.473
Green Transition (GT)4.220
Governance Quality (GQ)2.645
Industrial Growth (IG)9.724
Urbanization (URB)11.267
Mean VIF5.822
Note: A VIF value below 10 indicates the absence of severe multicollinearity.
Table 4. Cross-Sectional Dependence.
VariableBreusch-Pagan LMPesaran Scaled LMBias-Corrected Scaled LMPesaran CD
Foreign Direct Investment (FDI)134.51 ***7.34 ***7.34 ***2.80 ***
Green Transition (GT)254.22 ***18.76 ***18.76 ***3.23 ***
Industrial Growth (IG)235.53 ***16.97 ***16.97 ***0.99 **
Urbanization (URB)852.38 ***75.79 ***75.79 ***22.39 ***
Governance Quality (GQ)324.66 ***25.47 ***25.47 ***0.95 *
Note: *, **, and *** indicate significance levels of 10%, 5%, and 1%, respectively.
Table 5. Slope Homogeneity.
Deltap-Value
8.38 ***0.000
adj.6.25 ***0.000
Note: *** indicates 1% significance level.
Table 6. Unit Root Analysis.
VariableCADF
Level
CADF
1st Diff
CIPS
Level
CIPS
1st Diff
Order of
Integration
GEP1.85−2.57 ***1.85−4.22 ***I(1)
FDI−3.75−2.65 ***−3.72−5.45 ***I(1)
GT−1.34−2.24 ***−1.81−3.51 ***I(1)
IG−2.59−2.32 ***−1.86−3.89 ***I(1)
URB−2.49−1.98 ***−1.89−3.56 ***I(1)
GQ−1.64−2.44 ***−2.14−4.13 ***I(1)
Note: *** indicates significance levels of 1%.
Table 7. Westerlund Co-integration Test.
StatisticValuep-Value
Gt8.38 ***0.000
Ga10.43 ***0.000
Pt6.25 ***0.000
Pa8.65 ***0.000
Note: *** indicates significance levels of 1%.
Table 8. Machine Learning Estimators.
VariablePOLR
Coef.
Std. ErrorCross-Fit
POLR Coef.
Std. Error
Foreign Direct Investment (FDI)−1.834 *0.681−1.485 **0.651
Green Transition (GT)0.290 *0.0530.278 *0.054
Governance Quality (GQ)22.767 *1.51922.998 *1.551
Industrial Growth (IG)−0.0420.031−0.0380.030
Urbanization (URB)0.3560.1440.3310.138
Note: * and ** indicate significance levels of 10% and 5%, respectively.
Table 9. Robustness and Endogeneity Checks.
VariableIV–2SLS Coef.Std. ErrorCross-Fit ML Coef.Std. Error
FDI−1.60 **0.80−1.51 **0.78
GT0.20 **0.050.19 **0.05
IG−1.27 *0.11−1.15 *0.12
URB−0.59 *0.04−0.62 *0.04
GQ23.50 **1.3523.84 **1.32
Note: * and ** indicate significance levels of 10% and 5%, respectively.
Table 10. SHAP Robustness Test.
RankVariableMean(|SHAP|)Mean SHAPDirectionImpact Range
1URB0.15640.0532Positive[−0.482, 0.821]
2IG0.1352−0.0891Negative[−0.734, 0.514]
3GQ0.12780.0824Positive[−0.387, 0.693]
4FDI0.0953−0.0247Negative[−0.612, 0.423]
5GT0.08860.0153Positive[−0.498, 0.567]
Note: SHAP values indicate the direction and magnitude of the individual variable contribution to green energy penetration.
Disclaimer/Publisher’s Note: The statements, opinions and data contained in all publications are solely those of the individual author(s) and contributor(s) and not of MDPI and/or the editor(s). MDPI and/or the editor(s) disclaim responsibility for any injury to people or property resulting from any ideas, methods, instructions or products referred to in the content.