1. Introduction
Addressing global climate change and achieving carbon neutrality necessitate the large-scale development of renewable energy sources. Hydrogen, as a clean and efficient secondary energy carrier, is regarded as a key component of the future energy system [
1,
2]. In particular, “green hydrogen” produced via water electrolysis powered by renewable electricity has emerged as one of the core pathways for achieving deep decarbonization due to its zero carbon emissions during production [
3,
4,
5].
Proton Exchange Membrane Water Electrolysis (PEMWE) has emerged as a leading technology for green hydrogen production due to its high efficiency, rapid start-up and shutdown capability, wide load-following range, high hydrogen purity, and zero pollutant emissions [
6]. However, challenges in cost reduction and efficiency improvement still hinder large-scale commercialization. The oxygen evolution reaction (OER) at the anode, as the key half-reaction in electrolysis, is characterized by sluggish kinetics and the generation of a large volume of oxygen bubbles, both of which contribute significantly to increased overpotentials, higher energy consumption, and reduced overall efficiency [
7]. The retention, accumulation, and poor transport of gas bubbles in the flow field, porous transport layer (PTL), and catalyst layer (CL) impede reactant access, block active sites, and increase ohmic resistance, thereby significantly deteriorate PEMWE performance [
8].
Visualization techniques provide a powerful tool for directly observing the complex gas–liquid two-phase flow phenomena within flow field [
9]. During electrolysis operations, gas bubbles produced by the reaction gradually accumulate along the direction of fluid motion, leading to the emergence of distinct two-phase flow regimes. Under conditions of elevated current density and extended flow channels, annular flow is more likely to form, whereas increasing the flow velocity helps mitigate bubble accumulation [
10]. Liu et al. [
11] developed a flow regime map based on inlet Reynolds number and current density, revealing that bubble flow dominated near the inlet, while slug and annular flows were commonly observed in the middle and outlet sections.
The predictive capability of numerical simulations enables the exploration of complex multi-physics coupling mechanisms in PEMWE [
12], laying a theoretical foundation for improving energy conversion efficiency [
13]. Moradi et al. [
14] developed a one-dimensional two-phase model for PEMWE and found that increasing the operating temperature while reducing the operating pressure resulted in a more uniform temperature distribution and improved electrolysis performance. Qi et al. [
15] combined pore-scale modeling of the anode CL with macroscopic simulation of gas flow to analyze transient heat and mass transfer from the electrode to the channel, validated with a 3.5 cm2 PEM dehumidifier. Zhang et al. [
16] found that a PTL with a porosity of 60.99% exhibited optimal mass transport performance. However, there remains a significant discrepancy between experimental and numerical modeling regarding the effect of PTL on mass transport resistance.
The design of flow field structures is of great importance to mass transport and current distribution uniformity within PEMWE [
17]. Wu et al. [
18] proposed a novel structured mesh filed to enhance oxygen release capacity in PEMWE and validated their design by experimentally examining oxygen distribution and electrochemical performance in both parallel and serpentine flow field (SFF). Xu et al. [
19] designed an innovative dual-layer flow field structure which optimized gas transport paths, effectively mitigating gas blockage within the flow field. Moreover, the novel flow field exhibited more uniform temperature distribution and current density distribution. Shen et al. [
20] showed that effective flow disturbances within the field could enhance reactant transport from the flow field to the reaction zone, improve bubble removal efficiency, and reduce bubble-induced overpotential. Numerous researchers have investigated the effects of inserting obstacles of various shapes and arrangements into the flow field [
21,
22]. Dong et al. [
23] proposed five different block geometries to study mass transfer characteristics in PEM Fuel Cell (PEMFC). They found that as the bulk spatial interval increases, the enhanced convective interaction between bulk structures improves the transport of reactants and products, as well as the concentration distribution and flow dynamics. Zhang et al. [
24] proposed a SFF model incorporating arc-shaped pillars at the anode side of the PEMWE. In this design, arc pillars were integrated at the bends of the flow field. The results indicated that this model effectively facilitated oxygen removal, thereby improving the hydrogen production performance of the PEMWE.
Building upon the above studies, this work investigated the influence of gas–liquid two-phase flow behavior in the anode flow field of the PEMWE on electrolysis performance, employing an integrated approach that combined experimental observation with multi-physics simulation. In the experimental section, a visualization platform was constructed to capture the generation, evolution, and transport of oxygen bubbles during electrolysis in real time. Image processing techniques were used to extract the bubble size distribution. By correlating these results with macroscopic performance parameters such as polarization curves, a quantitative relationship between bubble behavior and overall electrolysis performance was established. A modified Butler-Volmer equation incorporating bubble parameters was introduced to develop a multi-physics coupled model encompassing electrochemical reactions, charge transport, multiphase flow, heat and mass transfer, and the model was validated against experimental data. To address issues such as bubble retention and mass transport limitations in conventional flow field, several rectangular turbulence-inducing structures were designed and embedded into the anode SFF. The results showed that these structures could enhance local fluid perturbation, improve liquid water distribution, and facilitate bubble removal. Their effects on the uniformity of liquid water saturation, temperature, and current density were systematically evaluated, providing theoretical guidance for the design and operation of the PEMWE under high-current-density conditions.
2. Model and Verification
2.1. Physical Model
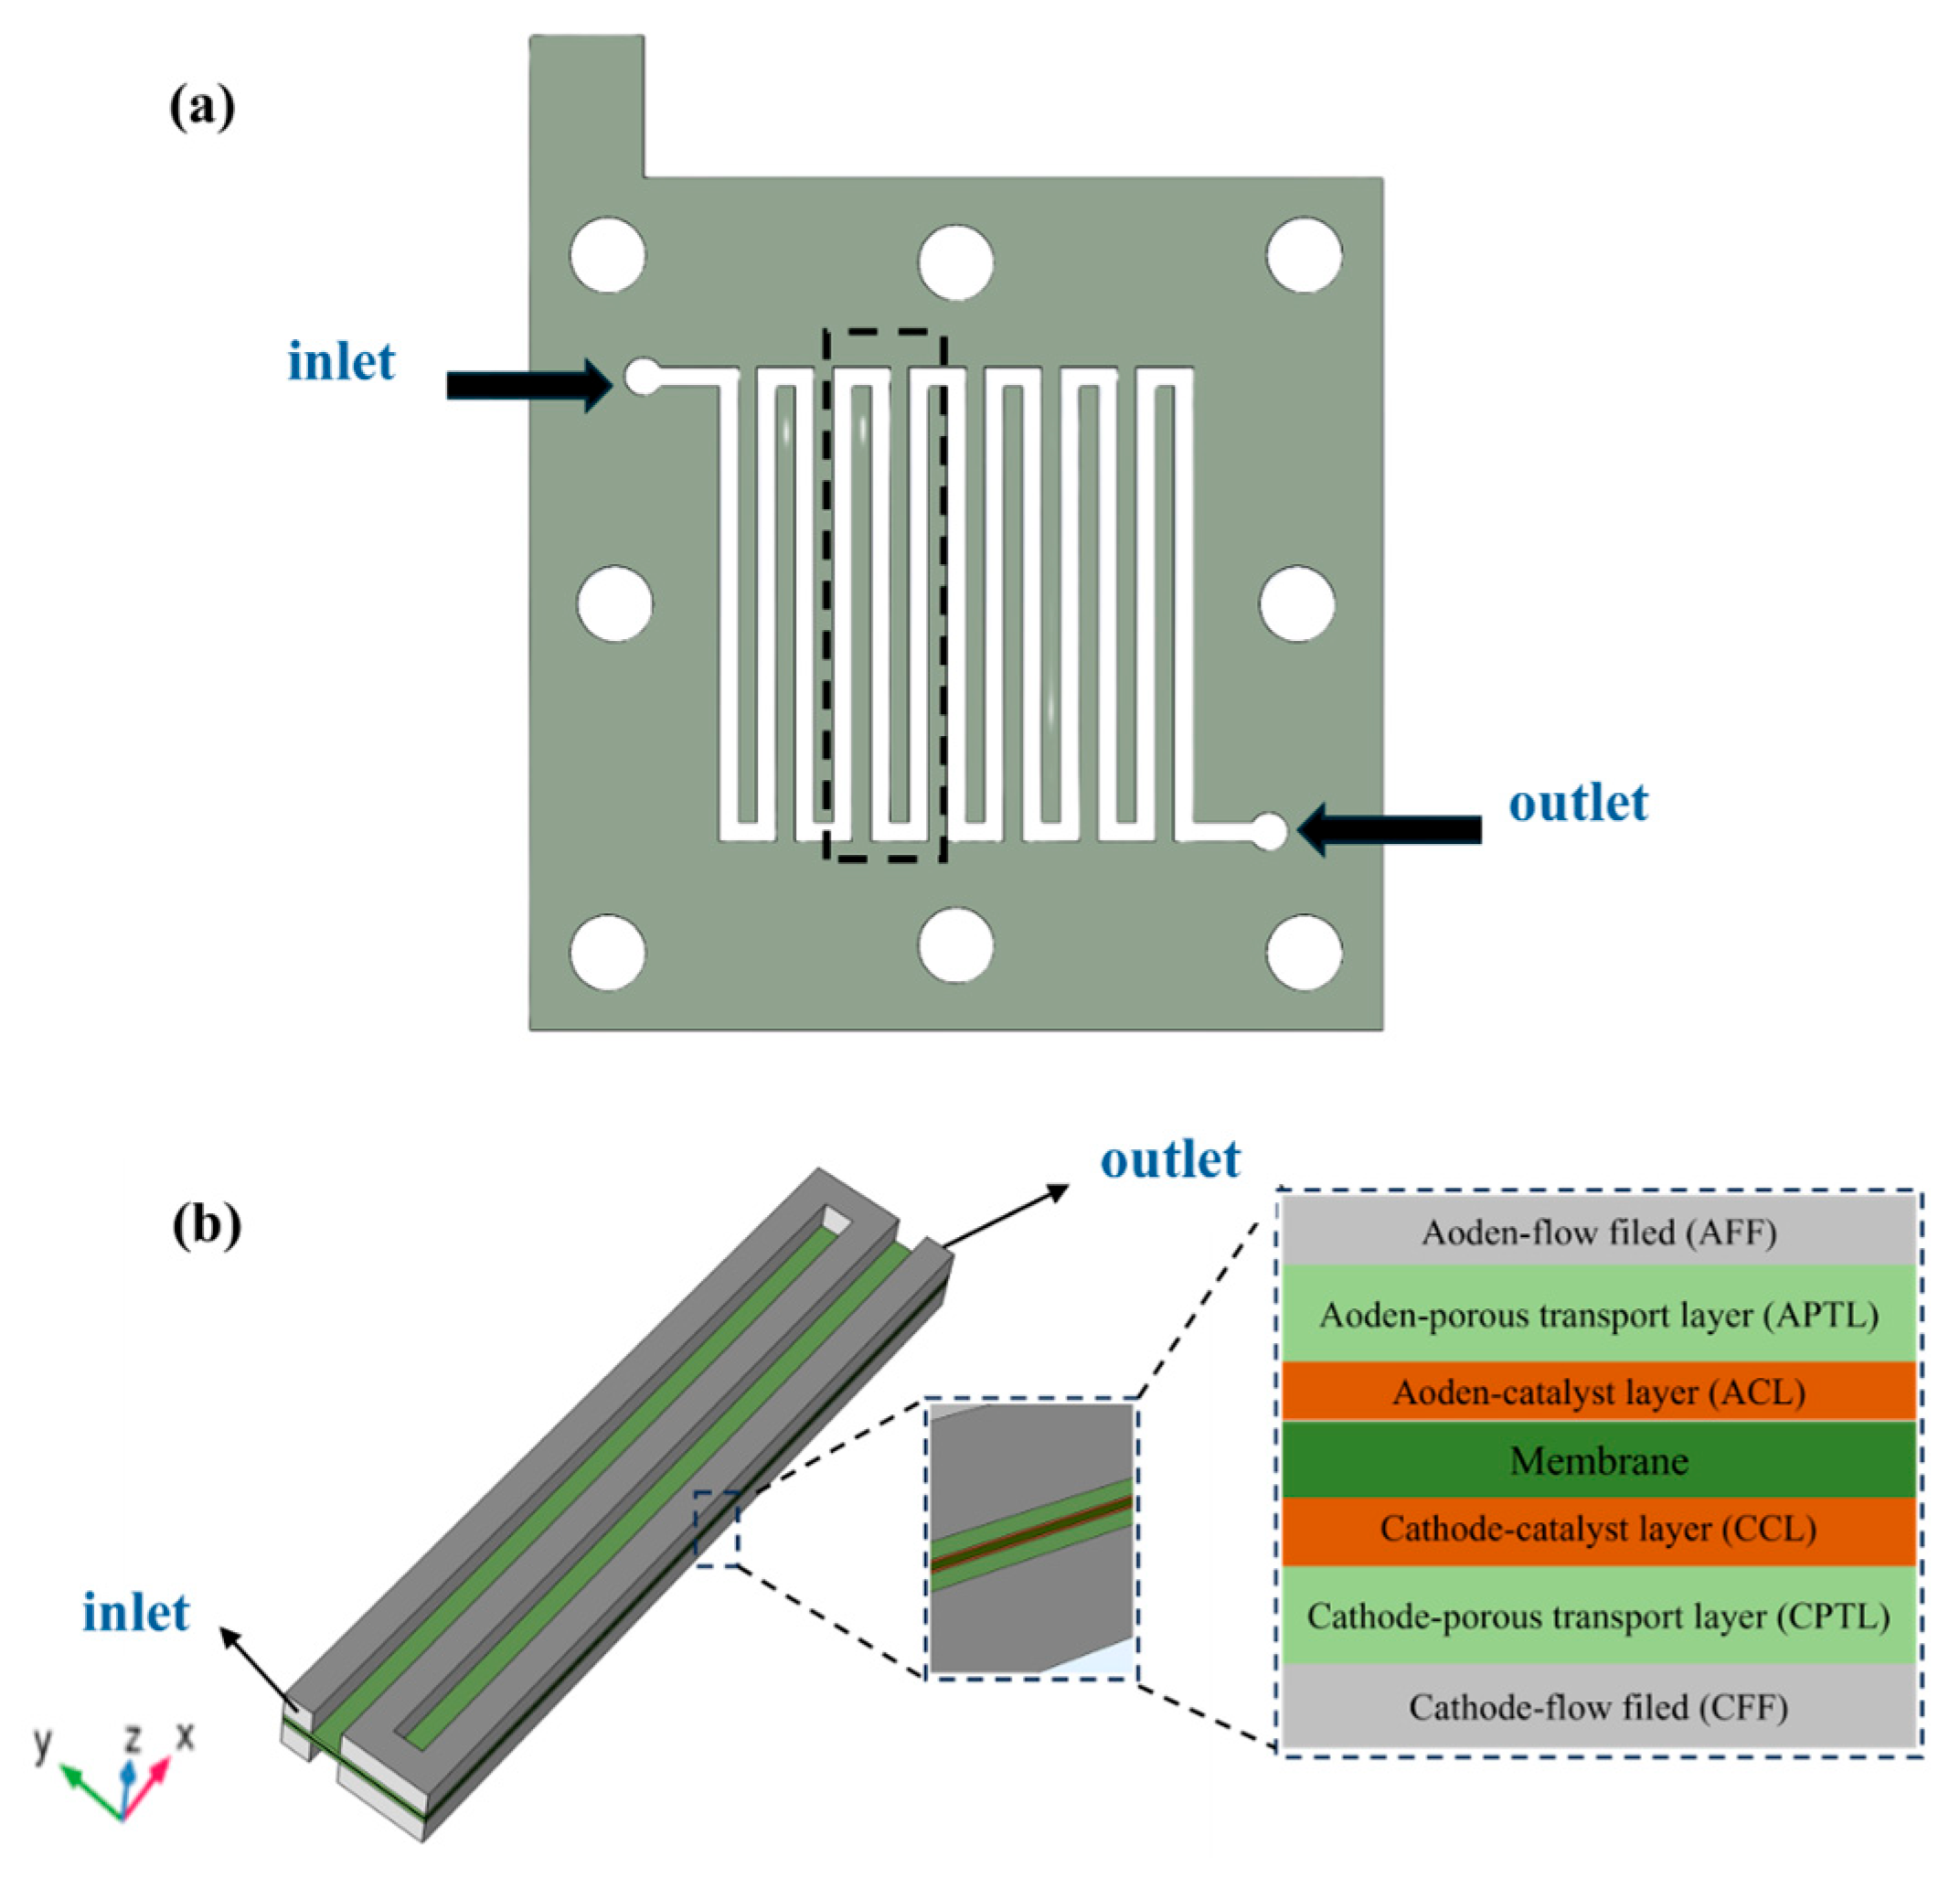
Figure 1 depicts the fundamental architecture of the PEMWE and its computational modeling representation. The detailed layout of the SFF within the PEMWE is displayed in
Figure 1a. To reduce computational cost, a representative segment of the flow field is extracted as a unit cell for modeling and analysis.
Figure 1b shows the core structure of the PEMWE, which is stacked along the positive
Z-axis direction in the following sequence: cathode flow field (CFF), cathode porous transport layer (CPTL), cathode catalyst layer (CCL), proton exchange membrane (PEM), anode catalyst layer (ACL), anode porous transport layer (APTL), and anode flow filed (AFF). The Membrane Electrode Assembly (MEA) consists of CL and PEM.
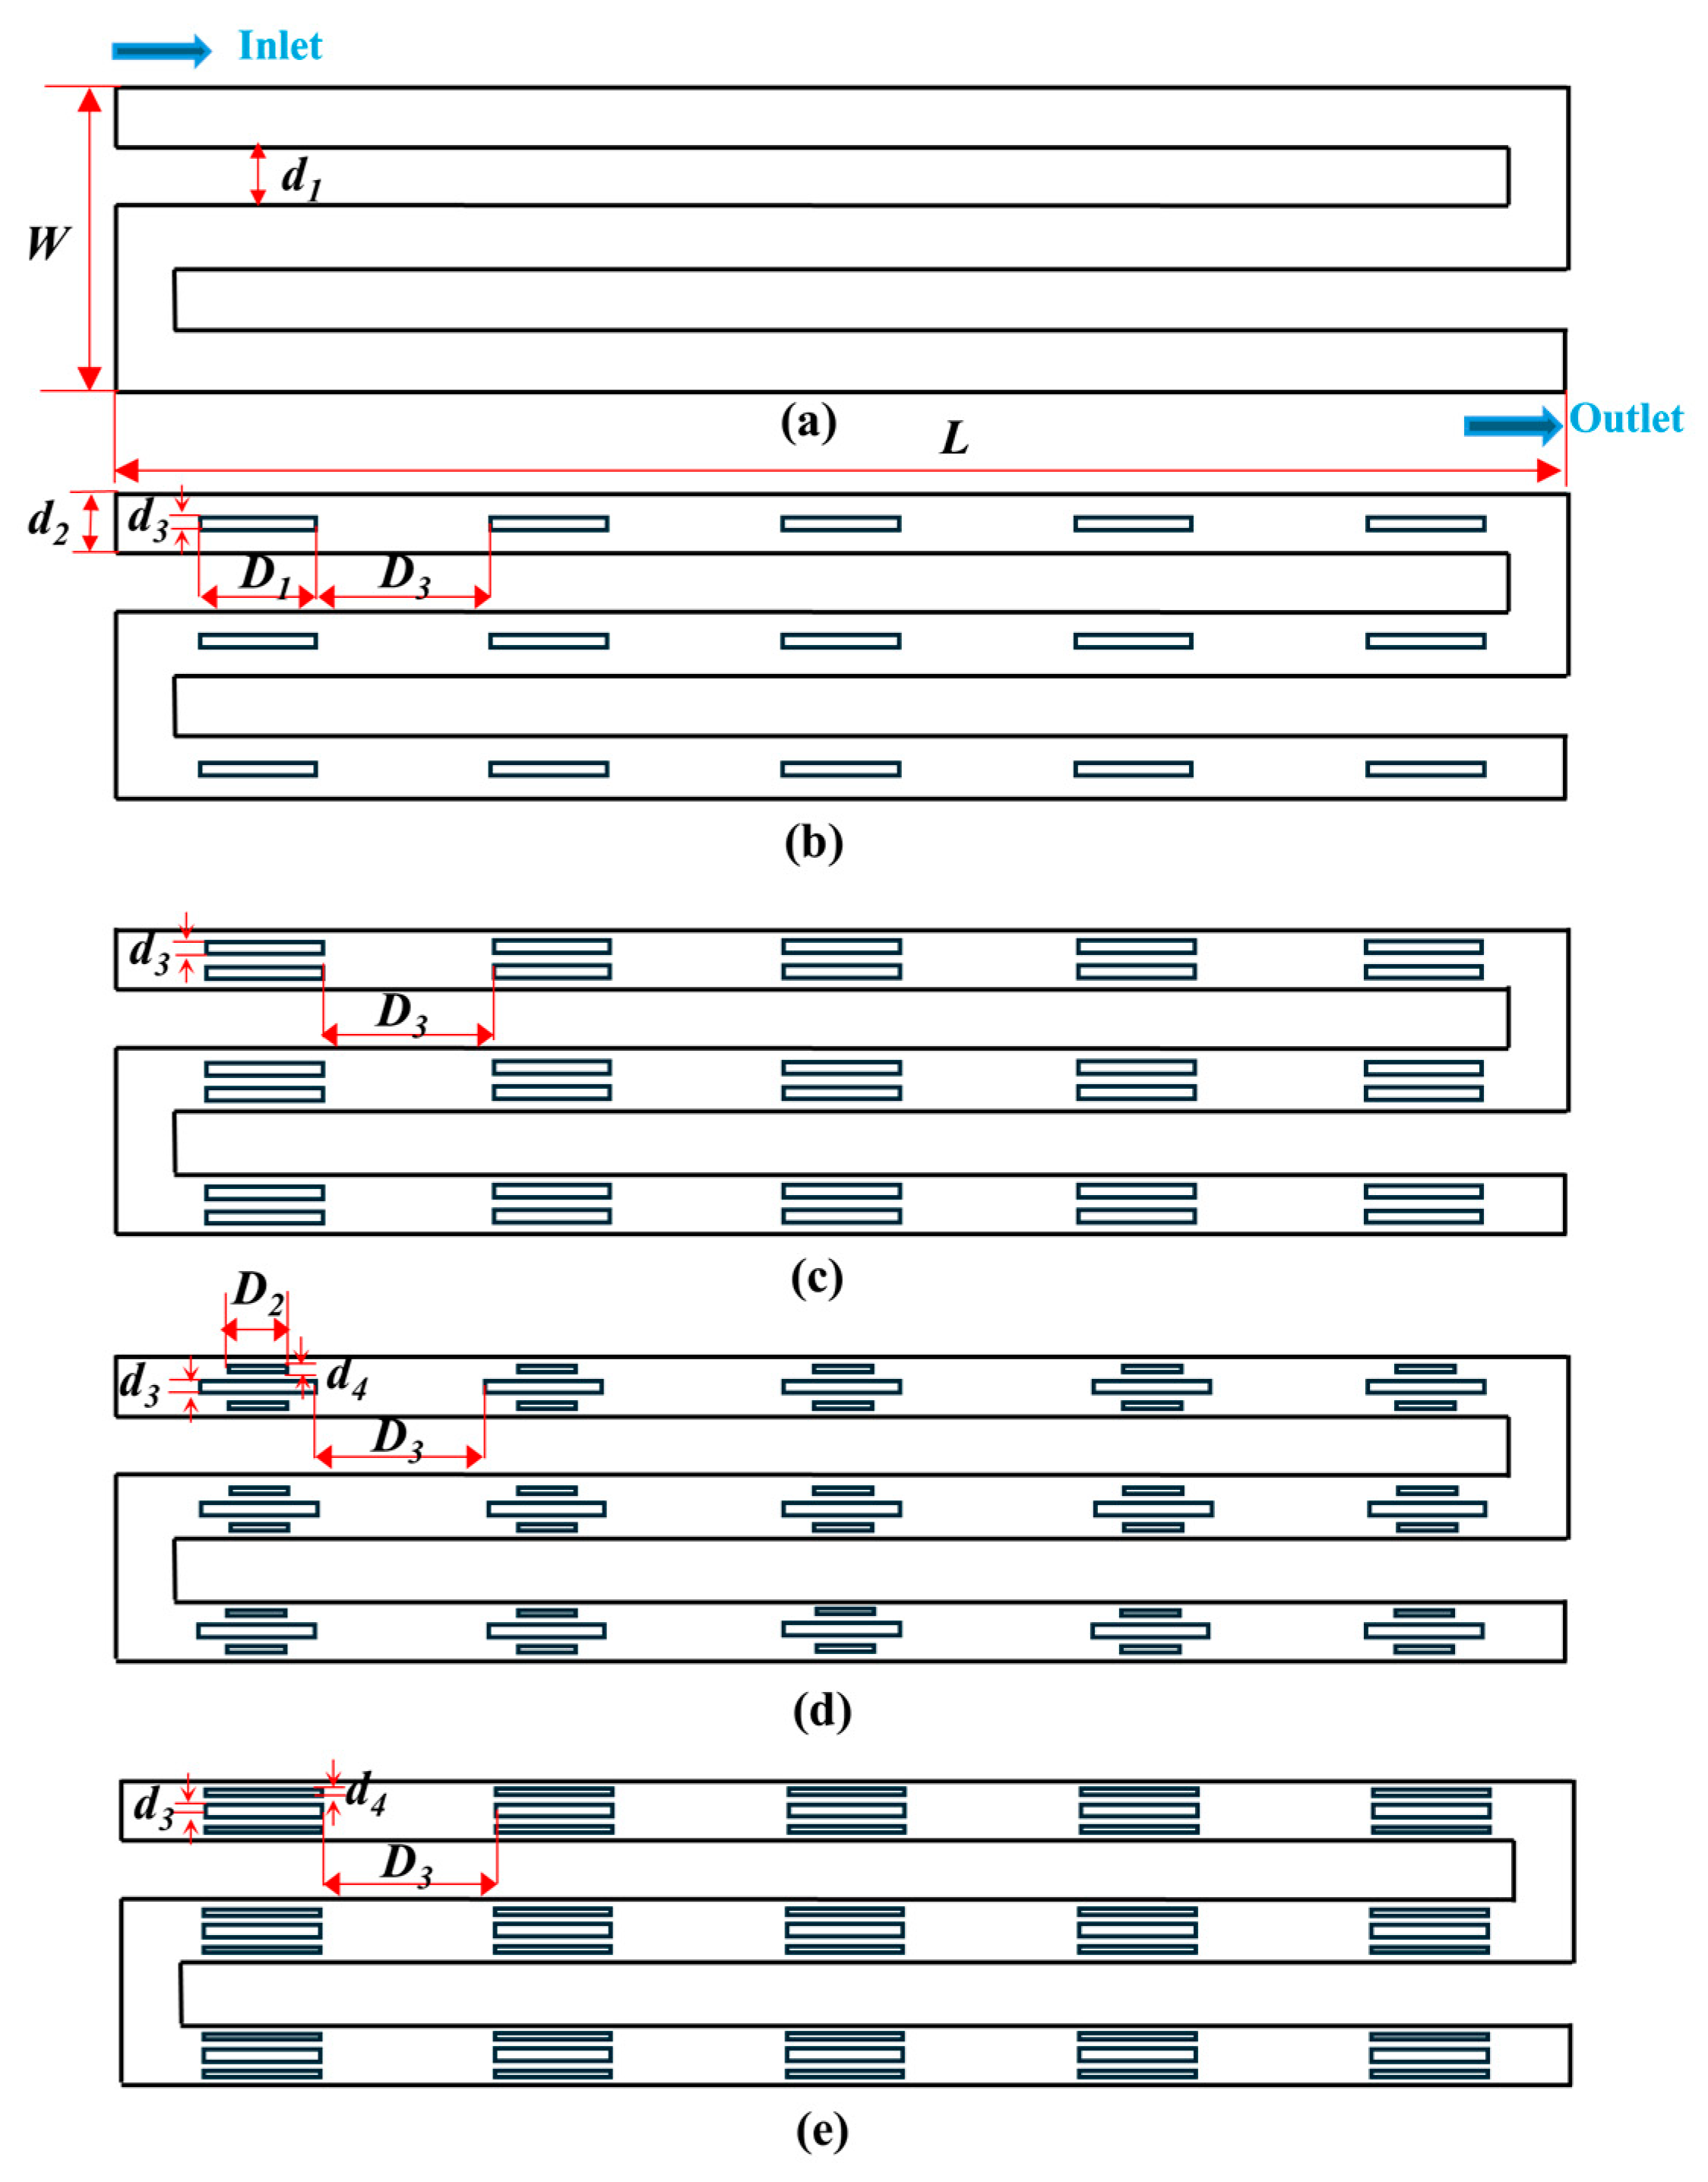
Figure 2 shows the distribution of rectangular turbulence promoters in the anode serpentine flow field. Parameters
d1 and
d2 denote the rib width and field width of the serpentine flow field, respectively. The longer rectangular turbulence promoters exhibit a width of
d3 and a length of
D1, while the shorter ones have a width of
d4 and a length of
D2. These promoters are uniformly distributed in five columns across the flow field, with a lateral spacing of
d3. All ribbed pillars were fabricated by extruding their base profiles. Detailed structural parameters of the PEMWE are listed in
Table 1.
To examine how different anode flow field turbulence promoter configurations influence the performance of PEMWE, this study employes the serpentine flow field (SFF) as the baseline model (Case 1), with the cathode flow field maintained constant under all conditions. Cases 2–5 are designated as SRB SFF, DRB SFF, TNRB SFF, and TERB SFF, respectively, based on the number and size of rectangular turbulence promoters.
Table 2 summarizes the evaluation cases of various PEMWE models under different structural configurations.
2.2. Numerical Model
In this study, a two-phase flow model is adopted to characterize the transport phenomena of liquid water and gaseous phases. The correlation between liquid water diffusion and gas behavior is established through capillary pressure. Meanwhile, by incorporating bubble parameters to modify the Butler-Volmer equation, a comprehensive integrated analysis of gas–liquid two-phase flow characteristics and PEMWE system performance is accomplished.
2.2.1. Model Assumptions
The PEMWE encompasses intricate physiochemical mechanisms, such as charge transport, electrochemical reactions, together with heat and mass transfer processes [
25]. This research develops a mathematical framework founded on the fundamental equations governing charge conservation, electrochemical kinetics, mass conservation, momentum conservation, and energy conservation. Certain reasonable assumptions and simplifications are made during the modeling process, as detailed below [
26]:
- 1.
The crossover of hydrogen and oxygen through the proton exchange membrane is neglected.
- 2.
All gases are assumed to behave as incompressible ideal gases. This assumption is justified under the present operating conditions (atmospheric pressure, moderate gas volume fractions) where density variations are negligible. However, it should be noted that under high-pressure operation or in regions of very high local gas saturation, compressibility effects may influence the pressure distribution and mass transport, which would require a compressible formulation.
- 3.
It is assumed that the bulk water solvent remains in the liquid phase without phase change (i.e., no evaporation or condensation), while gaseous products are generated electrochemically at the electrodes and transported through the liquid medium.
- 4.
The membrane, PTL, and CL are considered isotropic and homogeneous.
- 5.
Contact electrical resistance and thermal contact resistance between all adjacent components are neglected.
Building upon these assumptions, a three-dimensional, steady-state, non-isothermal, multi-physics coupled model incorporating electrochemical and two-phase characteristics is developed for the numerical simulation and analysis of PEMWE.
The present study employs a steady-state modeling framework to investigate the time-averaged multi-physics behavior of the PEMWE under constant operating conditions. While bubble generation, growth, and detachment are inherently transient phenomena, the steady-state approach is widely adopted in PEMWE system-level simulations for its computational efficiency and ability to capture macroscopic performance metrics such as polarization curves, temperature distributions, and uniformity indices. This approach provides a valid basis for comparing the relative performance of different flow-field designs, which is the primary objective of this work.
2.2.2. Electrochemical Model
The charge conservation equation in PEMWE is expressed as follows [
27]:
where
φs and
φm represent the electronic potential and electrolyte potential, respectively.
Sφs and
Sφm denote the source terms corresponding to the loss rates of electrons and protons, respectively;
σs is the conductivity of the solid porous electrode, and the proton conductivity in the membrane (
σm) is expressed as [
28]:
The anodic current density (
ia) within the ACL during the electrochemical reaction is defined by a Butler-Volmer (B-V) equation, modified using experimental data, as follows [
29]:
where
i0,an is the anode reference exchange current density, and the subscripts
an and
cat represent the anode and cathode, respectively.
s is the liquid saturation in the ACL,
ε denotes the porosity of the ACL,
Dbubble is the bubble diameter,
Eexc represents the activation energy of the electrode reaction, and
F,
R, and
T are the Faraday constant, universal gas constant, and operating temperature, respectively.
The modified Butler–Volmer equation is a semi-empirical formulation that incorporates bubble diameter (Dbubble) and liquid water saturation (s) to account for bubble coverage effects and reactant transport limitations within the ACL. The exponent associated with Dbubble reflects the inverse correlation between bubble size and the effective electrochemically active surface area; larger bubbles impede reactant access and increase local mass transfer resistance, thereby elevating activation overpotential. The dependence on s captures the influence of liquid water availability on proton conductivity and reaction kinetics. The functional form and exponent values were calibrated against the bubble size distribution obtained from visualization experiments and the macroscopic polarization data, ensuring the model accurately reproduces the experimentally observed voltage–current behavior.
During electrolysis, the operating voltage (
V) of the PEMWE is given by the following equation [
30]:
The open-circuit voltage is determined using the equation below. Since the gas partial pressures at the electrode surfaces are not used, the expression includes a concentration loss term:
where
PH2,
PO2, and
aH2O represent the partial pressures on the cathode and anode sides, and the water activity, respectively.
Under low current density conditions, activation overpotential constitutes the primary contributor to voltage loss in PEMWE, which is determined as follows [
25]:
where
Eeq is the equilibrium voltage, it can be calculated using the following equation [
31]:
The ohmic overpotential primarily arises from electron transport through the PTLs and ion conduction through the membrane. It is described by Ohm’s law [
29]:
where
dPTL,a/c, σ
PTL,a/c, and ε
PTL,a/c denote the thickness, conductivity, and porosity of the anode/cathode PTLs, respectively, while
dmem represents the membrane thickness.
2.2.3. Two-Phase Flow Model
Within the porous media, the PTL and CL are simulated by applying Darcy’s law along with a phase transfer model. In these porous domains, the mass conservation equation and the volume fraction for each phase are addressed through the following equations [
32]:
where ε
p is the porosity, and
ui denotes the volumetric flux vector of phase i. At the anode side, the volume fractions of the two phases satisfy (s
l + s
g = 1), and the volumetric flux is determined by the modified Darcy’s law [
33]:
where κ is the permeability of the porous medium, κ
ri is the relative permeability of phase
i, μ
i is the dynamic viscosity, p
i is the pressure field of the fluid domain, and
g is the gravitational acceleration (retained for completeness; its effect is negligible under the present horizontal, forced-flow conditions).
In the porous regions of the PTL and CL, capillary pressure acts as a key driver for fluid transport and provides a fundamental connection between the gaseous and liquid phases. The capillary pressure can be formulated as [
30]:
where
σt denotes the surface tension at the gas–liquid interface, θ
c is the contact angle on the solid surface, and
J(
s) is the Leverett function, defined as follows:
It should be noted that the contact angle and the Leverett-function parameters are treated as constants, representing the initial wettability state of the PTL. Potential temporal changes in surface wettability due to operation are not considered in the present steady-state model.
The liquid-phase velocity (
ul) and gas-phase velocity (
ug) are given by [
34]:
The governing equations for gas and liquid transport are expressed as follows:
where
K is the permeability of the porous layer. The values of these characteristic parameters are listed in
Table 3.
krl and
krg are the relative permeabilities of the liquid and gas phases, respectively, which are functions of the liquid saturation [
35]:
2.2.4. Mass and Heat Transfer Model
Assuming thermal equilibrium among all phases, the energy conservation equation is expressed as follows [
36]:
where
Cp and
keff represent the specific heat capacity and the effective thermal conductivity, respectively. The subscripts g, l, and s denote gas, liquid, and solid phases.
ST is the source term, which includes irreversible reaction heat, ohmic heat, and entropy heat. The source terms of the governing equations are listed in
Table 4.
For the gas-phase species, the governing equations for mass and momentum conservation are given as follows:
where ρ
g denotes the density of the gas mixture,
ug represents the velocity vector of the gas mixture, and
is the effective porosity for the gas species, which depends on the intrinsic porosity of the material and the volume fraction of liquid water. This relationship can be expressed as:
The convection and diffusion behavior of the gas species is described using the Maxwell-Stefan equation [
36], given as:
where ω
i denotes the mass fraction of species
i,
xk represents the mole fraction of species
k, and
is the effective diffusion coefficient of the gas species, which can be corrected using the Bruggeman equation.
D0 is the binary diffusion coefficient of the gas components.
The normal mass transfer coefficient (
Km) is used to quantify the effect of different flow field designs on mass transport in the APTL, and is defined as follows [
38]:
where
v is the vertical velocity of the fluid,
s is the liquid water saturation, ρ
H2O is the density of liquid water,
MH2O is the molar mass of water, z is as shown in Equation (29), and
Km is positively correlated with the vertical velocity and the concentration gradient of the reactants. A larger value of
Km indicates stronger mass transport within the PTL.
z represents the axial direction.
Since the catalyst layer-membrane (CL-PEM) interface is the region where electrochemical reactions are most intense, the uniformity of temperature distribution, liquid water saturation, and current density at the ACL-PEM interface is evaluated using a uniformity index (
Uφ), defined as follows [
27]:
where φ and φ
avg represent the local and average values of the respective parameters at the ACL-PEM interface.
UT,
Us, and
Ui denote the uniformity indices for temperature, liquid water saturation, and current density, respectively. A uniformity index closer to zero indicates a more uniform distribution.
2.3. Numerical Solution Methods
2.3.1. Mesh Generation
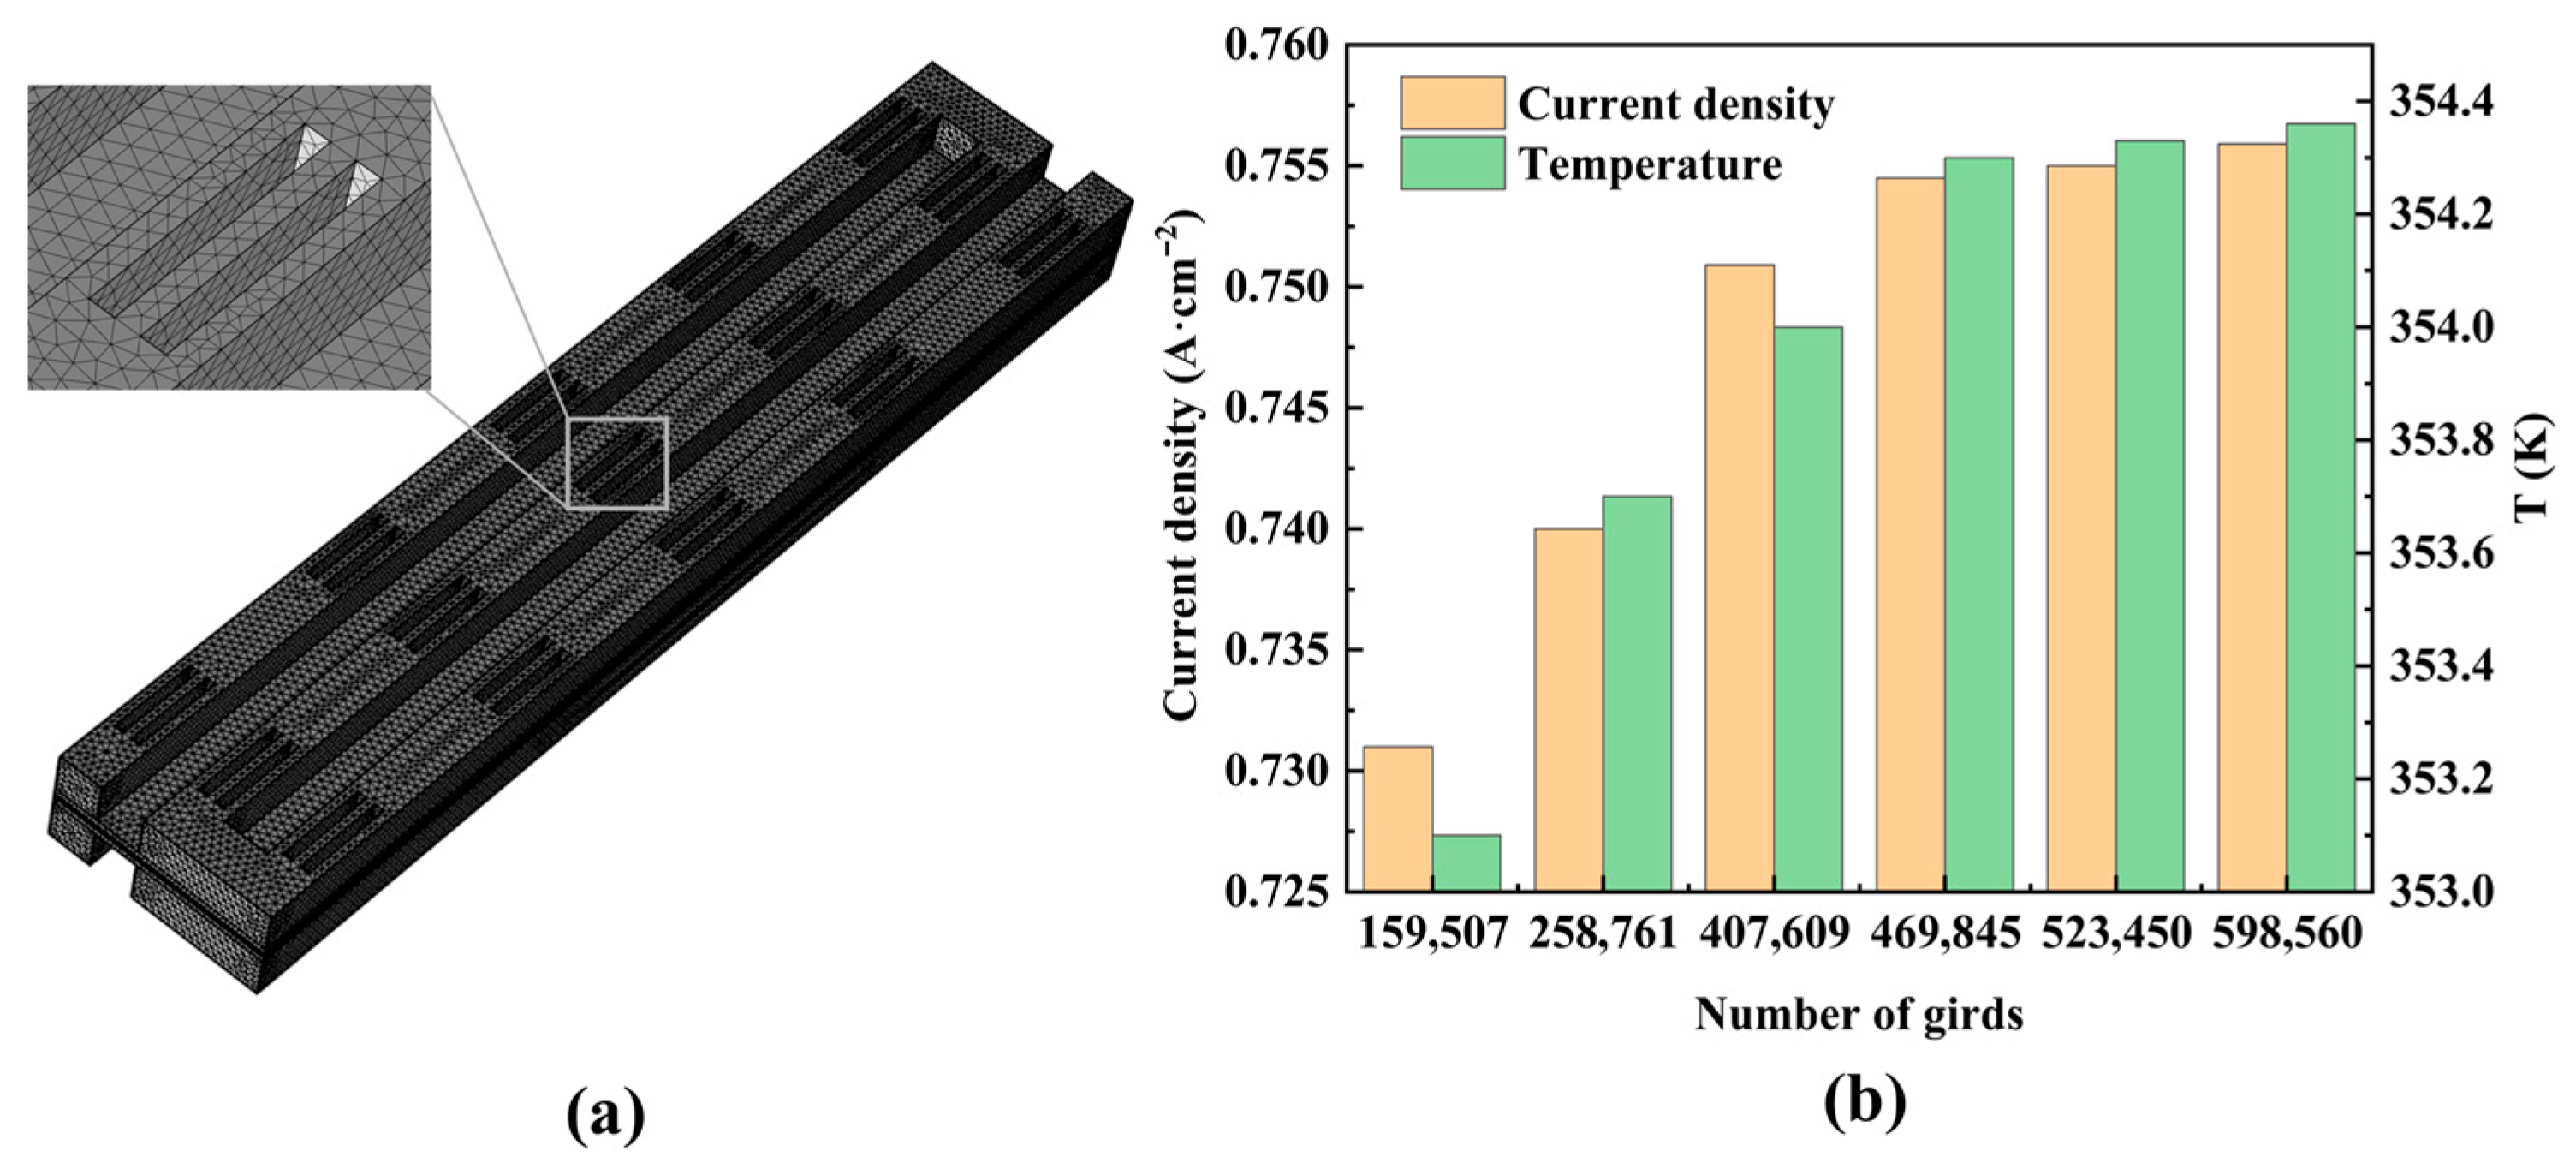
The computational domain was discretized using a structured grid partitioning approach, shown in
Figure 3a. Due to the varying scales of different components within each layer, spatial discretization employed varying mesh sizes across different regions. As the central region for electrochemical reactions, the CL was discretized using a refined mesh to accurately resolve heat transfer, mass transport, and electrochemical features. Regions such as the proton exchange membrane (PEM), PTL, and flow field were meshed with progressively coarser grids to conserve computational resources. Grid independence was verified for the geometric model;
Figure 3b shows the variation in computed current density with mesh number for the DRB SFF. When the mesh count reached 523,450, changes in current density and peak temperature were less than 1.5%, indicating this as the optimal mesh size for the DRB SFF model. Correspondingly, the optimal mesh counts for Cases 1, 2, 4, and 5 were 541,349, 529,941, 612,177, and 632,195, respectively.
2.3.2. Boundary Conditions and Numerical Solution
The commercial finite element software COMSOL Multiphysics (version 6.0) was employed to solve the governing equations under specified boundary conditions. Computations were performed using a fully coupled approach, with a sparse matrix direct solver applied to obtain the solutions for all physical field variables. The electrochemical conservation equations were solved using the water electrolysis module. Gas-liquid transport equations were solved using the phase transfer module for free and porous media flow, coupled with Darcy’s law. The energy conservation equation was solved using the combined solid and fluid heat transfer module, with convergence achieved when the residuals reached below 10
−5. To enhance numerical stability, streamline diffusion stabilization was applied to the momentum and species transport equations. The maximum number of iterations per step was limited to 100, and all simulations converged within this limit. Constant potential boundary conditions were employed. The anode end face was assigned a fixed potential, the cathode end face was set as electrical ground, and all other external walls were electrically insulated [
39]. For flow conditions, the anode inlet was specified as a velocity inlet with a constant velocity of 0.3 m·s
−1. The anode and cathode outlets were defined as pressure outlets with outlet pressure equal to atmospheric pressure. All other walls in the fluid domain were assigned no-slip boundary conditions. The anode flow field at the inlet was maintained at a constant temperature of 80 °C, while all other sidewalls and end walls were set as adiabatic boundaries.
2.4. Model Validation
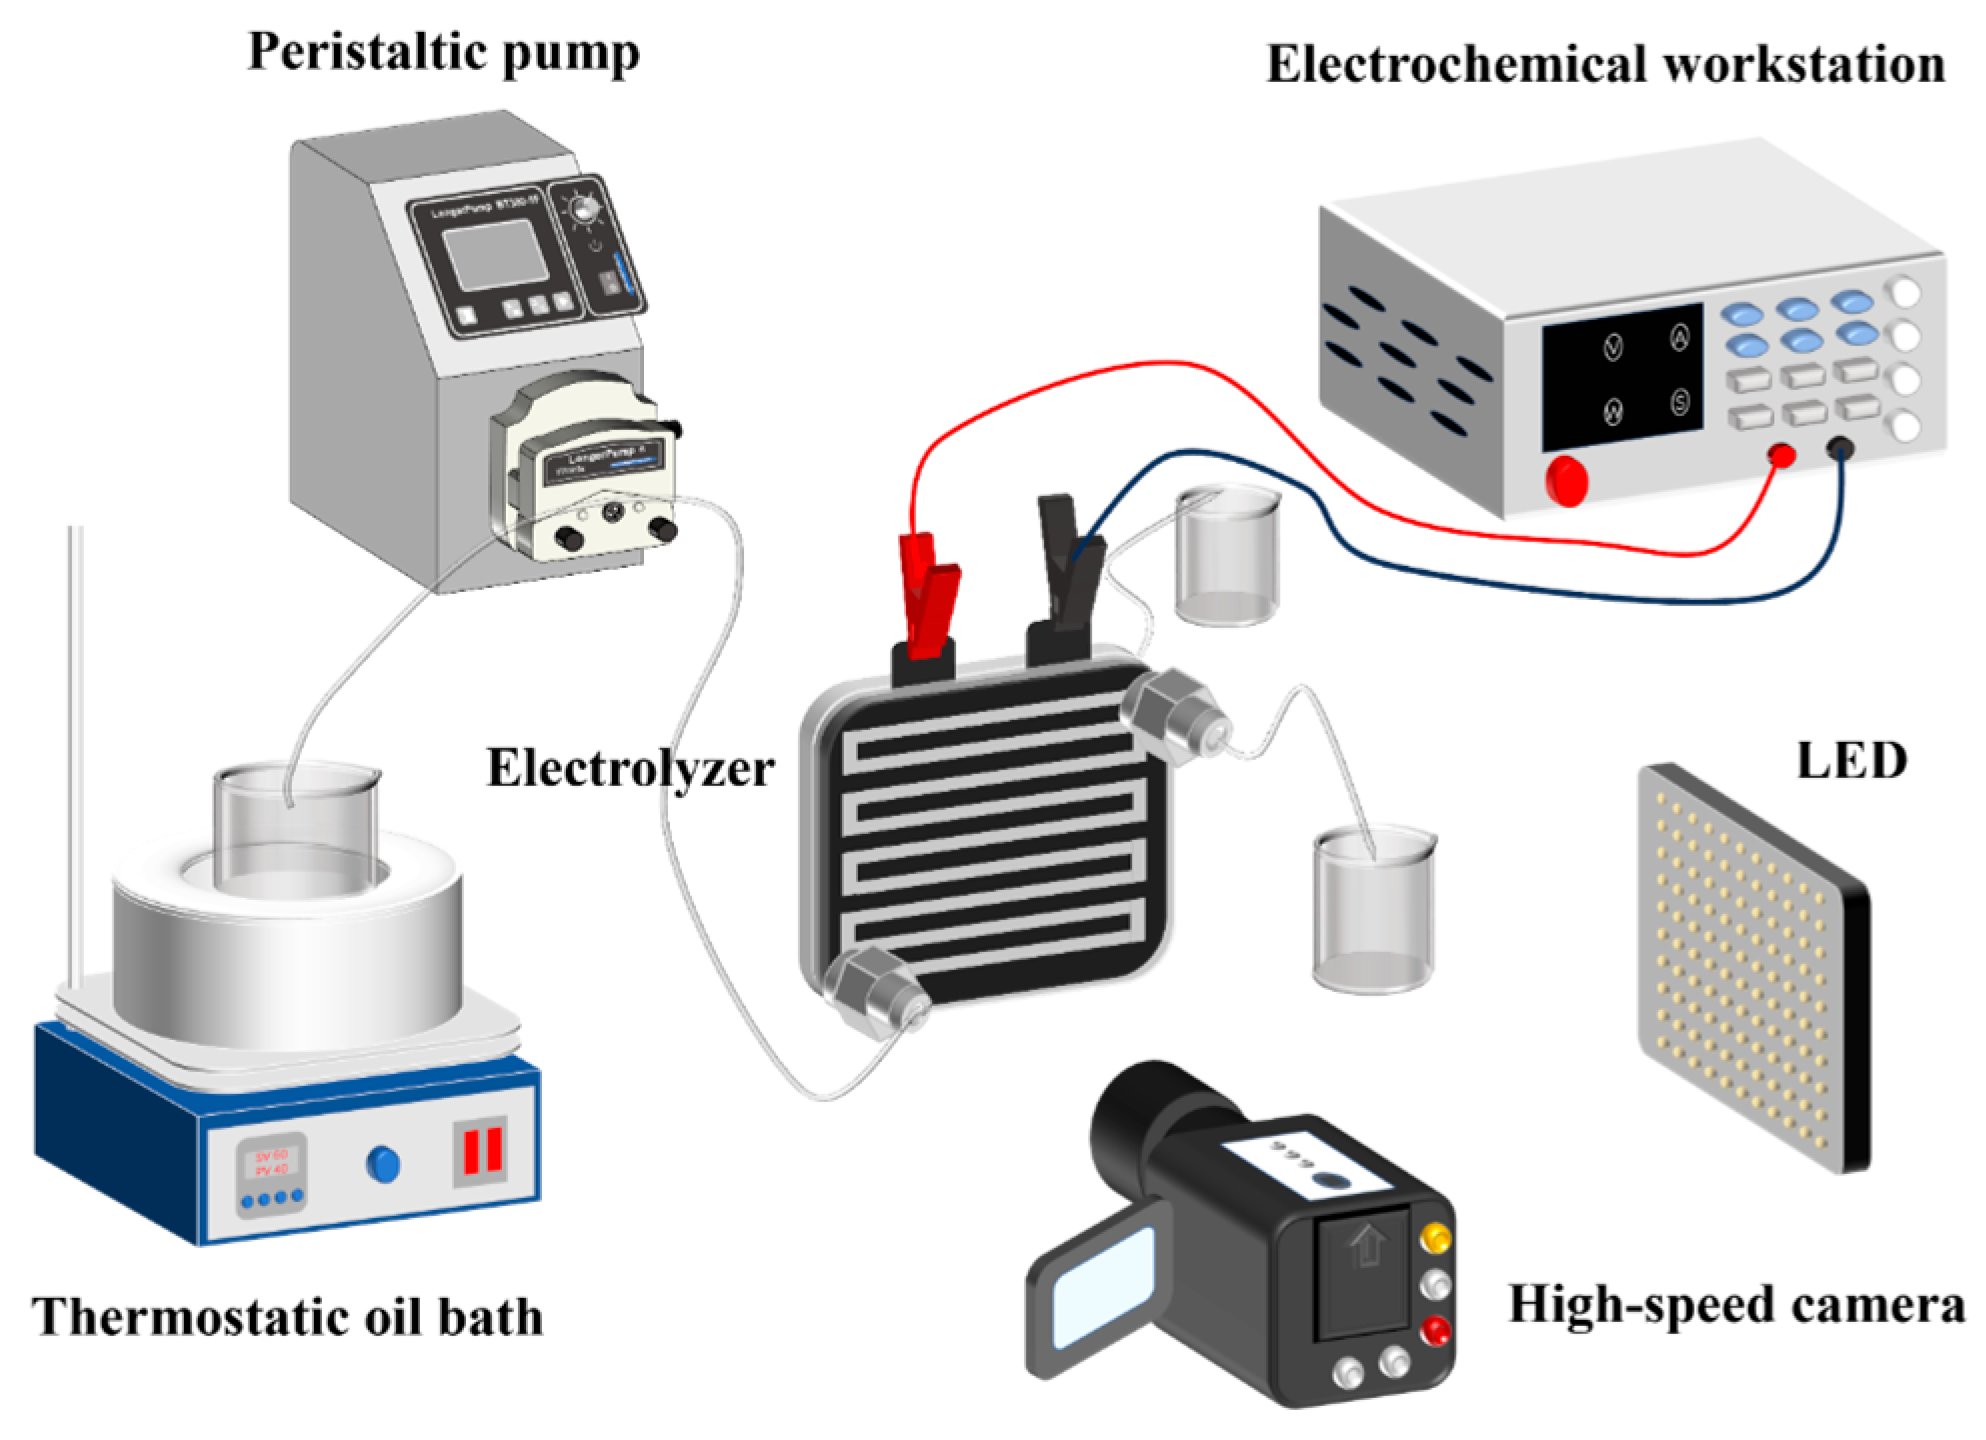
To verify the reliability of the model and computational approach, a single-cell PEMWE experimental setup was constructed, as shown in
Figure 4. The dimensions of all components in the system were consistent with those of the established physical model. The experiment employed a commercial catalyst-coated membrane with an IrO
2 loading of 1.5 mg·cm
−2 and a Pt/C loading of 0.4 mg·cm
−2, utilizing Nafion117 as the membrane material [
40]. The effective reaction area was 25 cm
2. Titanium felt and Toray 060 carbon paper were selected as the PTL at the anode and cathode sides, respectively. Both anode and cathode flow field plates were titanium plates featuring SFF structures. The flow plates were held between two stainless steel end plates, fastened with eight evenly spaced M6 bolts tightened to 5 N·m torque. Polytetrafluoroethylene (PTFE) was employed as the sealing gasket material at interfaces to prevent electrolyte leakage.
The experimental setup consisted of a DC power supply (e.g., SS-3050P, Dongguan, Guangdong, China), a peristaltic pump (e.g., LongerPump, Baoding, Hebei, China), the electrolysis, a thermostatic oil bath (e.g., DF-101S, Gongyi, Henan, China), and a high-speed camera (e.g., Phantom, Wayne, NJ, USA). During operation, the DC power supply provided current to drive the electrolysis process. Deionized water was delivered to the anode side at a flow rate of 75 mL·min−1 using a peristaltic pump. The produced hydrogen and oxygen gases were discharged through connected tubing, while the outlet water was recirculated to the reservoir, establishing a closed-loop system. Prior to each experiment, an approximately 2 h activation process was conducted to remove residual impurities from the PEMWE fabrication process.
Different current densities were achieved by adjusting the output current of the DC power supply during the experiments. Data for each set were collected after maintaining stable operation for over 180 s, with voltage and current recorded during the final 60 s. All tests were conducted at an inlet water temperature of 80 °C and atmospheric pressure.
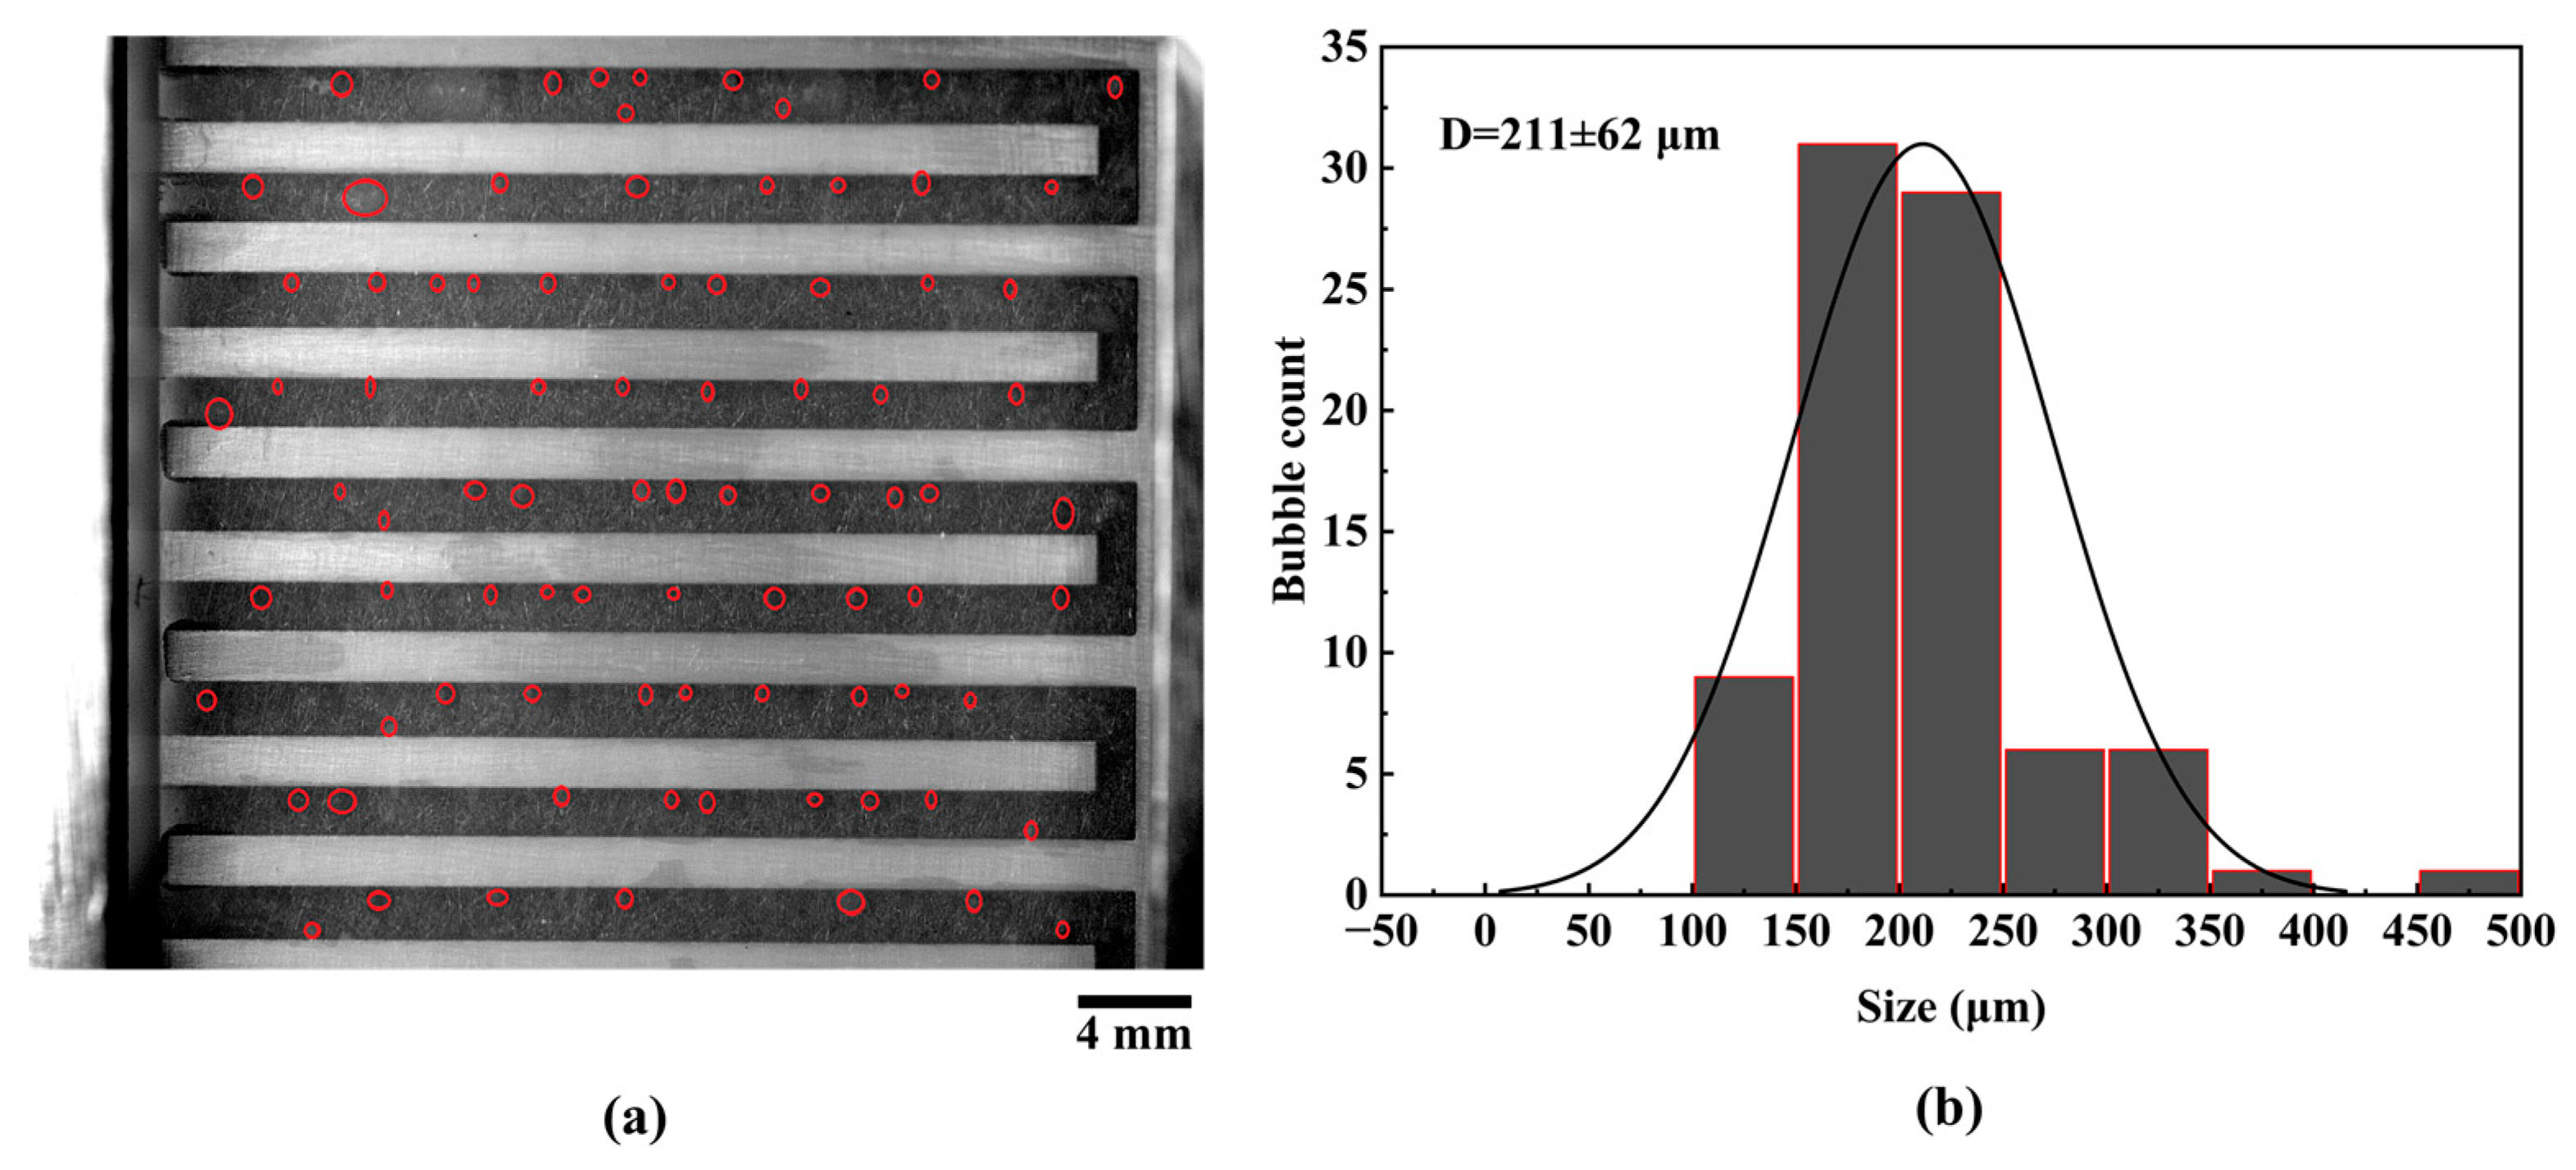
Figure 5a showed the initial bubble formation captured by the high-speed camera at a current density of 0.1 A·cm
−2. Bubble diameters were statistically analyzed using ImageJ software (version 2.14.0) in
Figure 5b, revealing an average bubble diameter of 211 μm (standard deviation ± 62 µm from three repeated experiments), which served as a reference for the numerical simulations. The repeatability of the diameter measurement confirms the consistency of the visualization data.
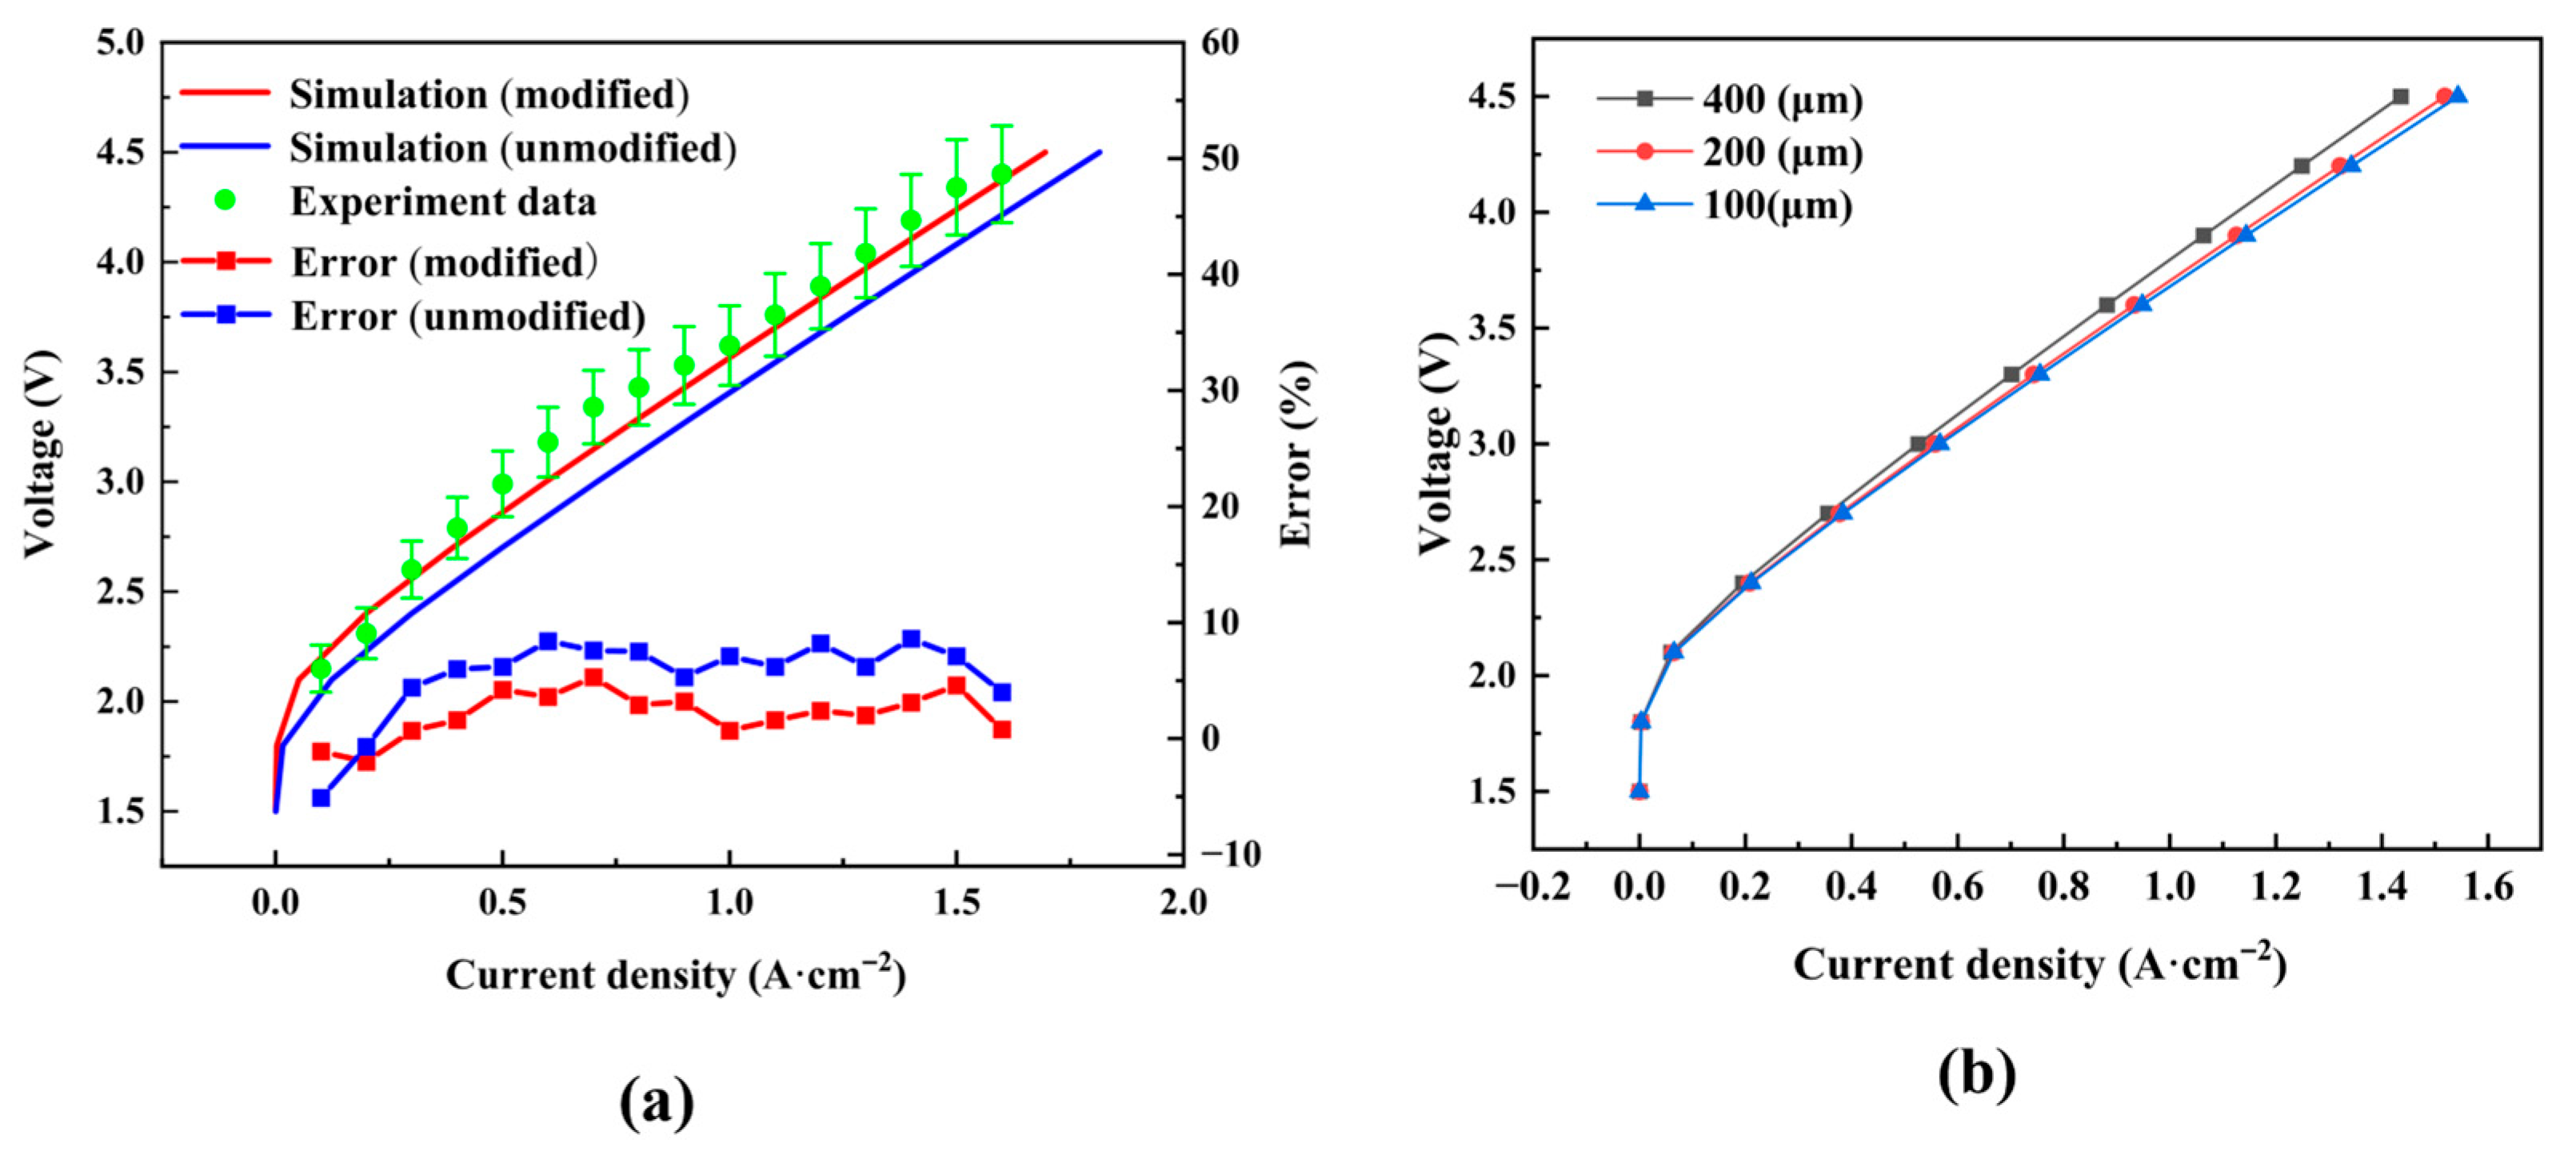
Figure 6a illustrates the polarization curves obtained from both experimental measurements and numerical simulations. Bubble parameters obtained from visualization experiments were used to modify the Butler-Volmer equation. Compared with the polarization curve without B-V equation modification, the modified simulation results showed better agreement with experimental data, with a maximum deviation below 5.3%. These results demonstrated that the numerical model developed in this study accurately simulates the performance of the PEMWE. All polarization and visualization experiments were repeated three times under identical operating conditions to ensure reproducibility. The average values are reported, and error bars are included in the corresponding figures.
Before discussing the influence of turbulence promoters, the sensitivity of the model to the bubble diameter parameter was examined. Simulations were performed with bubble diameters varying from 100 µm to 400 µm at 4.5 V. As shown in
Figure 6b, when the bubble diameter increases from 100 µm to 400 µm, the current density decreases by approximately 7.1%, confirming that larger bubbles indeed attenuate the mass-transfer limitations. The experimentally measured average diameter (211 µm) lies within the range where the model exhibits moderate sensitivity, thereby supporting the use of a single representative diameter in the modified Butler–Volmer equation.
3. Results and Discussion
This section presents the multi-physics simulation results based on the experimentally validated numerical model. First, from a multi-physics perspective, the effects of different anode flow field structures with turbulence-promoting pillars on the flow behavior, mass transport, and heat transfer characteristics of the electrolysis are investigated. Second, the distributions of liquid water saturation, temperature, and current density at the catalyst layer-membrane interface are analyzed. Normalized mass transfer index within the PTL under varying voltages and the overall polarization performance are also evaluated. Finally, the impact of rectangular turbulence promoters on bubble fragmentation effects and electrolysis performance is discussed based on visualized experimental data.
3.1. Influence of Varied Turbulence Promoter Structures on Mass Transfer Performance
The flow regime can be further characterized by dimensionless numbers: the Reynolds number (Re ≈ 800) indicates laminar-to-transitional flow, the low Capillary number (Ca ≈ 10−5) suggests surface-tension dominance, and the Bond number (Bo ≈ 0.1) confirms that gravitational effects are negligible relative to surface tension. These values explain the prevalence of bubble/slug flow and justify the use of turbulence promoters to disrupt surface-tension-driven bubble coalescence.
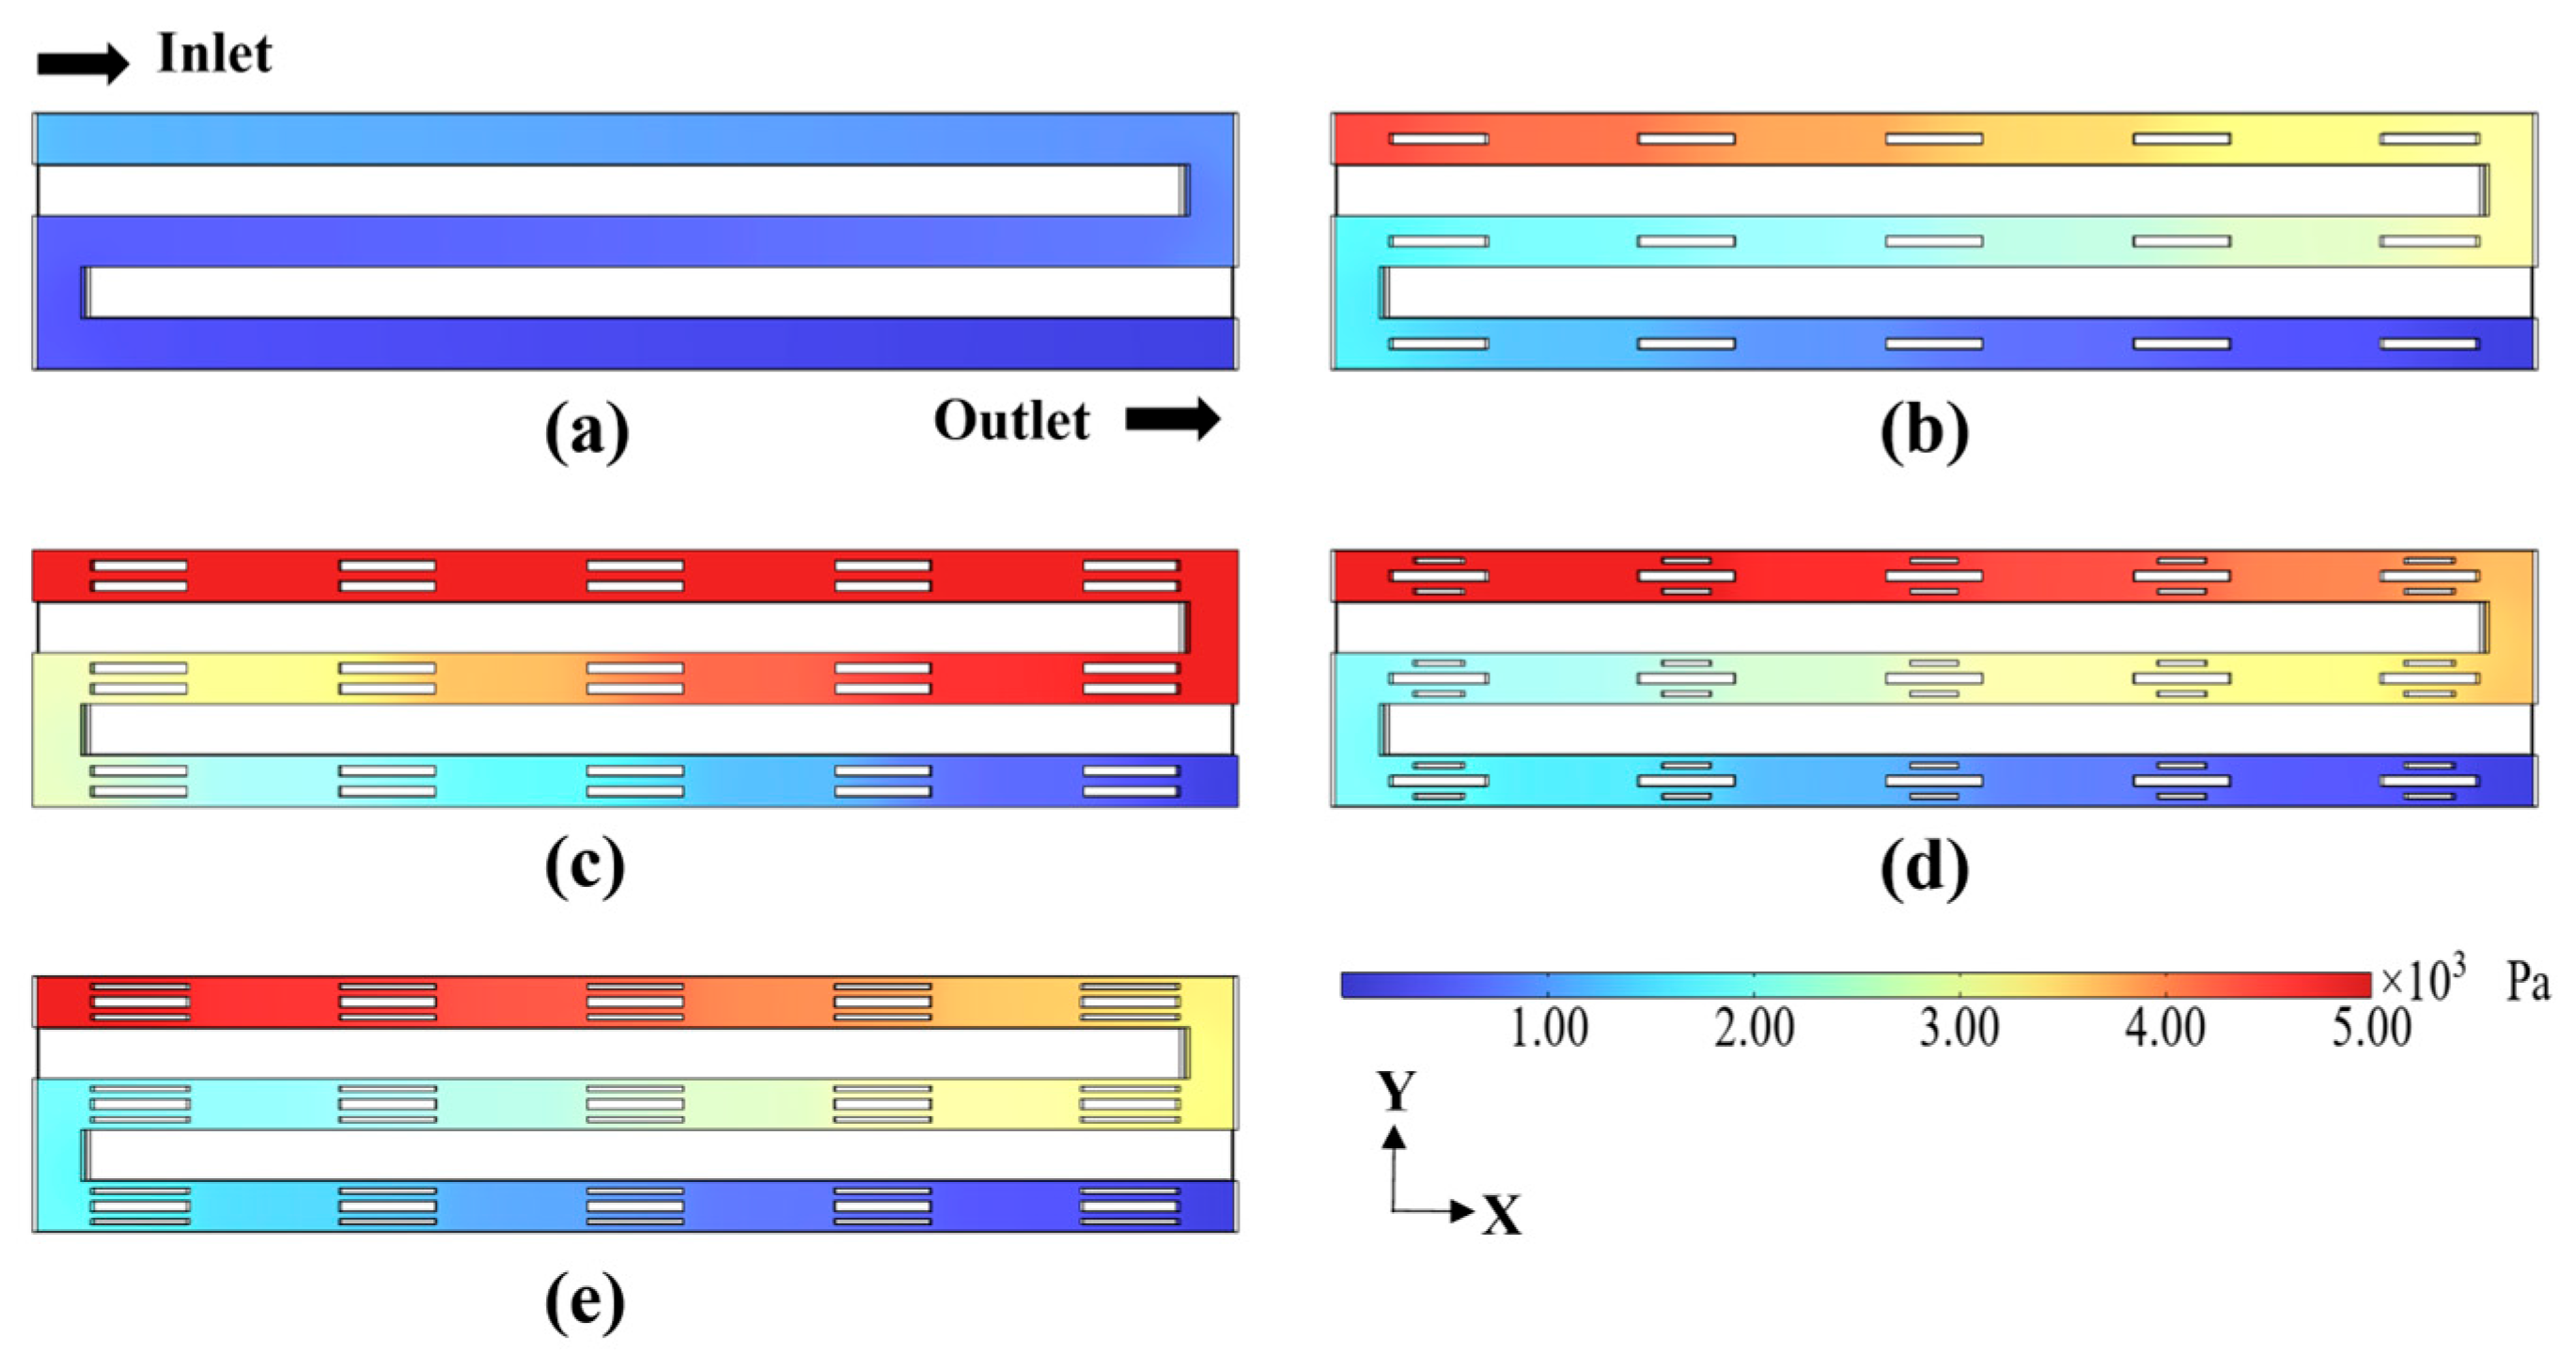
Figure 7 presents the pressure distributions at the ACH-APTL interface under different flow field configurations, which are used to assess the pressure drop and energy consumption associated with reactant mass transport. The pressure drops for the various cases are as follows: 1139.83 Pa, 4527.25 Pa, 8283.96 Pa, 5664.2 Pa and 5124.59 Pa. Case 1 demonstrates the minimal pressure drop attributable to the lack of turbulence-promoting pillars and relatively low flow velocities. A reduced pressure drop implies lower pumping energy consumption for water delivery into the flow field. Compared with the conventional SFF, the introduction of rectangular rib structures results in a higher pressure drop. The significant pressure differences between adjacent regions can effectively enhance mass transport within the flow field. However, in Case 1, the major pressure gradient is confined to the inlet region, while minimal pressure variation is observed in the main flow field. Conversely, the flow field with rib structures exhibit pressure gradients distributed throughout all regions. Therefore, the mass transfer performance of Case 1 is inferior to that of the rib-enhanced configurations. These findings highlight the need to comprehensively consider multiple factors when evaluating the impact of different flow field designs on the PEMWE performance.
As depicted in
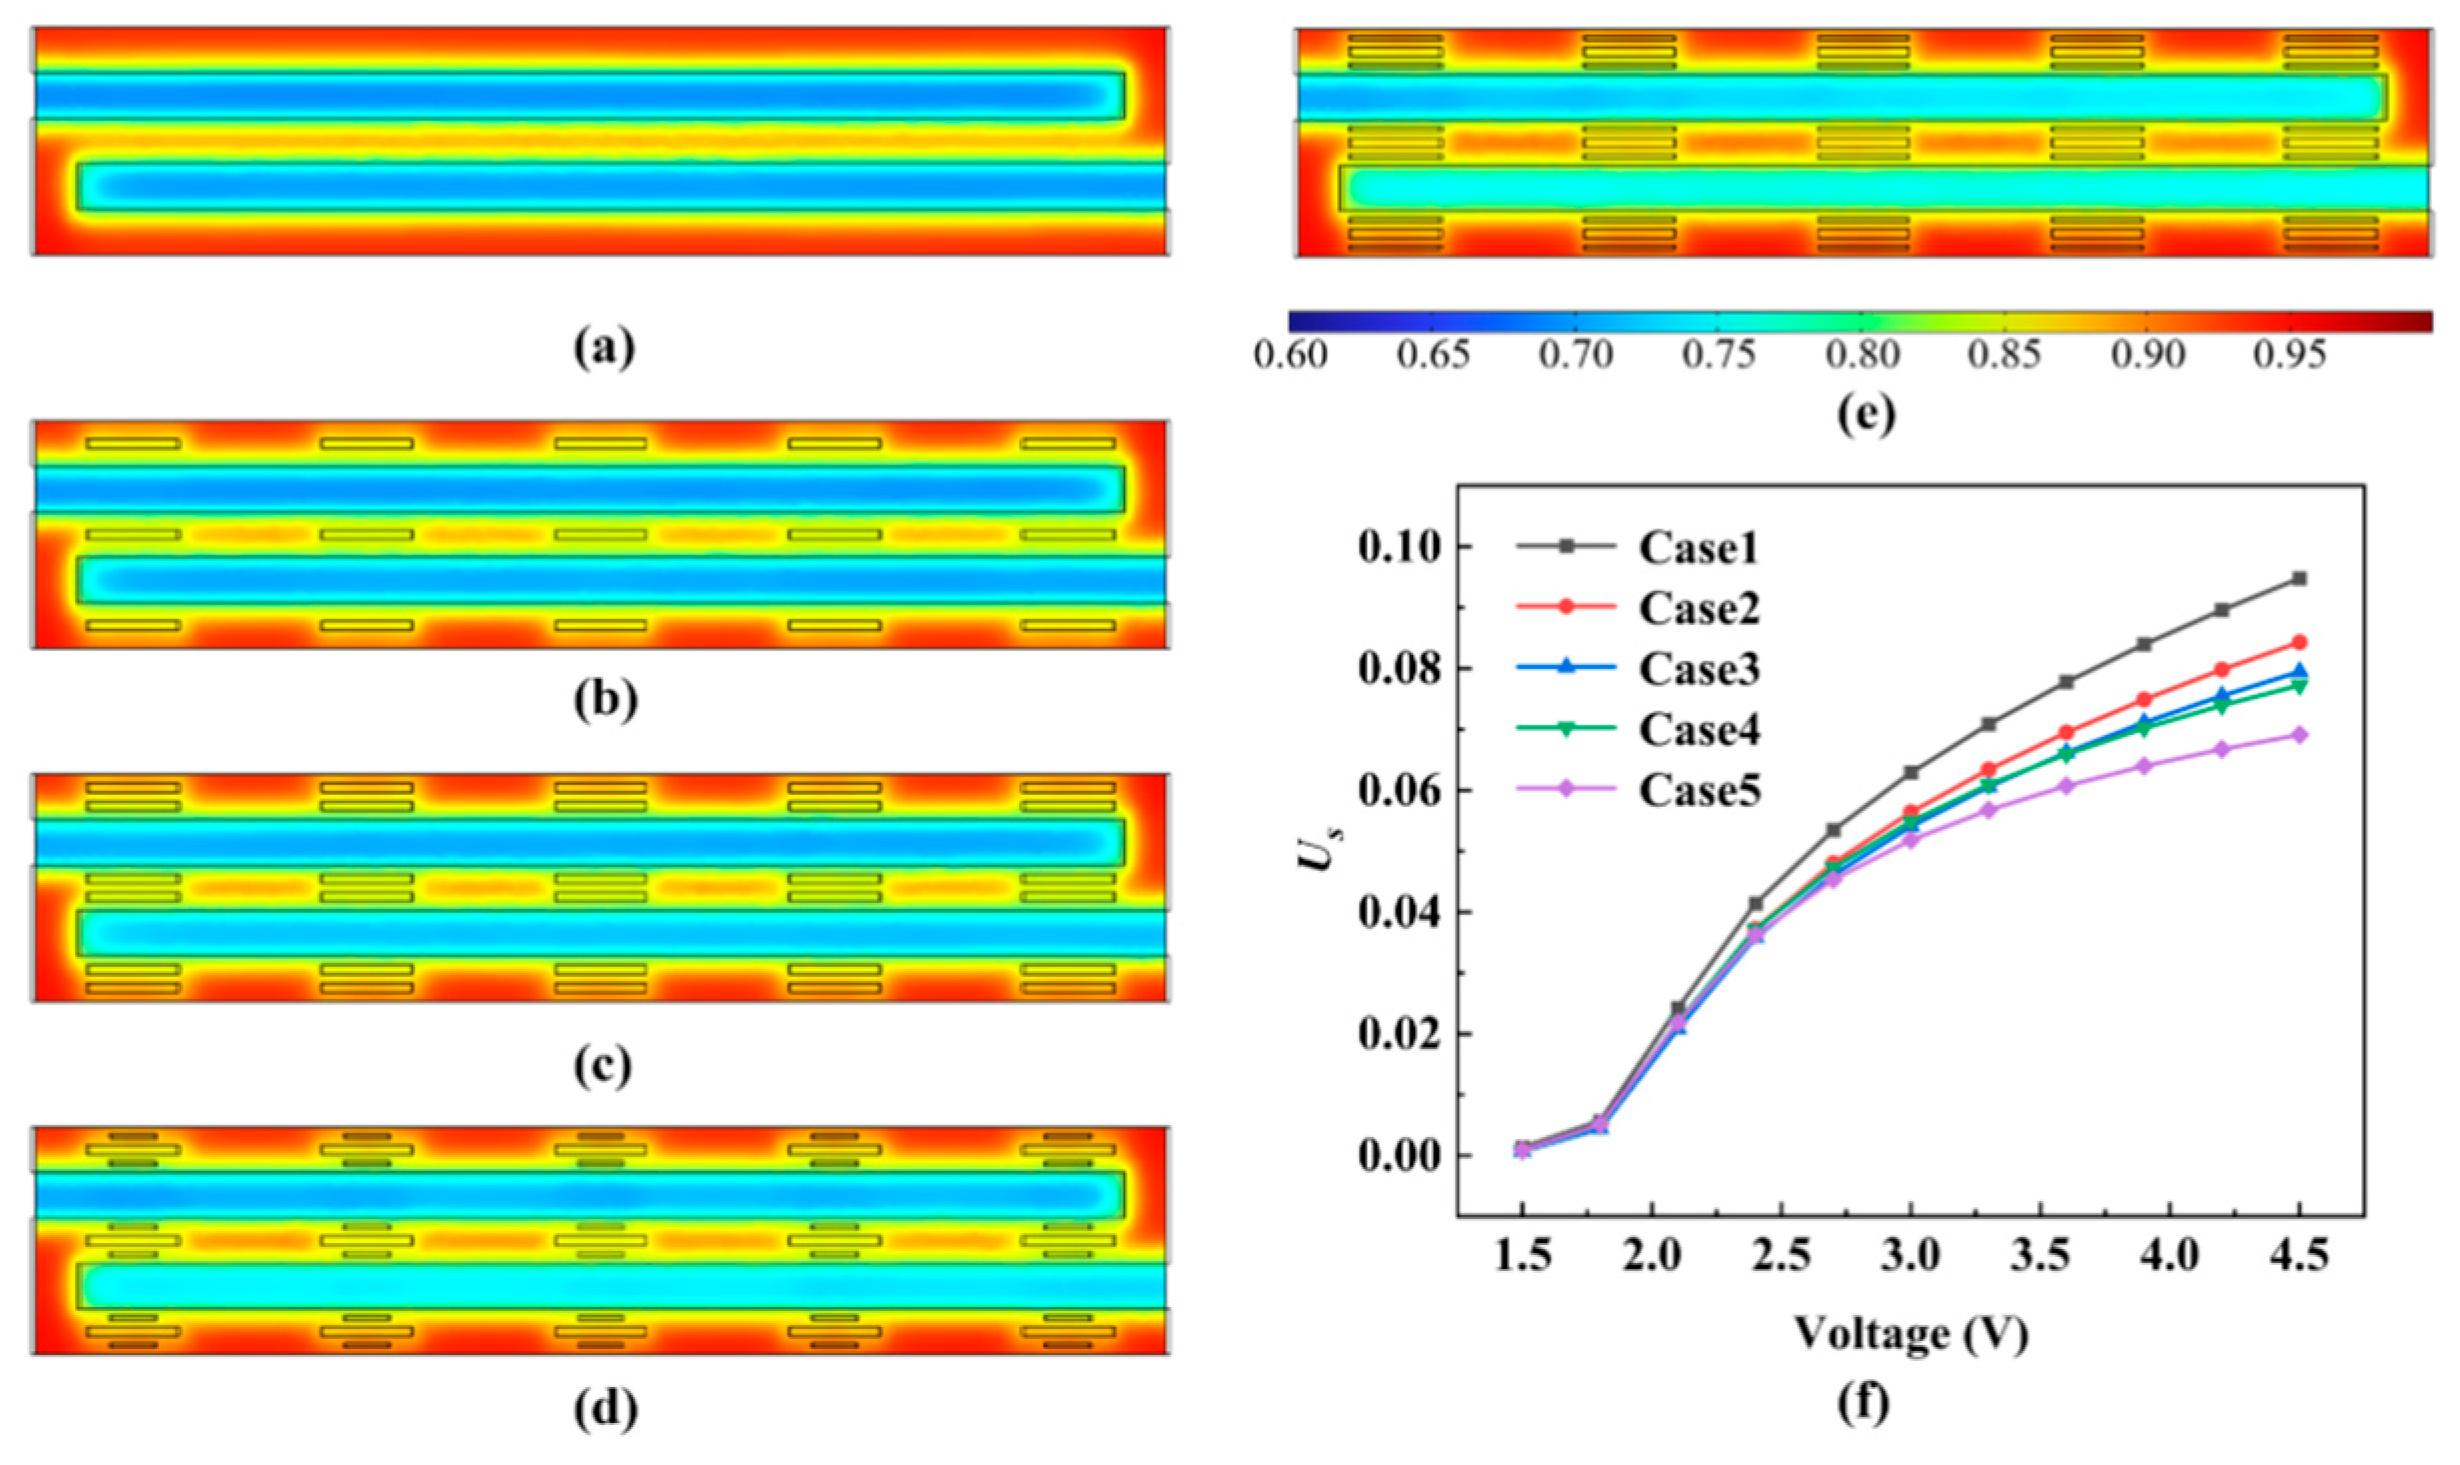
Figure 8a–e, the maximum liquid water saturation variations at the ACL-PEM interface for Cases 1 to 5 are 0.264, 0.253, 0.258, 0.259, and 0.258, respectively. Among them, Case 1 exhibits the most pronounced variation, while Case 3 shows the smallest. This observation can be explained by the improved mass transfer induced by the ribbed pillar structures, as well as the influence of pressure gradients between adjacent flow field regions.
Figure 8f further compares the trends in the uniformity index of liquid water saturation (
Us) under different voltages. At low voltages, the differences in
Us among Cases 2–5 are minor, yet all show better uniformity than Case 1, indicating that Case 1 exhibits the poorest liquid water distribution. With increasing current density, electrochemical reactions intensify, resulting in greater oxygen generation and increased mass transfer resistance, which further deteriorates the uniformity of liquid water saturation at the ACL-PEM interface. Under these conditions, the differences in
Us among the cases become more significant. For instance, at 4.5 V, the
Us value of Case 1 is 0.095, whereas those of Cases 2–5 are reduced by 11.4%, 16.6%, 18.9%, and 27.5%, respectively, compared with Case 1. These findings indicate that the incorporation of ribbed pillar structures effectively improves the uniformity of liquid water distribution within the PEMWE, especially under high-current-density conditions, where the optimization effect is more pronounced.
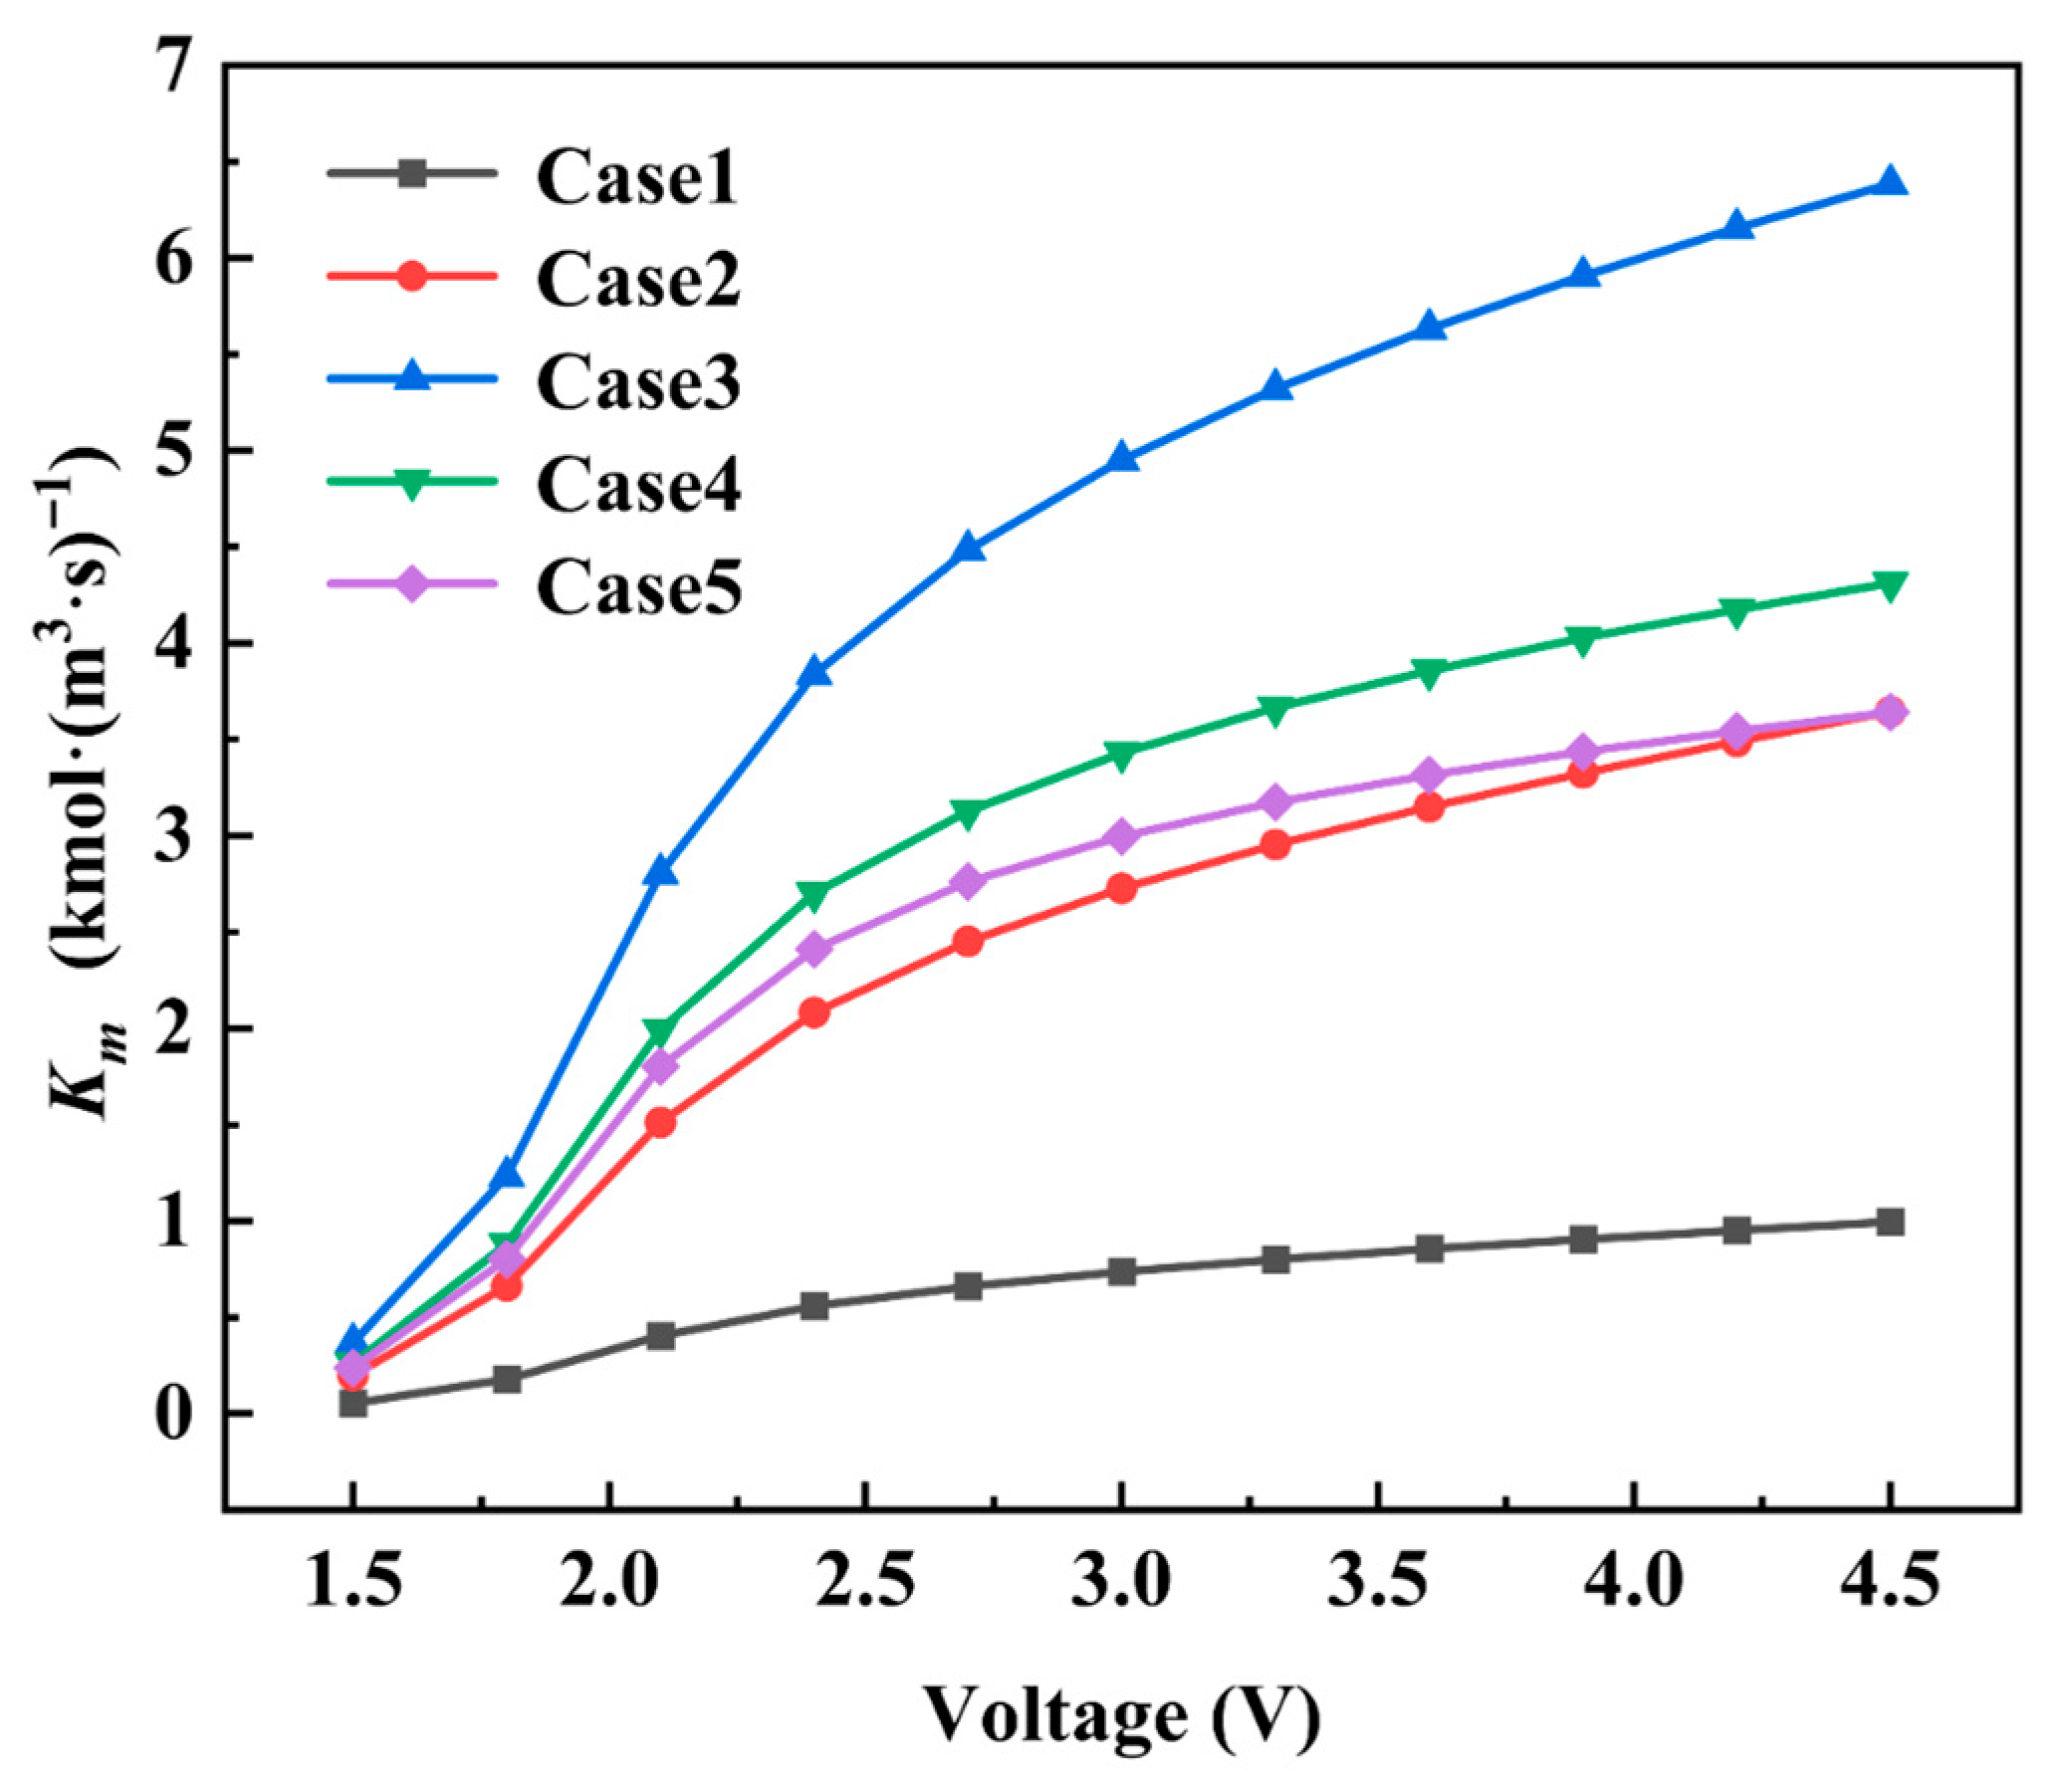
Figure 9 illustrates the distribution of the average normal mass transfer coefficient (
Km) within the APTL for Cases 1–5. The analysis reveals that Case 3 exhibits the maximum
Km values, while Case 1 maintains the minimal mass transfer efficiency under all operating conditions. This discrepancy primarily stems from the low normal fluid velocity in the conventional SFF of Case 1, where liquid water predominantly flows laterally across the diffusion layer surface. As a result, the transport of reactants into the diffusion layer relies heavily on diffusion rather than convection, thereby limiting mass transfer performance. Conversely, the ribbed pillar structures employed in Cases 2–5 significantly strengthen the normal velocity component of the fluid, thereby improving mass transfer efficiency. At an operating voltage of 4.5 V, all ribbed pillar configurations (Cases 2–5) exhibit similar enhancements in mass transfer. Specifically, the
Km value in Case 3 is 6.3 times that of Case 1. Cases 2, 4, and 5 also show significant improvements of 73.8%, 73.9% and 77.9%, respectively, compared with Case 1.
The above data clearly demonstrate that the incorporation of turbulence promoting structures effectively strengthens mass transport within the diffusion layer. This enhancement not only improves the delivery efficiency of reactants to the catalytic region but also facilitates the rapid removal of products, thereby significantly boosting the overall performance of the PEMWE.
3.2. Effect of Various Turbulence Promoter Designs on Heat Transfer Performance
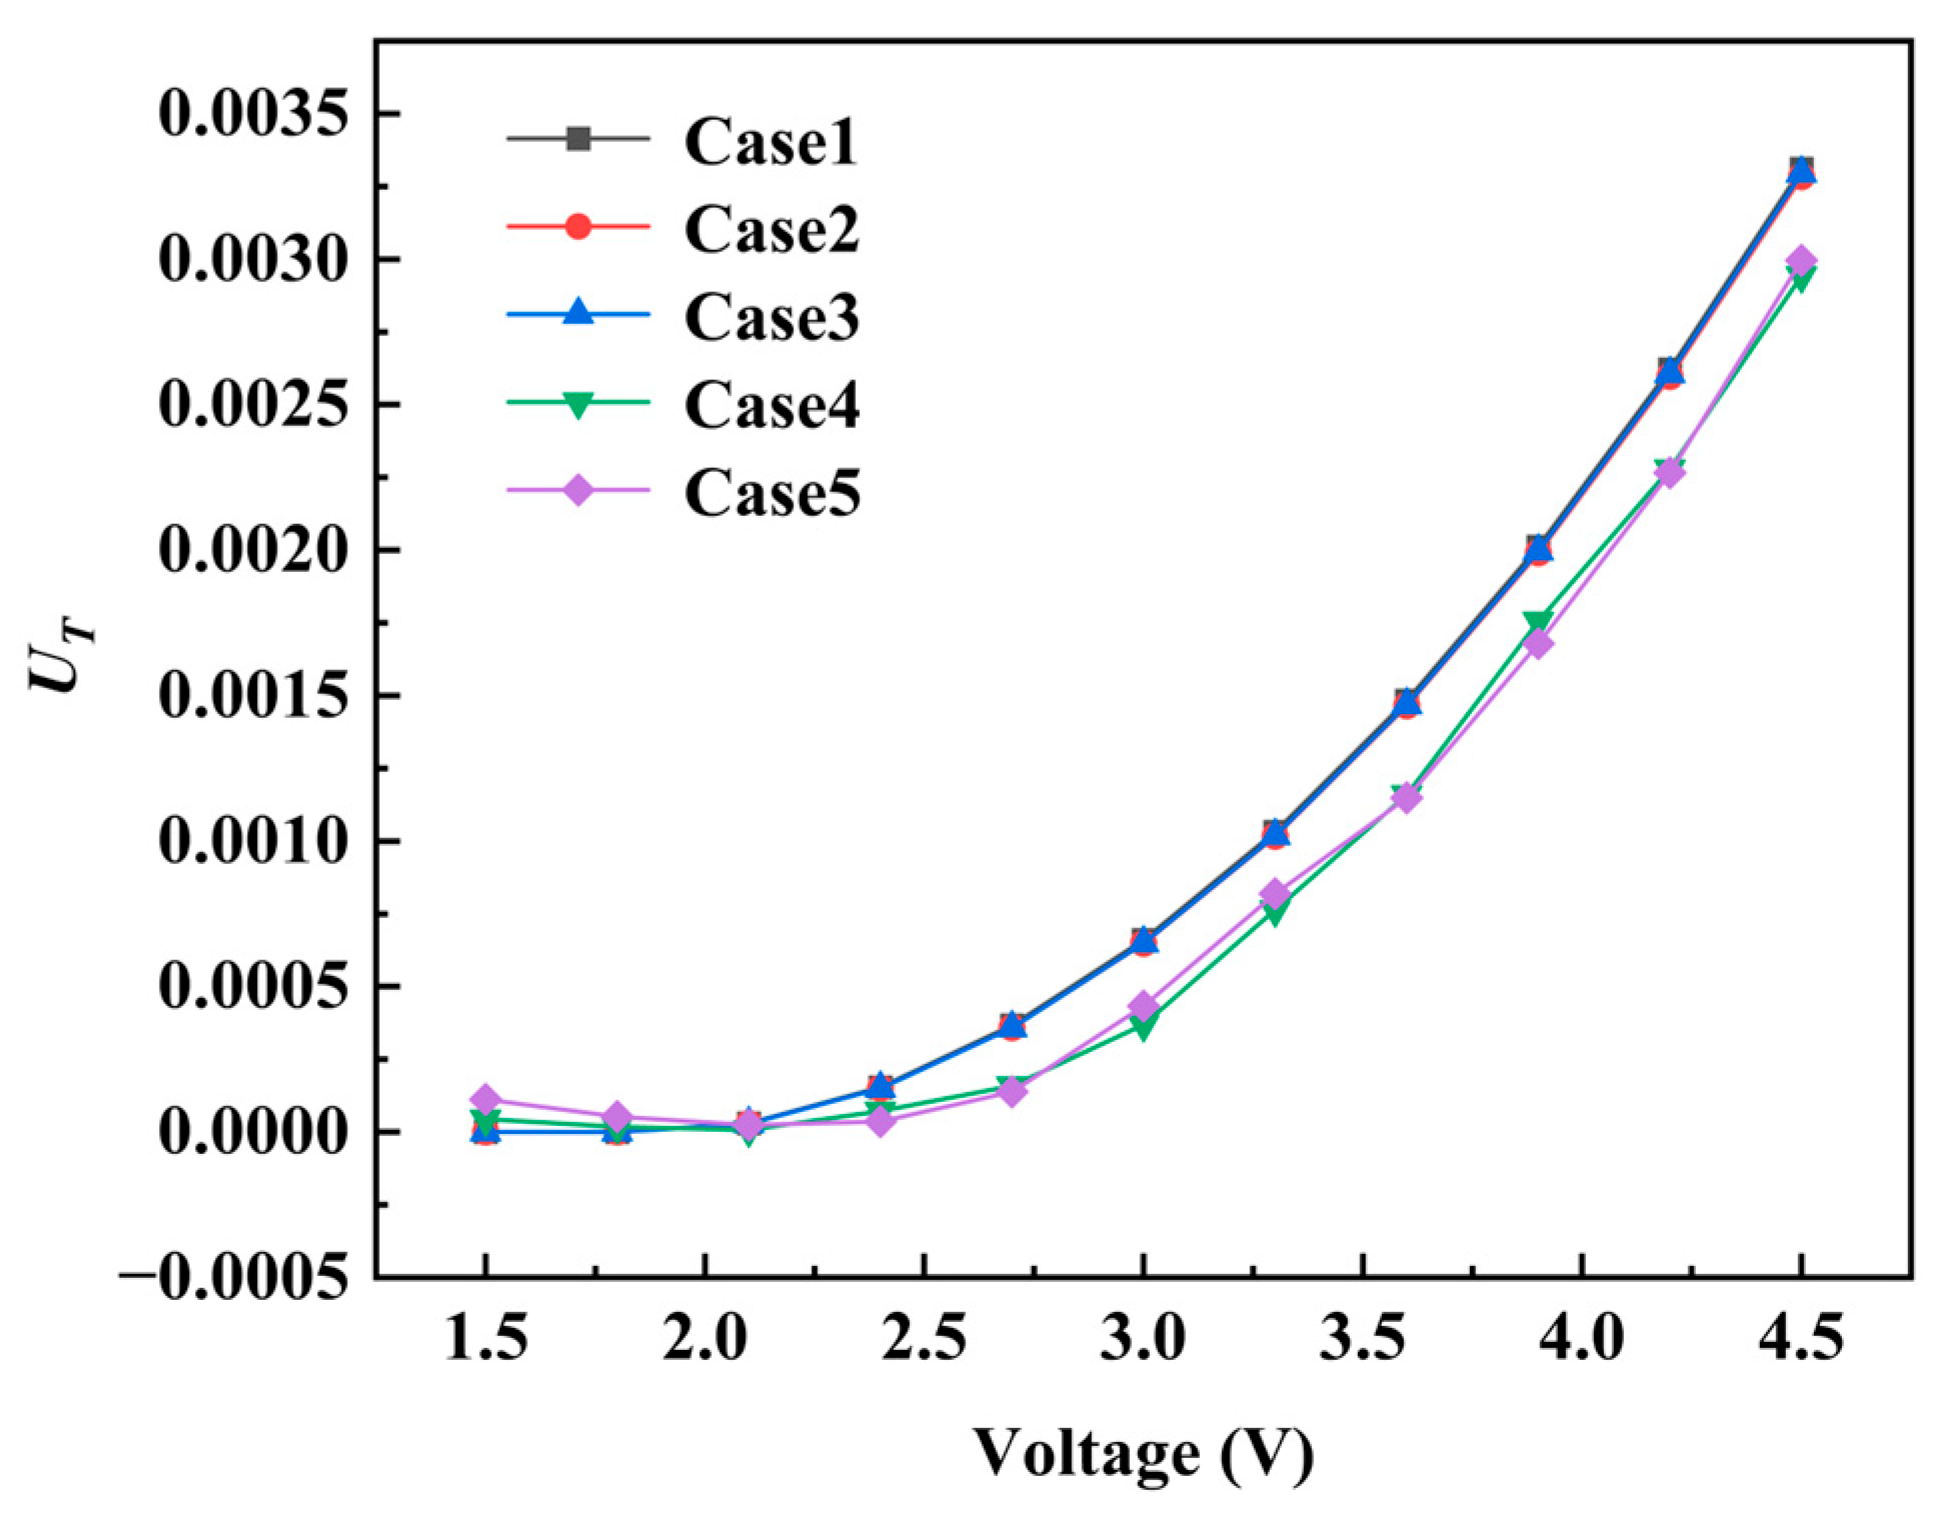
Figure 10 presents the temperature uniformity index (
UT) at the ACL-PEM interface for Cases 1–5 under different voltages. Cases 4 and 5 exhibit lower
UT values, indicating more uniform temperature distributions. At lower voltages, reduced ohmic heating and sufficient liquid water availability contribute to improved thermal uniformity. With increasing voltage, ohmic heating intensifies alongside reduced water content and elevated oxygen generation, leads to deteriorated heat transfer performance and thus higher
UT values. Case 1 exhibits the most pronounced deviation, primarily due to the inferior mass transport performance of the conventional SFF, which becomes increasingly evident at higher current densities. At 4.5 V, the
UT values are as follows: Case 1—0.003311, Case 2—0.003283, Case 3—0.003295, Case 4—0.002943, and Case 5—0.002997. Compared with Case 1, the
UT values of Cases 2–5 are reduced by 0.85%, 0.49%, 12.5%, and 10.5%, respectively.
3.3. Influence of Flow Field Structures on Electrochemical Performance
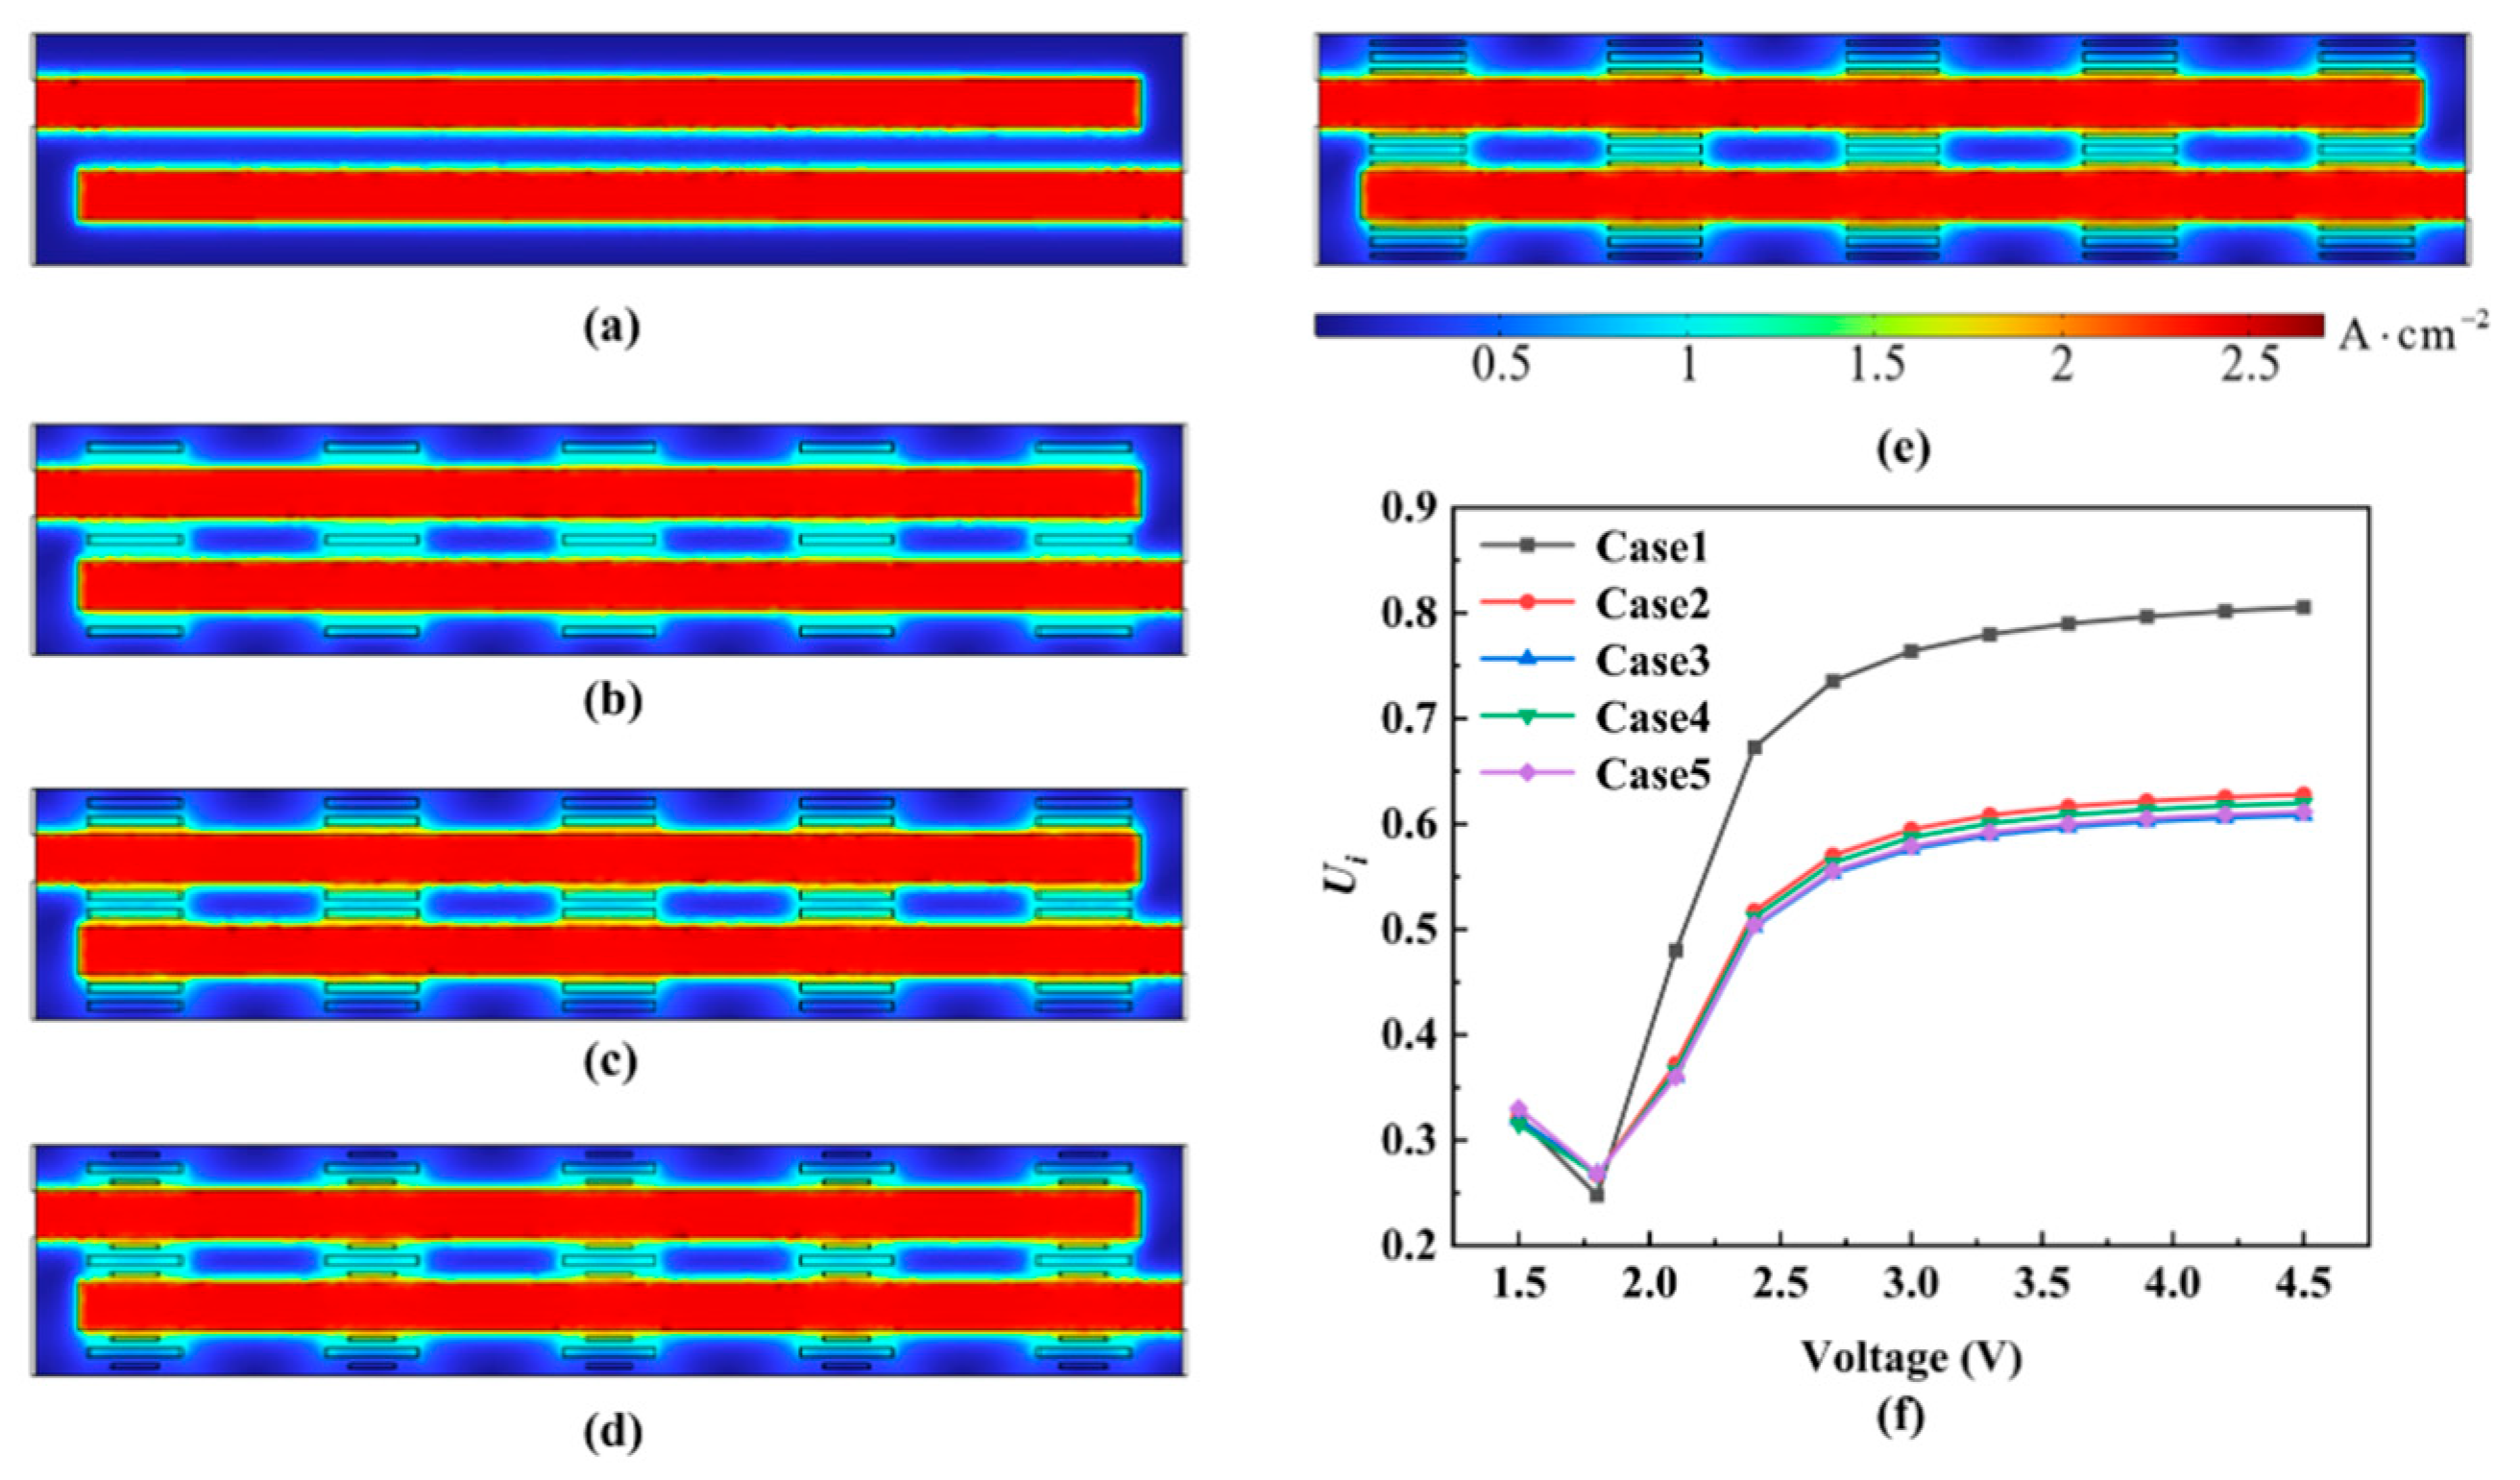
Figure 11a–e illustrates the current density distributions at the ACL-PEM interface under five different cases. A comparative analysis reveals that regions directly beneath the flow field ribs exhibit significantly higher local current densities. In the SFF (Case 1), this distribution shows clear periodic fluctuations along the flow direction. Two primary mechanisms account for this phenomenon: First, the direct contact between the ribs and the porous electrode forms efficient pathways for electron conduction. Electrons provided by the external circuit are readily transmitted through these contact regions, facilitating enhanced electrochemical reactions at these sites, and resulting in higher local current densities due to superior electronic conductivity. Second, the rib structures promote improved transport of reactants toward the PTL and CL, leading to elevated liquid water saturation within the CL. This, in turn, enhances the electrochemical reaction activity due to better hydration. This mechanism also explains why Case 1 shows a significantly lower minimum current density (0.0124 A·cm
−2) compared with Cases 2–5 (0.029, 0.0334, 0.0298, and 0.0331 A·cm
−2, respectively).
Figure 11f further compares the uniformity index (
Ui) of the current density distribution at the ACL-PEM interface under various cases and operating voltages. At 4.5 V, the
Ui values for Cases 2–5 are reduced by 36.7%, 40.8%, 37.9% and 40.6%, respectively, relative to Case 1. Among them, Case 3 exhibits the most uniform current distribution, followed closely by Case 5. This enhancement is mainly due to the improved mass transfer facilitated by the rectangular turbulence-promoting structures, which effectively mitigate water transport limitations. It is also observed that at lower voltages, Cases 3 and 5 demonstrate significantly better current density uniformity than other configurations. However, as the voltage increases, the differences among cases gradually diminish, which can be ascribed to the dominant role of electron conduction under high current densities, mitigating the relative influence of mass transport on current distribution.
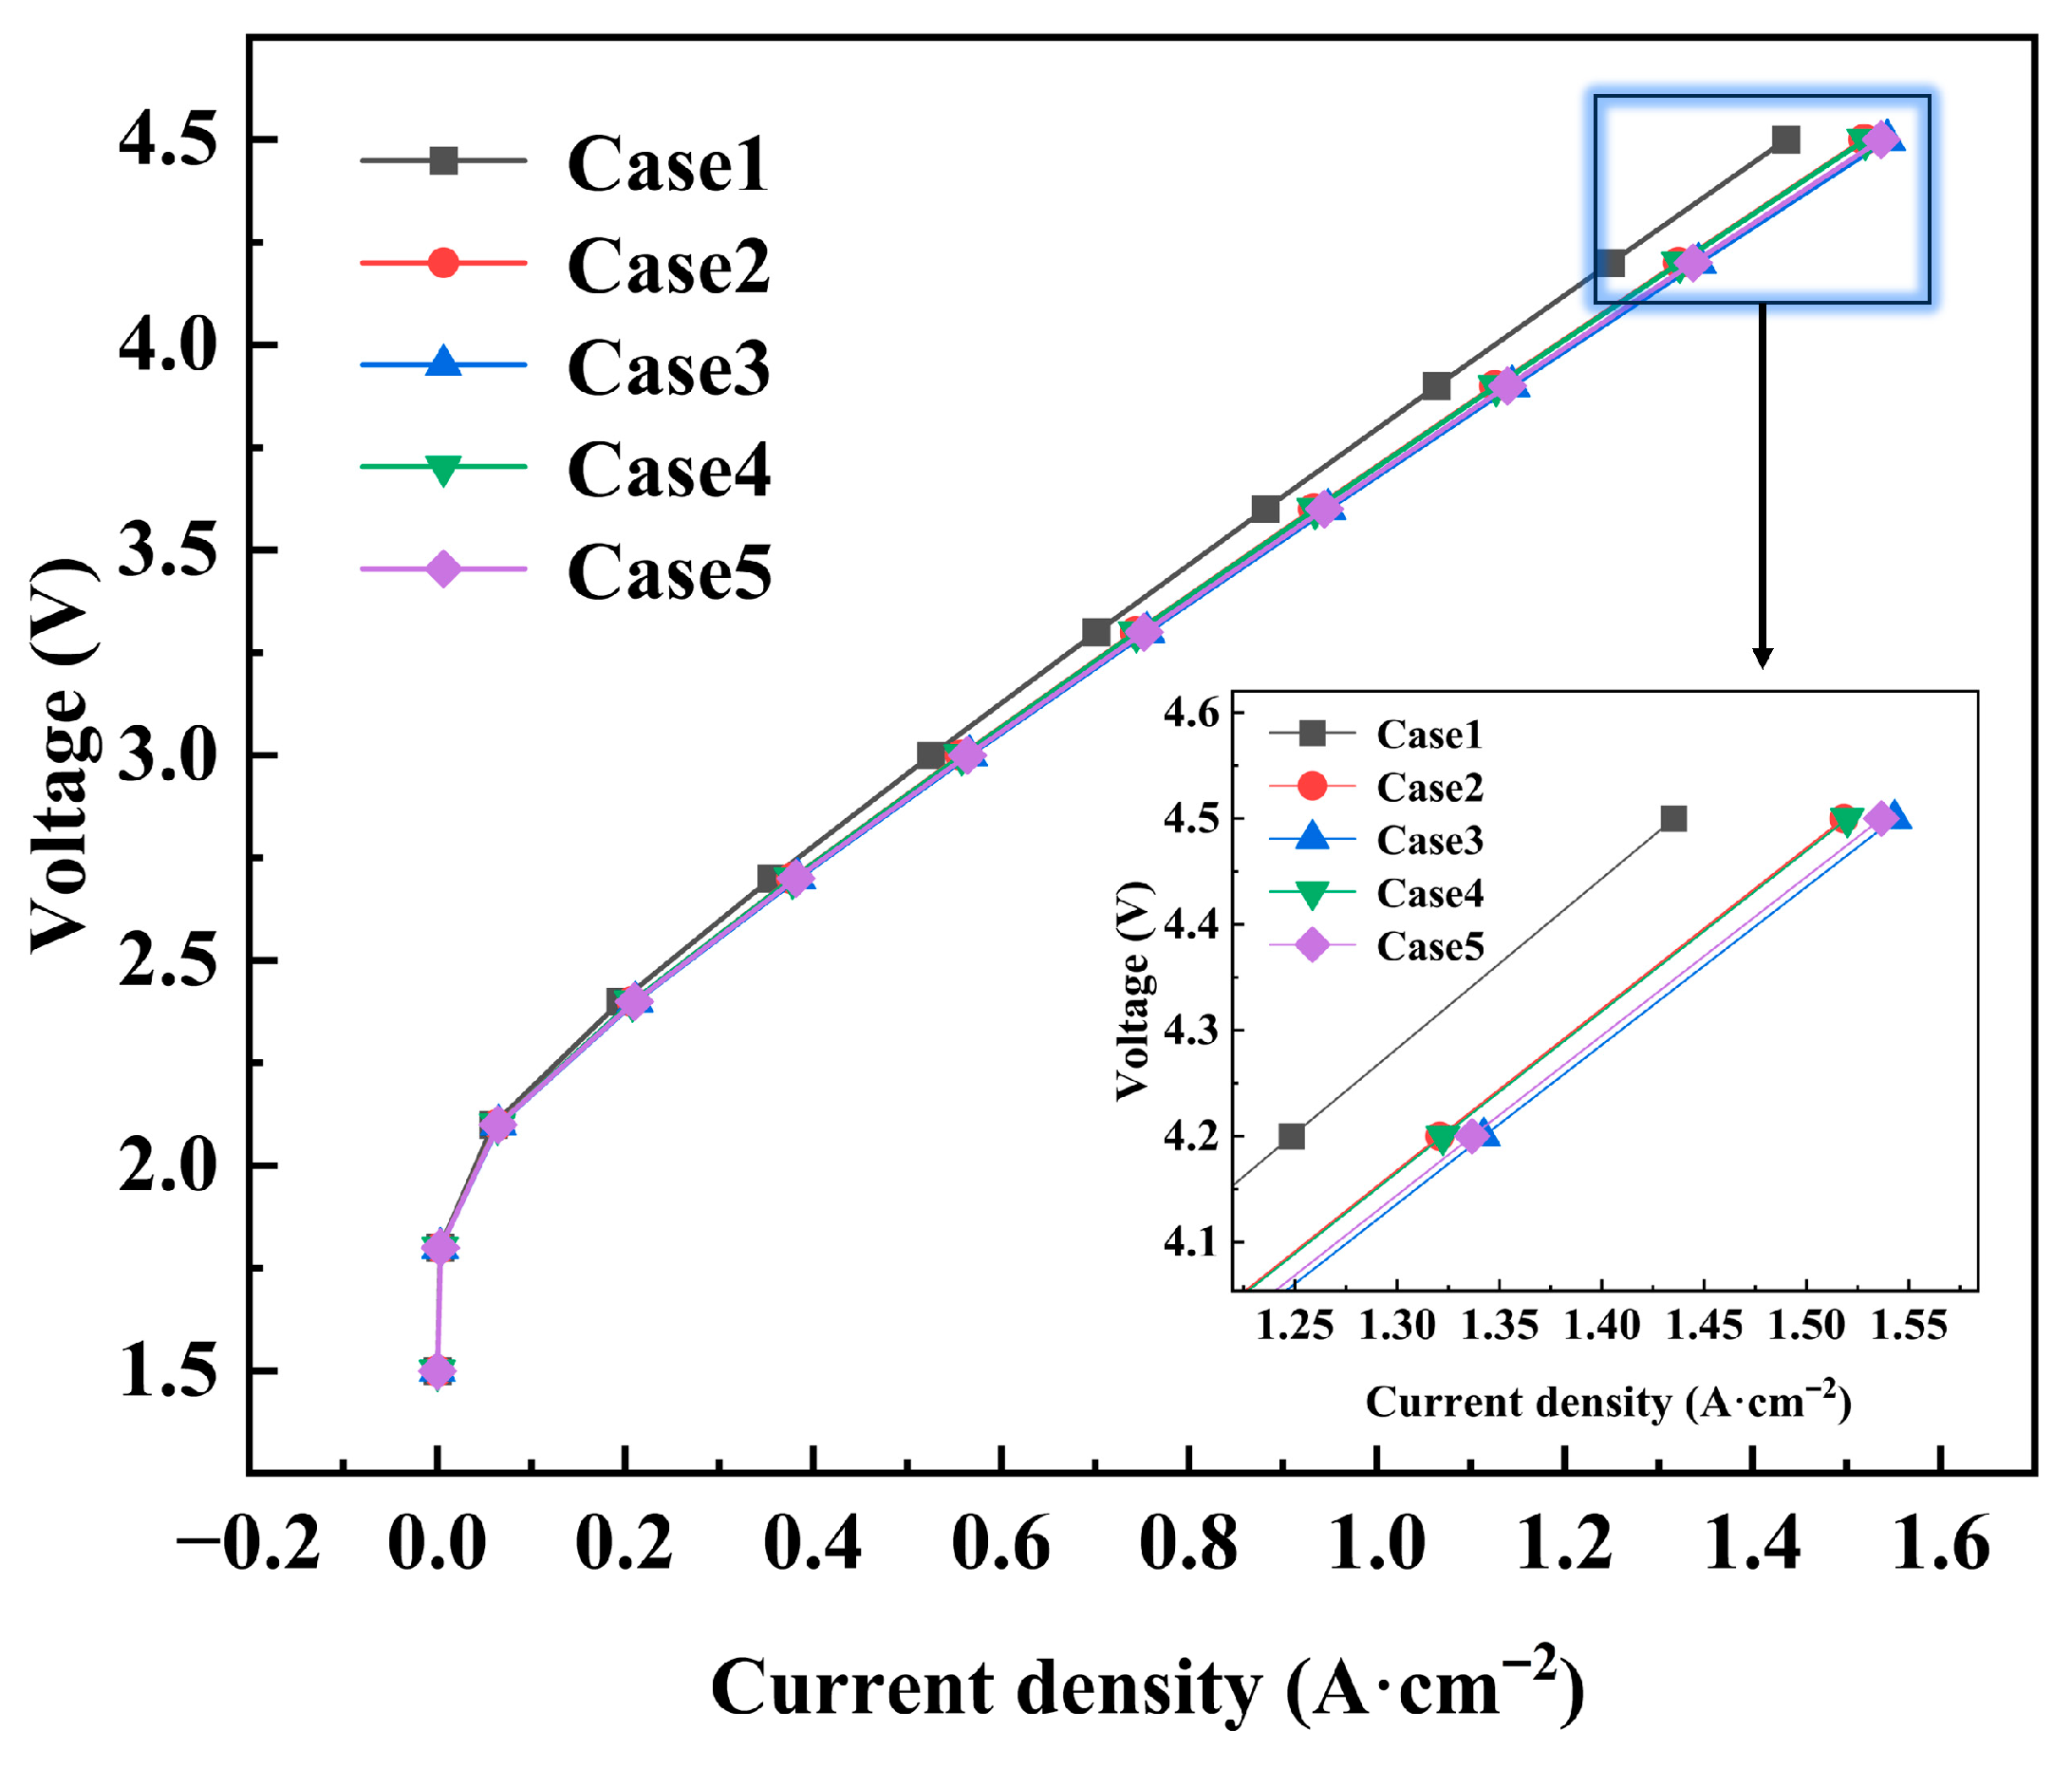
Figure 12 illustrates the influence of different flow field configurations on the polarization characteristics of the PEMWE. The results clearly demonstrate that flow field structure has a significant impact on electrolysis performance. Among the five cases, Case 3 demonstrates the optimal polarization characteristics, succeeded by Case 5, whereas Case 1 shows the poorest performance. This discrepancy is mainly due to the incorporation of ribbed turbulence-promoting structures. These features enhance the transport of liquid water toward the CL, thereby improving mass transfer conditions within the electrochemically active region. Quantitative analysis shows that at an operating voltage of 4.5 V, Case 3 achieves the highest current density, exceeding that of Case 1 by 0.108 A·cm
−2. Compared with Cases 2, 4, and 5, the current density of Case 3 is higher by 0.025, 0.023 and 0.007 A·cm
−2, respectively. This increase in current density directly corresponds to a reduction in reaction overpotential, indicating that the ribbed flow field structure effectively improves the energy conversion efficiency of the PEMWE. The degree of performance enhancement is closely related to the structural parameters of the flow field. Among the configurations studied, the turbulence-promoting block arrangement in Case 3 demonstrates the most favorable electrochemical performance.
The observed discrepancy between Case 3 and Case 1—where a 40.8% improvement in current-density uniformity corresponds to only a 6.98% enhancement in polarization performance—stems from the nonlinear coupling between distribution uniformity and integral cell losses. While enhanced uniformity improves local mass transfer and reduces activation overpotential, the overall polarization curve is dominated by ohmic and concentration losses under high-current-density conditions. The turbulence-promoting structures primarily mitigate bubble accumulation and improve liquid-water distribution, thereby raising the uniformity index. However, these modifications do not proportionally reduce the bulk ohmic resistance of the membrane or the diffusion limitations in the porous layers. Moreover, as current density increases, the voltage loss becomes increasingly governed by factors less sensitive to flow uniformity, such as proton conductivity and gas-phase transport resistance. Consequently, even a substantial gain in spatial uniformity yields a moderated impact on the overall voltage-current response, reflecting the multi-physics nature of PEMWE performance where distribution improvements are necessary but not sufficient for dramatic polarization shifts.
3.4. Performance Evaluation of the PEMWE with Different Turbulence Promoter Arrangements
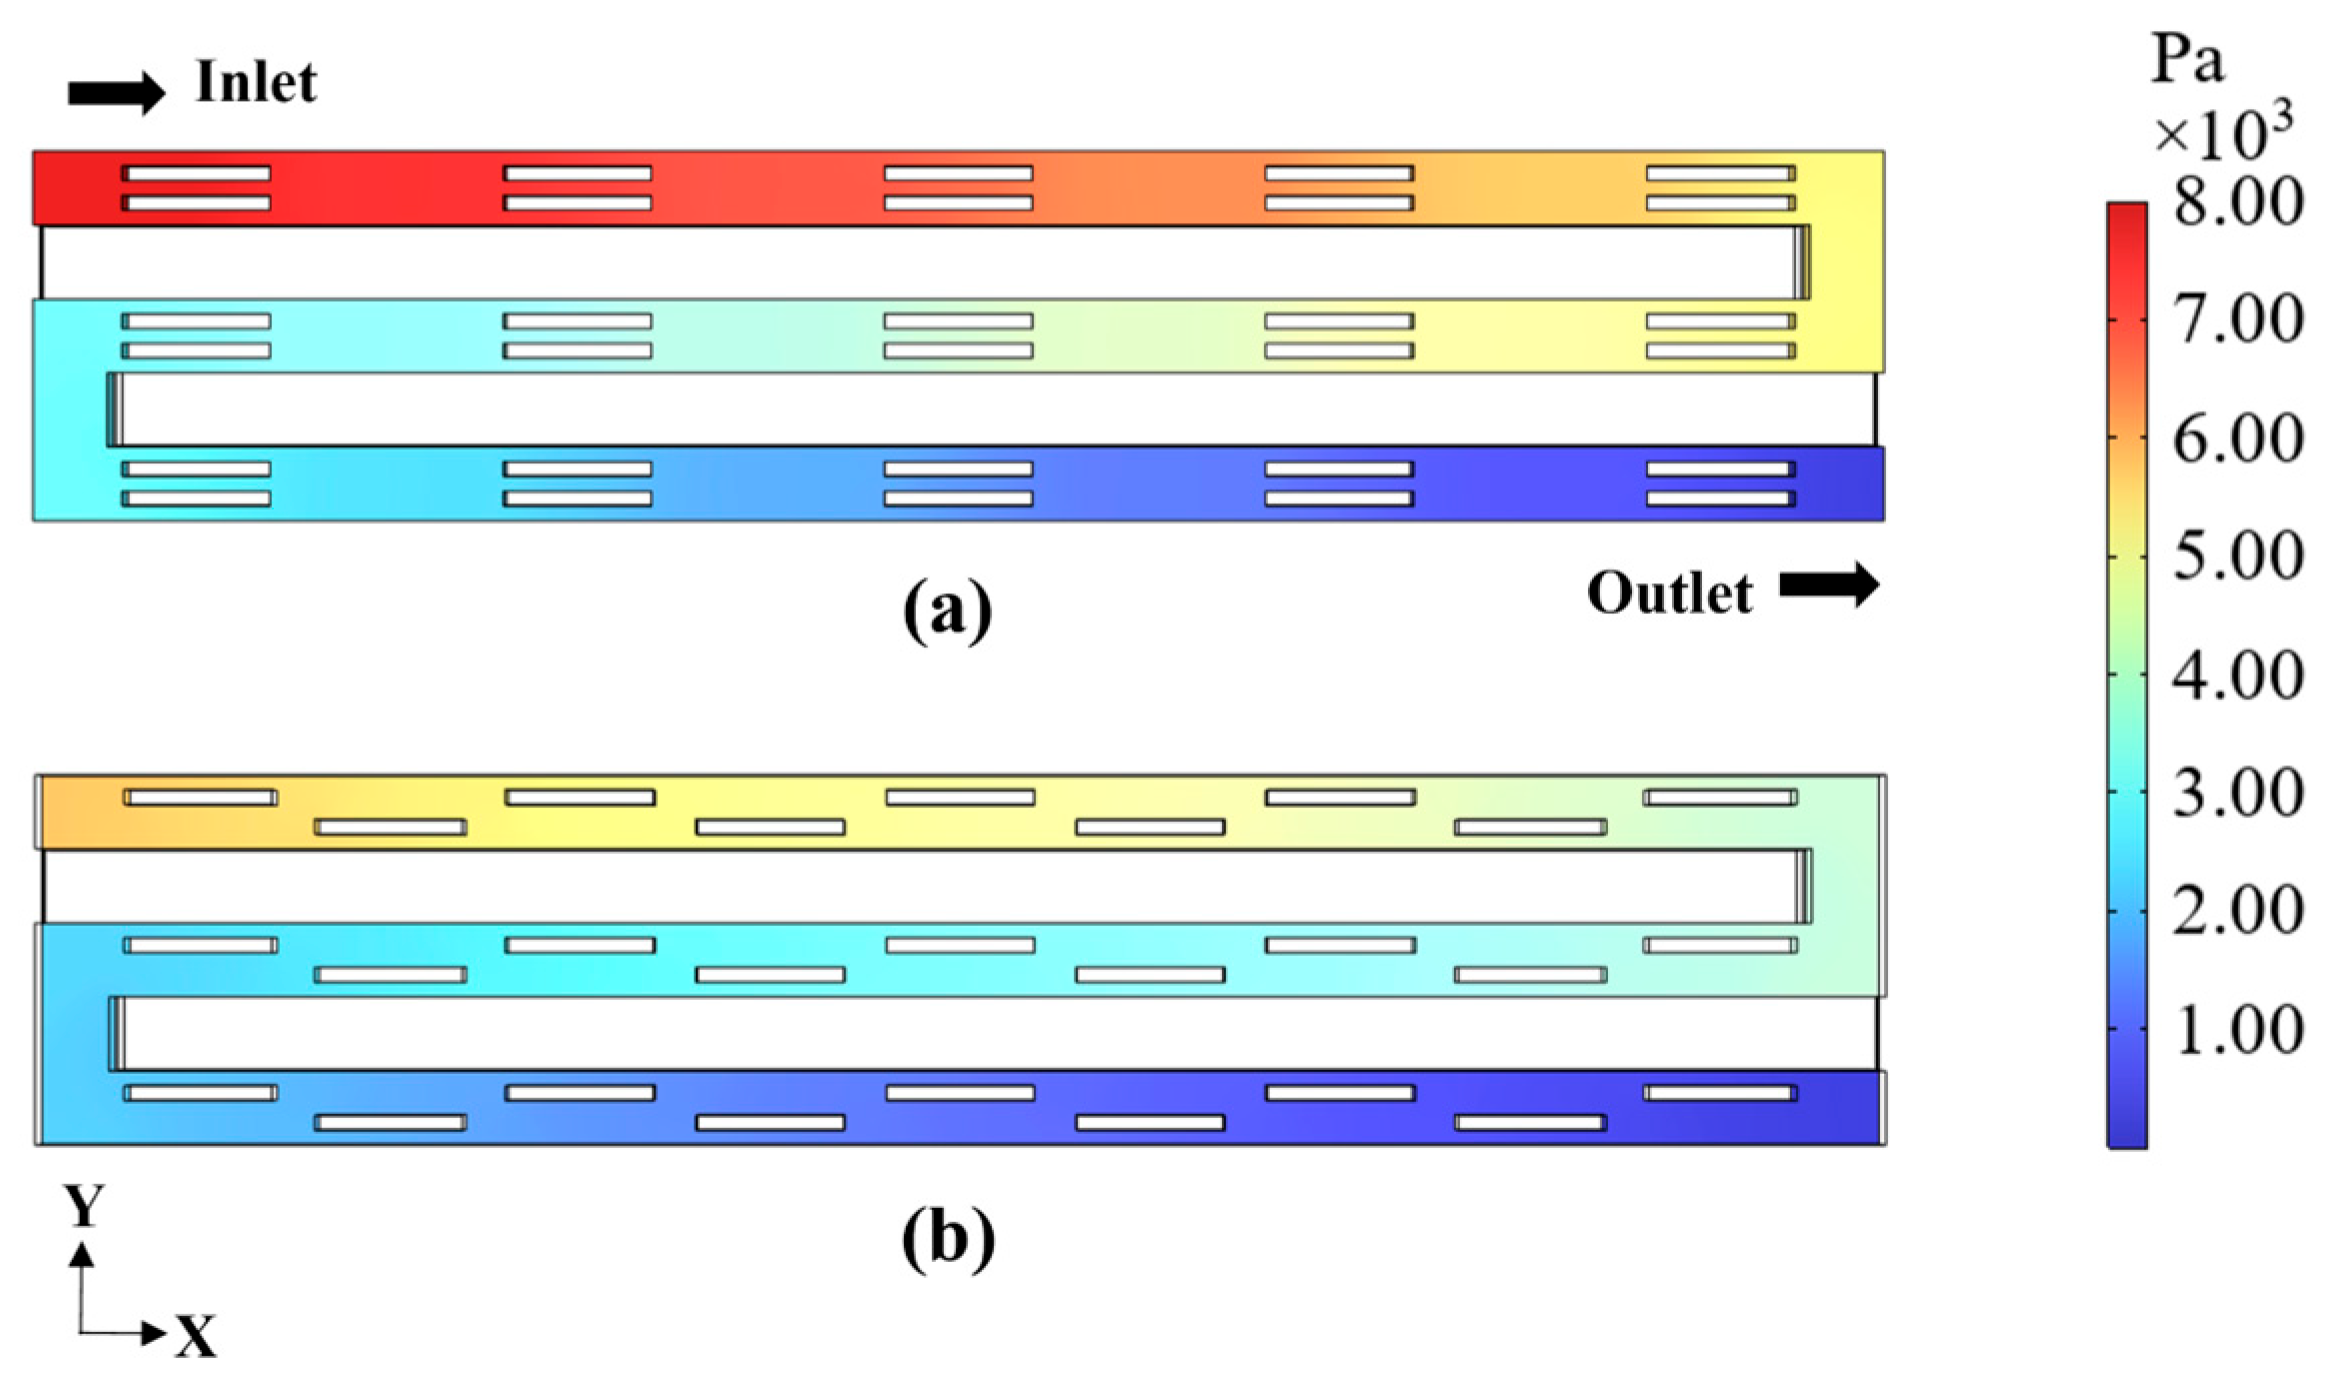
In the aforementioned analysis, Case 3 (DRB SFF) demonstrates clear advantages in improving water management, current density, and polarization performance. However, its relatively high pressure drop poses a concern, as it increases system energy consumption and may adversely affect the long-term operational stability and overall energy efficiency of the electrolysis. To address this issue, a novel flow field configuration featuring staggered turbulence-promoting ribs is proposed in this study. While maintaining sufficient turbulence effects, the staggered arrangement effectively reduces flow resistance and pressure drop. This design aims to retain favorable electrochemical performance while improving the overall operational efficiency and cost-effectiveness of the system.
Figure 13 compares the pressure distributions in the ACH-APTL interface with sequential and cross arrangements. The pressure drop in the aligned configuration is 8287.84 Pa, whereas the staggered configuration results in a reduced pressure drop of 5958.61 Pa, representing a decrease of 2319.23 Pa. In the sequential arrangement, the turbulence-promoting ribs are positioned in the same locations across successive flow field. As fluid passes through each row of ribs, it encounters repeated directional resistance, creating an effect akin to a linear barrier. This results in intensified flow detours, recirculation, and localized turbulence, which not only increases total pressure loss but also limits the effective flow area, leading to larger velocity gradients and higher shear stresses. In contrast, the cross arrangement interlaces the positions of the turbulence ribs, allowing the fluid to partially bypass the obstacles ahead. This generates smoother flow paths and relatively lower overall resistance. By offering more viable flow field, the staggered configuration helps distribute pressure more evenly and reduces the overall pressure drop.
The trade-off between performance gain and pressure penalty can be quantified by the ratio of current-density increase to pressure drop (Δi/ΔP). At 4.5 V, the cross-arranged design yields Δi/ΔP = 18.5 A·cm−2·kPa−1, which is higher than that of the aligned DRB SFF (13.0 A·cm−2·kPa−1). This indicates that the staggered arrangement not only improves mass transfer but also maintains a favorable energy-efficiency balance.
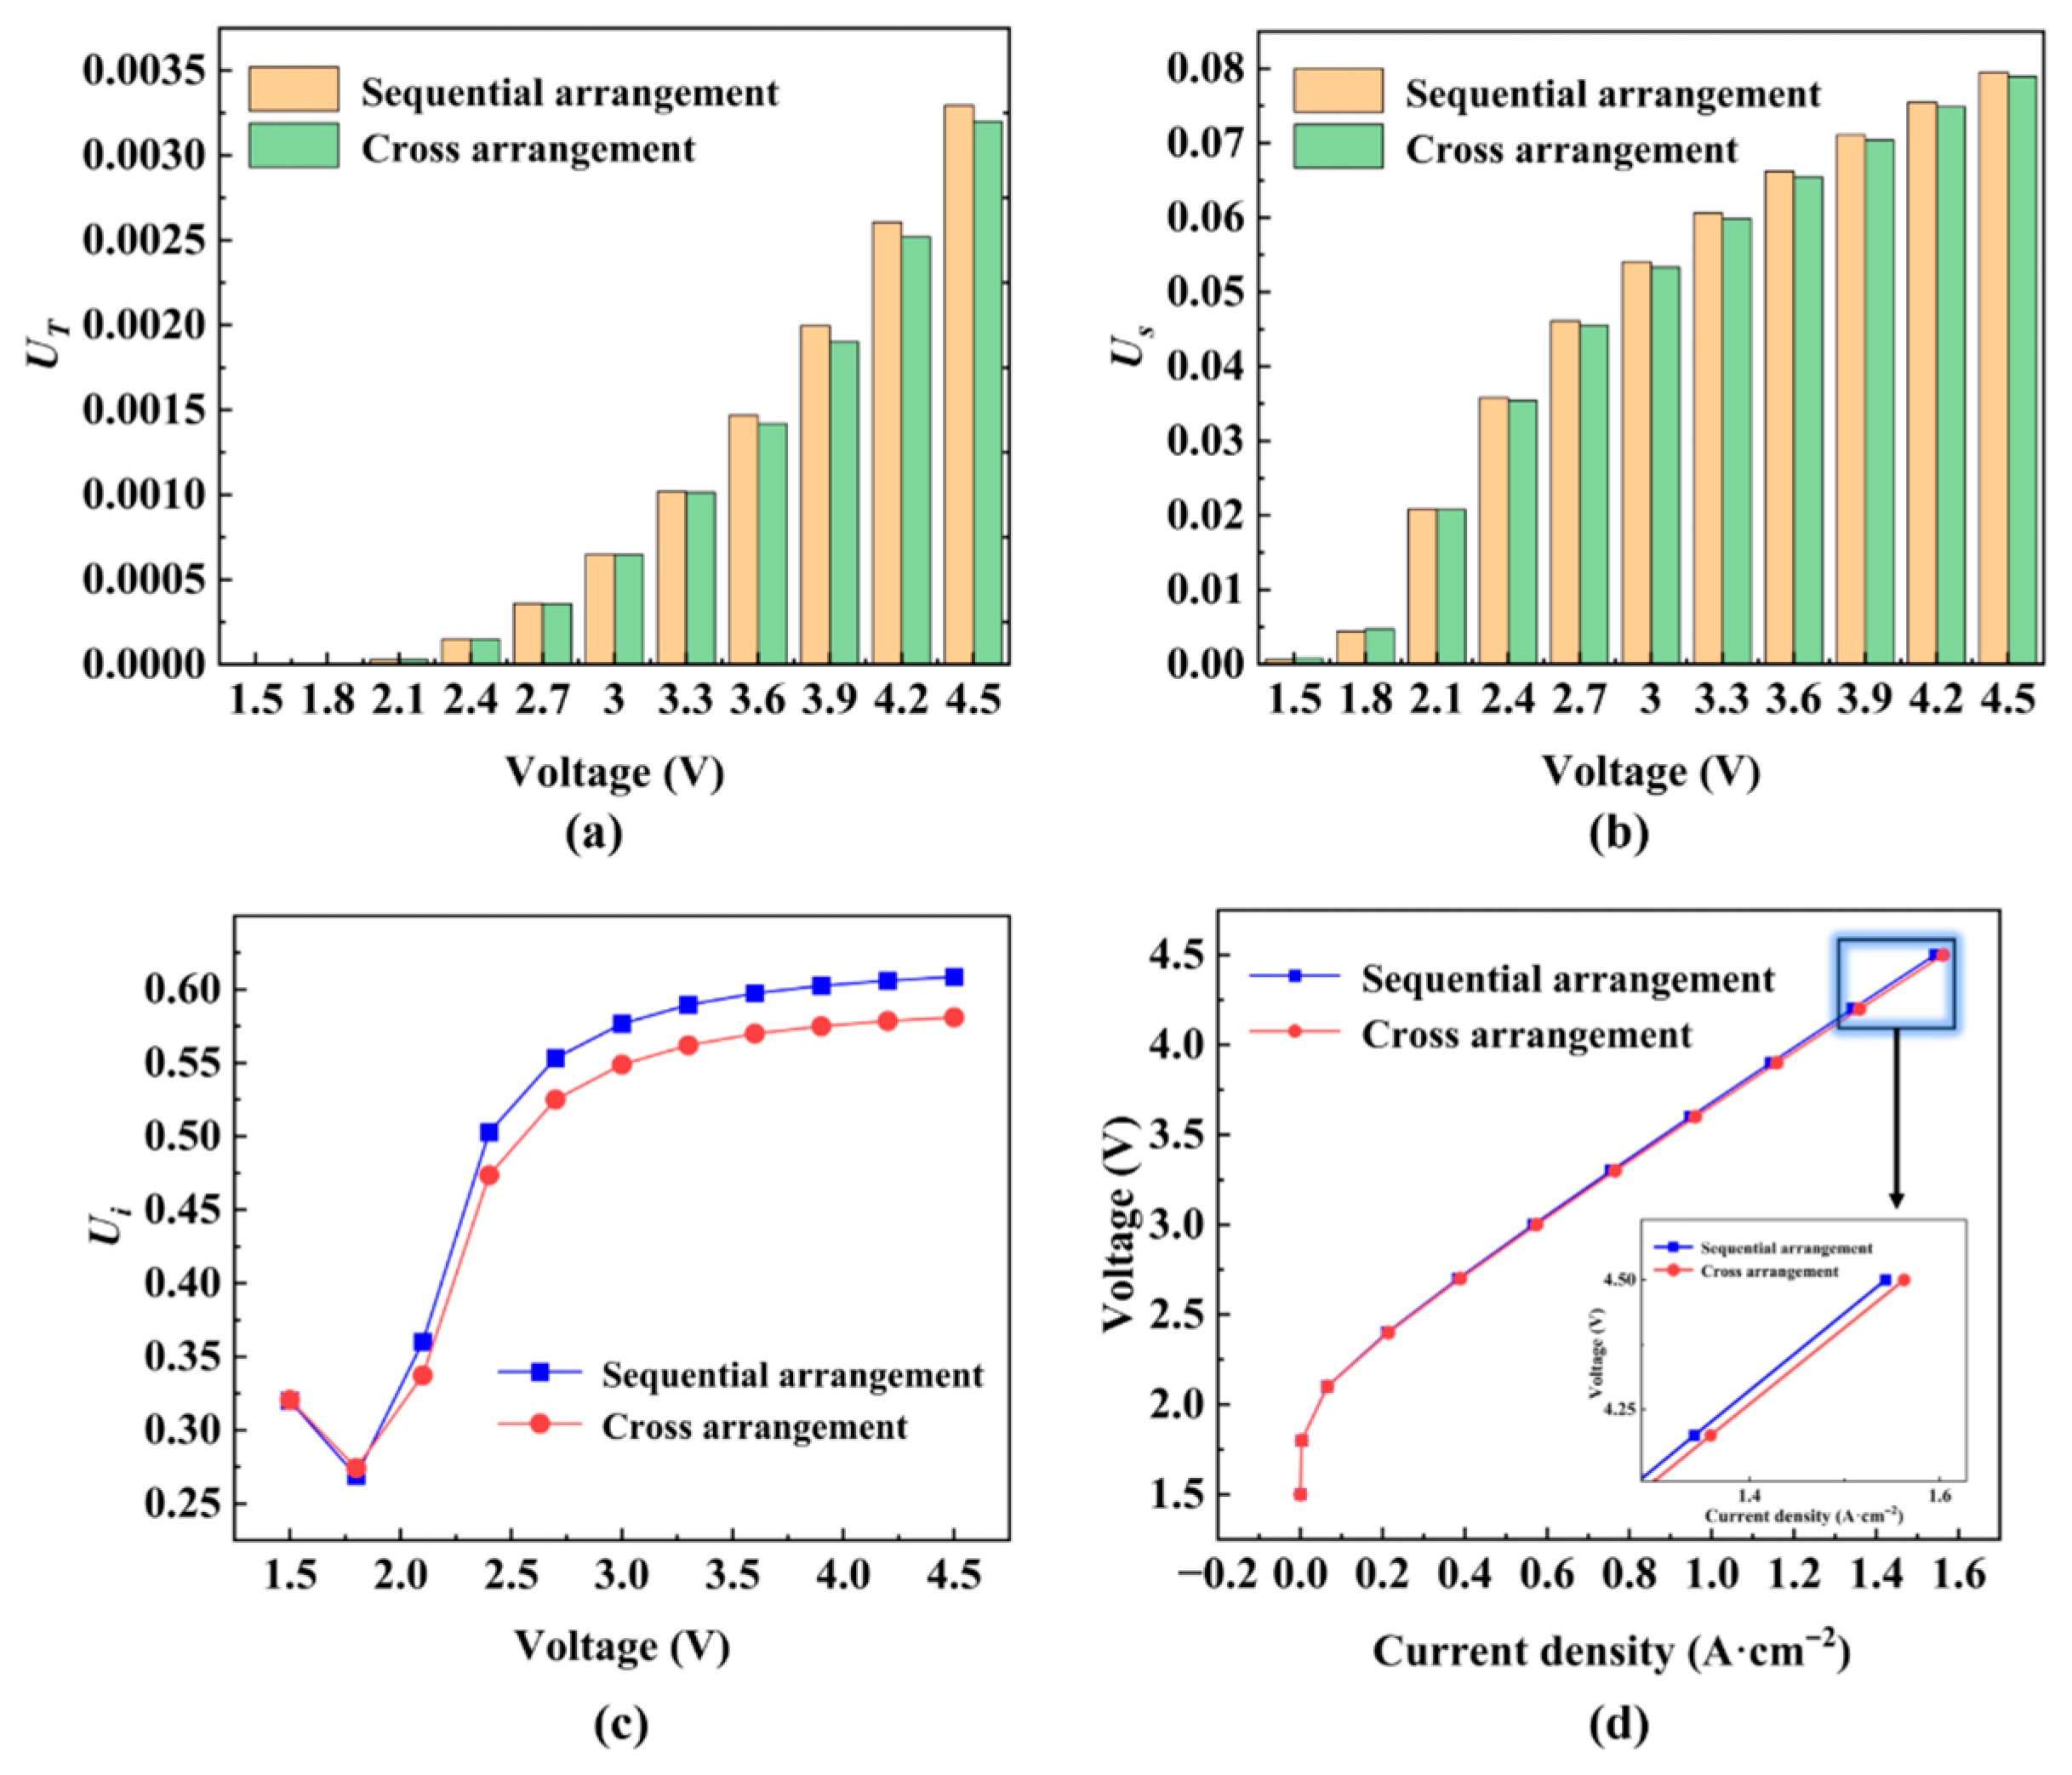
The effects of sequential and cross arrangements of rectangular turbulence-promoting ribs on the indices of temperature uniformity (
UT), water saturation uniformity (
Us), and current density uniformity (
Ui) are illustrated in
Figure 14a–c. Compared with the sequential arrangement, the cross arrangement exhibits lower values of
UT,
Us, and
Ui, with reductions of 2.89%, 0.69% and 4.54%, respectively. This improvement can be primarily attributed to the staggered layout’s ability to disrupt the flow field more effectively while avoiding localized fluid recirculation and dead zones that are commonly observed in aligned configurations. As a result, both the reactant gases and liquid water are more uniformly distributed within the flow field. By enhancing flow disturbance without excessively increasing the pressure drop, the staggered design improves mass transfer within the reaction zone, enhances heat dissipation, and promotes efficient oxygen evolution. These effects collectively contribute to more uniform spatial distributions of temperature, current density, and water content, thereby improving the overall stability and efficiency of the PEMWE operation.
As shown in
Figure 14d, although the difference in polarization performance between the sequential and cross arrangements is negligible under low-voltage conditions, at higher voltages, the cross arrangement exhibits a slightly higher current density—an improvement of 0.02 A·cm
−2 compared with the sequential arrangement. This enhancement is primarily attributed to the staggered design’s ability to optimize fluid flow paths, enabling the reactants to enter the catalytic reaction zones more uniformly while facilitating the efficient removal of generated gases. Consequently, the design reduces local gas accumulation and associated mass transfer resistance, thereby lowering the diffusion overpotential. The improved mass transport at the reaction interface enhances reactant utilization, resulting in superior electrochemical performance under high load operating conditions.
3.5. Experimental Performance Analysis of Flow Field with Cross-Arranged Rectangular Turbulence Promoters
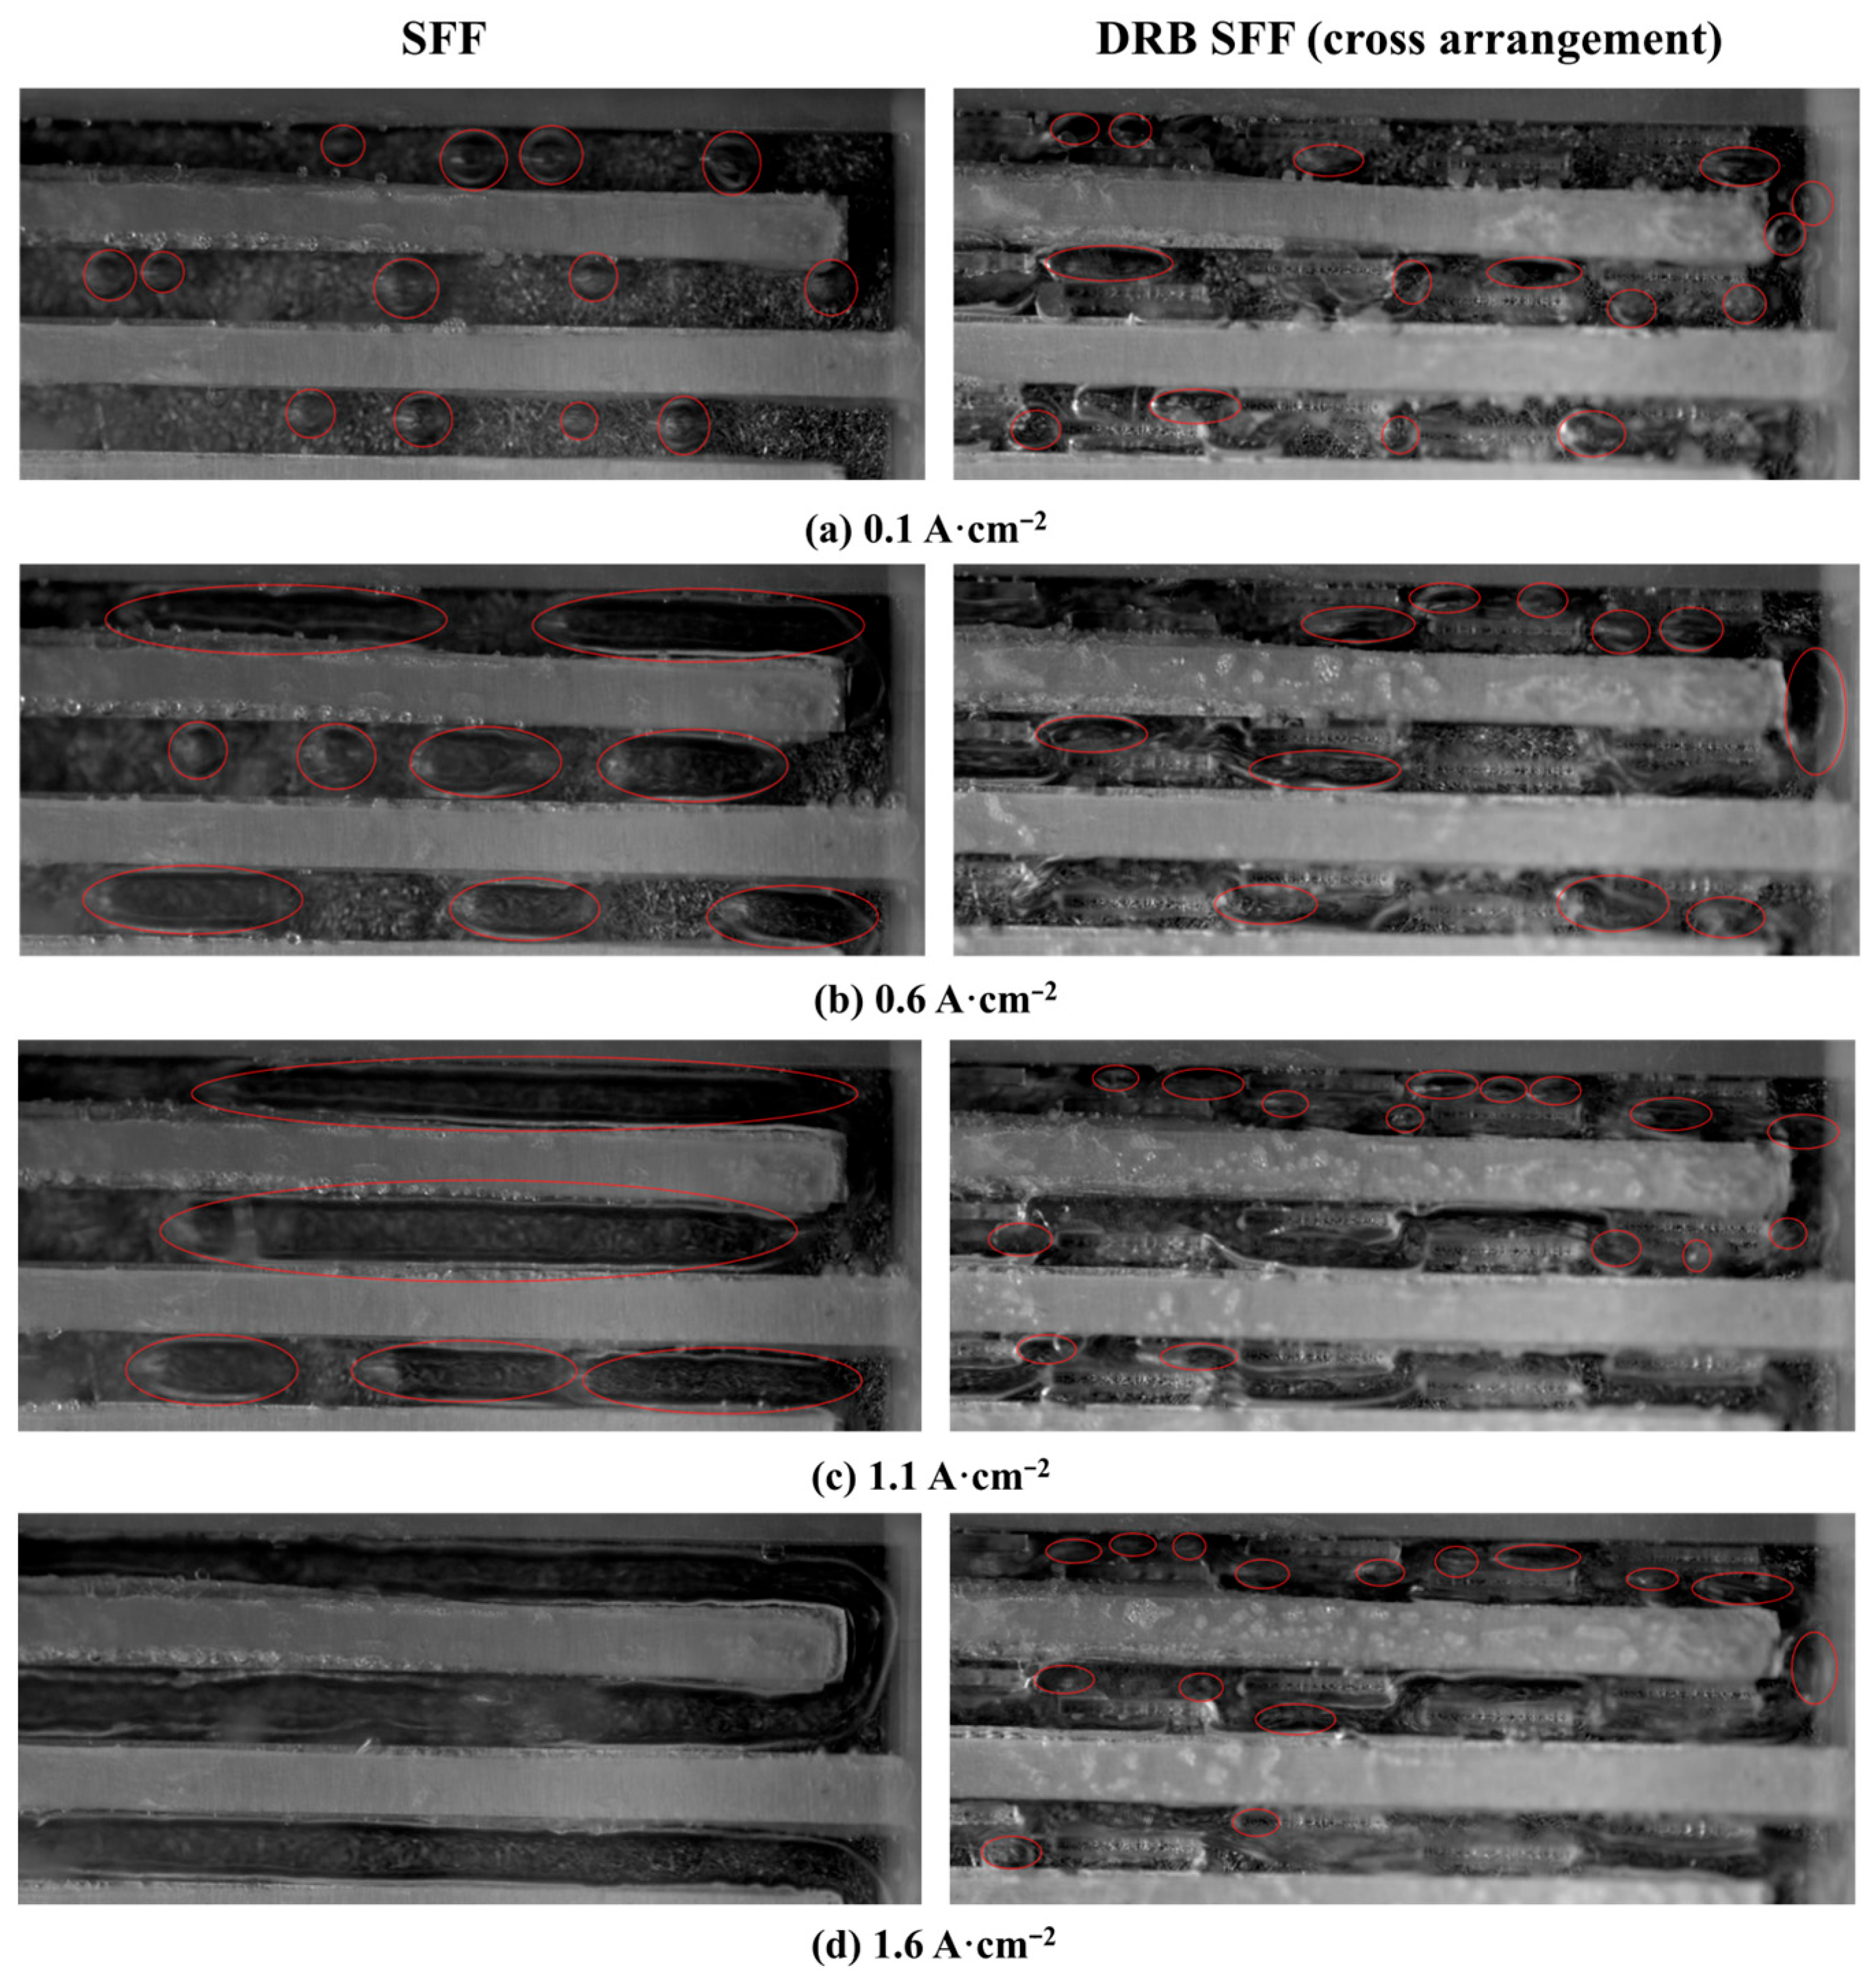
Figure 15 presents visualized images of two-phase flow patterns at the anode side in both conventional SFF and flow fields with cross-arranged rectangular turbulence promoters. The two-phase flow videos were recorded at different current densities. Representative frames were extracted for comparative analysis, with red areas in the images outlining oxygen bubble contours. Within the current density range of 0.1 to 1.6 A·cm
−2, the flow fields with cross-arranged rectangular turbulence promoters consistently demonstrate superior bubble fragmentation and dispersion effects. These are specifically manifested as reduced bubble diameters, a decrease in the number of annular flow bubbles, and the absence of obvious bubble accumulation zones on the electrode surface.
As shown in
Figure 15a, at a low current density of 0.1 A·cm
−2, the conventional SFF exhibits weak fluid inertia and shear forces. Under the dominance of surface tension, generated oxygen bubbles tend to coalesce and grow along the channel walls or corners, forming relatively large bubbles. In contrast, even at such low current densities, the geometric boundaries of the cross-arranged rectangular turbulence promoters in the modified flow field significantly contribute to mechanical splitting and disturbance of passing bubbles. When bubbles pass over the sharp edges of the promoters, they are forcibly stretched and cut, breaking into relatively uniform smaller bubbles. This prevents local accumulation and achieves preliminary flow field optimization even under low gas evolution rates.
As shown in
Figure 15b, at 0.6 A·cm
−2, the increased gas velocity in the conventional SFF accelerates both the generation frequency and movement speed of elongated gas slugs. Secondary flow effects induced at the bends become noticeable, exerting a pulling force on the tails of the gas slugs, which may cause them to break into medium-sized bubbles within the bends. In the flow field with cross-arranged rectangular turbulence promoters, bubbles are torn and fragmented by intense vortices, resulting in a further reduction in average bubble diameter and a narrower size distribution.
When the current density increases to 1.6 A·cm
−2, the gas evolution rate rises sharply. In the conventional SFF, this directly leads to intensified bubble coalescence and ultimately the formation of annular flow (left panel of
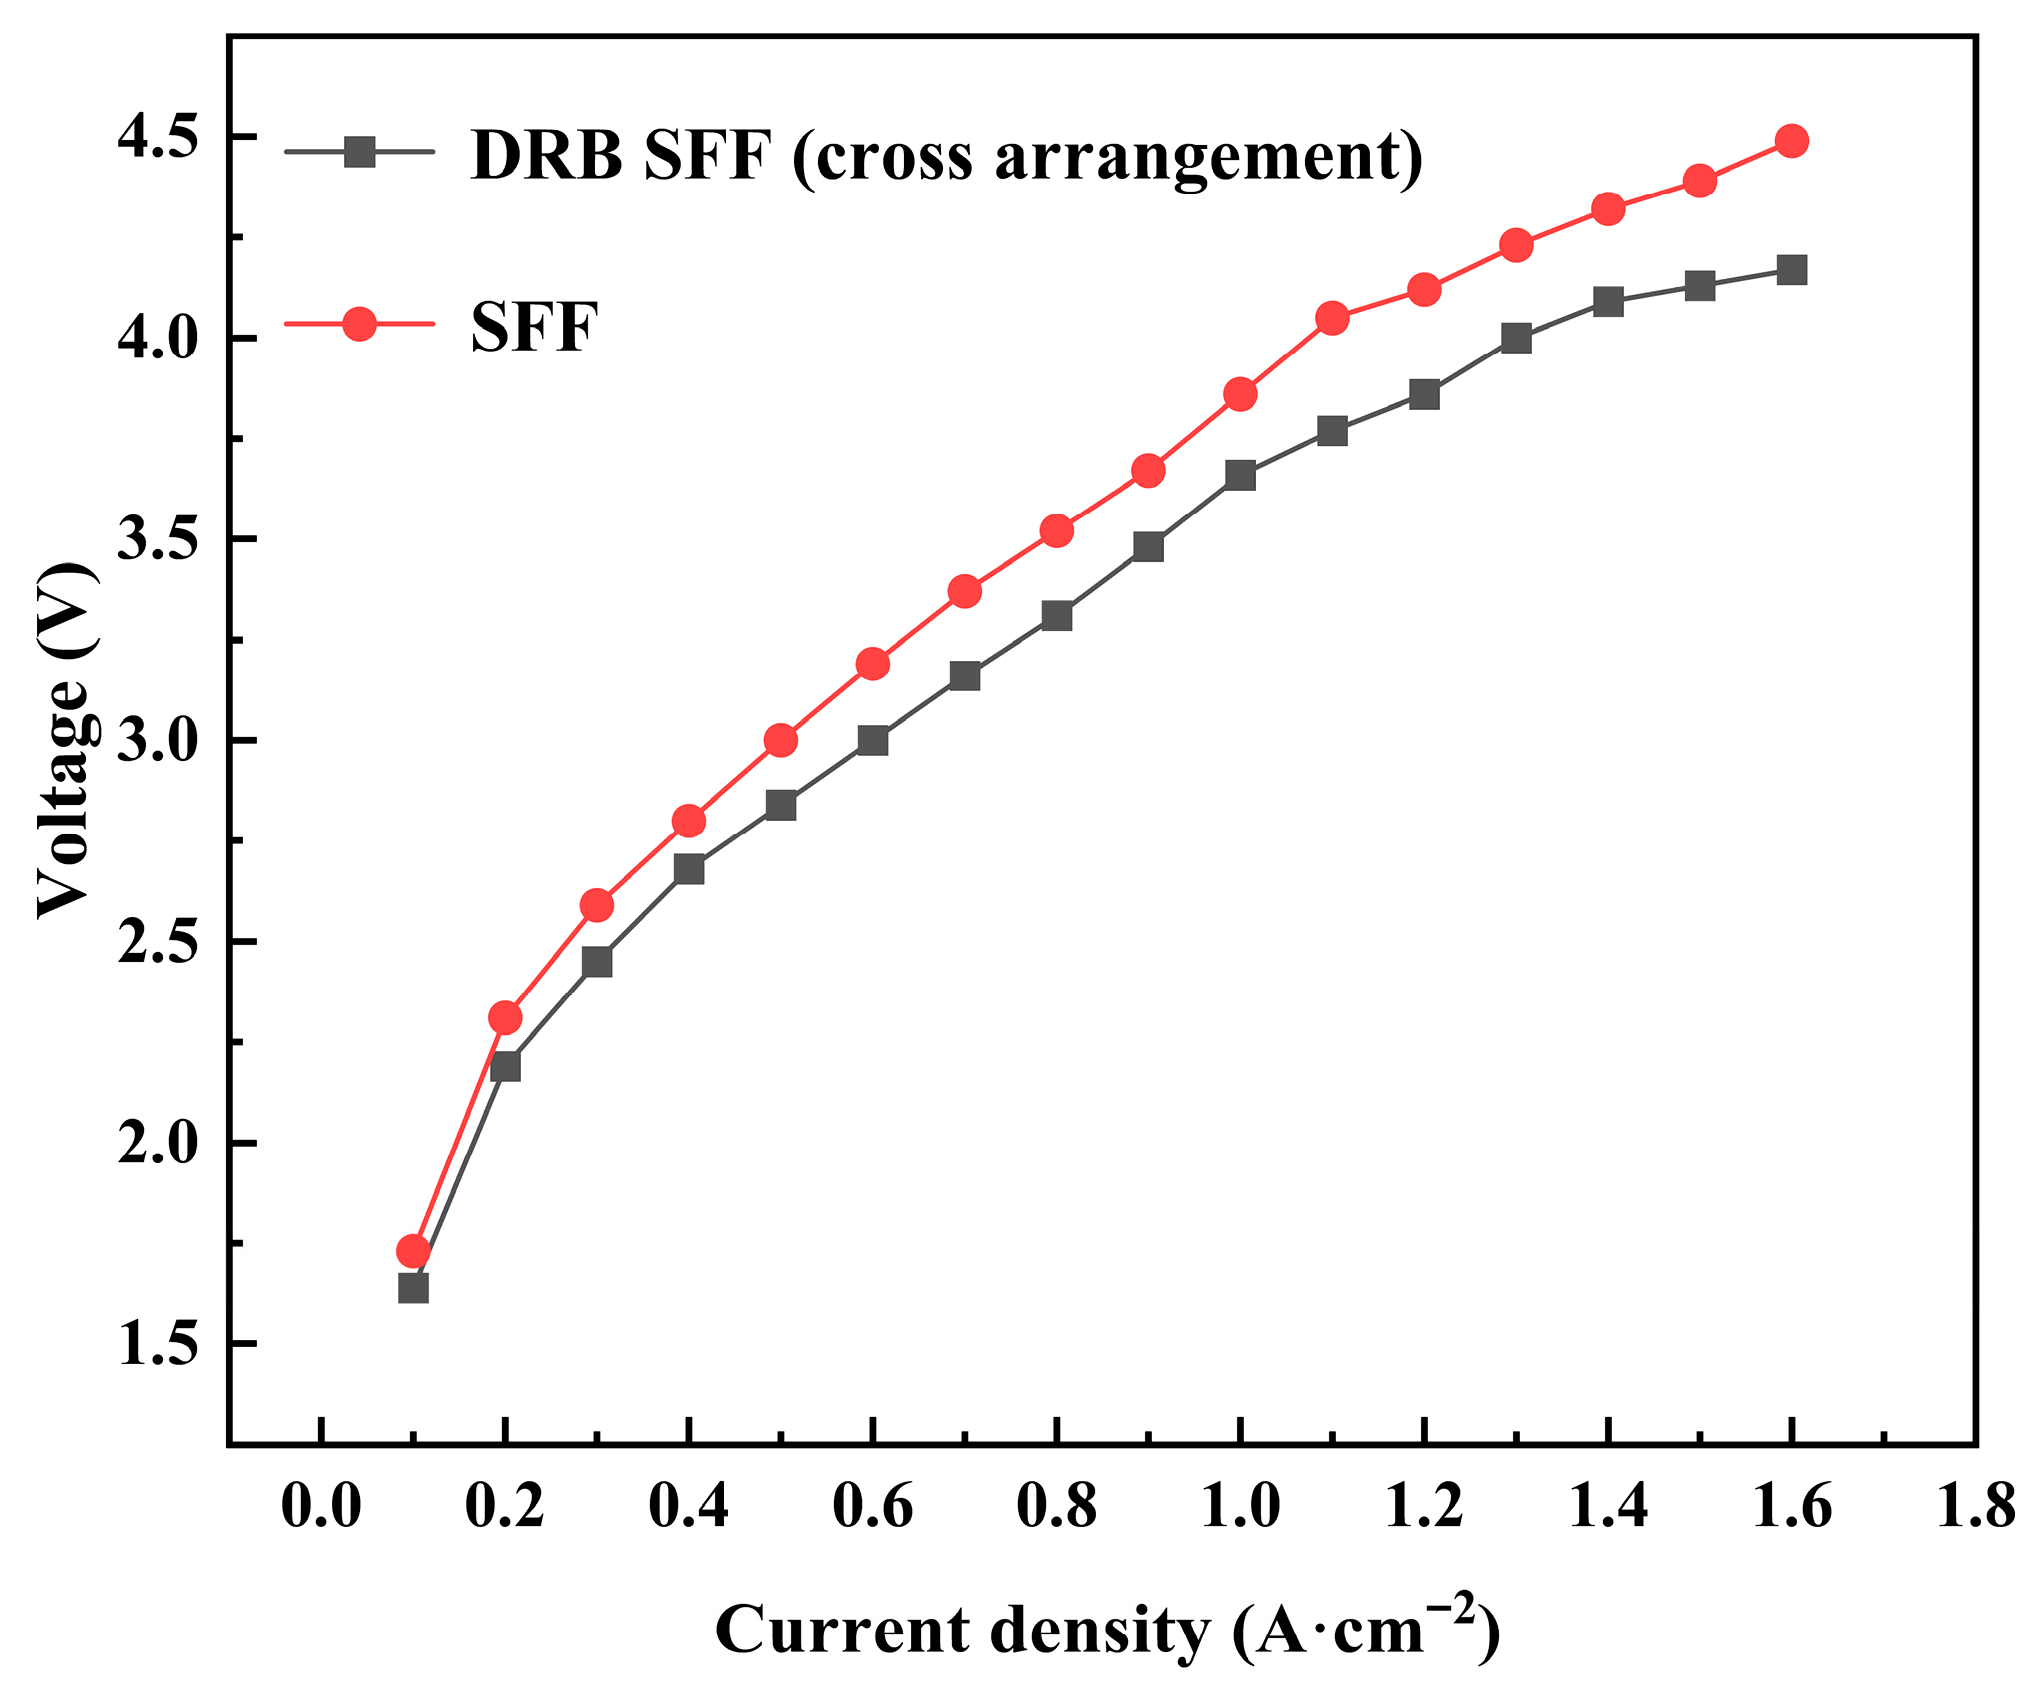
Figure 15d). In contrast, in the flow field with cross-arranged rectangular turbulence promoters, the aforementioned fluid-enhancement mechanisms remain effective even under high gas holdup conditions. The sweeping action of the vortices continuously fragments and transports large bubbles, thereby maintaining a well-dispersed bubble state across different current densities. This provides a clear hydrodynamic explanation for why such a channel can sustain superior electrochemical performance at high current densities (as shown in the polarization curve in
Figure 16). The optimization of bubble behavior is, in essence, an optimization of the mass transfer process.
Under the operating conditions of a flow rate of 75 mL·min−1 and a temperature of 80 °C, at a high current density of 1.6 A·cm−2, the flow field with cross-arranged rectangular turbulence promoters demonstrates a significant voltage reduction of 0.32 V compared to the conventional SFF. This improvement is primarily attributed to its fundamental optimization of gas–liquid two-phase flow and mass transfer processes. The turbulence induced by the promoters effectively fragments and rapidly removes oxygen bubbles from the electrode surface, substantially reducing bubble coverage from the high level observed in the conventional channel. This directly exposes a large number of active sites previously covered by gas, thereby greatly alleviating reactant transport limitations and leading to a significant decrease in concentration overpotential. Furthermore, the enhanced fluid disturbance ensures adequate hydration of the proton exchange membrane and may reduce bubble retention within the porous layer, lowering ohmic resistance. Thus, this 0.32 V voltage reduction essentially reflects the successful resolution of the core bottleneck at high current densities—“bubble blockage”—through innovative flow field design, transitioning the system from a state of severe mass transfer constraints to an efficient operating regime. The results indicate that the incorporation of turbulence promoters reduces polarization and enhances the electrochemical performance of the electrolysis.
4. Conclusions
In this study, a steady-state, multi-physics coupled model for the PEMWE is developed, incorporating electrochemical reactions, two-phase flow and non-isothermal effects. Bubble parameters obtained from visualization experiments are used to calibrate the model, particularly to revise the simulated polarization curve. The modified curve demonstrates excellent agreement with experimental results, thereby validating the accuracy and reliability of the proposed model. Furthermore, the effects of various rectangular turbulence-promoting block arrangements on electrolysis performance are systematically investigated. The main findings are summarized as follows:
Compared with the conventional SFF, the four turbulence-promoting ribbed designs increases the liquid water saturation at the ACL-PEM interface by 11.4%, 16.6%, 18.9% and 27.5%, respectively. Among them, the DRB SFF exhibits a 6.3-fold enhancement in the normal mass transfer coefficient. These results demonstrate that the implementation of turbulence-inducing structures at the anode side can significantly enhance mass transport and mitigate gas accumulation beneath the ribs.
The conventional SFF exhibits the poorest temperature uniformity distribution. The four turbulence-promoting ribbed flow fields improve the temperature uniformity index at the ACL-PEM interface by 0.85%, 0.49%, 12.5% and 10.5%, respectively. This indicates that the incorporation of rib structures reduces ohmic heat generation and ensures sufficient liquid water supply within the electrolysis.
At an operating voltage of 4.5 V, the DRB SFF exhibits the highest current density, increasing by 0.108 compared with the conventional SFF, and surpassing the SRB SFF, TNRB SFF, and TURB SFF by 0.025, 0.023 and 0.007, respectively. The current density uniformity distribution values for Cases 2–5 are reduced by 36.7%, 40.8%, 37.9% and 40.6%, respectively, relative to Case 1. These findings confirm that the designed ribbed turbulence promoters effectively improve the polarization performance of the PEMWE.
The application of the cross arrangement reduces the pressure drop by 28.1%. At 4.5 V, the cross arrangement also demonstrates improved uniformity in liquid water saturation, temperature, and current density distributions, with reductions of 2.89%, 0.69% and 4.54%, respectively. Under the same voltage condition, the current density of the cross arrangement increases by 1.25%. These results indicate that the cross arrangement of the DRB SFF further enhances the reaction utilization efficiency of the PEMWE.
The cross-arranged rectangular turbulence promoters fundamentally enhance gas–liquid two-phase flow and mass transfer in PEMWE. By effectively fragmenting bubbles and reducing electrode surface coverage compared to conventional SFF, they significantly lower concentration overpotential and ohmic resistance, resulting in a voltage reduction of 0.32 V at a current density of 1.6 A·cm−2. This design successfully mitigates bubble-induced mass transfer limitations, enabling stable and efficient operation at high current densities.
The current design achieves notable improvements but remains suboptimal. Future work will apply genetic algorithms for further optimization and validate long-term durability through accelerated testing and cost-performance analysis.
Author Contributions
Conceptualization, B.H., L.Z. and Z.T.; Methodology, Z.W., L.Z. and H.W.; Software, Z.W.; Validation, B.H. and L.Z.; Formal analysis, B.H.; Investigation, C.D., Z.W., S.X. and G.W.; Resources, Z.T.; Data curation, C.D.; Writing—original draft, C.D.; Writing—review & editing, B.H., Z.W. and L.Z.; Visualization, C.D. and Z.W.; Supervision, B.H. and L.Z.; Project administration, B.H. and L.Z.; Funding acquisition, B.H., L.Z., H.W. and Z.T. All authors have read and agreed to the published version of the manuscript.
Funding
This research was funded by the National Key R&D Program of China (Grant No. 2021YFA1500900), the Strategic Priority Research Program of the Chinese Academy of Sciences (Grant No. XDA0390501), and the National Natural Science Foundation of China (Grant No. 22278418). The APC was funded by the authors’ institutions.
Data Availability Statement
The data presented in this study are available on request from the corresponding author due to project data confidentiality agreement.
Acknowledgments
The authors would like to acknowledge the technical support provided by the Shanghai Advanced Research Institute, Chinese Academy of Sciences, for experimental setup and data analysis. We also sincerely appreciate the valuable suggestions from the reviewers.
Conflicts of Interest
The authors declare no conflicts of interest.
References
- Najafov, B.A.; Nasirov, S.N.; Neymetov, S.R. HYDROGEN technologies for the manufacture of solar-hydrogen Energy objects. Int. J. Hydrogen Energy 2025, 99, 328–339. [Google Scholar] [CrossRef]
- Leggerini, C.; Bannò, M.; Molin, M.D. Hydrogen innovation: An exploration of its determinants across Europe. Energy Policy 2025, 204, 114675. [Google Scholar] [CrossRef]
- Horri, B.A.; Ozcan, H. Green hydrogen production by water electrolysis: Current status and challenges. Curr. Opin. Green Sustain. Chem. 2024, 47, 310–333. [Google Scholar] [CrossRef]
- Choi, H.; Lee, H.; Han, J.; Roh, K. Revisiting the cost analysis of importing liquefied green hydrogen. Int. J. Hydrogen Energy 2024, 82, 817–827. [Google Scholar] [CrossRef]
- Karayel, G.K.; Javani, N.; Dincer, I. A comprehensive assessment of energy storage options for green hydrogen. Energy Convers. Manag. 2023, 291, 117311. [Google Scholar] [CrossRef]
- Wang, Y.K.; Mao, Y.D.; Yang, K.M.; Gao, B.; Liu, J.Y. Enhancing PEMEC Efficiency: A synergistic approach using CFD analysis and Machine learning for performance optimization. Appl. Therm. Eng. 2024, 255, 124018. [Google Scholar] [CrossRef]
- Xin, S.; LiJun, X.; Di, Z.; Bing, H.; LuXiang, M. Electrochemical performance study of proton exchange membrane electrolyzer considering the effect of bubble coverage. Int. J. Hydrogen Energy 2023, 48, 27079–27094. [Google Scholar] [CrossRef]
- Li, Y.F.; Yang, G.Q.; Yu, S.L.; Mo, J.K.; Li, K.; Xie, Z.Q.; Ding, L.; Wang, W.T.; Zhang, F.Y. High-speed characterization of two-phase flow and bubble dynamics in titanium felt porous media for hydrogen production. Electrochim. Acta 2021, 370, 137751. [Google Scholar] [CrossRef]
- Ma, S.H.; Wang, K.C.; Xiao, F.; Zhang, T.Y.; Ye, F.; Xu, C.; Liu, J.G. In-plane performance analysis of PEM electrolyzer cell under multiple operating conditions based on anode segmented visualization design. Appl. Energy 2025, 381, 125167. [Google Scholar] [CrossRef]
- Majasan, J.O.; Cho, J.I.S.; Dedigama, I.; Tsaoulidis, D.; Shearing, P.; Brett, D.J.L. Two-phase flow behaviour and performance of polymer electrolyte membrane electrolysers: Electrochemical and optical characterization. Int. J. Hydrogen Energy 2018, 43, 15659–15672. [Google Scholar] [CrossRef]
- Liu, Y.; Chen, M.D.; Mo, J.K.; Hao, H.W.; Tan, H.; Wang, X.X.; Jiang, P.; Li, J.H.; Wang, Y.N.; Deng, Z.F. Visual experimental research of two-phase flow in long straight anode channels with different widths in a polymer electrolyte membrane water electrolysis cell. J. Power Sources 2025, 646, 237258. [Google Scholar] [CrossRef]
- Kumar, S.S.; Ni, A.; Himabindu, V.; Lim, H. Experimental and simulation of PEM water electrolyser with Pd/PN-CNPs electrodes for hydrogen evolution reaction: Performance assessment and validation. Appl. Energy 2023, 348, 121565. [Google Scholar] [CrossRef]
- Wang, W.T.; Li, J.; Ding, L.; Wu, J.J.; Ma, H.; Shi, T.Y.; Mench, M.; Zhang, F.Y. 3D multiphysics modeling for probing the non-homogenous parameter distribution in proton exchange membrane electrolyzer cells. Energy Convers. Manag. 2025, 324, 119222. [Google Scholar] [CrossRef]
- Nafchi, F.M.; Afshari, E.; Baniasadi, E. Thermal and electrochemical analyses of a polymer electrolyte membrane electrolyzer. Int. J. Hydrogen Energy 2022, 47, 40172–40183. [Google Scholar] [CrossRef]
- Qi, R.H.; Zhang, L.Z. Multi-scale modelling on PEM-based electrolyte dehumidifier: Transient heat and mass transfer in anode catalyst layer with microstructures. Int. J. Heat Mass Transf. 2021, 179, 121720. [Google Scholar] [CrossRef]
- Zhang, H.Y.; Zhu, J.G.; Xu, J.Q.; Wang, C.; Yuan, H.; Dai, H.F.; Wei, X.Z. Investigation on the influence of structural parameters in the porous transport layer on the mass transfer process within PEM water electrolyzer. Int. J. Heat Mass Transf. 2025, 253, 127519. [Google Scholar] [CrossRef]
- Li, Y.; Liu, X.; Chen, L.; Li, J.; Zhu, D.; Li, Y. A “Leaf-Vein” Flow Channel Design for the Improvement of Oxygen Transporting in a Large-Scale Proton Exchange Membrane Electrolysis Cell. Energy Technol. 2024, 12, 2301603. [Google Scholar] [CrossRef]
- Wu, L.Z.; An, L.; Jiao, D.K.; Xu, Y.F.; Zhang, G.B.; Jiao, K. Enhanced oxygen discharge with structured mesh channel in proton exchange membrane electrolysis cell. Appl. Energy 2022, 323, 119651. [Google Scholar] [CrossRef]
- Xu, Y.; Zhang, G.; Wu, L.; Bao, Z.; Zu, B.; Jiao, K. A 3-D multiphase model of proton exchange membrane electrolyzer based on open-source CFD. Digit. Chem. Eng. 2021, 1, 100004. [Google Scholar] [CrossRef]
- Shen, J.; Tu, Z. Flow channel design in a proton exchange membrane fuel cell: From 2D to 3D. Int. J. Hydrogen Energy 2021, 47, 3087–3098. [Google Scholar] [CrossRef]
- Xia, G.; Zhang, X.; Ma, D. Effects of baffle position in serpentine flow channel on the performance of proton exchange membrane fuel cells. Chin. J. Chem. Eng. 2024, 69, 250–262. [Google Scholar] [CrossRef]
- Huang, Y.; Song, J.N.; Deng, X.Y.; Chen, S.; Zhang, X.; Ma, Z.P.; Chen, L.J.; Wu, Y.L. Numerical investigation of baffle shape effects on performance and mass transfer of proton exchange membrane fuel cell. Energy 2023, 266, 126448. [Google Scholar] [CrossRef]
- Dong, P.C.; Xie, G.N.; Ni, M. The mass transfer characteristics and energy improvement with various partially blocked flow channels in a PEM fuel cell. Energy 2020, 206, 117977. [Google Scholar] [CrossRef]
- Zhang, L.-H.; Huang, B.; Zhou, T.-j.; Xu, S. Enhancing oxygen transport performance with improved serpentine flow field on the anode side of the PEMEC. Int. J. Hydrogen Energy 2024, 82, 881–891. [Google Scholar] [CrossRef]
- Wu, L.; Zhang, G.; Xie, B.; Tongsh, C.; Jiao, K. Integration of the detailed channel two-phase flow into three-dimensional multi-phase simulation of proton exchange membrane electrolyzer cell. Int. J. Green Energy 2021, 18, 541–555. [Google Scholar] [CrossRef]
- Jiang, Y.; Li, Y.; Ding, Y.; Hu, S.; Dang, J.; Yang, F. Ouyang, Simulation and experiment study on two-phase flow characteristics of proton exchange membrane electrolysis cell. J. Power Sources 2023, 553, 20184–20193. [Google Scholar] [CrossRef]
- Toghyani, S.; Afshari, E.; Baniasadi, E.; Atyabi, S.A. Thermal and electrochemical analysis of different flow field patterns in a PEM electrolyzer. Electrochim. Acta 2018, 267, 234–245. [Google Scholar] [CrossRef]
- Song, J.; Guo, H.; Ye, F.; Ma, C.F. Mass transfer and cell performance of a unitized regenerative fuel cell with nonuniform depth channel in oxygen-side flow field. Int. J. Energy Res. 2019, 43, 2940–2962. [Google Scholar] [CrossRef]
- Zhou, H.R.; Meng, K.; Chen, W.S.; Chen, B. 3D two-phase and non-isothermal modeling for PEM water electrolyzer: Heat and mass transfer characteristic investigation. Int. J. Energy Res. 2022, 46, 17126–17143. [Google Scholar] [CrossRef]
- Han, B.; Mo, J.K.; Kang, Z.Y.; Yang, G.Q.; Barnhill, W.; Zhang, F.Y. Modeling of two-phase transport in proton exchange membrane electrolyzer cells for hydrogen energy. Int. J. Hydrogen Energy 2017, 42, 4478–4489. [Google Scholar] [CrossRef]
- Ma, Z.W.; Witteman, L.; Wrubel, J.A.; Bender, G. A comprehensive modeling method for proton exchange membrane electrolyzer development. Int. J. Hydrogen Energy 2021, 46, 17627–17643. [Google Scholar] [CrossRef]
- Wang, X.; Wang, Z.; Feng, Y.; Xu, C.; Chen, Z.; Liao, Z.; Ju, X. Three-dimensional multiphase modeling of a proton exchange membrane electrolysis cell with a new interdigitated-jet hole flow field. Sci. China Technol. Sci. 2022, 65, 1179–1192. [Google Scholar] [CrossRef]
- Wang, Z.M.; Xu, C.; Wang, X.Y.; Liao, Z.R.; Du, X.Z. Numerical investigation of water and temperature distributions in a proton exchange membrane electrolysis cell. Sci. China-Technol. Sci. 2021, 64, 1555–1566. [Google Scholar] [CrossRef]
- Miao, Z.; He, Y.L.; Li, X.L.; Zou, J.Q. A two-dimensional two-phase mass transport model for direct methanol fuel cells adopting a modified agglomerate approach. J. Power Sources 2008, 185, 1233–1246. [Google Scholar] [CrossRef]
- Pasaogullari, U.; Wang, C.Y. Two-phase modeling and flooding prediction of polymer electrolyte fuel cells. J. Electrochem. Soc. 2005, 152, A380–A390. [Google Scholar] [CrossRef]
- Zhang, Z.Q.; Xing, X.H. Simulation and experiment of heat and mass transfer in a proton exchange membrane electrolysis cell. Int. J. Hydrogen Energy 2020, 45, 20184–20193. [Google Scholar] [CrossRef]
- Yan, Y.S.; Li, P.; Zhao, S.Y.; Luo, K.; Huang, S.Y.; Duan, Z.P.; Cai, L.L. Study on a 3D multi-physics coupled model for a PEM electrolyzer with an imitation water droplet ribbed column flow field. Int. J. Hydrogen Energy 2025, 103, 428–445. [Google Scholar] [CrossRef]
- Chen, Z.C.; Wang, X.Y.; Liu, C.; Gu, L.L.; Yin, L.K.; Xu, C.; Liao, Z.R.; Wang, Z.M. Numerical investigation of PEM electrolysis cell with the new interdigitated-jet hole flow field. Int. J. Hydrogen Energy 2022, 47, 33177–33194. [Google Scholar] [CrossRef]
- An, L.; Tian, Y.; Zhao, H. Research on Water Flow Control Strategy for PEM Electrolyzer Considering the Anode Bubble Effect. Energies 2025, 18, 273. [Google Scholar] [CrossRef]
- Feng, Z.-L.; Zhou, T.-J.; Xu, S.; Wang, G.-L.; Zhao, L.-H.; Huang, B. Design and Optimization of an Uneven Wave-like Protrusion Channel in the Proton Exchange Membrane Electrolysis Cell Based on the Taguchi Design. Energies 2025, 18, 3246. [Google Scholar] [CrossRef]
Figure 1.
(a) Anode serpentine flow field structure diagram (The dashed flow field is the representative one selected for simulation), (b) computational domains of the model.
Figure 1.
(a) Anode serpentine flow field structure diagram (The dashed flow field is the representative one selected for simulation), (b) computational domains of the model.
Figure 2.
Distribution of rectangular turbulence-promoting blocks in the anode serpentine flow field: (a) Without turbulence-promoting blocks, (b) Single-row rectangular blocks, (c) Double-row rectangular blocks, (d) Three unequal-length rectangular blocks, (e) Three equal-length rectangular blocks.
Figure 2.
Distribution of rectangular turbulence-promoting blocks in the anode serpentine flow field: (a) Without turbulence-promoting blocks, (b) Single-row rectangular blocks, (c) Double-row rectangular blocks, (d) Three unequal-length rectangular blocks, (e) Three equal-length rectangular blocks.
Figure 3.
(a) Meshing diagram and local magnification for Case 3, (b) Grid independence verification.
Figure 3.
(a) Meshing diagram and local magnification for Case 3, (b) Grid independence verification.
Figure 4.
System flow diagram of PEMWE.
Figure 4.
System flow diagram of PEMWE.
Figure 5.
(a) Bubble generation captured by high-speed camera (The red circles represent oxygen bubbles), (b) Bubble size distribution diagram.
Figure 5.
(a) Bubble generation captured by high-speed camera (The red circles represent oxygen bubbles), (b) Bubble size distribution diagram.
Figure 6.
(a) Comparison of simulated outcomes with experimental measurements under varied operating voltages, (b) Polarization curves under different bubble diameters.
Figure 6.
(a) Comparison of simulated outcomes with experimental measurements under varied operating voltages, (b) Polarization curves under different bubble diameters.
Figure 7.
The pressure distribution of (a) Case 1, (b) Case 2, (c) Case 3, (d) Case 4, (e) Case 5 at the ACH-APTL interface.
Figure 7.
The pressure distribution of (a) Case 1, (b) Case 2, (c) Case 3, (d) Case 4, (e) Case 5 at the ACH-APTL interface.
Figure 8.
Liquid water saturation distribution at 4.5 V, (a) Case 1, (b) Case 2, (c) Case 3, (d) Case4, (e) Case 5, (f) The Us for different flow configurations at the ACL-PEM interface.
Figure 8.
Liquid water saturation distribution at 4.5 V, (a) Case 1, (b) Case 2, (c) Case 3, (d) Case4, (e) Case 5, (f) The Us for different flow configurations at the ACL-PEM interface.
Figure 9.
Mass transfer index for APTL of Cases 1–5.
Figure 9.
Mass transfer index for APTL of Cases 1–5.
Figure 10.
The UT for different flow configurations at the ACL-PEM interface.
Figure 10.
The UT for different flow configurations at the ACL-PEM interface.
Figure 11.
Current density distribution at 4.5 V, (a) Case 1, (b) Case 2, (c) Case 3, (d) Case 4, (e) Case 5, (f) The Ui for various flow patterns at the ACL-PEM interface.
Figure 11.
Current density distribution at 4.5 V, (a) Case 1, (b) Case 2, (c) Case 3, (d) Case 4, (e) Case 5, (f) The Ui for various flow patterns at the ACL-PEM interface.
Figure 12.
Comparison of Polarization Curves among Cases 1–5.
Figure 12.
Comparison of Polarization Curves among Cases 1–5.
Figure 13.
The pressure distribution of (a) sequential arrangement, and (b) cross arrangement at the ACH-APTL interface.
Figure 13.
The pressure distribution of (a) sequential arrangement, and (b) cross arrangement at the ACH-APTL interface.
Figure 14.
Uniformity distribution under different arrangements, (a) UT, (b) Us, (c) Ui, (d) Polarization curves in different arrangements.
Figure 14.
Uniformity distribution under different arrangements, (a) UT, (b) Us, (c) Ui, (d) Polarization curves in different arrangements.
Figure 15.
Two-phase flow patterns at the anode side under different current densities (The red circles represent oxygen bubbles), (a) 0.1 A·cm−2, (b) 0.6 A·cm−2, (c) 1.1 A·cm−2, (d) 1.6 A·cm−2.
Figure 15.
Two-phase flow patterns at the anode side under different current densities (The red circles represent oxygen bubbles), (a) 0.1 A·cm−2, (b) 0.6 A·cm−2, (c) 1.1 A·cm−2, (d) 1.6 A·cm−2.
Figure 16.
Comparison of polarization curves between conventional serpentine flow filed and flow field with Cross-Arranged Rectangular Turbulence Promoters.
Figure 16.
Comparison of polarization curves between conventional serpentine flow filed and flow field with Cross-Arranged Rectangular Turbulence Promoters.
Table 1.
Geometric parameters of the PEMWE.
Table 1.
Geometric parameters of the PEMWE.
| Parameter | Unit | Value |
|---|
| MEA width/length (W/L) | mm | 10/50 |
| MEA active area | mm2 | 500 |
| Thickness of CLs | mm | 0.05 |
| Thickness of APTL/CPTL | mm | 0.3 |
| Thickness of PEM | mm | 0.127 |
| Height of field | mm | 2 |
| Width of ribs (d1) | mm | 2 |
| Width of field (d2) | mm | 2 |
| Ribbed column width (d3/d4) | mm | 0.4/0.2 |
| Ribbed column length (D1/D2) | mm | 4/2 |
| Spacing of ribbed column (D3) | mm | 6.3 |
Table 2.
PEMWE model case composition.
Table 2.
PEMWE model case composition.
| Flow Field | Case 1 | Case 2 | Case 3 | Case 4 | Case 5 |
|---|
| Anode | SFF | SRB SFF | DRB SFF | TNRB SFF | TERB SFF |
| Cathode | SFF | SFF | SFF | SFF | SFF |
Table 3.
The characteristic parameters of the PEMWE model.
Table 3.
The characteristic parameters of the PEMWE model.
| Parameter | Unit | Value |
|---|
| Anode charge transfer coefficient | - | 0.5 |
| Cathode charge transfer coefficient | - | 0.5 |
| Anode exchange current density | A·m−2 | 1 × 10⁻⁴ |
| Cathode exchange current density | A·m−2 | 1000 |
| Electrochemically active surface area | m−1 | 1 × 10⁶ |
| Water content of membrane (λ) | - | 20 |
| Faraday constant (F) | C·mol−1 | 96,485 |
| Universal gas constant (R) | J·mol−1·K−1 | 8.314 |
| Operating temperature (T) | K | 353.15 |
| Activation energy for electrode reaction | kJ·mol−1 | 53.99 |
| Contact angle | ° | 60 |
| Surface tension | N·m−1 | 0.0625 |
| Porosity of PTL/CL | - | 0.5/0.3 |
| Permeability of PTL/CL | m2 | 1 × 10⁻¹²/1 × 10−13 |
| Conductivity of PTL/CL | S·m−1 | 10 |
| Specific heat capacity of APTL/CPTL | J·kg−1·K−1 | 523/894.4 |
| Specific heat capacity of ACL/CCL | J·kg−1·K−1 | 123/130 |
| Specific heat capacity of PEM | J·kg−1·K−1 | 0.18 |
| Density of APTL/CPTL | Kg·m−3 | 4500/1800 |
| Density of ACL/CCL | Kg·m−3 | 22,500/21,400 |
| Density of PEM | Kg·m−3 | 1980 |
| Thermal conductivity of APTL/CPTL | W·m−1·K−1 | 15.2/2.98 |
| Thermal conductivity of ACL/CCL | W·m−1·K−1 | 224.89/77.8 |
| Thermal conductivity of PEM | W·m−1·K−1 | 1090 |
Table 4.
The expressions of the source terms in the governing equations [
37].
Table 4.
The expressions of the source terms in the governing equations [
37].
| Descriptions | Expressions |
|---|
| Source term of electrical potential | | (24) |
| Source term of protonic potential | | (25) |
| Source term of liquid-phase mass conservation | | (26) |
| Source term of gas-phase mass conservation | | (27) |
| Source term of momentum conservation | | (28) |
| Source term of energy conservation | | (29) |
| Disclaimer/Publisher’s Note: The statements, opinions and data contained in all publications are solely those of the individual author(s) and contributor(s) and not of MDPI and/or the editor(s). MDPI and/or the editor(s) disclaim responsibility for any injury to people or property resulting from any ideas, methods, instructions or products referred to in the content. |



 ,
,