Article

Turning CO2 into Ethanol: Enhancing Electrochemical Reduction Through Cu-Doped Electrodes

by
Jose Antonio Abarca
1,
Ana M. Ferraria
2,
Ana M. Botelho do Rego
2,
Sara Realista
3,
Paulo N. Martinho
3,
Angel Irabien
1 and
Guillermo Díaz-Sainz
1,*
1
Departamento de Ingenierías Química y Biomolecular, Universidad de Cantabria, Avenida de los Castros s/n, 39005 Santander, Spain
2
BSIRG, iBB—Institute for Bioengineering and Biosciences, Associate Laboratory i4HB—Institute for Health and Bioeconomy, and Chemical Engineering Department, Instituto Superior Técnico, Universidade de Lisboa, 1049-001 Lisbon, Portugal
3
Centro de Química Estrutural, Institute of Molecular Sciences, Departamento de Química e Bioquímica, Faculdade de Ciências, Universidade de Lisboa, Campo Grande, Ed. C8, 1749-016 Lisboa, Portugal
*
Author to whom correspondence should be addressed.
Energies 2026, 19(2), 354; https://doi.org/10.3390/en19020354
Submission received: 1 December 2025 / Revised: 28 December 2025 / Accepted: 9 January 2026 / Published: 11 January 2026

Abstract

The electrochemical reduction of CO2 to ethanol represents a sustainable alternative to recycle CO2 into a value-added product, yet achieving high selectivity and efficiency remains a challenge. This work explores Cu-based catalysts supported on SiO2 and ZrO2, with and without ZnO doping, for ethanol production in a continuous flow-cell system. Gas diffusion electrodes are fabricated using commercial catalysts with varying Cu loadings (5–10%) and ZnO contents (2–3.5%). Comprehensive characterization by XPS confirms the presence of Cu2+ and Zn2+ species, while SEM reveals that ZnO incorporation improves surface uniformity and aggregate distribution compared to undoped samples. Electrochemical tests demonstrate that 10% Cu on SiO2 achieves a Faradaic efficiency of 96% for ethanol at −3 mA cm−2, outperforming both doped catalysts and previously reported materials. However, efficiency declines at higher current densities, indicating a trade-off between selectivity and productivity. ZnO doping enhances C2+ product formation but does not surpass the undoped catalyst in ethanol selectivity. These results underline the importance of catalyst composition, support interactions, and operating conditions, and point to further optimization of electrode architecture and cell configuration to sustain high ethanol yields under industrially relevant conditions.

1. Introduction

Electrochemical CO2 reduction (ERCO2) represents a promising strategy for transforming this greenhouse gas into valuable chemicals, such as acids, alkanes, and alcohols, using electricity from renewable sources [1]. Among the possible products, ethanol (CH3CH2OH) stands out as a particularly attractive target due to its high energy density (1366.8 kJ mol−1), ease of storage and transport compared to gaseous alternatives, and its dual role as both a fuel additive and a versatile industrial feedstock. While ethanol is traditionally produced from biomass sources such as corn or sugarcane, the growing demand for sustainable production routes has driven interest in electrochemical synthesis powered by renewable energy.
Nevertheless, the electrochemical conversion of CO2 to ethanol involves complex reaction pathways with multiple proton–electron transfer reactions. Therefore, the selection of an appropriate catalyst and the optimization of the reaction conditions are crucial to achieving high selectivity and efficiency [2].
The main electrochemical half-reactions leading to the formation of CO and various alcohols, along with their standard electrode potentials versus the standard hydrogen electrode (SHE) under standard conditions (298 K, 1 atm, pH = 0), are summarized in Table 1 [3].
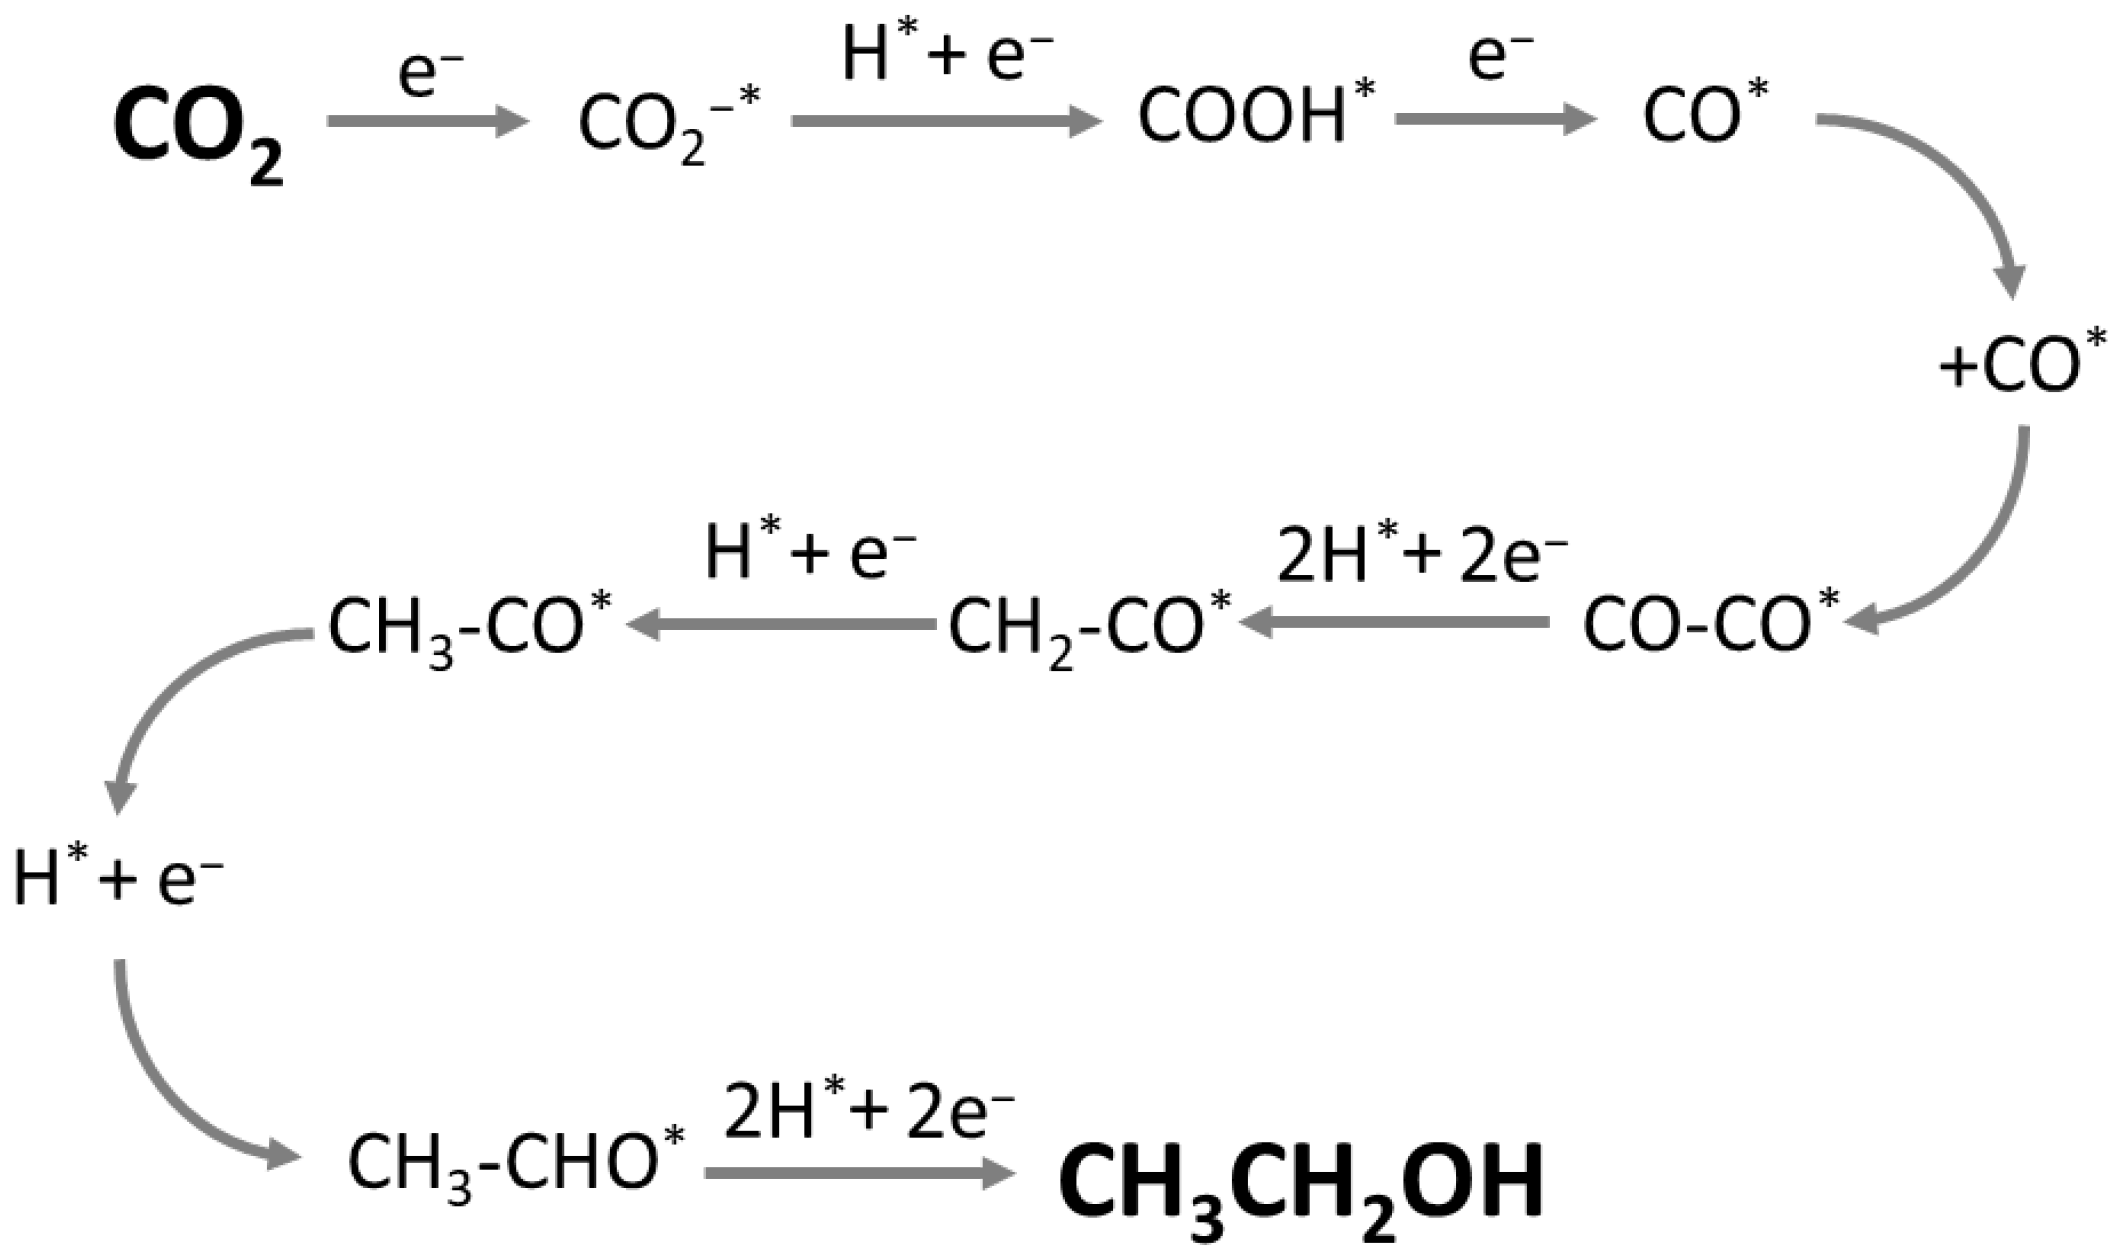
As shown in Figure 1, the electrochemical synthesis of ethanol requires precise control of the reaction environment to direct the formation of key intermediates such as *CO, *CO–CO, and *CH3CHO [4]. Copper (Cu) is widely recognized as the most effective catalyst for ethanol production, thanks to its unique ability to stabilize these intermediates and promote the formation of multi-carbon (C2+) products [5,6]. Despite its potential, the practical application of Cu-based catalysts remains limited by challenges such as low product selectivity and gradual catalyst deactivation. Addressing these issues demands continued research efforts focused on reducing the overpotential while improving selectivity and long-term stability [7,8]. Key factors influencing catalytic performance include morphology, surface treatments, crystallographic orientation, and the electronic properties of the active sites [9].
One critical aspect of Cu-based nanoparticles for C2+ products is the Cu loading within the nanostructures. As reported by Kim et al. [10], variations in Cu content significantly affect electrochemical transformations, and thus product selectivity. In their study, nanoparticles with high Cu loading (22.5%) underwent structural transformation during electrolysis, leading to the formation of cube-like active particles that achieved Faradaic efficiency (FE) exceeding 50% for C2-C3 products.
In addition, the support material plays a decisive role in the reaction mechanism and efficiency of ethanol formation. Cu nanoparticles are typically supported on carbon, metal oxides, or polymers matrices to ensure structural stability [11]. For metal oxide supports, strong metal–support interactions can help maintain nanoparticle dispersion, stabilize particle size, and modify the electronic environment of Cu active site [12].
Among these supports, SiO2 has been widely used in ERCO2 due to its structural stability, high CO2 adsorption capacity, and strong affinity for Cu [13,14]. When used as a support, SiO2 promotes C–C coupling at Cu active sites, thereby enhancing the formation of C2 products such as ethanol [15]. Similarly, ZrO2 has demonstrated remarkable performance in promoting C2+ product formation, as its interfacial boundaries provide dual active sites that stabilize key intermediates (CO2*, CO*, and OCCO*), facilitating multi-carbon coupling [16,17].
Another effective approach to enhance the selectivity and activity of Cu-based catalysts is metal doping [18]. In particular, doping with Zn-based oxides has gained attention due to Zn’s ability to stabilize Cu+ species and to remove impurities that can deactivate the catalyst during prolonged electrolysis [19,20]. Furthermore, Keerthiga and Chetty [21] reported that Zn may suppress the hydrogen evolution reaction (HER), which is crucial for improving both the efficiency and selectivity of CO2 reduction. Adjusting the Zn content within the nanocomposite can further tune reaction selectivity, favoring ethanol formation over other C2 products such as ethylene [22].
Building on these insights, the present work aims to investigate various strategies for enhancing CO2 electroreduction to ethanol using commercial Cu-based materials. This study explores the effects of different nanoparticle supports, Cu loadings, and ZnO doping levels to maximize ethanol production in a continuously operated flow cell reactor. Furthermore, detailed structural and physicochemical characterization will be performed to correlate catalyst composition and morphology with the observed reactivity and selectivity of each system.

2. Materials and Methods

2.1. GDE Preparation

In this study, a Gas Diffusion Electrode (GDE) was employed as the working electrode. Several commercially available Cu-based materials were used as catalysts, differing in nanoparticle support, Cu loading, and dopant composition. The catalysts included: (i) 5% Cu supported on zirconia (5% Cu ZrO2, C2Cat), (ii) 10% Cu supported on silica (10% Cu–SiO2, C2Cat), (iii) 10% Cu supported on silica doped with 2% ZnO (10% Cu-2% ZnO, C2Cat) and (iv) 10% Cu supported on silica doped with 3.5% ZnO (10% Cu-3.5% ZnO, C2Cat). The catalytic ink was prepared by dispersing the catalyst powder in isopropanol (IPA, Fisher Chemicals) as the solvent, and Nafion D-521 ionomer (IonPower) as the ionomer binder, with a catalyst-to-ionomer ratio of 70:30. The resulting suspension was manually airbrushed onto a commercial Gas Diffusion Layer (GDL, Sigracet 39 BB, FuelCell), achieving a catalyst loading of 1 mg cm−2 over an active area of 5 cm2.

2.2. Experimental System

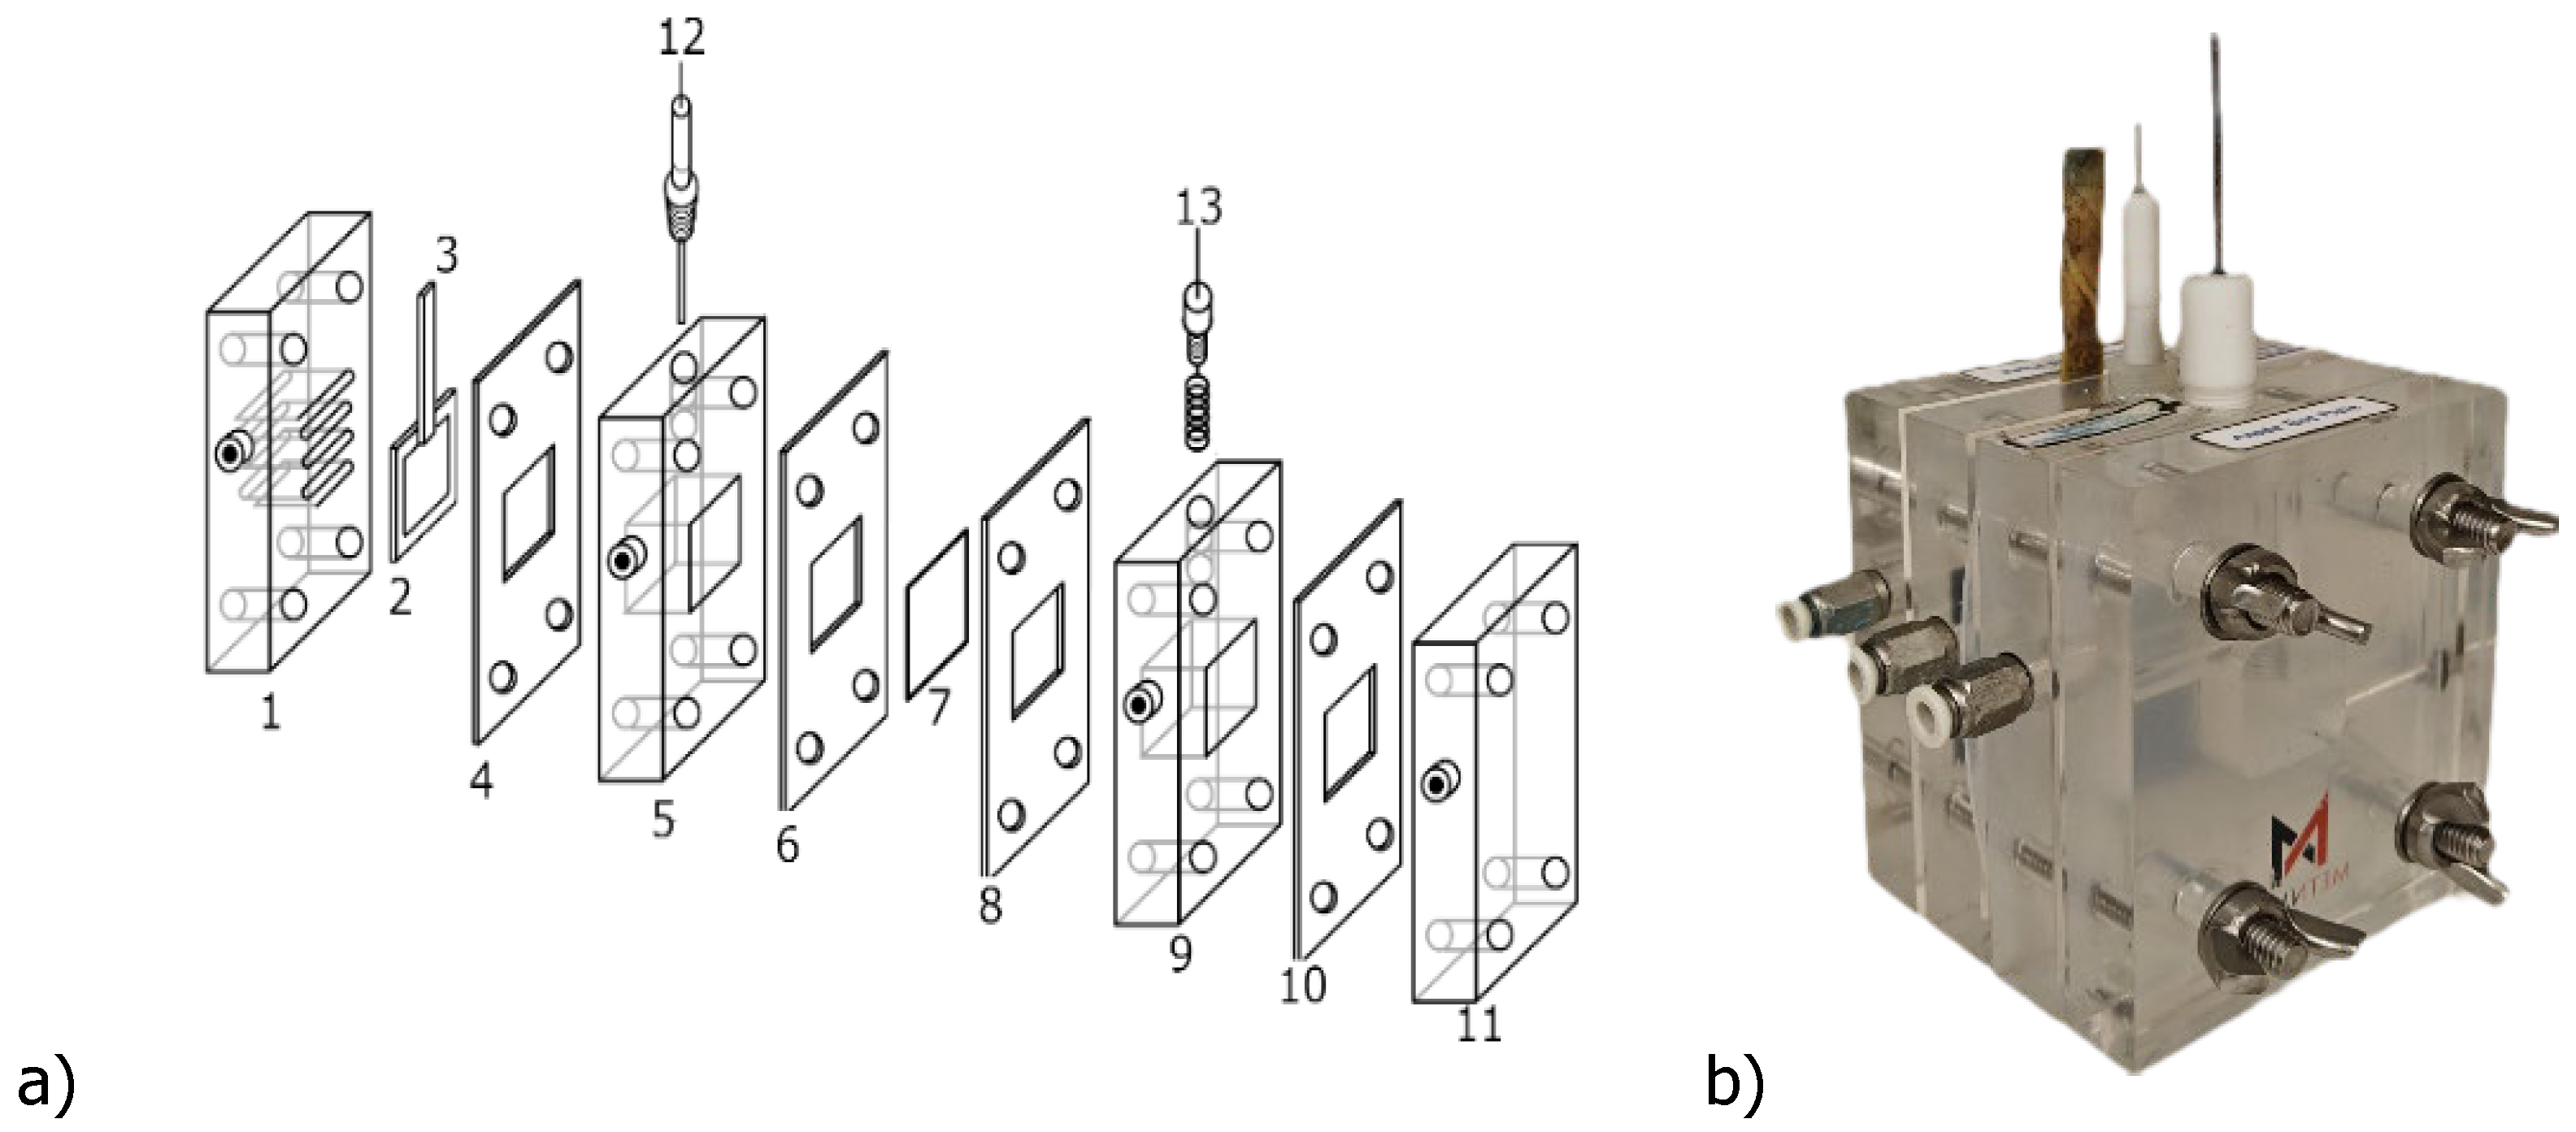
The electrochemical performance of the fabricated GDEs was evaluated in a flow-cell reactor (METNMAT CO2 Transparent Flow Cell, Kolkata, India) with an active area of 5 cm2, operated under a three-electrode configuration (Figure 2). The cell assembly comprised four main plates, silicone sealing gaskets, the prepared GDE, a Nafion 117 cation-exchange membrane (Alfa Aesar, Thermo Fisher Scientific, Waltham, MA, USA), a platinum coil serving as the counter electrode, a gold-plated current collector, and an Ag/AgCl reference electrode.
The GDE was positioned with its GDL facing the cathode flow channel, where the gaseous CO2 is supplied, allowing the gas to diffuse through the GDE structure until it reaches the catalyst layer, which is in direct contact with the liquid catholyte. Before the operation, the Nafion membrane was pre-treated by immersion in 1 M KOH solution for 1 h, and the Ag/AgCl reference electrode was stored in 3 M KCl solution.
The complete setup includes two peristaltic pumps (HygiaFlex HF-HandyPump01, San Diego, CA, USA), electrolyte reservoirs, and a multichannel potentiostat (Arbin Instruments, MSTAT4 model, College Station, TX, USA). Pure CO2 was continuously fed into the cathode compartment at 200 mL min−1, while the catholyte (0.5 M KHCO3) and anolyte (1 M KOH) were circulated at 11.4 mL min−1. The reactor was operated in a single-pass mode.
Each experiment was conducted using a fresh cathode and consisted of three consecutive 30 min electrolysis runs at constant current densities of −3, −6, and −9 mA·cm−2. Liquid products were collected from the outlet stream during each test. All experiments were performed in duplicate to ensure reproducibility.
Liquid-phase products were analyzed to quantify alcohol and other CO2 reduction products. Ethanol and methanol were identified using headspace gas chromatography (GC-FID, Shimadzu GCMS-QP2012 Ultra (Shimadzu, Kyoto, Japan)) equipped with a DB-Wax column (30 m × 0.25 mm × 0.25 μm). The injector and detector were maintained at 250 °C and 270 °C, respectively. Anions such as formate and acetate were quantified by ion chromatography (Dionex ICS system) with an AS9-HC column, using a 4.5 mM Na2CO3 eluent at a flow rate of 1 mL min−1.

2.3. Performance Evaluation

The electrochemical performance was assessed based on two key indicators: FE and production rate (r).
FE quantifies the fraction of total charge contributing to the formation of a given product (Equation (1)), calculated as:
F E % = z · n · F Q · 100
where z is the number of electrons required to form one molecule of the product (z = 12 for ethanol, z = 2 for formate), n is the number of moles of product formed (mol), F is the Faraday constant (96,485 C mol−1), and Q is the total charge passed, obtained as the product of the applied current density (j) and electrolysis time (t).
The r, expressing the rate of product formation normalized to electrode area (Equation (2)), is calculated as:
r m m o l   m 2   s 1 = n A · t
where n is the number of moles formed (mmol), A is the geometric area of the cathode (m2), and t is the reaction time (s).

2.4. Physicochemical Characterization

Samples were chemically characterized by X-ray Photoelectron Spectroscopy (XPS) using a XSAM800 dual anode spectrometer from Kratos (Manchester, UK). The Al Kα radiation (hν = 1486.6 eV) was used. Spectrometer operation conditions, TOA, pressure and temperature of analysis were as described elsewhere [23]. Spectra (with a step of 0.1 eV) were collected by the software Vision 2 for Windows, Version 2.2.9 from KRATOS. Data processing was performed using the freeware XPSPeak 4.1. Shirley backgrounds (except for Cu 2p region where a linear background was used) and Gaussian-Lorentzian products were used for curve fitting. No flood gun was used for neutralizing charge accumulation. The shift due to charge accumulation was corrected using as reference the binding energy (BE) of C 1s sp3 bonded to other C and H atoms set to 285.0 eV [24,25]. For quantification purposes, the sensitivity factors (SF) used were those furnished by the equipment library: 0.278 for C 1s, 0.78 for O 1s, 0.328 for Si 2p, 1 for F 1s, 5.321 for Cu 2p3/2 and 2.001 for Zn 2p3/2.
SEM analysis was performed at MicroLab—Electron Microscopy Laboratory of Tecnico using a ThermoScientific, Phenom ProX G6 (ThermoScientific, Waltham, MA, USA) with a CsB6 filament and an EDS detector scanning electron microscope (ThermoScientific, Waltham, MA, USA) was used.
Powder X-ray Diffraction (PXRD) diffractograms were obtained using a Philips Analytical PW 3050/60 X’Pert PRO automatic diffractometer (Philips, Amsterdam, The Netherlands), equipped with an X’Celerator detector. Data was acquired using X’Pert Data Collector version 2.0b software. CuKα was used as the radiation source, operating with a current of 30 mA and a voltage of 40 kV using a continuous scan of the Bragg angles (2θ) between 5° and 50°, with a step of 0.017 and an acquisition time of 100 s per step.

3. Results

3.1. Preparation and Characterization of the Electrodes

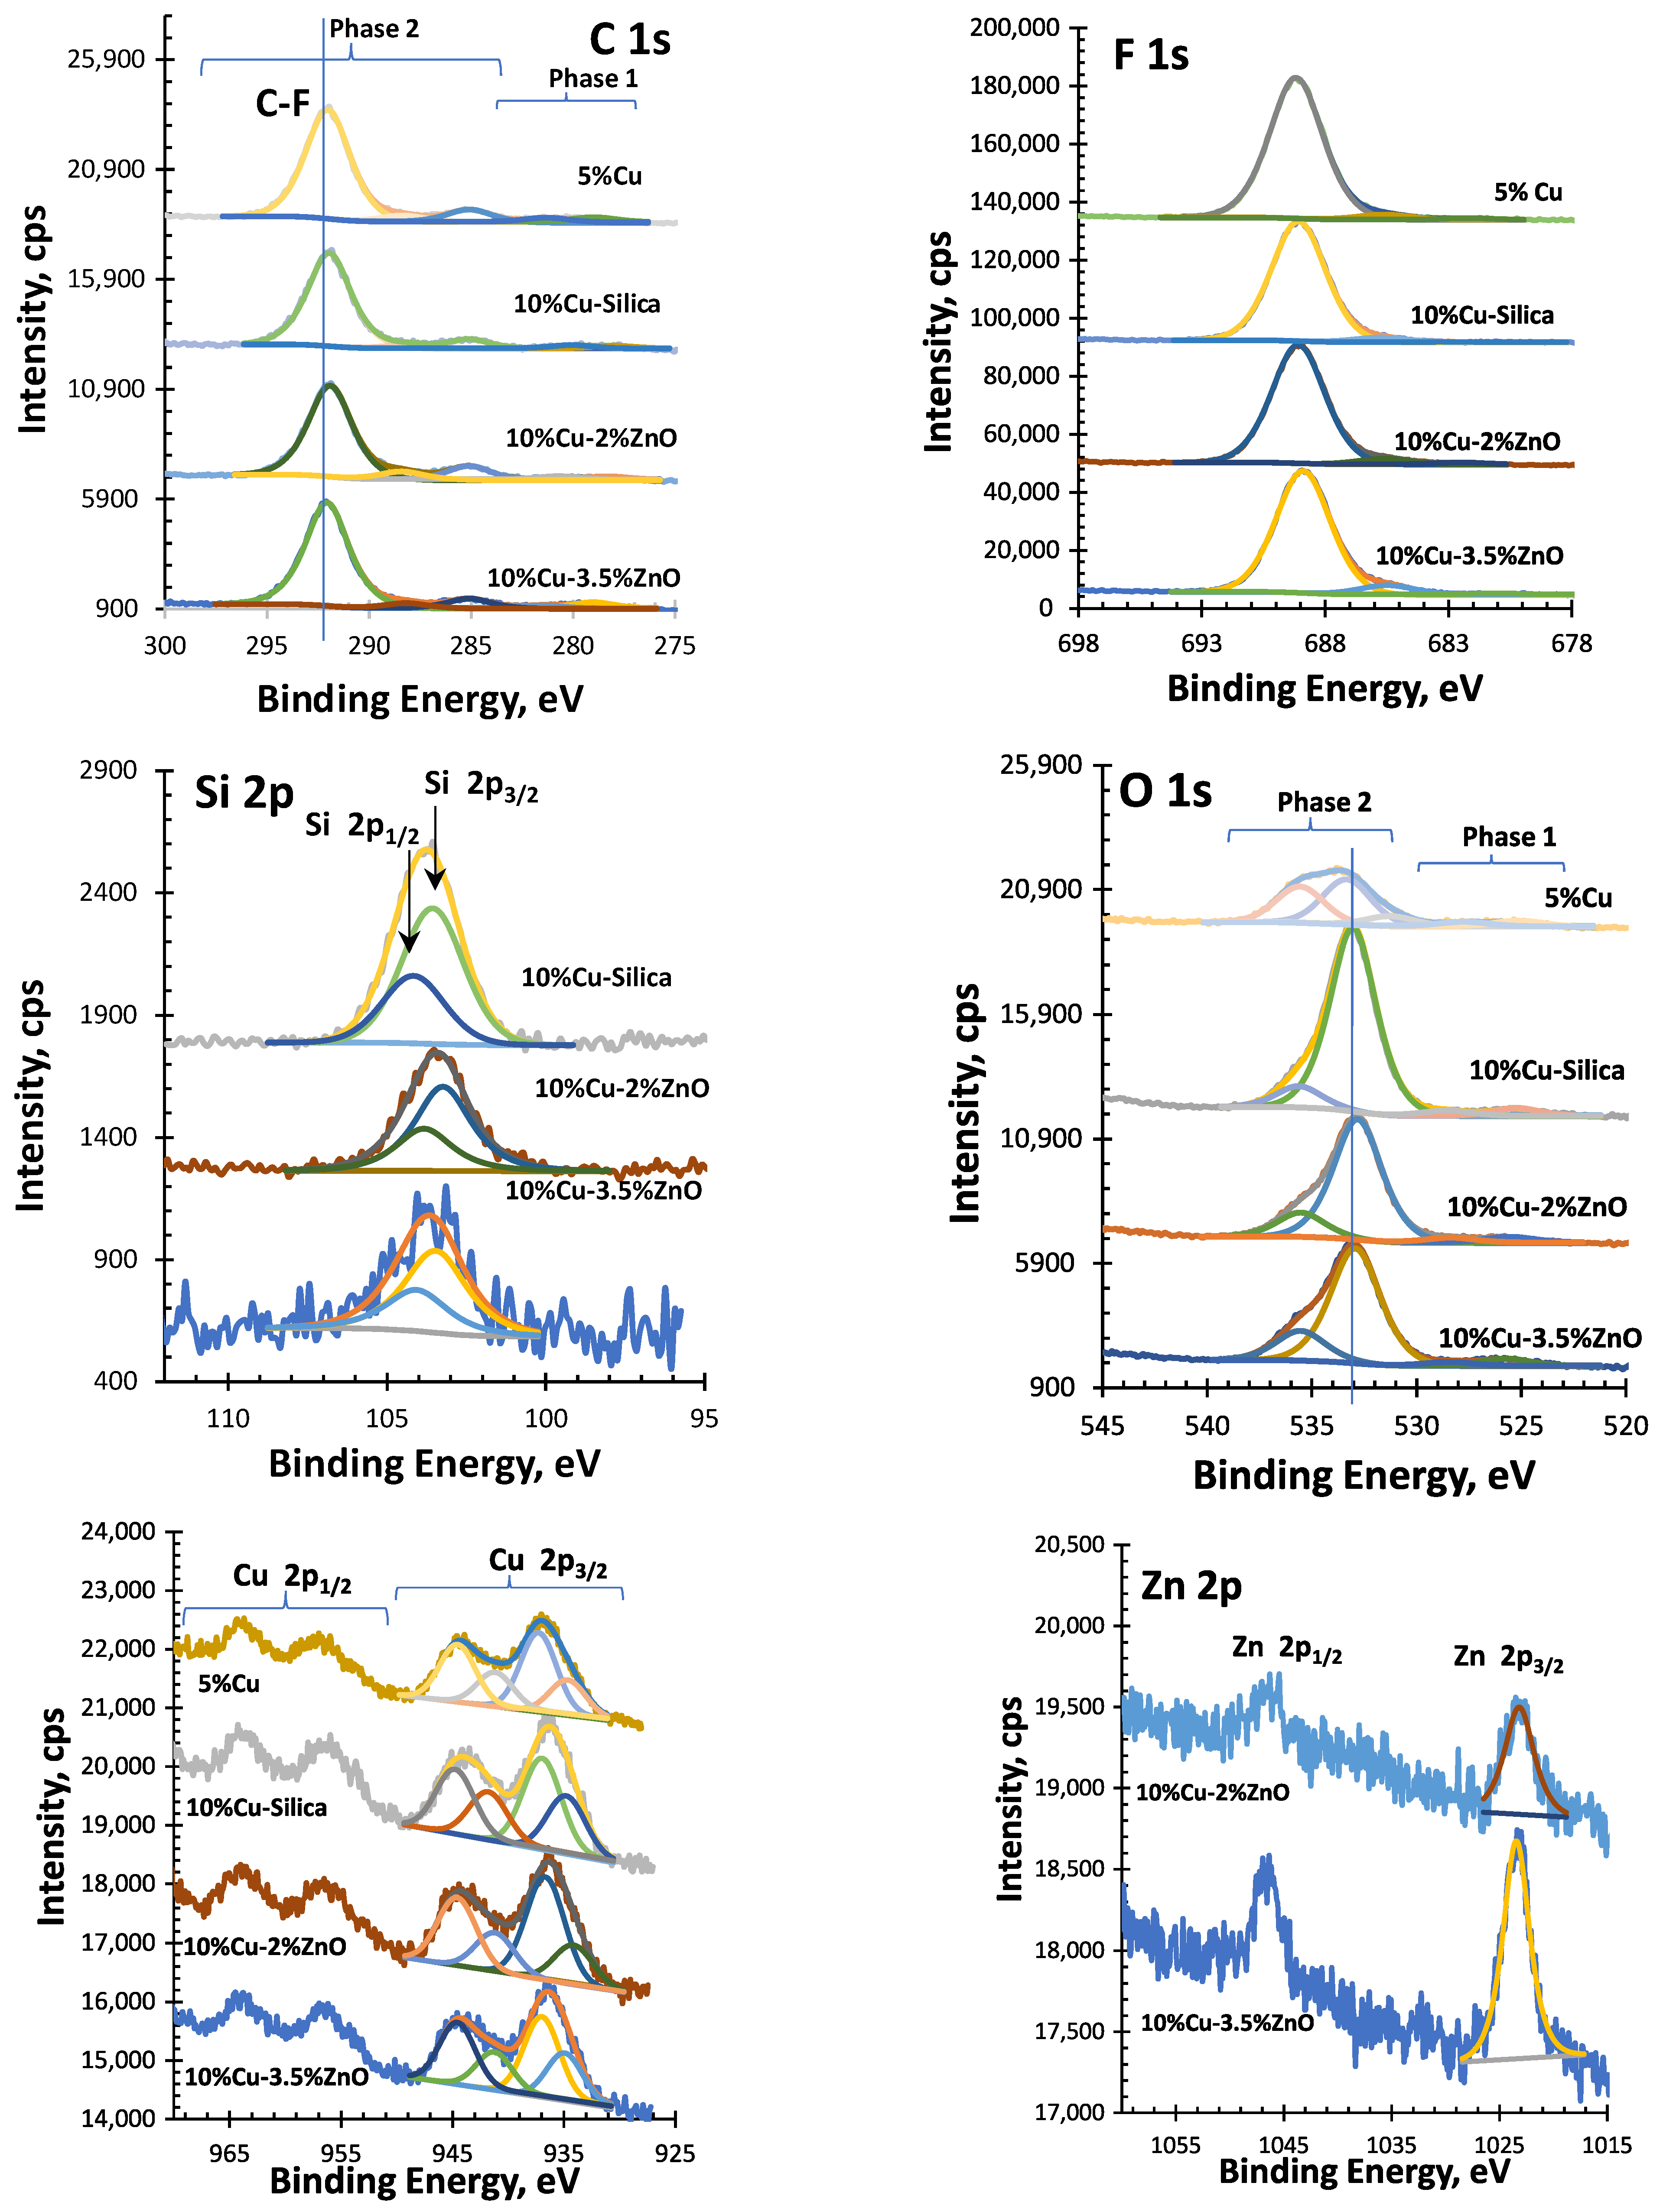
The electrodes prepared are characterized by XPS. Figure 3 shows the various detailed XPS regions, and respective fittings, for the four samples; 10% Cu-3.5% ZnO, 10% Cu-2% ZnO, 10% Cu-Silica and 5% Cu and Table 2 the positions and corresponding atomic percentages for the fitted peaks.
C 1s spectral profile suggests strongly the existence of two regions with distinctive conductivities and having a poor electrical contact between them. These different charge shifts arise from differential surface charging during XPS analysis, with the more conductive regions partially dissipating photoinduced charge, while insulating regions accumulate charge and exhibit larger apparent binding-energy shifts. One of them is more conductive (phase 1), presenting a charge accumulation leading to a charge shift around 1.2 eV; and the other one (phase 2) is much more insulating and the consequent charge accumulation gives a charge shift around 7.5 ± 0.5 eV. In Table 1, the binding energies (BE) were computed correcting the peaks in phase 1 and phase 2 with the respective charge shifts.
The dominant feature in the C 1s region is the peak at a BE ~ 292.0 eV (after correcting the experimental value with the charge shift of the phase 2), assignable to Poly(tetrafluoroethylene) (PTFE) [24]. The presence of an intense peak in the F 1s region at a BE = 689 ± 0.2 eV, after identical correction, demonstrates that the dominant compound in phase 2 is PTFE. In the more conductive phase (phase 1), peaks are much less intense, rendering peak-fitting a difficult task, increasing the associated error both qualitatively and quantitatively. Also, oxygen peaks can be assigned to compounds both in phase 1 and in phase 2.
Silicon, zinc, and copper (co)exist in phase 2. Si 2p is a doublet peak with a spin–orbit separation of 0.61 eV and the main component of the doublet, Si 2p3/2, centered at 103.4 ± 0.2 eV from silica. Zn 2p3/2 (the most intense peak from the doublet Zn 2p) is centered at 1023.3 ± 0.1 eV, and is assigned to Zn2+ in a very electronegative neighborhood. ZnO or Zn(OH)2 have been reported at ~1022.0 eV or ~1022.7 eV, respectively [26]. The higher experimental BE detected in this work is most probably due to the presence of fluorine. Cu 2p is also a doublet peak, with well-separated Cu 2p3/2 and Cu 2p1/2 components (nearly 20 eV apart). The detection of a multiplet structure between 940 eV and 950 eV and over 960 eV, which is typical of transition metals with unpaired valence electrons, attests the presence of Cu2+. The peak centered at 934.6 ± 0.4 eV may include CuO and Cu(OH)2 eV and the main peak centered at 937.0 ± 0.3 eV has been reported as CuF2 [26]. Table S1 shows total atomic percentages as well as some atomic ratios.
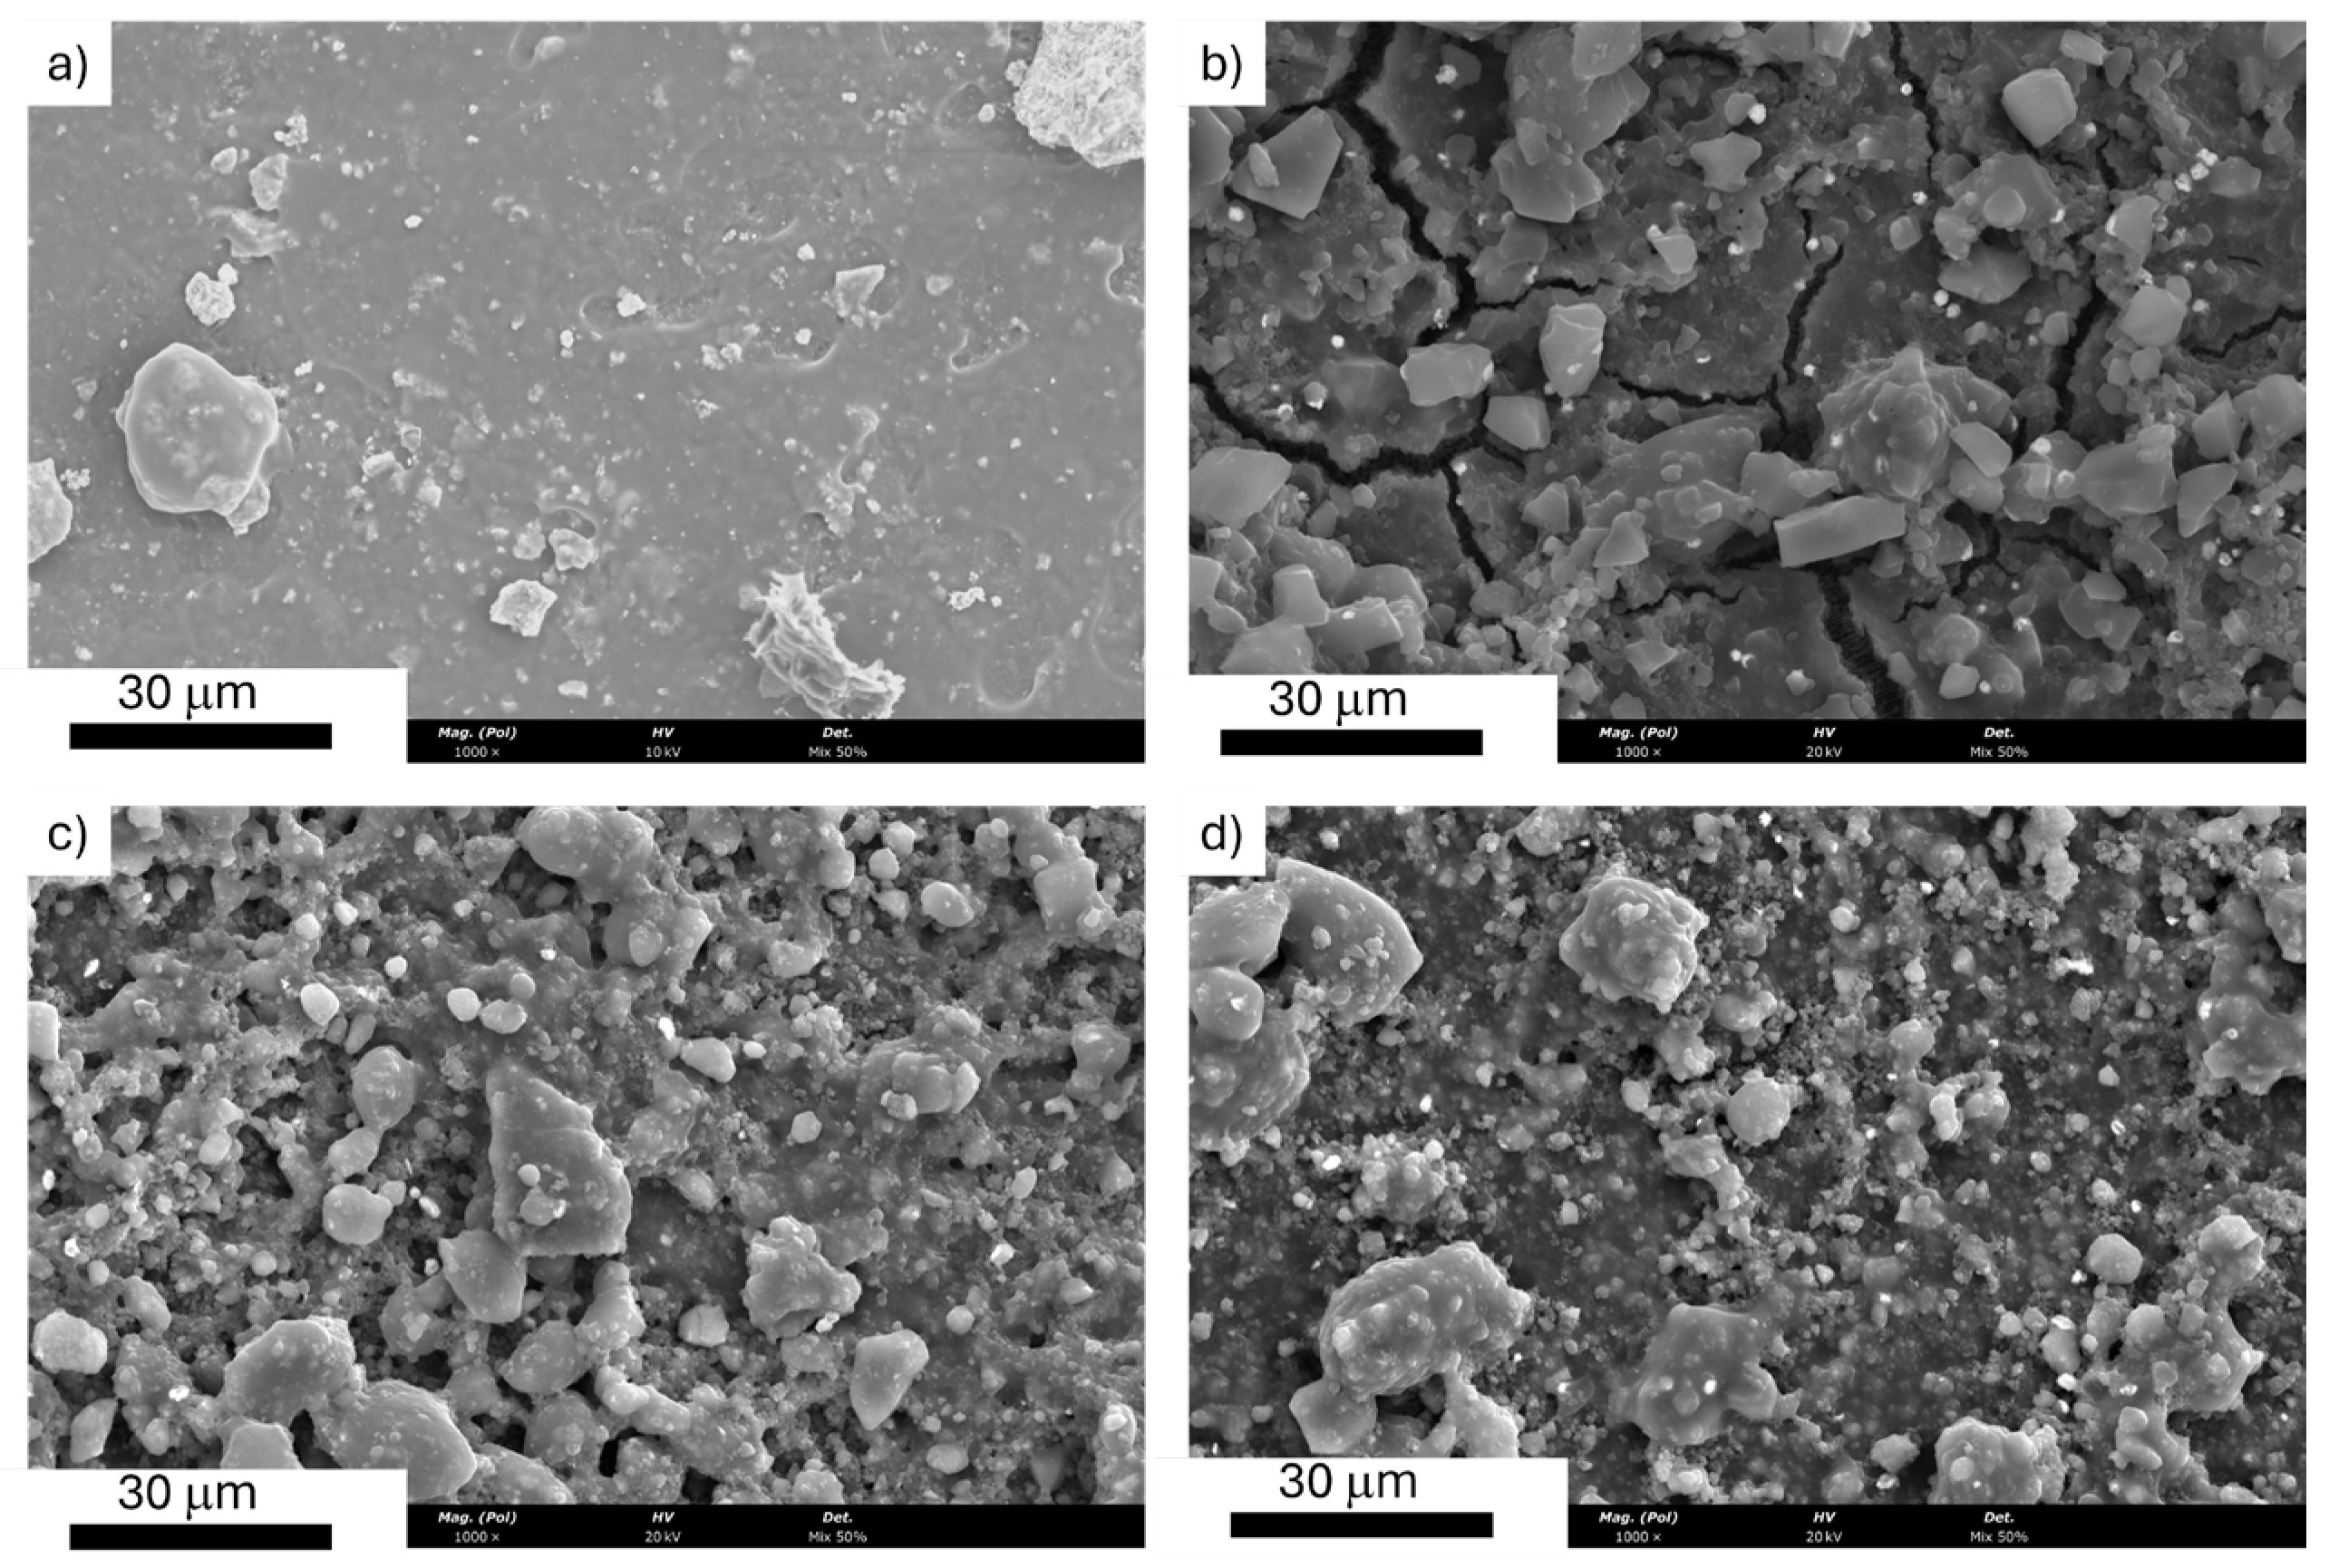
Figure 4 presents the SEM images of the synthesised coatings: (a) 5% Cu, (b) 10% Cu–SiO2, (c) 10% Cu–2% ZnO, and (d) 10% Cu–3.5% ZnO. These images, together with the corresponding EDS data, provide insights into the influence of composition on surface microstructure and elemental distribution.
The 5% Cu coating (Figure 4a, Figures S1a and S2a) shows a relatively smooth and continuous surface with sparse micro-scale agglomerates and limited particle clustering. The morphology suggests a catalyst layer in which Cu is moderately dispersed, consistent with the lower metal loading. Only a few larger particles protrude from the surface.
In contrast, the 10% Cu–SiO2 material (Figure 4b, Figures S1b and S2b) exhibits a markedly rougher and more heterogeneous surface. The coating consists of angular and irregular Cu-containing domains distributed across a cracked matrix. The presence of pronounced grain boundaries and larger aggregates suggests incomplete dispersion of Cu within the silica support, yielding distinct Cu-rich regions. This granular and fractured morphology is characteristic of Cu–SiO2 composites produced by impregnation or sol–gel routes, where phase separation can occur during drying and thermal treatment.
The introduction of 2% ZnO (Figure 4c, Figures S1c and S2c) results in a more densely textured microstructure, comprising small, tightly packed granules and larger agglomerates. The coating appears significantly rougher than the undoped 10% Cu–SiO2 sample, with an increased density of nucleation sites and partially coalesced particles. The heterogeneity observed at the micrometre scale is consistent with the coexistence of Cu-rich and oxide-rich regions, indicating that ZnO promotes additional surface structuring but remains unevenly distributed at this dopant level.
Increasing the ZnO content to 3.5% (Figure 4d, Figures S1d and S2d) produces a more compact and uniform coating. Spheroidal aggregates are homogeneously dispersed across the surface, and the granular texture appears more interconnected than in the 2% ZnO sample. The overall morphology suggests improved mixing or co-assembly of Cu and ZnO during preparation, yielding a coating with fewer large agglomerates and a more continuous microstructure. The denser particle network may contribute to enhanced mechanical stability.
EDS analysis (Supplementary Material) indicates that the coating is primarily composed of C, O, F, Zr (for the 5% Cu sample) and Cu.
The occurrence of fluorine and carbon is attributed to fluorocarbon residues or precursor decomposition products, while trace Pd and Au derive from the sample preparation for SEM. Overall, the 5% Cu layer forms a homogeneous, thin coverage with limited Cu agglomeration. In contrast, the 10% Cu–SiO2 coating exhibits a more heterogeneous and granular surface, featuring prominent micro- and nano-sized clusters dispersed within a crack-networked matrix. The irregularly shaped particles, ranging from sub-micrometer to several micrometers, correspond to Cu-rich domains embedded within a silica matrix.
EDS confirms this morphological duality: Cu concentration varies from 3.7 wt% to 64.1 wt%, whereas Si and O dominate in other regions (up to 37 wt%). The coexistence of these domains suggests incomplete dispersion of copper during synthesis, leading to localized Cu aggregation within the SiO2 network. Such phase separation is typical for sol–gel or impregnation-derived Cu–SiO2 composites and can enhance catalytic behavior by generating interfacial Cu–O–Si active sites. The 10% Cu-2% ZnO surface exhibits a rougher, more textured morphology composed of fine, closely packed granules and larger agglomerates. These structural features indicate partial sintering or particle coalescence during thermal treatment.
EDS analyses across eight regions reveal a highly variable Cu content (3.9–64.0 wt%), reflecting uneven dispersion and the formation of Cu-enriched micro-islands. Oxygen and silicon remain major components (12–39 wt% and 13–35 wt%, respectively), while Zn appears in minor amounts (<2 wt%). The data confirm the coexistence of Cu-rich and oxide-rich regions, consistent with a heterogeneous Cu–SiO2–ZnO composite. The moderate Zn signal suggests that ZnO is dispersed at or below the detection limit in many areas, potentially forming nanostructured mixed-oxide interfaces beneficial for redox processes. The micrograph of the 10% Cu–3.5% ZnO coating displays a densely packed granular morphology with uniformly distributed spheroidal particles. Compared with the 2% ZnO sample, this material appears more homogeneous and compact, implying improved mixing or co-precipitation of Cu and ZnO phases.
EDS data show Cu concentrations ranging from 4.2 wt% to 56.8 wt%, with Zn up to 6.5 wt%, and significant O and Si contributions (≈10–33 wt% and 11–30 wt%). The presence of fluorine (9–35 wt%) is related with the binder used, in this case a Nafion ionomer. These observations indicate the formation of Cu–ZnO composite domains embedded within a SiO2-based matrix, providing a more stable and interconnected surface microstructure compared to lower ZnO loadings.
Cross-sectional SEM images of the catalyst layers (Figures S3 and S4) allowed direct measurement of coating thickness for each formulation. The 5% Cu sample (Figures S3 and S4a) exhibits an average thickness of approximately 58.5 µm, forming a relatively compact layer with limited macroporosity. Increasing the Cu loading to 10% on SiO2 (Figures S3 and S4b) results in a noticeably thicker coating of about 68.7 µm, consistent with the more granular and heterogeneous surface morphology observed in Figure 4. The 10% Cu–2% ZnO material (Figures S3 and S4c) displays a comparable, slightly reduced thickness of 64.8 µm, suggesting that partial ZnO incorporation does not significantly alter the deposition density but may influence internal packing. The thickest layer corresponds to the 10% Cu–3.5% ZnO coating (Figures S3 and S4d), reaching approximately 69.6 µm. This increase is in line with the more uniform and compact granular structure observed for this composition, which promotes denser accumulation during spray-coating.
X-ray diffraction (XRD) patterns of the prepared GDEs are provided in the Supplementary Materials (Figure S5) for qualitative comparison. Due to the use of aluminum sample holders and the thin, composite nature of the catalyst layers deposited on gas diffusion substrates, strong diffraction peaks from the holder overlap with catalyst reflections, preventing reliable phase identification and crystallite size determination. Consequently, XRD data are not used for quantitative analysis in this work, and structural conclusions are primarily based on XPS, SEM, and EDS results.

3.2. Effect of the Cu Loading and Nanoparticle Support

The first part of the results focuses on evaluating the effect of both copper loading and the nanoparticle support on the electrochemical conversion of CO2 to ethanol. For this comparison, catalysts supported on silica and zirconia with copper loadings of 10% and 5%, respectively, were used. Both materials were tested under three different current densities to assess their efficiency in ethanol production.
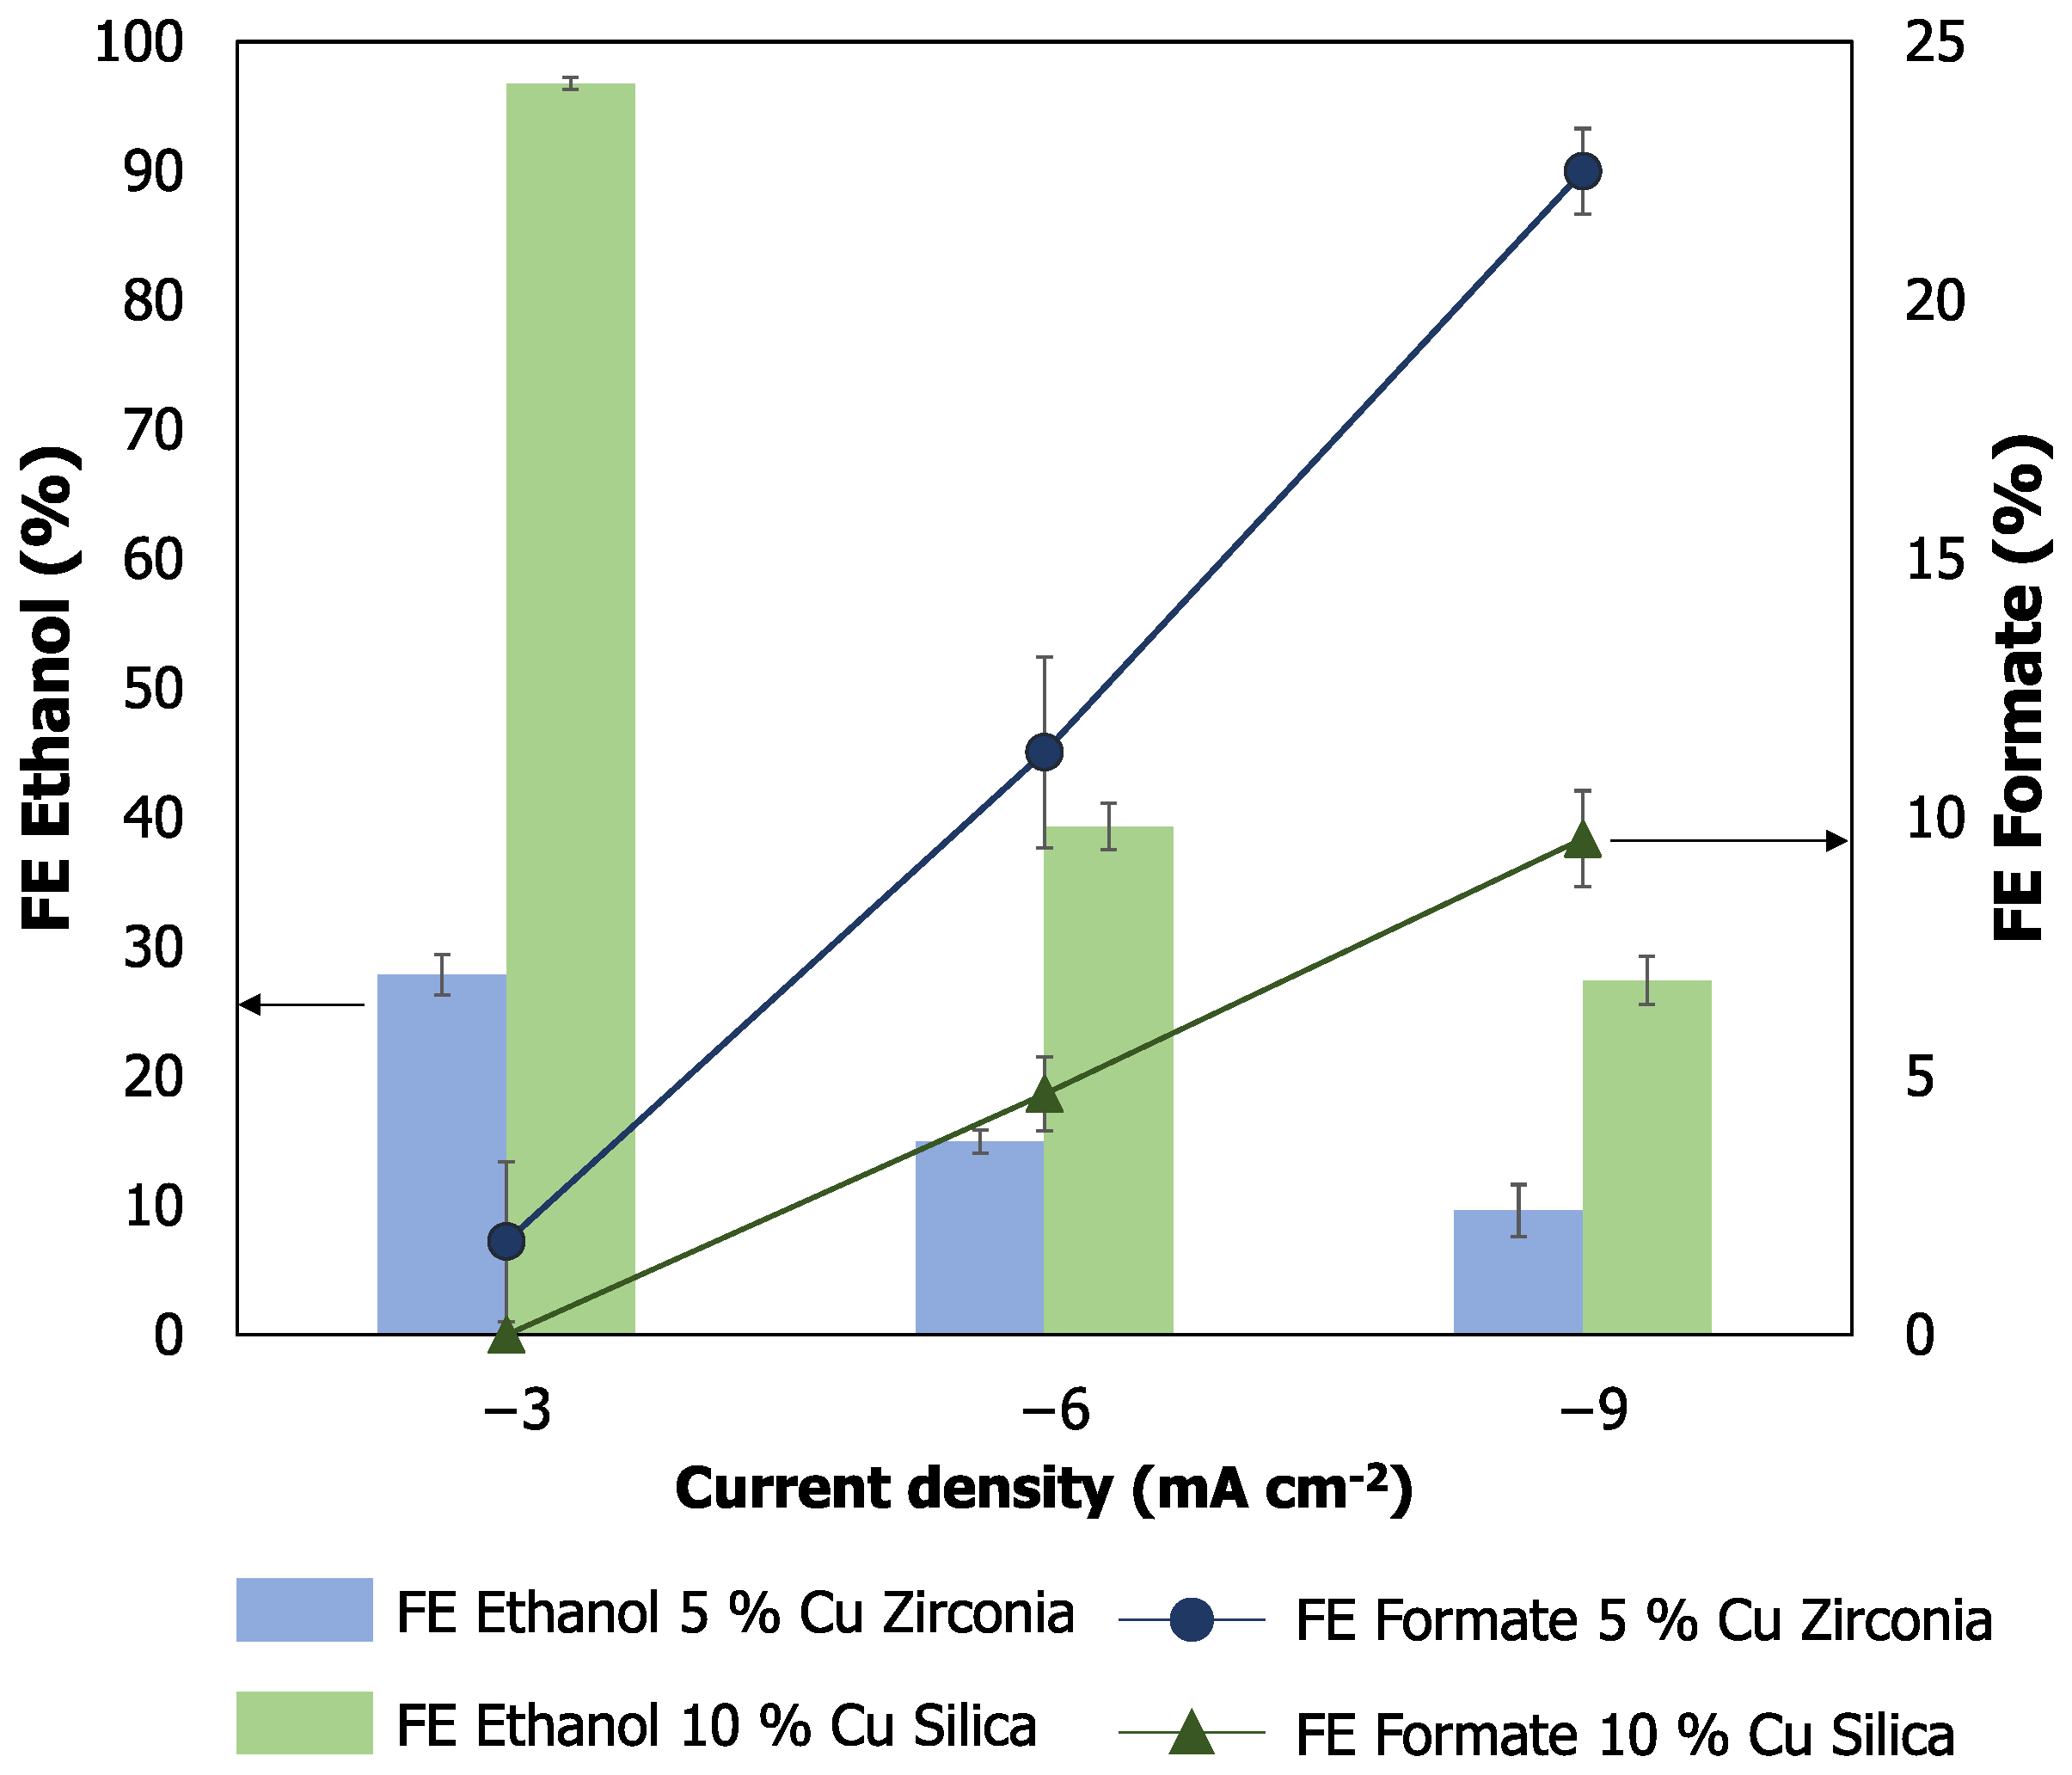
As observed in Figure 5, the best ethanol conversion results were obtained using nanoparticles with a 10% Cu loading supported on SiO2. In contrast, the 5% Cu supported on ZrO2 catalyst achieves a maximum FE of 27.8% for ethanol production at a current density of −3 mA cm−2. However, as the current density increases, ethanol production is negatively affected, with its FE dropping to 9.6%. Meanwhile, formate production becomes more favorable, reaching a FE of 22.5% at −9 mA cm−2.
For the 10% Cu on SiO2 catalyst, high FEs toward ethanol were achieved, particularly at −3 mA·cm−2, reaching up to 96.7%, with no detectable formate formation as a competing product. As the current density increases, a decline in ethanol FE was observed, dropping to 27.4%, while the remainder remained below 10%. Nevertheless, these results remain highly competitive compared to those obtained with the 5% Cu on ZrO2 catalyst.
The difference in catalyst performance can be attributed primarily to two factors: copper loading and the nanoparticle support material. Regarding copper loading, a higher number of adjacent active sites facilitates the coupling of CO reaction intermediates [10], promoting the formation of C–C bonds required for ethanol production (Figure 1). Additionally, the use of silica as a nanoparticle support may play a crucial role in determining product selectivity. Silica’s ability to adsorb CO2 [27] can help stabilize key reaction intermediates, thereby facilitating the C–C coupling necessary for ethanol formation [28]. Additionally, the larger surface area observed in the physicochemical characterization of the 10% Cu-SiO2 GDEs compared to the 5% Cu, facilitates the CO2 adsorption and the exposure of more active sites for the CO2 reduction to ethanol.
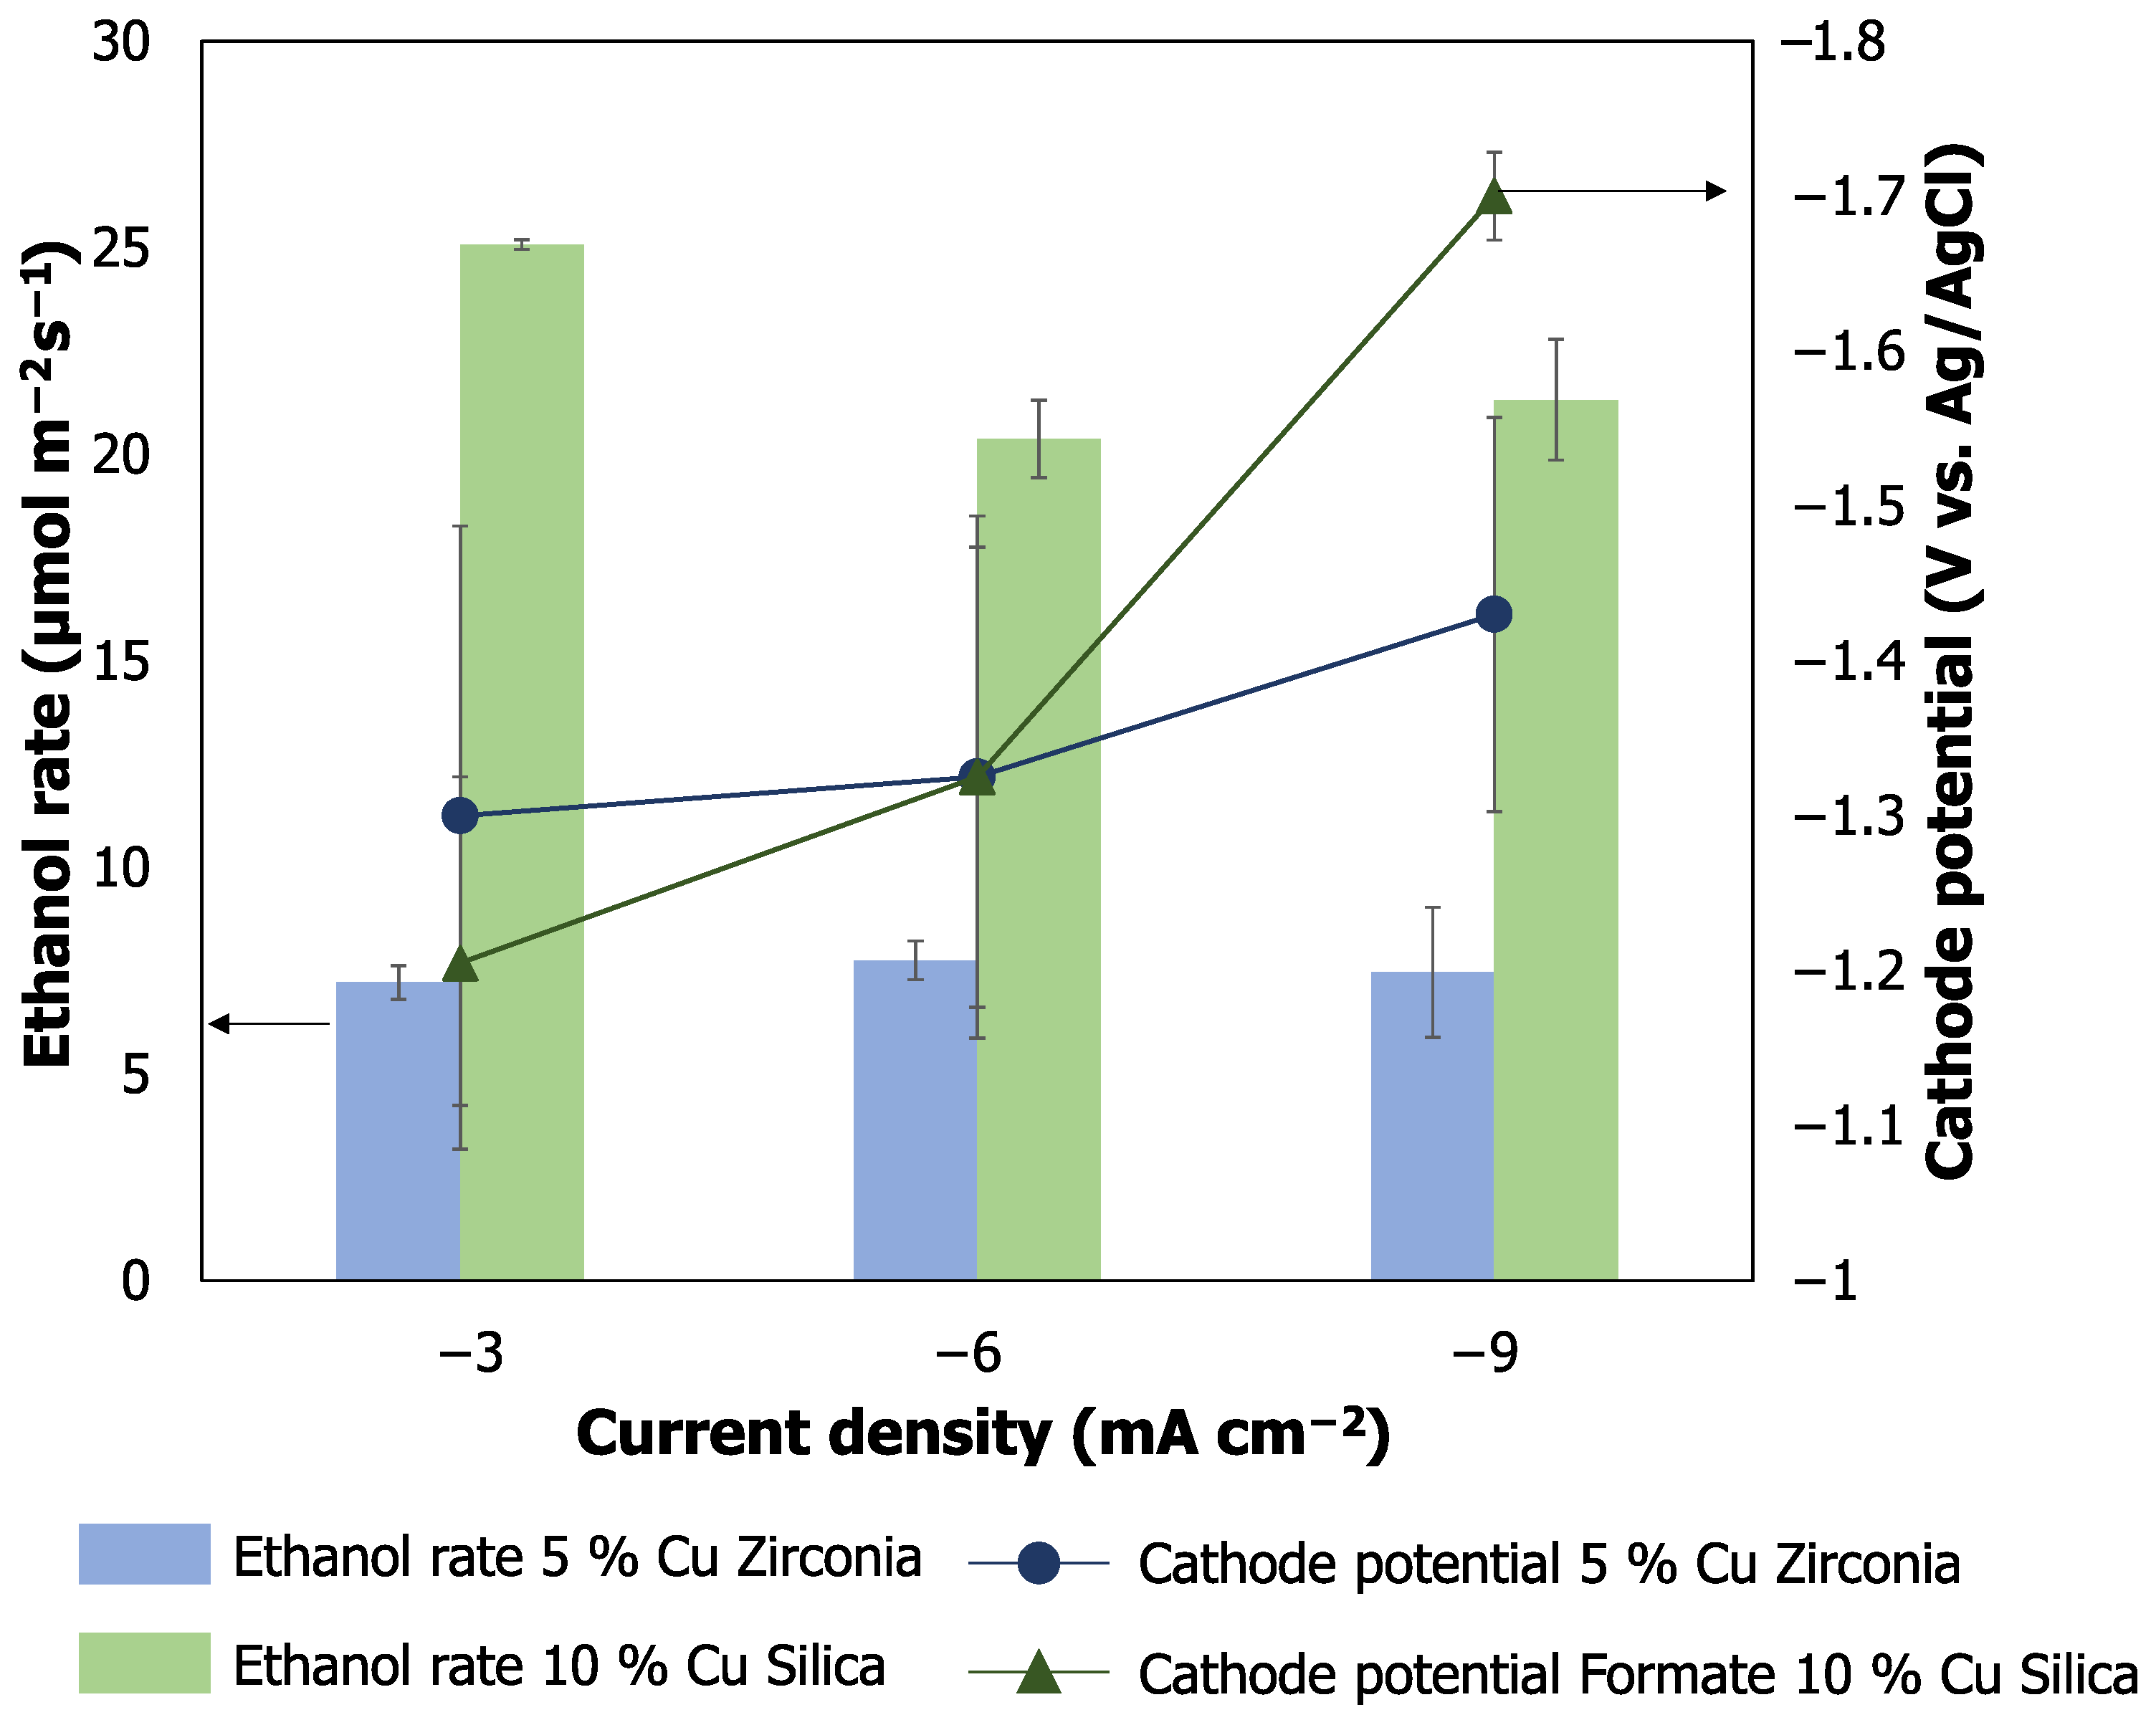
The impact on the ethanol production rate and cathode potential is further examined in Figure 6.
As shown in Figure 6, similar to the FE results, the 10% Cu on SiO2 catalyst exhibits a significantly higher ethanol production rate, reaching peak values of 25 µmol m−2 s−1, compared to only 7.75 µmol m−2 s−1 obtained with the 5% Cu on ZrO2 catalyst. However, as the current density increases, no significant change is observed in the reaction rates, which remain nearly constant despite the higher electron flow.
This behavior may be attributed to the reaction’s selectivity, which is partially governed by the applied cathodic potential. Literature reports indicate that maximum ethanol production typically occurs at negative potentials around −1.2 V vs. Ag/AgCl (−0.59 V vs. RHE) [29,30]. This aligns with our results, where the highest ethanol yield was obtained using the 10% Cu on SiO2 catalyst operating at 3 mA cm−2 and a cathodic potential of −1.2 V vs. Ag/AgCl. As the current density increases for both catalysts, the cathodic potential becomes more negative, shifting the reaction selectivity toward other products such as formate, as shown in Figure 1, where FE for formate increases with current density, or favoring competing reactions to CO2 electroreduction, such as the HER [31].

3.3. ZnO as Dopant

The next step involved testing Cu-based materials doped with varying proportions of ZnO under the same experimental conditions as the previously studied catalysts.
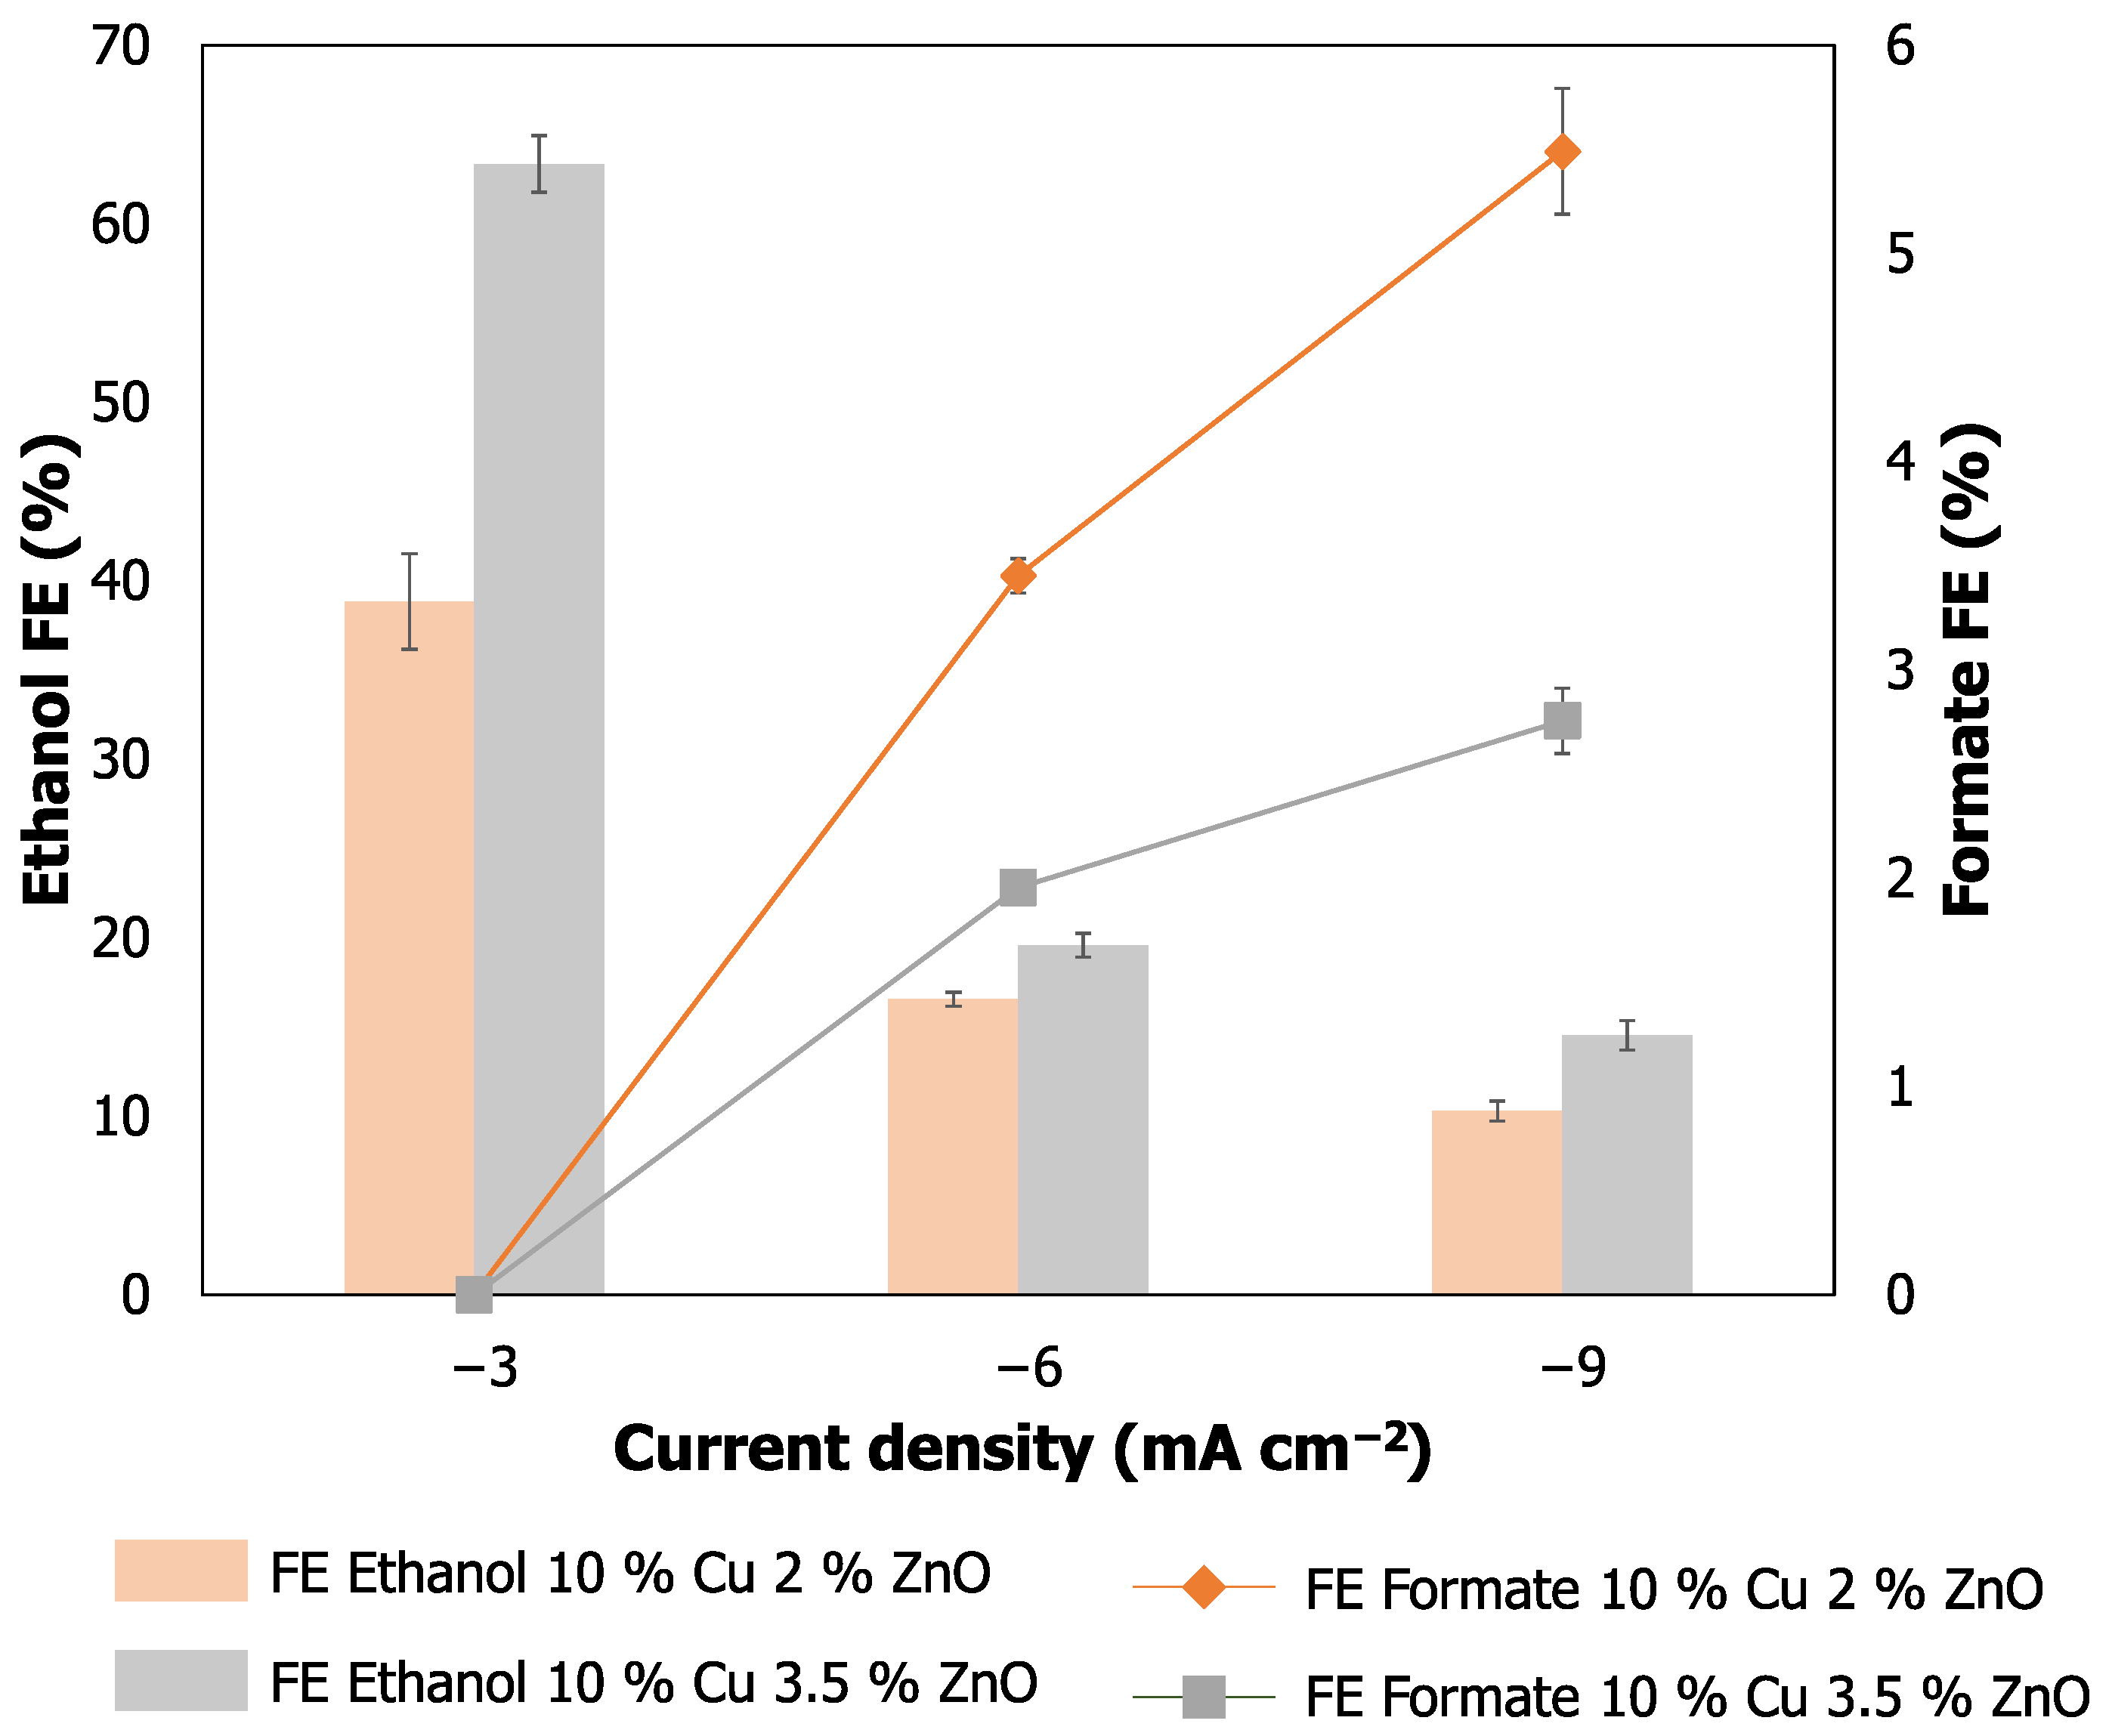
In this case, the ZnO dopant loading has a clear impact on CO2 electroreduction to ethanol (Figure 7). Higher ZnO content enhances the FE, reaching up to 63.4% for the 10% Cu–3.5% ZnO catalyst operating at 3 mA cm−2, compared to 38.8% for the 10% Cu–2% ZnO catalyst under the same conditions. Consistent with previous observations, as the current density increases, the FE for ethanol decreases, while the FE for other products, such as formate, increases.
The addition of ZnO promotes adsorption of the reaction intermediate *CO on the catalyst nanoparticles, facilitating C–C bond formation at the active Cu sites and enhancing the production of C2+ products. Therefore, higher ZnO loading improves the adsorption of these intermediates, resulting in increased FE toward ethanol, as shown in Figure 7. However, when compared to the undoped catalyst (Figure 5), ZnO-doped materials exhibit lower ethanol conversion efficiency.
Several studies suggest that the amount of ZnO doping is critical for tuning selectivity toward C2+ products [32,33,34,35]. In general, ZnO improves C2+ product formation [22]; reducing competing formate production compared to undoped catalysts. Ethanol formation is often favored by higher ZnO loadings or by the formation of a core–shell structure within the nanoparticles, as determined in the physicochemical characterization of the GDES, in which it can be seen that increasing the ZnO doping percentage results in a better distribution of the spherical aggregates on the catalyst surface. In the present case, the ZnO content may be insufficient to maximize ethanol formation and could instead enhance selectivity toward other gaseous C2 products, such as ethylene, or even CH4 [32].
Another factor affecting ethanol selectivity using ZnO-doped catalysts is the operating cathodic potential. ZnO addition slightly increases the cathodic potential relative to undoped catalysts, which may shift the system outside the optimal potential window for CO2-to-ethanol conversion. For instance, at current densities of −3 and −6 mA cm−2, the ZnO-doped catalysts operate at −1.25 V and −1.4 V vs. Ag/AgCl (−0.63 and −0.8 vs. RHE), respectively, whereas the 10% Cu on SiO2 catalyst operates at −1.2 V and −1.3 V vs. Ag/AgCl (−0.59 and −0.71 vs. RHE) under the same conditions.

3.4. Comparison with the State-of-the-Art Materials for the ERCO2 to Ethanol

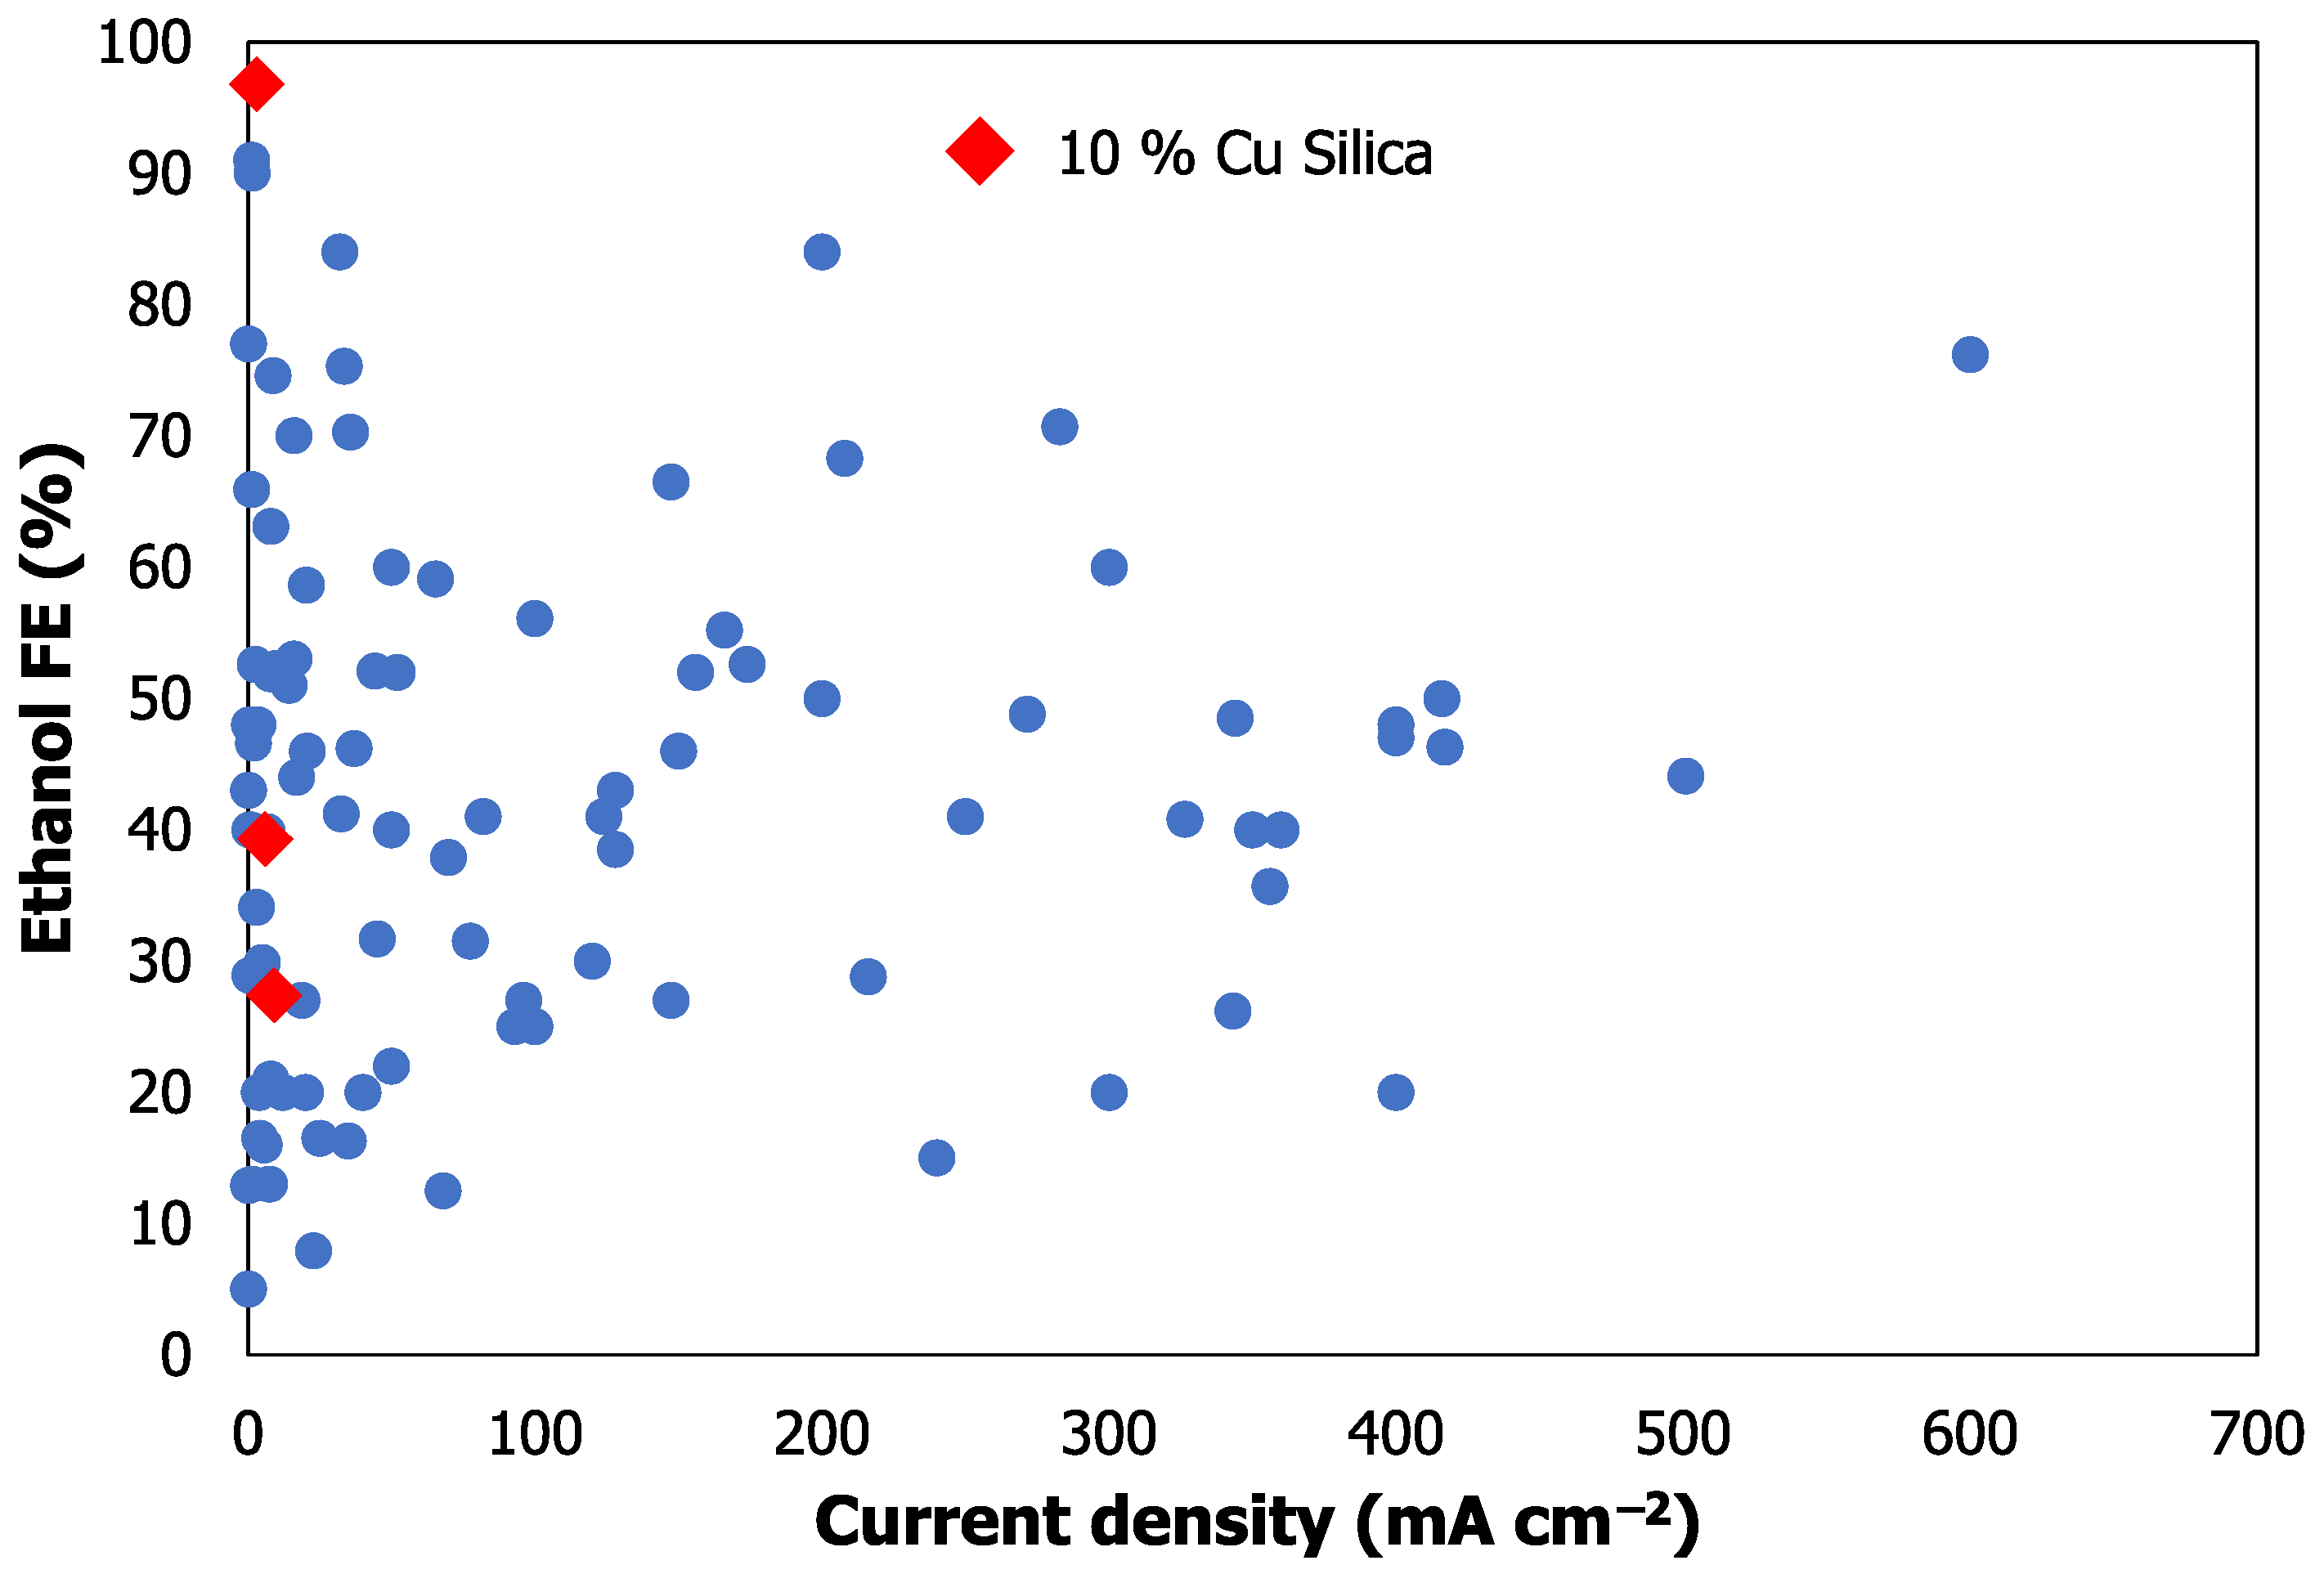
The direct production of ethanol from the electroreduction of CO2 has attracted significant attention recently. Consequently, various strategies have been proposed to achieve its conversion, mainly focused on the materials employed. Primarily based on Cu, the different catalyst development approaches center on its alloying with other metallic elements to create bimetallic catalysts, its support on non-metallic materials, or its doping with other materials in smaller proportions [36]. In this context, the most relevant recent studies are reviewed and their performance is compared with the materials used in this work, considering the trade-off between FE and current density, as shown in Figure 8.
As can be observed, the results obtained with the 10% Cu on SiO2 nanoparticles show a higher FE compared to the materials previously reported in the literature, since at a current density of 3 mA·cm−2 a conversion efficiency toward ethanol of 96% is achieved. Despite these promising results, the trade-off between FE and current density is not optimal, as a slight increase in current density with this material leads to a significant decrease in FE. In contrast, other materials tested in the literature manage to maintain higher FE values at higher current densities. In this regard, the operation of CO2 electroreduction to ethanol with these Cu-supported SiO2 materials must be improved, as potential optimization of the GDE composition, catalyst loading, ionomer, and other operational aspects, such as cell configuration, electrolytes, or the membrane used, could allow these promising CO2-to-ethanol conversion results to be sustained at higher current densities.

4. Conclusions

Electrochemical CO2 reduction to ethanol is a promising route for sustainable fuel production, but achieving high selectivity and stability under practical conditions remains challenging. In this study, Cu-based catalysts supported on SiO2 and ZrO2, with and without ZnO doping, are evaluated to improve ethanol formation. XPS confirms Cu2+ species and Zn2+ in doped samples, while SEM shows clear morphological differences: the undoped 10% Cu–SiO2 catalyst exhibits a granular structure, whereas ZnO doping (up to 3.5%) produces more compact coatings with uniformly distributed aggregates, suggesting better stability and active site dispersion. Electrochemical tests reveal that 10% Cu–SiO2 achieves an impressive FE of 96% for ethanol at −3 mA cm−2, outperforming doped and literature-reported materials, though FE drops sharply at higher current densities, highlighting the selectivity–productivity trade-off. ZnO doping improves C2+ formation and surface structuring but does not surpass the undoped catalyst in ethanol selectivity, likely due to shifts in cathodic potential. These findings emphasize the role of catalyst composition, Cu loading, and support interactions. Future work will focus on optimizing GDE architecture, catalyst layer thickness, ionomer distribution, and operational parameters to maintain high ethanol yields under industrial conditions. Overall, this study connects physicochemical characterization with catalytic performance, offering guidelines for next-generation Cu-based electrodes for efficient CO2-to-ethanol conversion.

Supplementary Materials

The following supporting information can be downloaded at: https://www.mdpi.com/article/10.3390/en19020354/s1, Table S1: Total atomic percentages and relevant atomic ratios; Figure S1: SEM images at 200/210x magnifications of (a) 5% Cu, (b) 10% Cu on SiO2 (c) 10%Cu 2% ZnO (d) 10% Cu 3.5% ZnO; Figure S2: SEM images at 3000x magnifications of (a) 5% Cu, (b) 10%Cu on SiO2 (c) 10%Cu 2% ZnO (d) 10% Cu 3.5% ZnO; Table S2: EDS analysis (atomic concentration) of the 5% Cu sample; Table S3: EDS analysis (weight concentration) of the 5% Cu sample; Table S4: EDS analysis (atomic concentration) of the 10% Cu silica sample; Table S5: EDS analysis (weight concentration) of the 10% Cu silica sample; Table S6: EDS analysis (atomic concentration) of the 10% Cu 2% ZnO sample; Table S7: EDS analysis (weight concentration) of the 10% Cu 2% ZnO sample; Table S8: EDS analysis (atomic concentration) of the 10% Cu 3.5% ZnO sample; Table S9: EDS analysis (weight concentration) of the 10% Cu 3.5% ZnO sample; Figure S3: Cross-sectional SEM images of (a) 5% Cu, (b) 10% Cu on SiO2 (c) 10% Cu 2% ZnO (d) 10% Cu 3.5% ZnO; Figure S4: Cross-sectional SEM images of (a) 5% Cu, (b) 10% Cu on SiO2 (c) 10% Cu 2% ZnO (d) 10% Cu 3.5% ZnO; Figure S5: XRD of the 5% Cu, 10%Cu on SiO2 10%Cu 2% ZnO and 10% Cu 3.5 % ZnO electrodes.

Author Contributions

Conceptualization, J.A.A. and G.D.-S.; methodology, J.A.A. and G.D.-S.; validation, J.A.A. and G.D.-S.; formal analysis, P.N.M. and S.R.; investigation, J.A.A. and G.D.-S.; resources, G.D.-S. and A.I.; data curation, J.A.A., G.D.-S., A.M.F., A.M.B.d.R., P.N.M. and S.R.; writing—original draft preparation, J.A.A., P.N.M. and S.R.; writing—review and editing, G.D.-S., A.I., A.M.F., A.M.B.d.R., P.N.M. and S.R.; supervision, G.D.-S. and A.I.; project administration, G.D.-S. and A.I.; funding acquisition, G.D.-S. and A.I. All authors have read and agreed to the published version of the manuscript.

Funding

This research was funded by CETPartnership, the Clean Energy Transition Partnership under the 2023 joint call for research proposals, co-funded by the European Commission (GA N°101069750) and with the funding provided by the Spanish Research Agency through project PCI2024-155027-2, funded by MICIU/AEI/10.13039/501100011033. Centro de Química Estrutural (CQE) and Institute of Molecular Sciences (IMS) acknowledge the financial support of Fundação para a Ciência e Tecnologia (Projects UIDB/00100/2020: 10.54499/UIDB/00100/2020, UIDP/00100/2020: 10.54499/UIDP/00100/2020, and LA/P/0056/2020: 10.54499/LA/P/0056/2020 and UID/00100/2023). This work was also financed by national funds from FCT—Fundação para a Ciência e a Tecnologia, I.P., in the scope of the project UIDB/04565/2020 and UIDP/04565/2020 of the Research Unit Institute for Bioengineering and Biosciences—iBB and the project LA/P/0140/2020 of the Associate Laboratory Institute for Health and Bioeconomy—i4HB. P.N.M. thanks FCT for financial support grant PTDC/QUI-QIN/0252/2021: 10.54499/PTDC/QUI-QIN/0252/2021 and S.R. thanks FCT for the contract 2020.02134.CEECIND: 10.54499/2020.02134.CEECIND/CP1605/CT0002. P.N.M. acknowledges FCT for the contract 2023.15441.TENURE.003/CP00003/CT00011 and the co-financing by the PRR—Recovery and Resilience Plan of the European Union. J.A.A. gratefully acknowledges the predoctoral research grant (FPI) PRE2021-097200.

Data Availability Statement

The original contributions presented in this study are included in the article. Further inquiries can be directed to the corresponding author.

Conflicts of Interest

The authors declare no conflicts of interest.

References

  1. Khan, R.R.M.; Saleem, R.; Batool, S.S.; Rasheed, S.; Saeed, Z.; Pervaiz, M.; Younas, U.; Summer, M.; Liaqat, M. Electrochemical Reduction of CO2 to Liquid Products: Factors Influencing Production and Selectivity. Int. J. Hydrogen Energy 2025, 128, 800–832. [Google Scholar] [CrossRef] [Scilit]
  2. Dongare, S.; Singh, N.; Bhunia, H.; Bajpai, P.K.; Das, A.K. Electrochemical Reduction of Carbon Dioxide to Ethanol: A Review. ChemistrySelect 2021, 6, 11603–11629. [Google Scholar] [CrossRef] [Scilit]
  3. Jouny, M.; Luc, W.; Jiao, F. General Techno-Economic Analysis of CO2 Electrolysis Systems. Ind. Eng. Chem. Res. 2018, 57, 2165–2177. [Google Scholar] [CrossRef] [Scilit]
  4. Du, J.; Zhang, P.; Liu, H. Electrochemical Reduction of Carbon Dioxide to Ethanol: An Approach to Transforming Greenhouse Gas to Fuel Source. Chem. Asian J. 2021, 16, 588–603. [Google Scholar] [CrossRef] [Scilit] [PubMed]
  5. Lee, J.; Tak, Y. Electrocatalytic Activity of Cu Electrode in Electroreduction of CO2. Electrochim. Acta 2001, 46, 3015–3022. [Google Scholar] [CrossRef] [Scilit]
  6. Tang, W.; Peterson, A.A.; Varela, A.S.; Jovanov, Z.P.; Bech, L.; Durand, W.J.; Dahl, S.; Nørskov, J.K.; Chorkendorff, I. The Importance of Surface Morphology in Controlling the Selectivity of Polycrystalline Copper for CO2 Electroreduction. Phys. Chem. Chem. Phys. 2012, 14, 76–81. [Google Scholar] [CrossRef] [Scilit] [PubMed]
  7. Li, Y.; Sun, Q. Recent Advances in Breaking Scaling Relations for Effective Electrochemical Conversion of CO2. Adv. Energy Mater. 2016, 6, 1600463. [Google Scholar] [CrossRef] [Scilit]
  8. Mistry, H.; Behafarid, F.; Reske, R.; Varela, A.S.; Strasser, P.; Roldan Cuenya, B. Tuning Catalytic Selectivity at the Mesoscale via Interparticle Interactions. ACS Catal. 2016, 6, 1075–1080. [Google Scholar] [CrossRef] [Scilit]
  9. Zhang, W.; Hu, Y.; Ma, L.; Zhu, G.; Wang, Y.; Xue, X.; Chen, R.; Yang, S.; Jin, Z. Progress and Perspective of Electrocatalytic CO2 Reduction for Renewable Carbonaceous Fuels and Chemicals. Adv. Sci. 2018, 5, 1700275. [Google Scholar] [CrossRef] [Scilit]
  10. Kim, D.; Kley, C.S.; Li, Y.; Yang, P. Copper Nanoparticle Ensembles for Selective Electroreduction of CO2 to C2–C3 Products. Proc. Natl. Acad. Sci. USA 2017, 114, 10560–10565. [Google Scholar] [CrossRef] [Scilit]
  11. Tomboc, G.M.; Choi, S.; Kwon, T.; Hwang, Y.J.; Lee, K. Potential Link between Cu Surface and Selective CO2 Electroreduction: Perspective on Future Electrocatalyst Designs. Adv. Mater. 2020, 32, 1908398. [Google Scholar] [CrossRef] [Scilit]
  12. Shi, C.; Chan, K.; Yoo, J.S.; Nørskov, J.K. Barriers of Electrochemical CO2 Reduction on Transition Metals. Org. Process Res. Dev. 2016, 20, 1424–1430. [Google Scholar] [CrossRef] [Scilit]
  13. Tan, X.; Sun, K.; Zhuang, Z.; Hu, B.; Zhang, Y.; Liu, Q.; He, C.; Xu, Z.; Chen, C.; Xiao, H.; et al. Stabilizing Copper by a Reconstruction-Resistant Atomic Cu-O-Si Interface for Electrochemical CO2 Reduction. J. Am. Chem. Soc. 2023, 145, 8656–8664. [Google Scholar] [CrossRef] [Scilit]
  14. Zhao, T.; Li, J.; Liu, J.; Liu, F.; Xu, K.; Yu, M.; Xu, W.; Cheng, F. Tailoring the Catalytic Microenvironment of Cu2O with SiO2 to Enhance C2+ Product Selectivity in CO2 Electroreduction. ACS Catal. 2023, 13, 4444–4453. [Google Scholar] [CrossRef] [Scilit]
  15. Wang, M.; Wang, Z.; Huang, Z.; Fang, M.; Zhu, Y.; Jiang, L. Hydrophobic SiO2 Armor: Stabilizing Cuδ+ to Enhance CO2 Electroreduction toward C2+ Products in Strong Acidic Environments. ACS Nano 2024, 18, 15303–15311. [Google Scholar] [CrossRef] [Scilit]
  16. Li, X.; Liu, Q.; Wang, J.; Meng, D.; Shu, Y.; Lv, X.; Zhao, B.; Yang, H.; Cheng, T.; Gao, Q.; et al. Enhanced Electroreduction of CO2 to C2+ Products on Heterostructured Cu/Oxide Electrodes. Chem 2022, 8, 2148–2162. [Google Scholar] [CrossRef] [Scilit]
  17. Wang, D.; Li, L.; Xia, Q.; Hong, S.; Hao, L.; Robertson, A.W.; Sun, Z. Boosting CO2 Electroreduction to Multicarbon Products via Tuning of the Copper Surface Charge. ACS Sustain. Chem. Eng. 2022, 10, 11451–11458. [Google Scholar] [CrossRef] [Scilit]
  18. Merino-Garcia, I.; Albo, J.; Solla-Gullón, J.; Montiel, V.; Irabien, A. Cu Oxide/ZnO-Based Surfaces for a Selective Ethylene Production from Gas-Phase CO2 Electroconversion. J. CO2 Util. 2019, 31, 135–142. [Google Scholar] [CrossRef] [Scilit]
  19. Albo, J.; Irabien, A. Cu2O-Loaded Gas Diffusion Electrodes for the Continuous Electrochemical Reduction of CO2 to Methanol. J. Catal. 2016, 343, 232–239. [Google Scholar] [CrossRef] [Scilit]
  20. Ziat, Y.; Hammi, M.; Belkhanchi, H.; Ifguis, O.; Rzaoudi, S.; Laghlimi, C.; Moutcine, A.; Lazrak, C. CNTs Modified ZnO and TiO2 Thin Films: The Effect of Loading Rate on Band Offset at Metal / Semiconductor Interfaces. E3S Web Conf. 2022, 337, 05003. [Google Scholar] [CrossRef] [Scilit]
  21. Keerthiga, G.; Chetty, R. Electrochemical Reduction of Carbon Dioxide on Zinc-Modified Copper Electrodes. J. Electrochem. Soc. 2017, 164, H164. [Google Scholar] [CrossRef] [Scilit]
  22. Ren, D.; Ang, B.S.H.; Yeo, B.S. Tuning the Selectivity of Carbon Dioxide Electroreduction toward Ethanol on Oxide-Derived CuxZn Catalysts. ACS Catal. 2016, 6, 8239–8247. [Google Scholar] [CrossRef] [Scilit]
  23. Salomé, S.; Ferraria, A.M.; Botelho Do Rego, A.M.; Alcaide, F.; Savadogo, O.; Rego, R. Enhanced Activity and Durability of Novel Activated Carbon-Supported PdSn Heat-Treated Cathode Catalyst for Polymer Electrolyte Fuel Cells. Electrochim. Acta 2016, 192, 268–282. [Google Scholar] [CrossRef] [Scilit]
  24. Beamson, G.; Briggs, D. High Resolution XPS of Organic Polymers: The Scienta ESCA300 Database. J. Chem. Educ. 1992, 70, A25. [Google Scholar] [CrossRef] [Scilit]
  25. Ferraria, A.M.; Carapeto, A.P.; Botelho Do Rego, A.M. X-Ray Photoelectron Spectroscopy: Silver Salts Revisited. Vacuum 2012, 86, 1988–1991. [Google Scholar] [CrossRef] [Scilit]
  26. NIST X-Ray Photoelectron Spectroscopy Database. NIST Standard Reference Database Number 20, 2000.
  27. Shawabkeh, R.A.; Faqir, N.M.; Rawajfeh, K.M.; Hussein, I.A.; Hamza, A. Adsorption of CO2 on Cu/SiO2 Nano-Catalyst: Experimental and Theoretical Study. Appl. Surf. Sci. 2022, 586, 152726. [Google Scholar] [CrossRef] [Scilit]
  28. Yang, R.; Zeng, Z.; Peng, Z.; Xie, J.; Huang, Y.; Wang, Y. Amorphous Urchin-like Copper@nanosilica Hybrid for Efficient CO2 Electroreduction to C2+ Products. J. Energy Chem. 2021, 61, 290–296. [Google Scholar] [CrossRef] [Scilit]
  29. Xu, H.; Rebollar, D.; He, H.; Chong, L.; Liu, Y.; Liu, C.; Sun, C.J.; Li, T.; Muntean, J.V.; Winans, R.E.; et al. Highly Selective Electrocatalytic CO2 Reduction to Ethanol by Metallic Clusters Dynamically Formed from Atomically Dispersed Copper. Nat. Energy 2020, 5, 623–632. [Google Scholar] [CrossRef] [Scilit]
  30. Zhang, K.; Wang, J.; Zhang, W.; Yin, H.; Han, J.; Yang, X.; Fan, W.; Zhang, Y.; Zhang, P. Regulated Surface Electronic States of CuNi Nanoparticles through Metal-Support Interaction for Enhanced Electrocatalytic CO2 Reduction to Ethanol. Small 2023, 19, 2300281. [Google Scholar] [CrossRef] [Scilit]
  31. Chen, Z.; Ma, Z.; Fan, G.; Li, F. Critical Role of Cu Nanoparticle-Loaded Cu(100) Surface Structures on Structured Copper-Based Catalysts in Boosting Ethanol Generation in CO2 Electroreduction. ACS Appl. Mater. Interfaces 2024, 16, 35143–35154. [Google Scholar] [CrossRef] [Scilit]
  32. Varandili, S.B.; Stoian, D.; Vavra, J.; Rossi, K.; Pankhurst, J.R.; Guntern, Y.T.; López, N.; Buonsanti, R. Elucidating the Structure-Dependent Selectivity of CuZn towards Methane and Ethanol in CO2 Electroreduction Using Tailored Cu/ZnO Precatalysts. Chem. Sci. 2021, 12, 14484–14493. [Google Scholar] [CrossRef] [Scilit]
  33. Yang, Y.; Fu, H.; Xiao, C.; Du, X.; Song, Z. Efficient Electrochemical CO2 Reduction to C2+ Hydrocarbons on Zn-Doped Cu Films. Appl. Surf. Sci. 2024, 646, 158866. [Google Scholar] [CrossRef] [Scilit]
  34. Ren, D.; Gao, J.; Pan, L.; Wang, Z.; Luo, J.; Zakeeruddin, S.M.; Hagfeldt, A.; Grätzel, M.; Ren, D.; Gao, J.; et al. Atomic Layer Deposition of ZnO on CuO Enables Selective and Efficient Electroreduction of Carbon Dioxide to Liquid Fuels. Angew. Chem. Int. Ed. 2019, 58, 15036–15040. [Google Scholar] [CrossRef] [Scilit] [PubMed]
  35. Singh, P.K.; Thakur, J.; Yadav, P.K.; Gautam, A.; Masakapalli, S.K.; Sharma, S.; Halder, A. C2 Product Selectivity by 2D-Nanosheet of Layered Zn-Doped Cu2(OH)3(NO3)-A Pre-Catalyst for Electrochemical CO2 Reduction. Chempluschem 2025, 90, e202400566. [Google Scholar] [CrossRef] [Scilit] [PubMed]
  36. Zhang, H.; Li, J.; Shen, Z.; Hu, H.; Jin, W.; Qu, C. Recent Advances of CO2 Electroreduction towards Ethanol over Cu-Based Catalysts. Appl. Catal. A Gen. 2025, 704, 120404. [Google Scholar] [CrossRef] [Scilit]
Figure 1. CO2-to-ethanol reaction pathway.
Energies 19 00354 g001
Figure 2. Isometric view of the METNMAT CO2 flow cell. (a) Exploded view showing individual components: cathode flow channel end plate (1), cathode (2), current collector (3), silicone sealing gaskets (4, 6, 8, 10), catholyte flow plate (5), membrane (7), anolyte flow plate (9), anode end plate (11), reference electrode (12), and anode (13). (b) Assembled view of the flow cell.
Energies 19 00354 g002
Figure 3. Detailed XPS regions for all the analysed samples.
Energies 19 00354 g003
Figure 4. SEM images at 1000× g magnification of (a) 5% Cu, (b) 10% Cu–SiO2, (c) 10% Cu-2% ZnO, (d) 10% Cu-3.5% ZnO.
Energies 19 00354 g004
Figure 5. FE results for the electrochemical conversion of CO2 at different current densities using 5% Cu Zirconia and 10% Cu Silica catalysts.
Energies 19 00354 g005
Figure 6. Ethanol production rate and cathode potential results at different current densities using 5% Cu Zirconia and 10% Cu Silica catalysts.
Energies 19 00354 g006
Figure 7. FE results for the electrochemical conversion of CO2 at different current densities using 5% Cu Zirconia and 10% Cu Silica catalysts.
Energies 19 00354 g007
Figure 8. Comparison of FE versus current density for the best catalytic material in this work (10% Cu on SiO2, red rhombuses), with materials previously reported in the literature (blue dots). Data extracted from the reference [36].
Energies 19 00354 g008
Table 1. Electrochemical reduction reactions of CO2 to CO and alcohols.
ProductHalf Reactions (in Acidic Electrolytes) E 0 r e d o x (V vs. SHE)
C O C O 2 g + 2 H + + 2 e C O g + H 2 O ( l ) −0.104
C H 3 O H C O 2 g + 6 H + + 6 e C H 3 O H ( l ) + H 2 O ( l ) 0.016
C 2 H 5 O H 2 C O 2 g + 2 H + + 12 e C 2 H 5 O H ( l ) + 3 H 2 O ( l ) 0.085
C 3 H 7 O H 3 C O 2 g + 18 H + + 18 e C 3 H 7 O H ( l ) + 5 H 2 O ( l ) 0.095
Table 2. Positions and atomic percentages extracted from the peak-fittings presented in Figure 3 and corresponding assignments [24,26].
10% Cu-3.5% ZnO10% Cu-2% ZnO10% Cu-Silica5% Cu
BE(eV)At. %BE(eV)At. %BE(eV)At. %BE(eV)At. %Assignments
C 1s 1284.61.3284.60.7284.60.6284.61.0C-C, C-HPhase 1
C 1s 2287.10.7287.00.8286.70.8287.00.9C-O, epoxy
C 1s 3285.02.2285.03.2285.02.1285.02.7C-C, C-HPhase 2
C 1s 4288.11.1288.31.8288.00.9288.31.3C = O
C 1s 5292.021.9291.920.3291.920.2292.022.9C-F (Teflon)
O 1s 1531.40.53531.90.43532.00.54530.80.38O = CPhase 1
O 1s 2534.10.28534.70.37535.30.36533.50.32H2O
O 1s 3 531.20.7O = CPhase 2
O 1s 4532.98.3532.89.1533.012.8533.33.0OH-, C-O
O 1s 5535.52.1535.51.9535.61.5535.52.4H2O
F 1s 1686.80.65688.90.8689.50.3688.00.8C-F (Teflon)Phase 1
F 1s 2685.54.1685.62.8685.82.1685.62.2F-Phase 2
F 1s 3688.952.7689.153.8689.153.2689.260.2F-C (teflon)
Si 2p3/2103.51.2103.21.2103.61.9 Si4+
Si 2p1/2 104.10.61103.80.61104.21.0
Zn 2p3/21023.41.01023.20.59 Zn2+
Cu 2p3/2 1934.90.26934.10.25934.80.36934.60.19CuO/Cu(OH)2
Cu 2p3/2 2937.00.44936.70.67936.90.57937.30.44CuF2
Cu 2p3/2 3941.20.21941.20.26941.80.30941.20.19Multiplet
Cu 2p3/2 4944.60.34944.60.45944.80.40944.60.32
Disclaimer/Publisher’s Note: The statements, opinions and data contained in all publications are solely those of the individual author(s) and contributor(s) and not of MDPI and/or the editor(s). MDPI and/or the editor(s) disclaim responsibility for any injury to people or property resulting from any ideas, methods, instructions or products referred to in the content.