

Multiphysics Modeling and Performance Optimization of CO2/H2O Co-Electrolysis in Solid Oxide Electrolysis Cells: Temperature, Voltage, and Flow Configuration Effects

Abstract
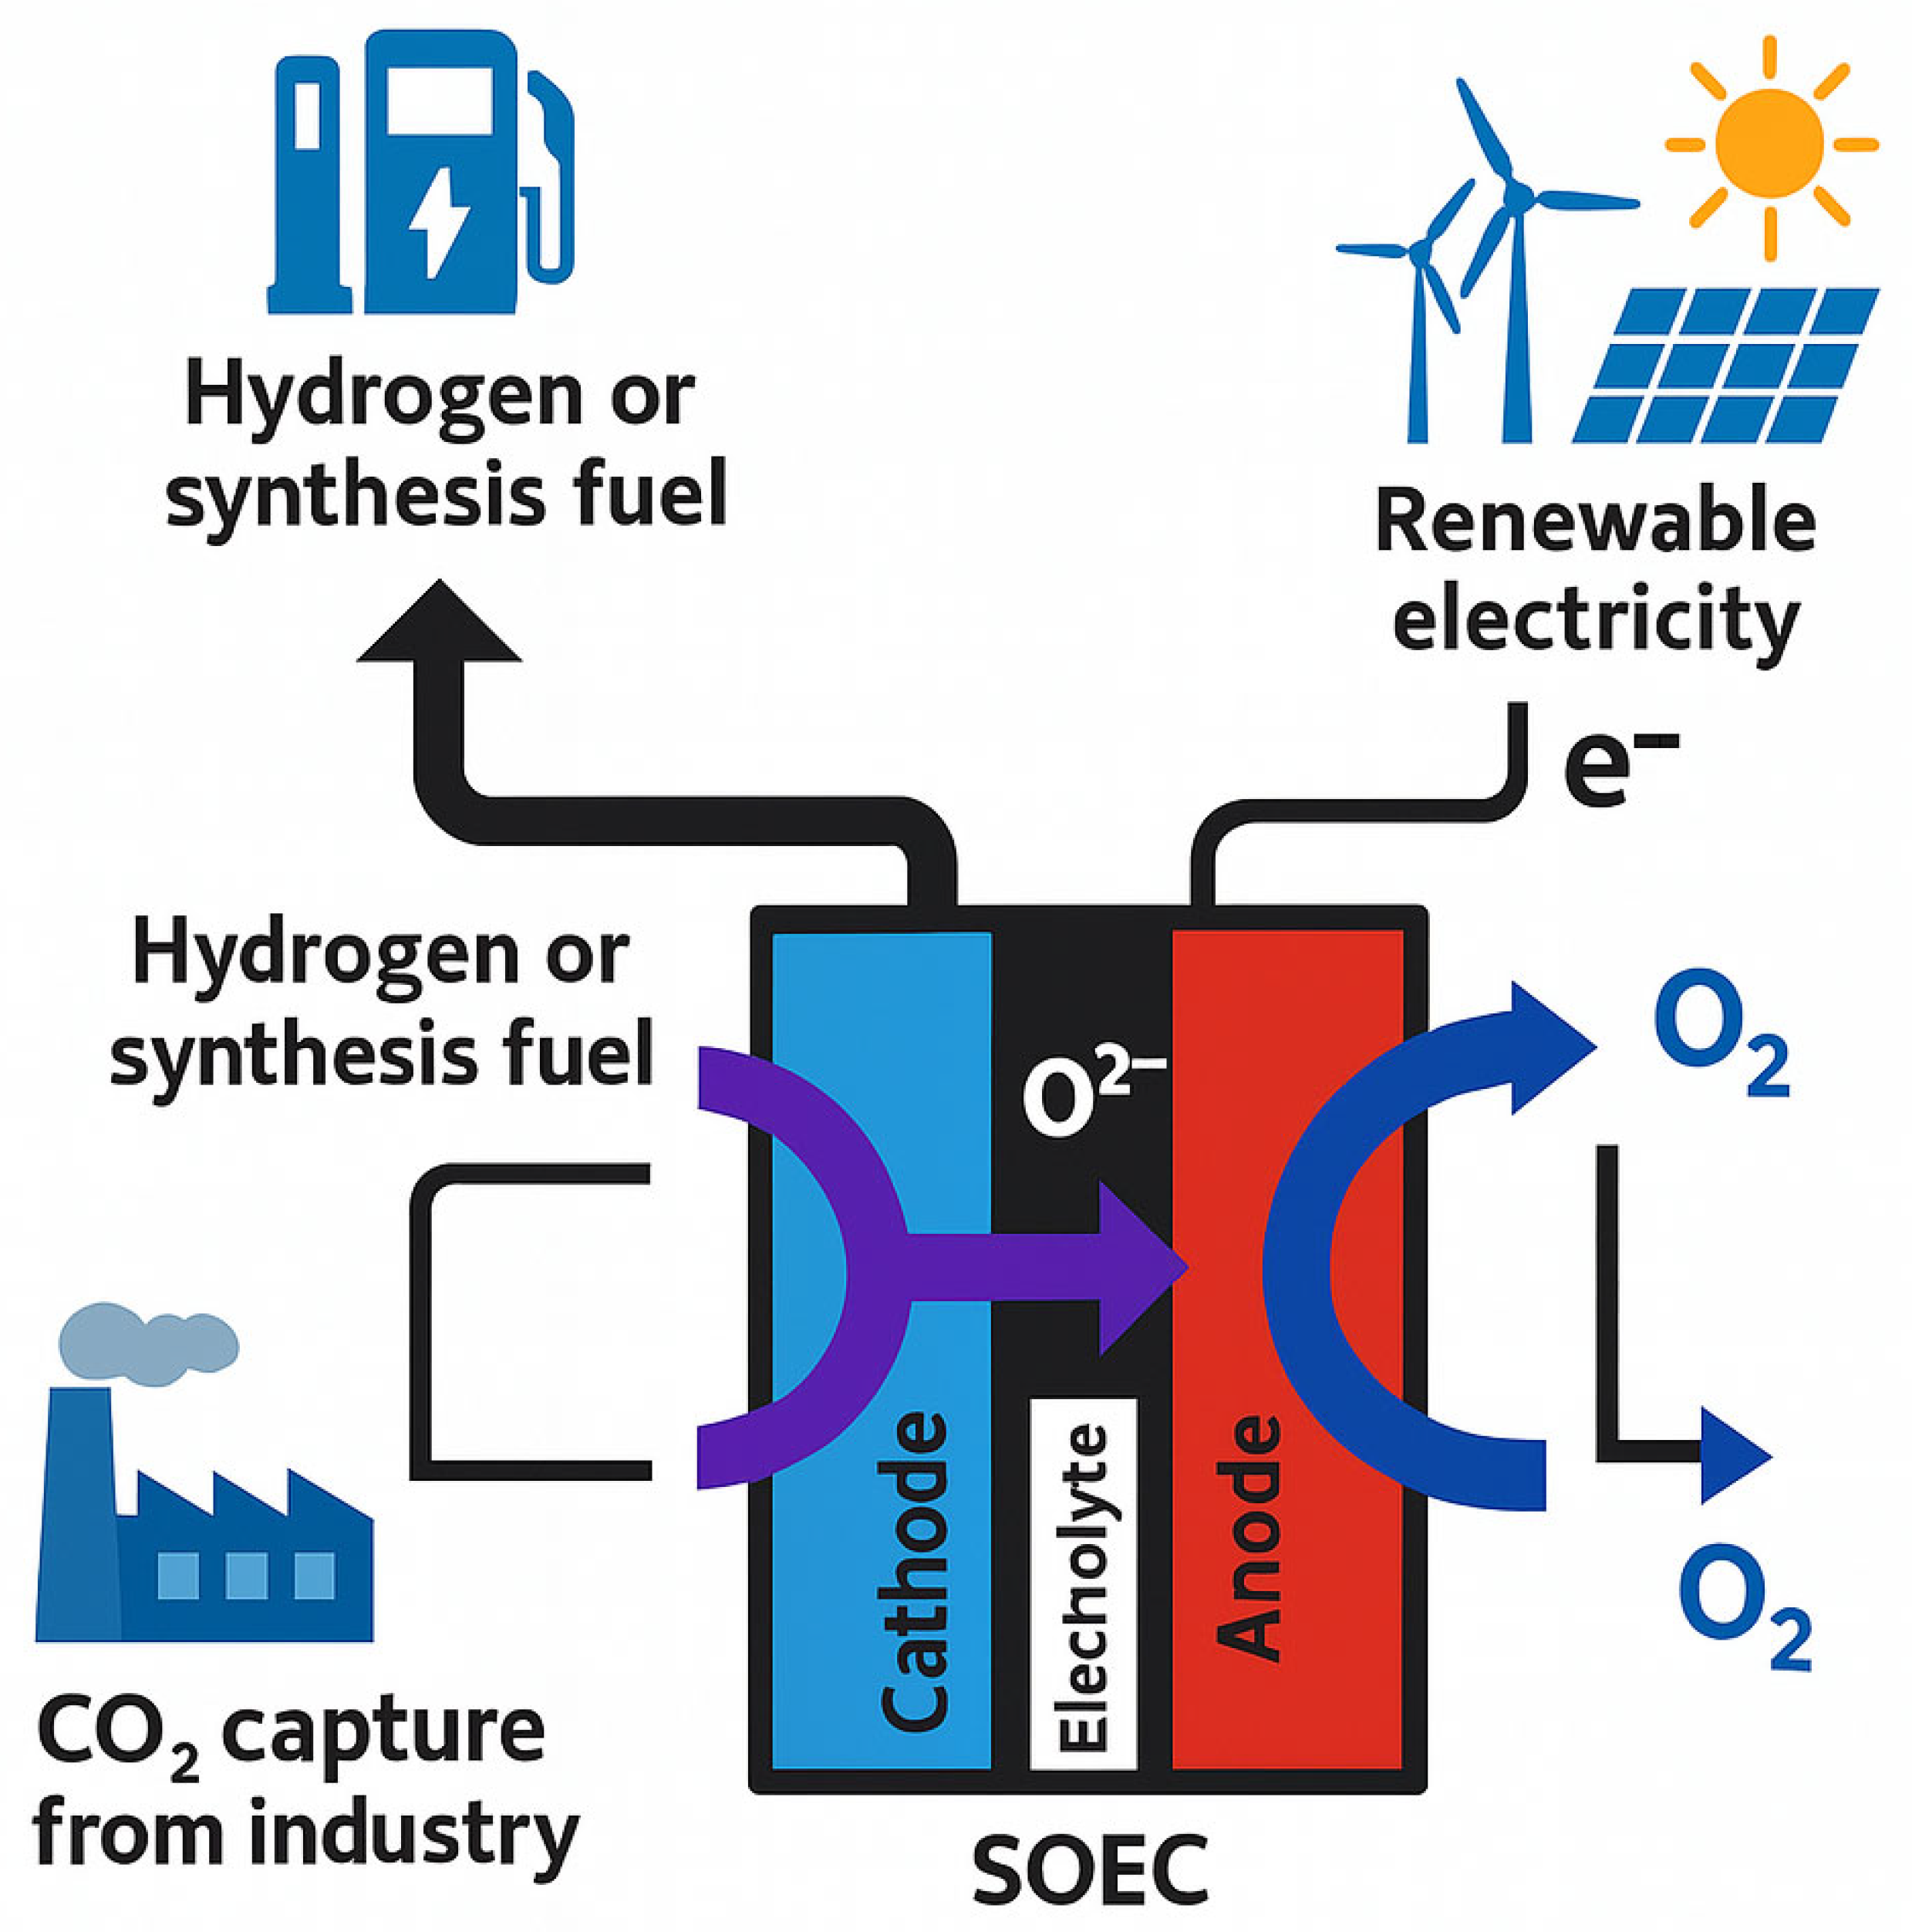
1. Introduction
2. Solid Oxide Electrolysis Cell Co-Electrolysis Model
2.1. Electron Electrolyte Phase
2.2. Electrochemical Reaction Model
2.3. Conservation of Momentum, Mass, and Energy
2.4. Water Gas Shift Reaction Model
2.5. Electrochemical Heating
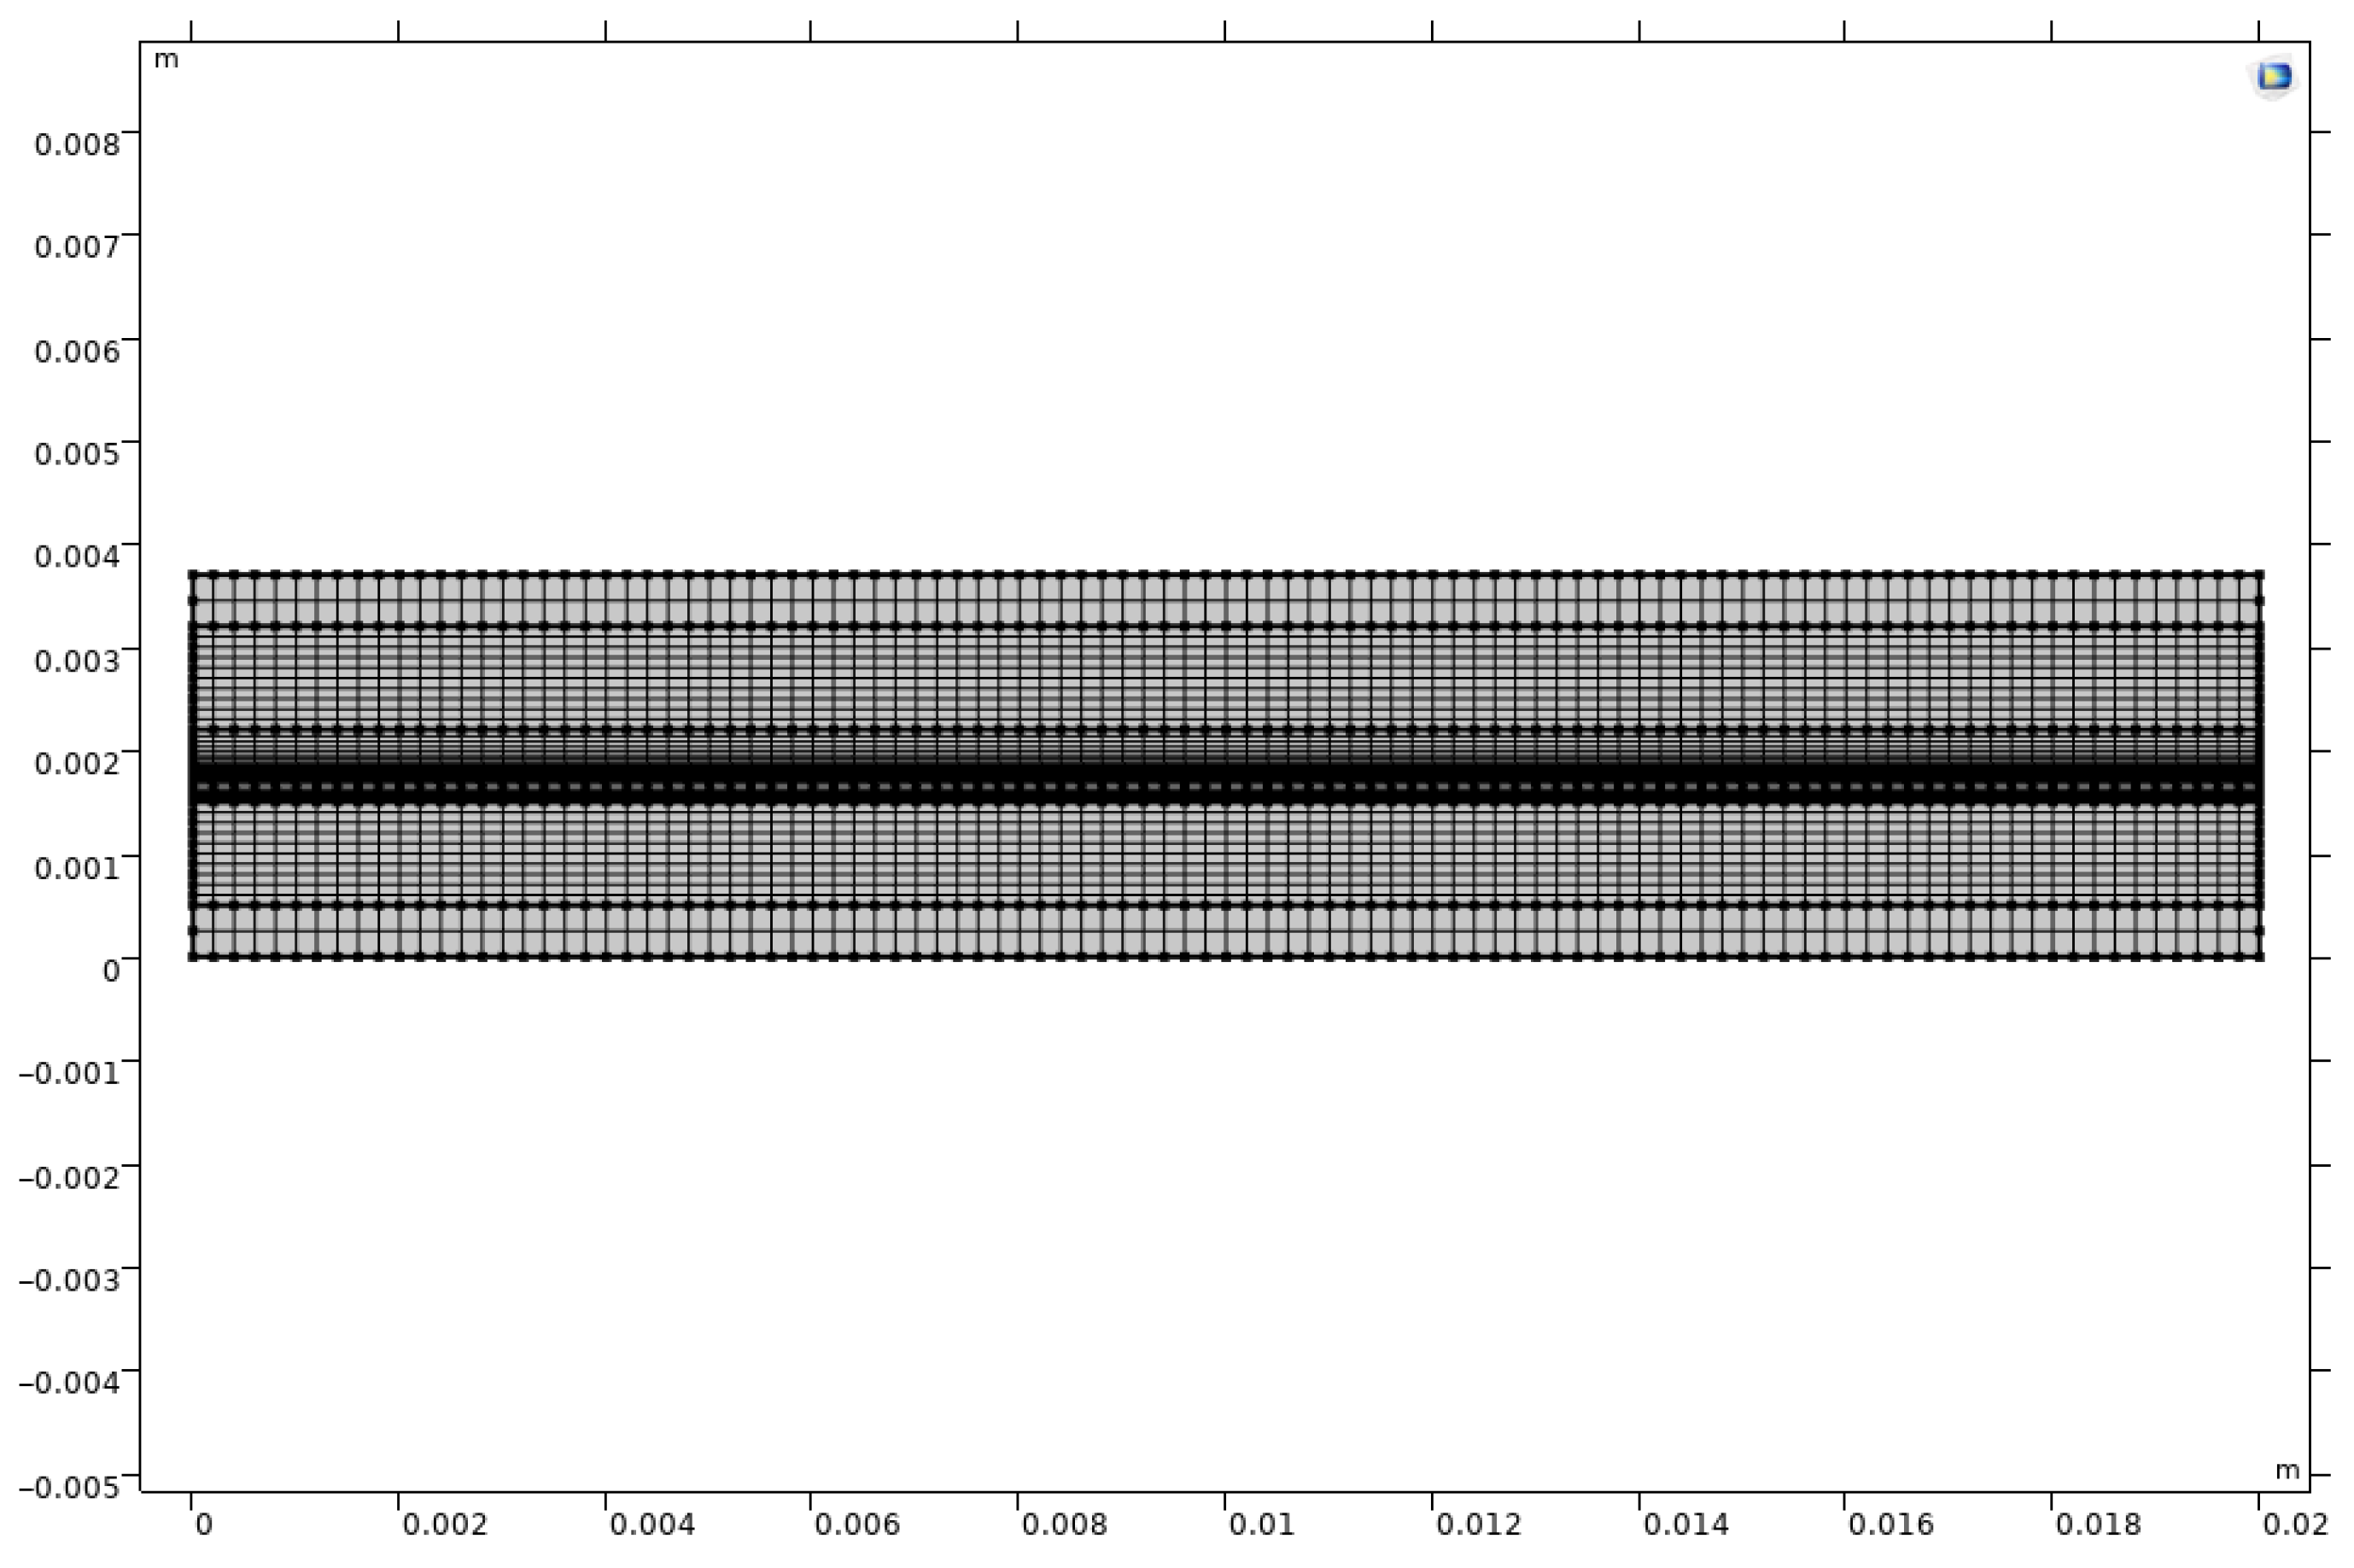
2.6. Numerical Methodology
3. Results and Discussion
3.1. Model Validation
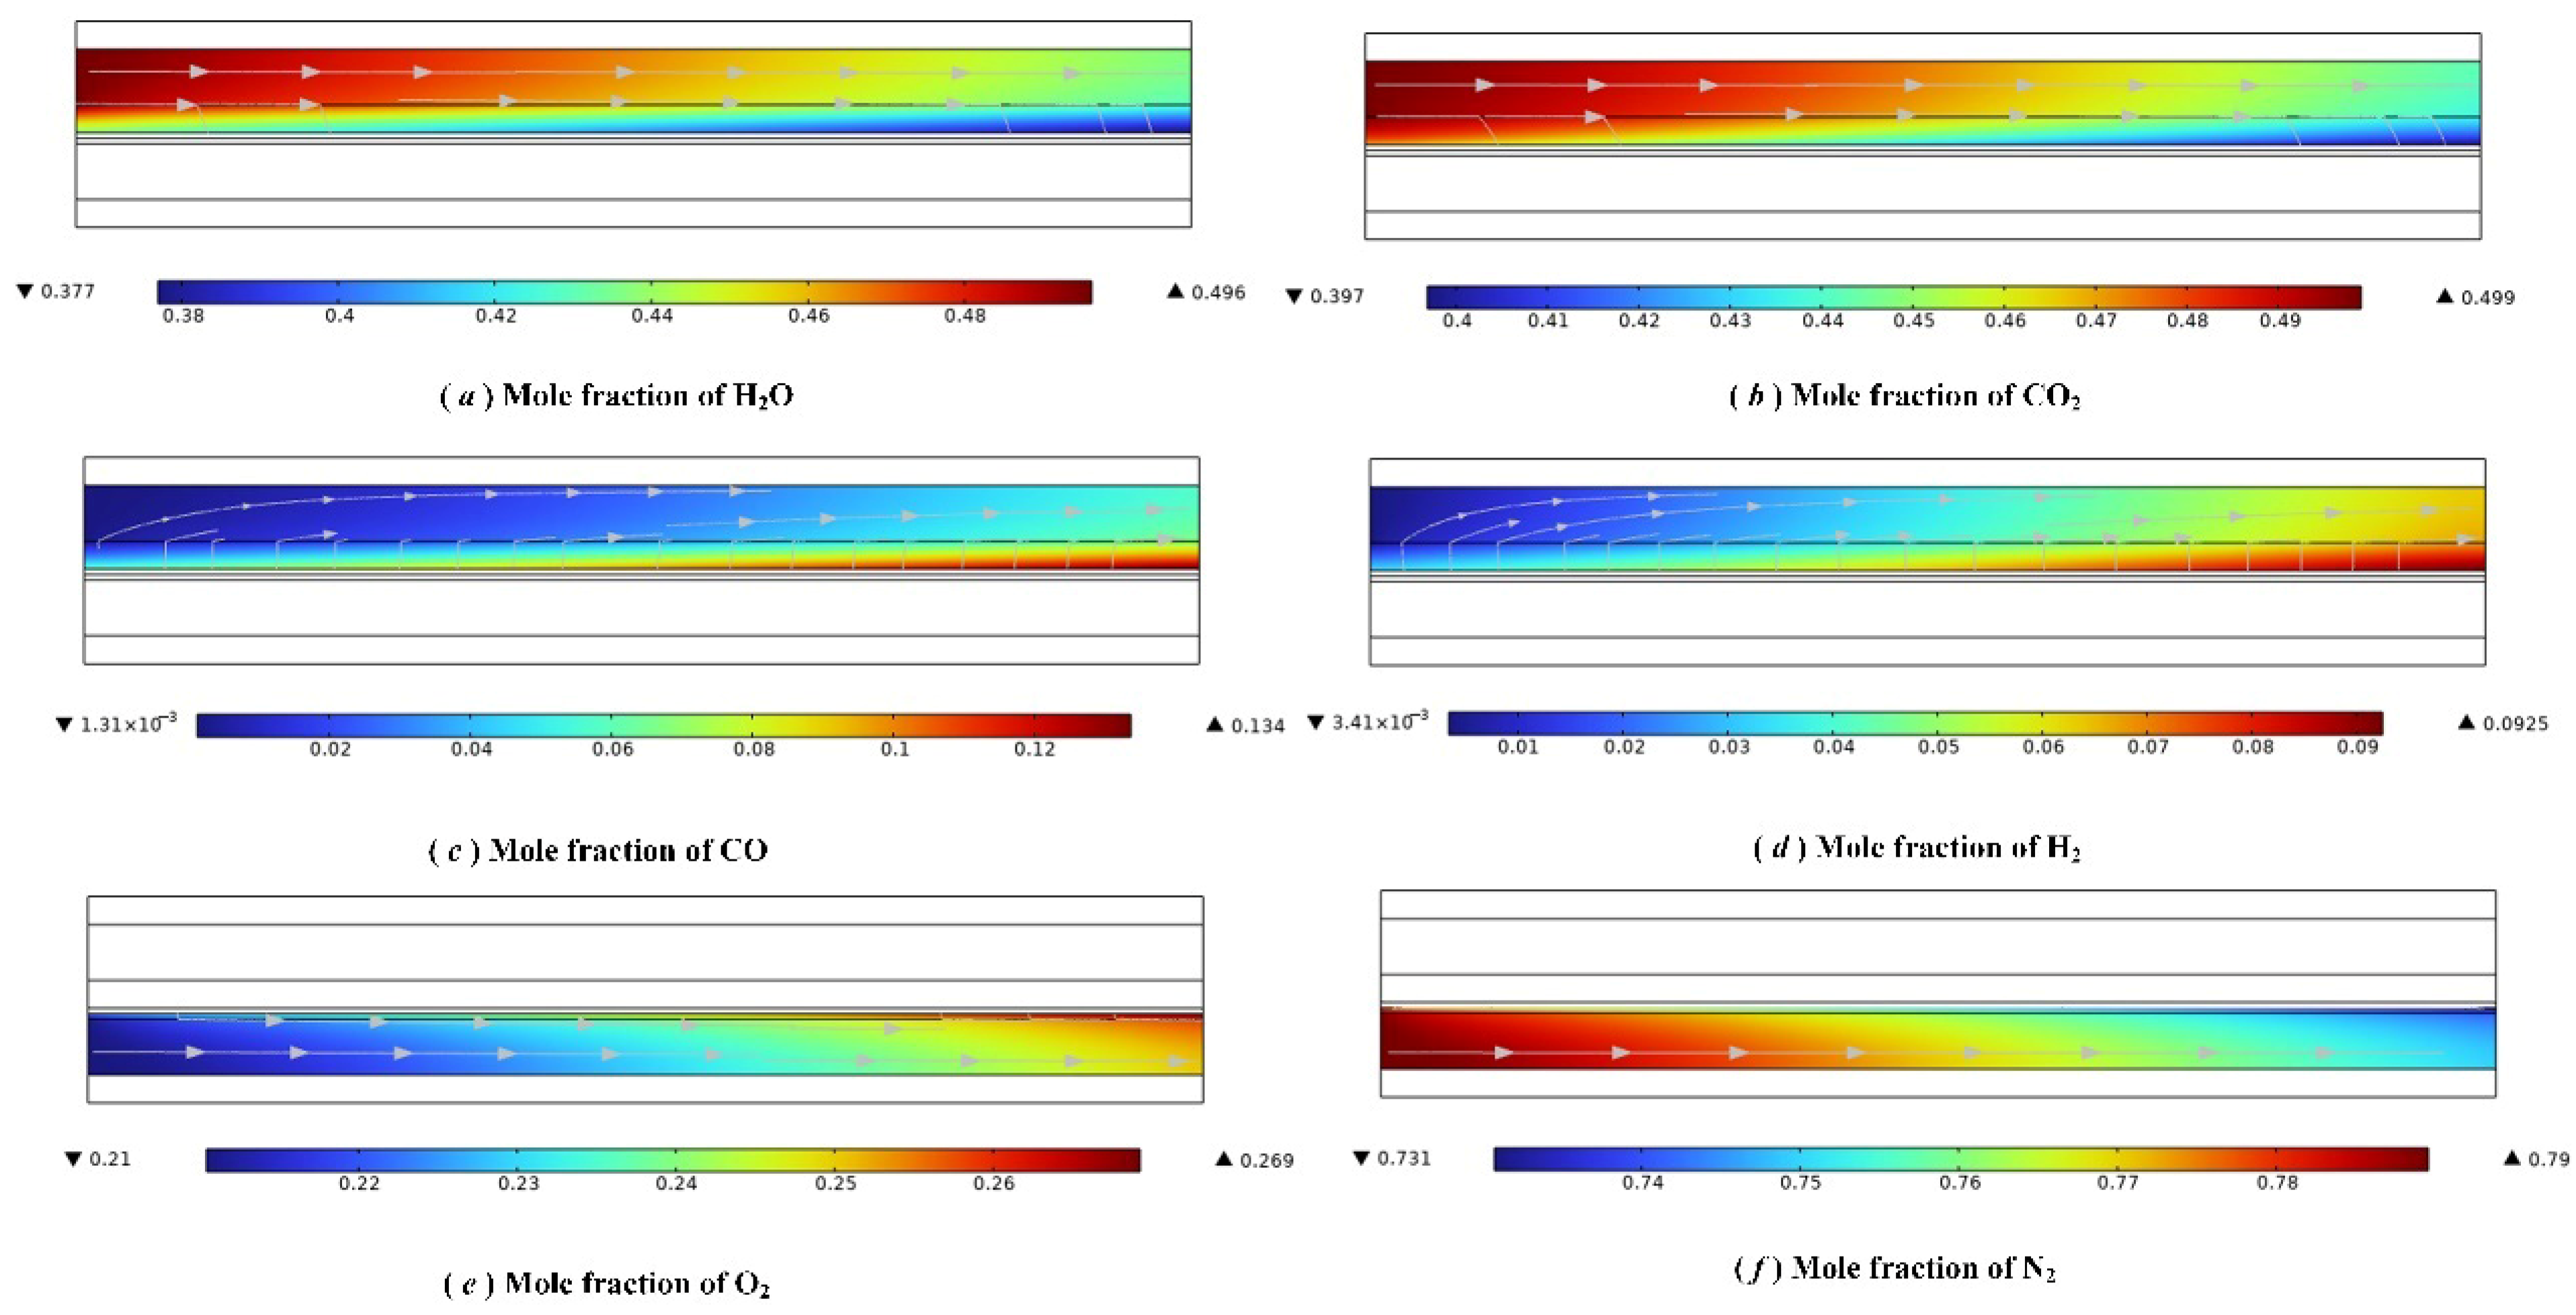
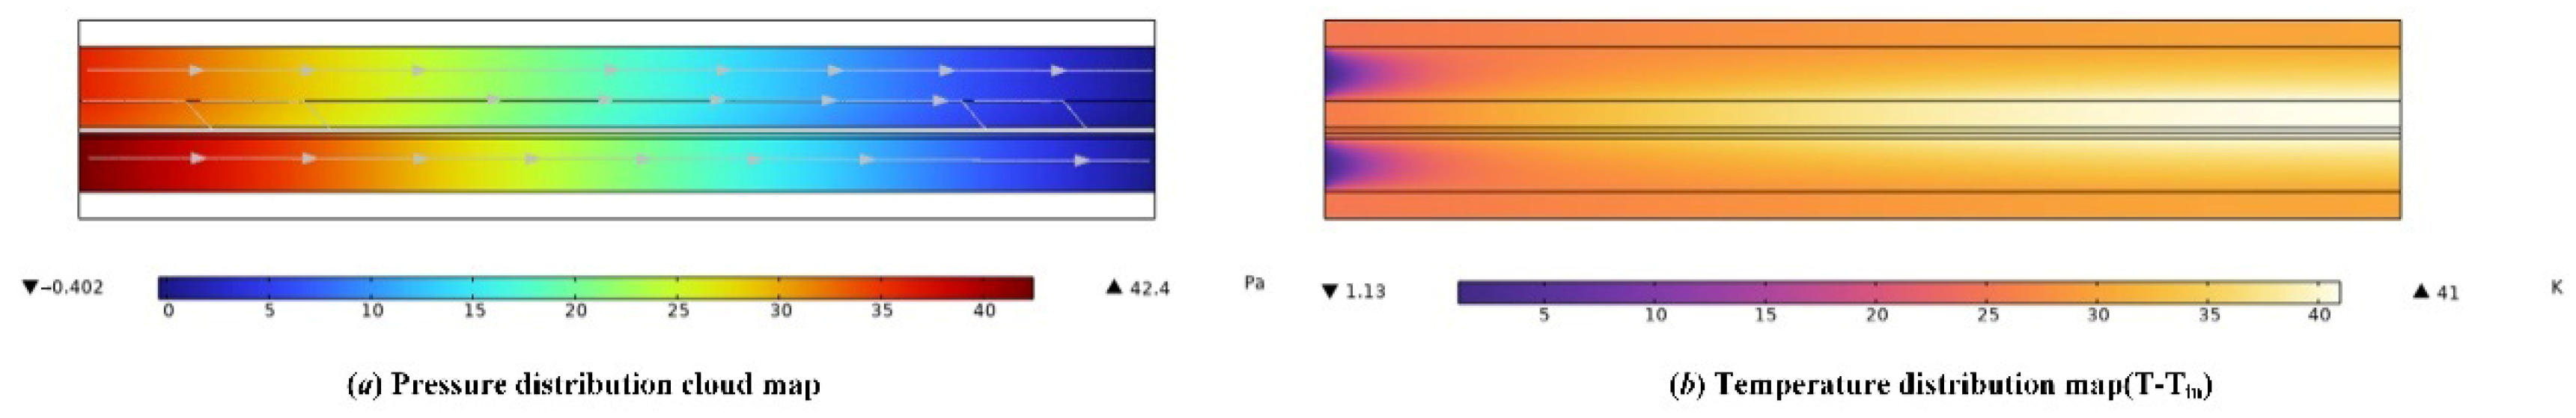
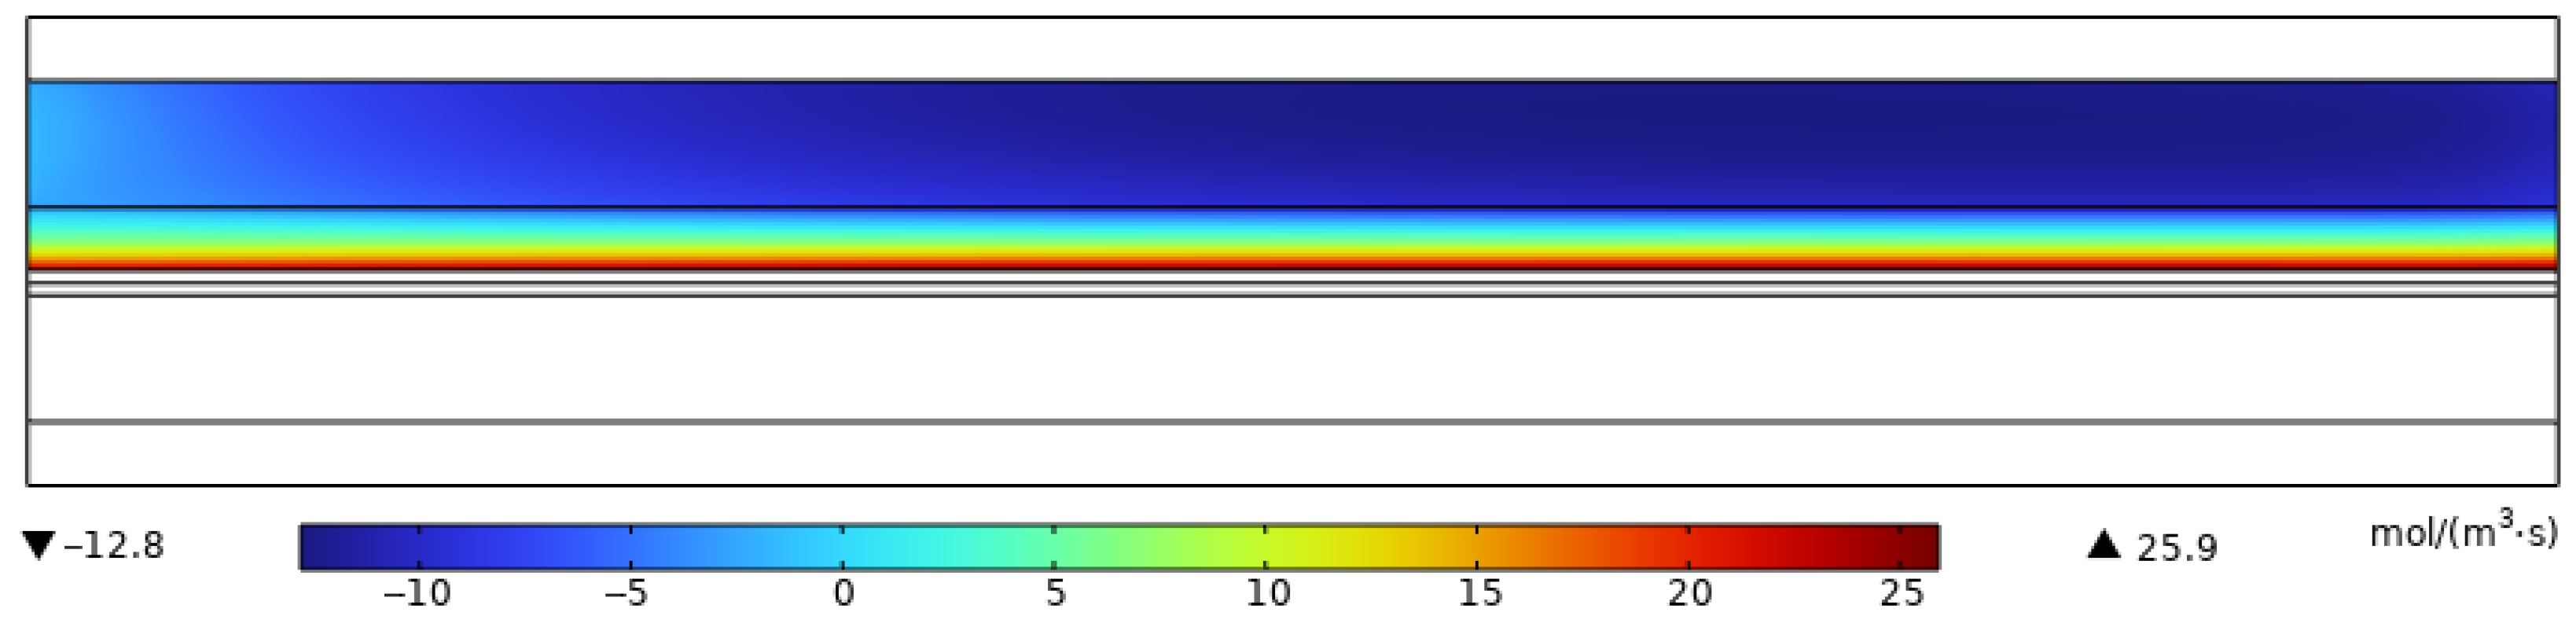
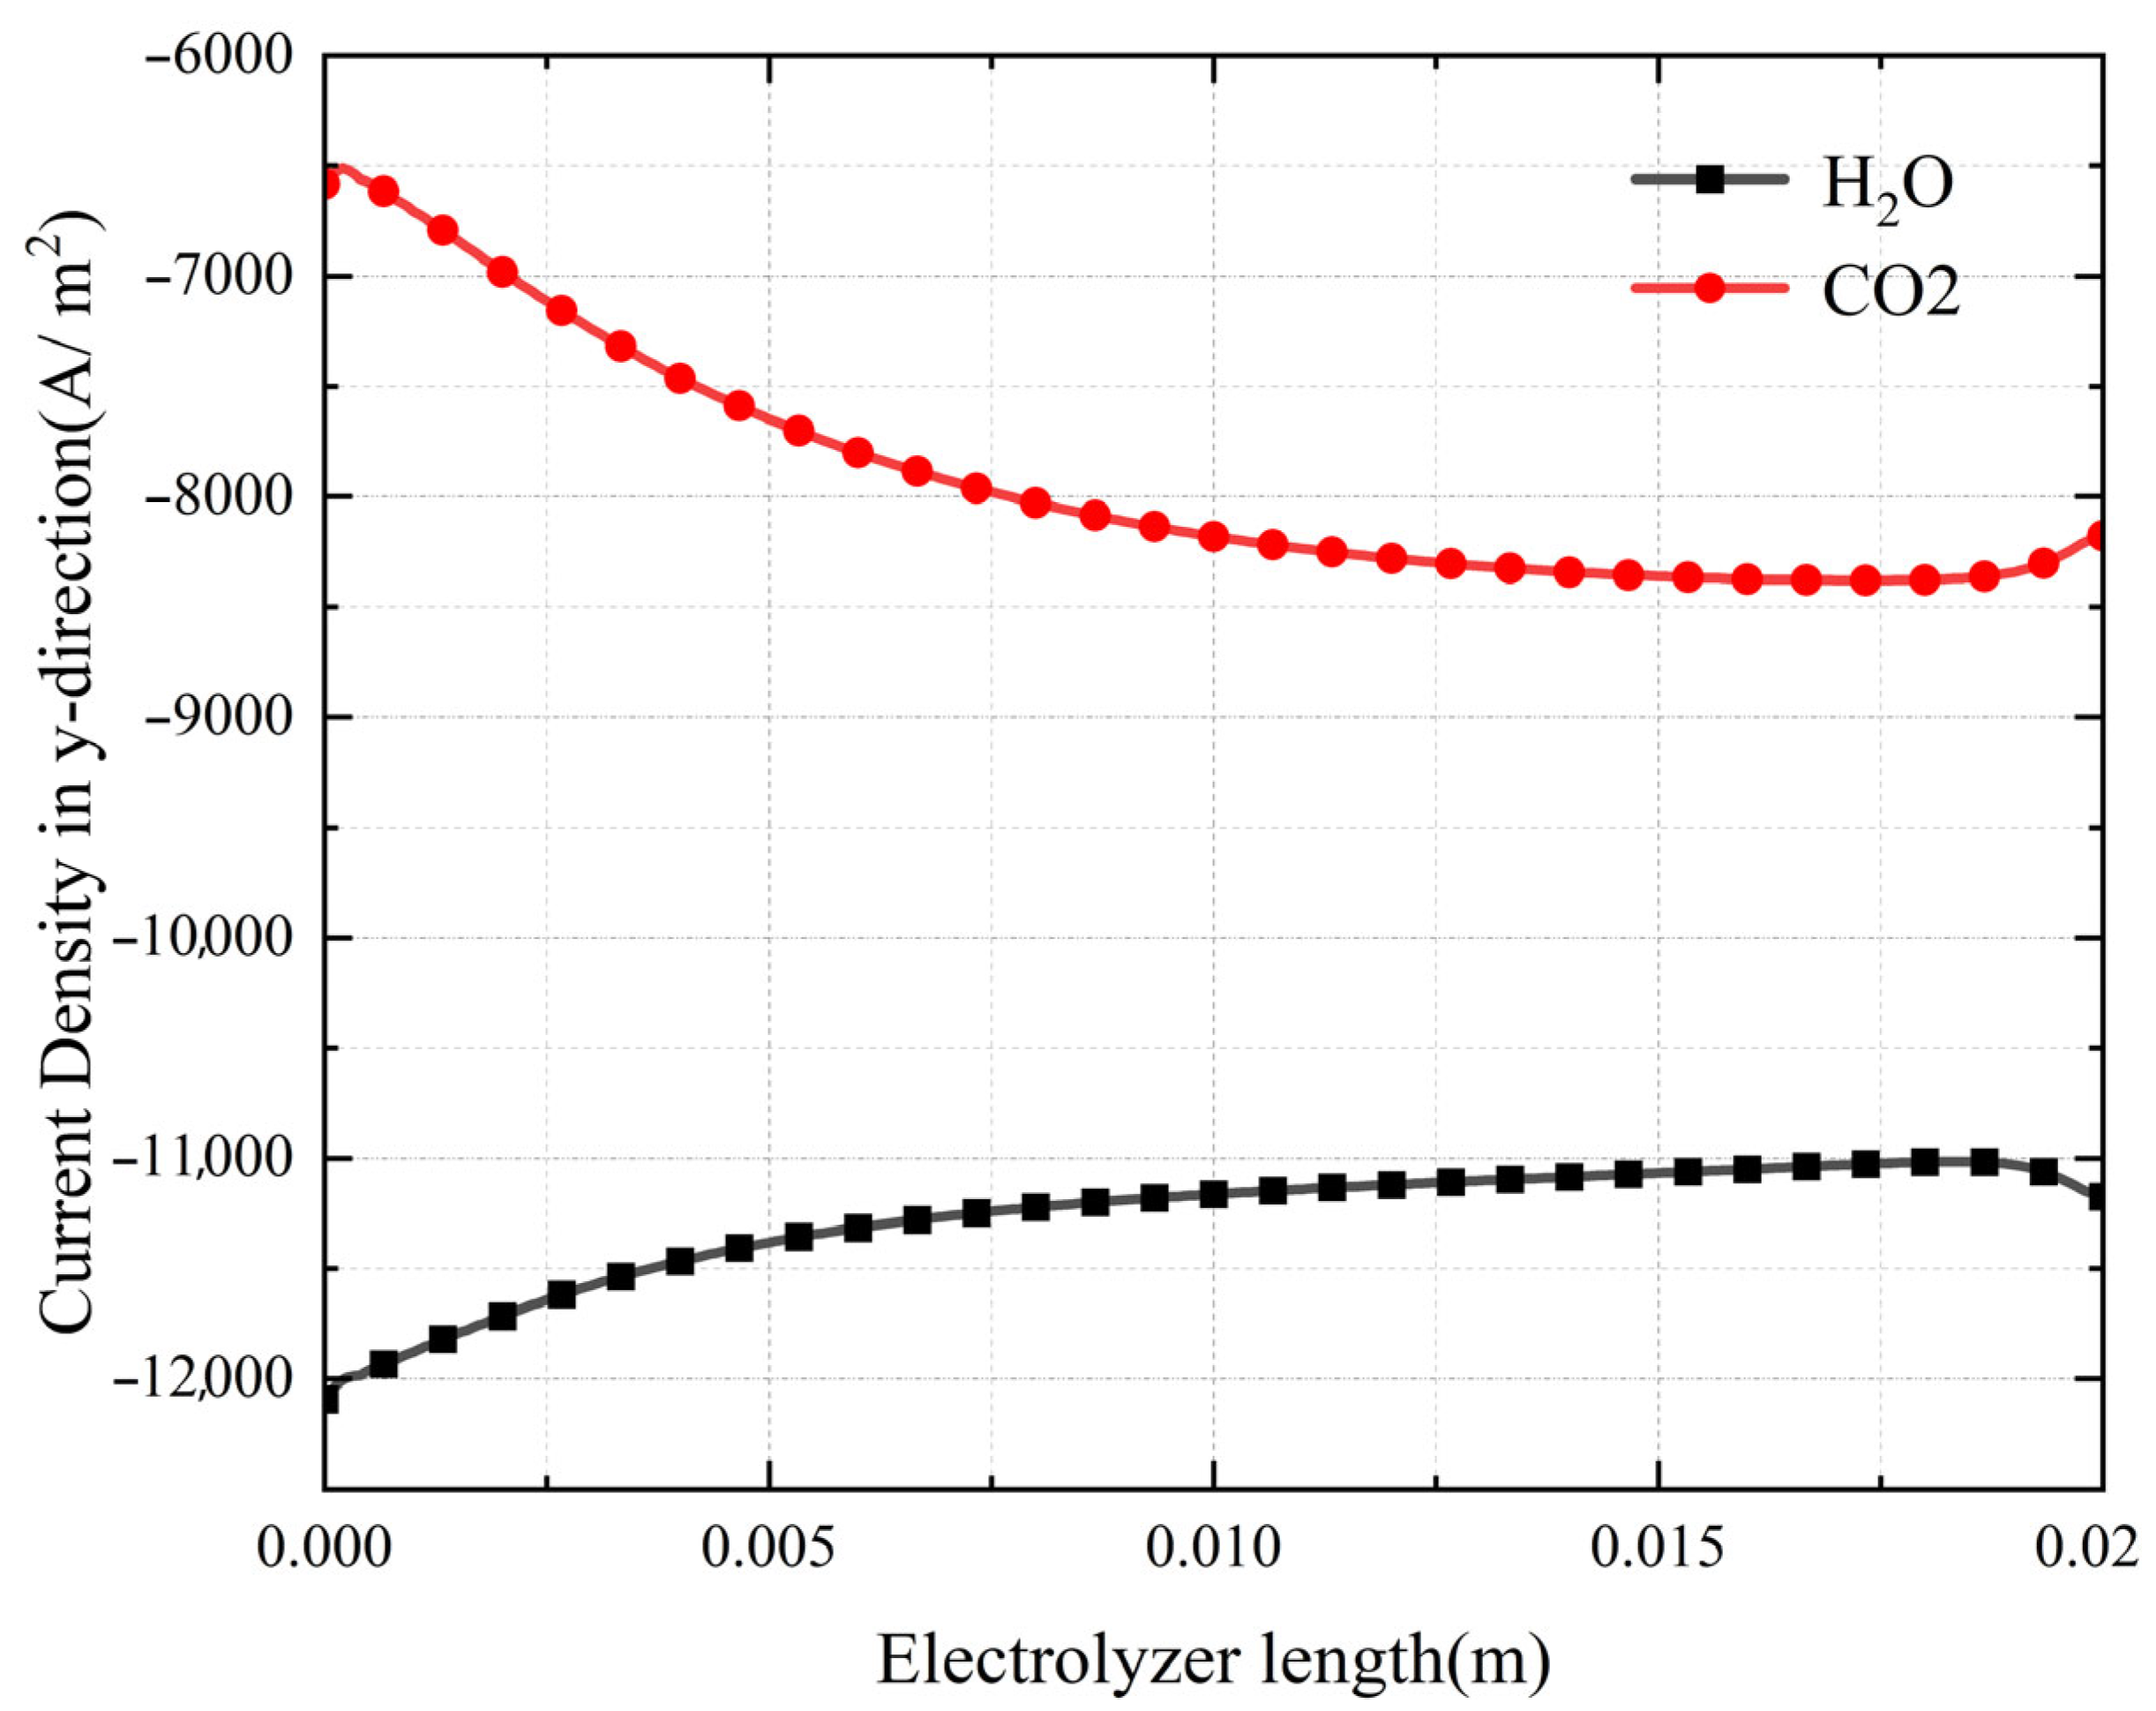
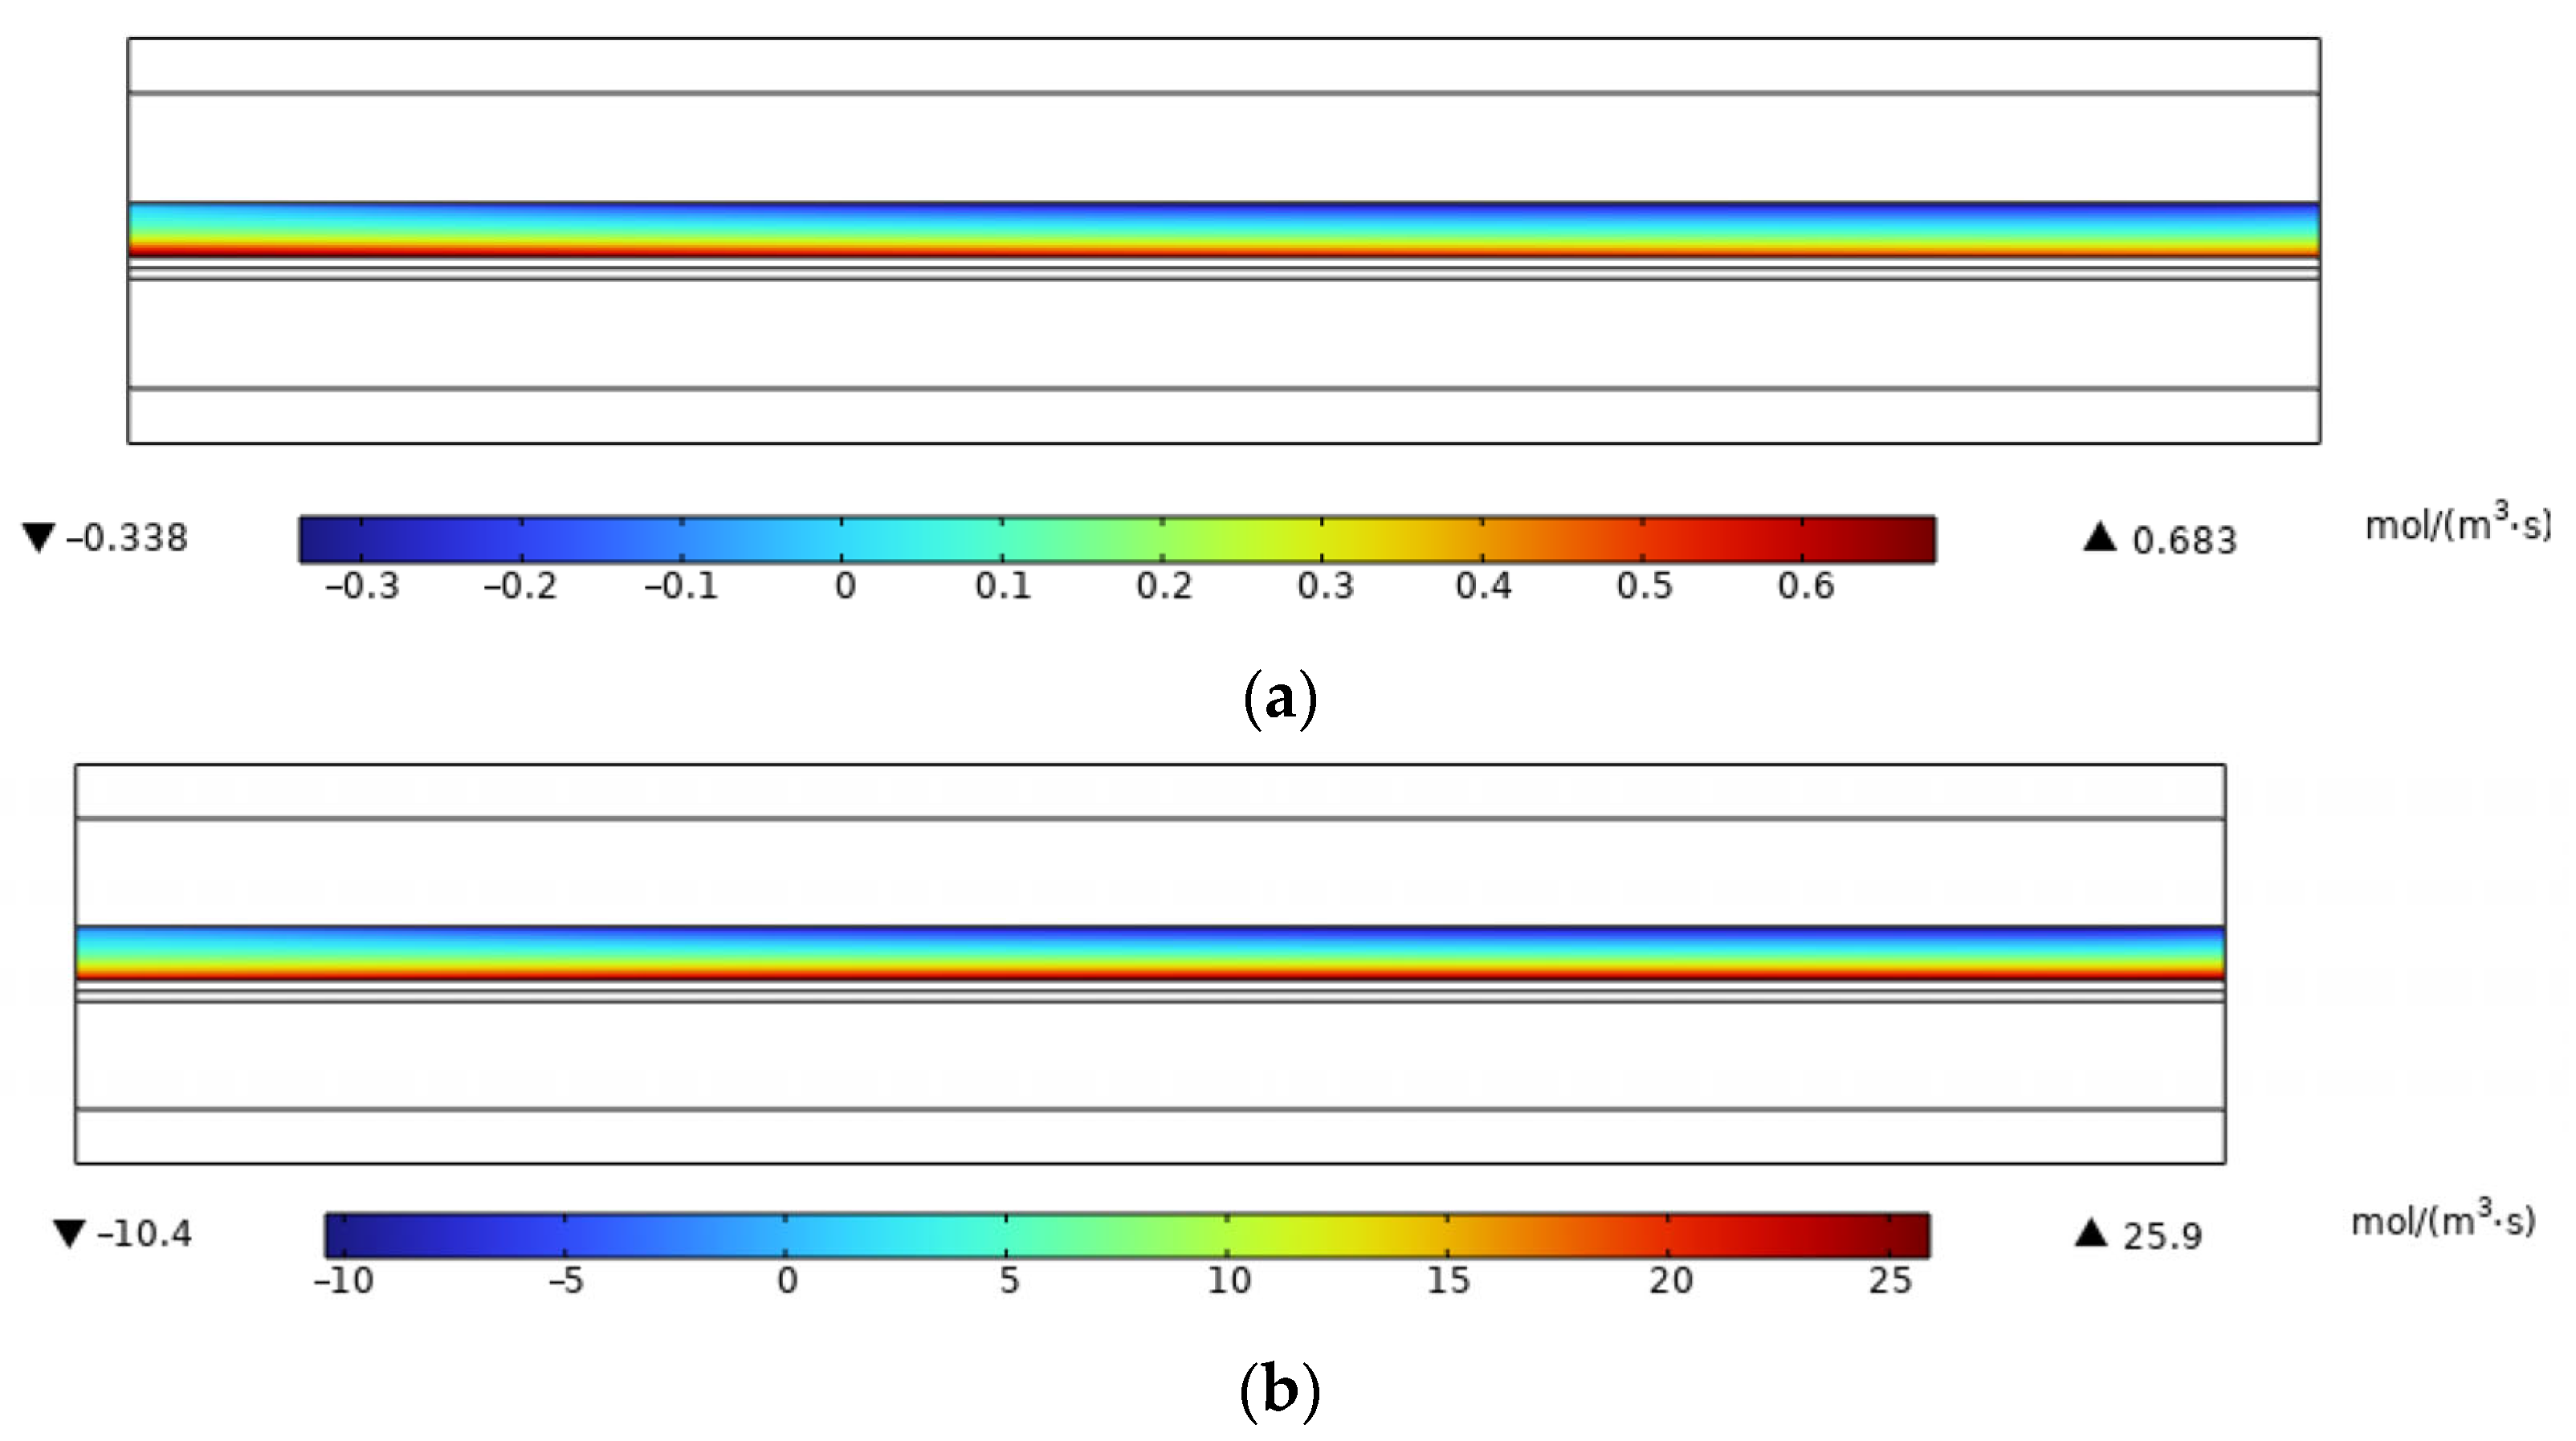
3.2. Simulation Results
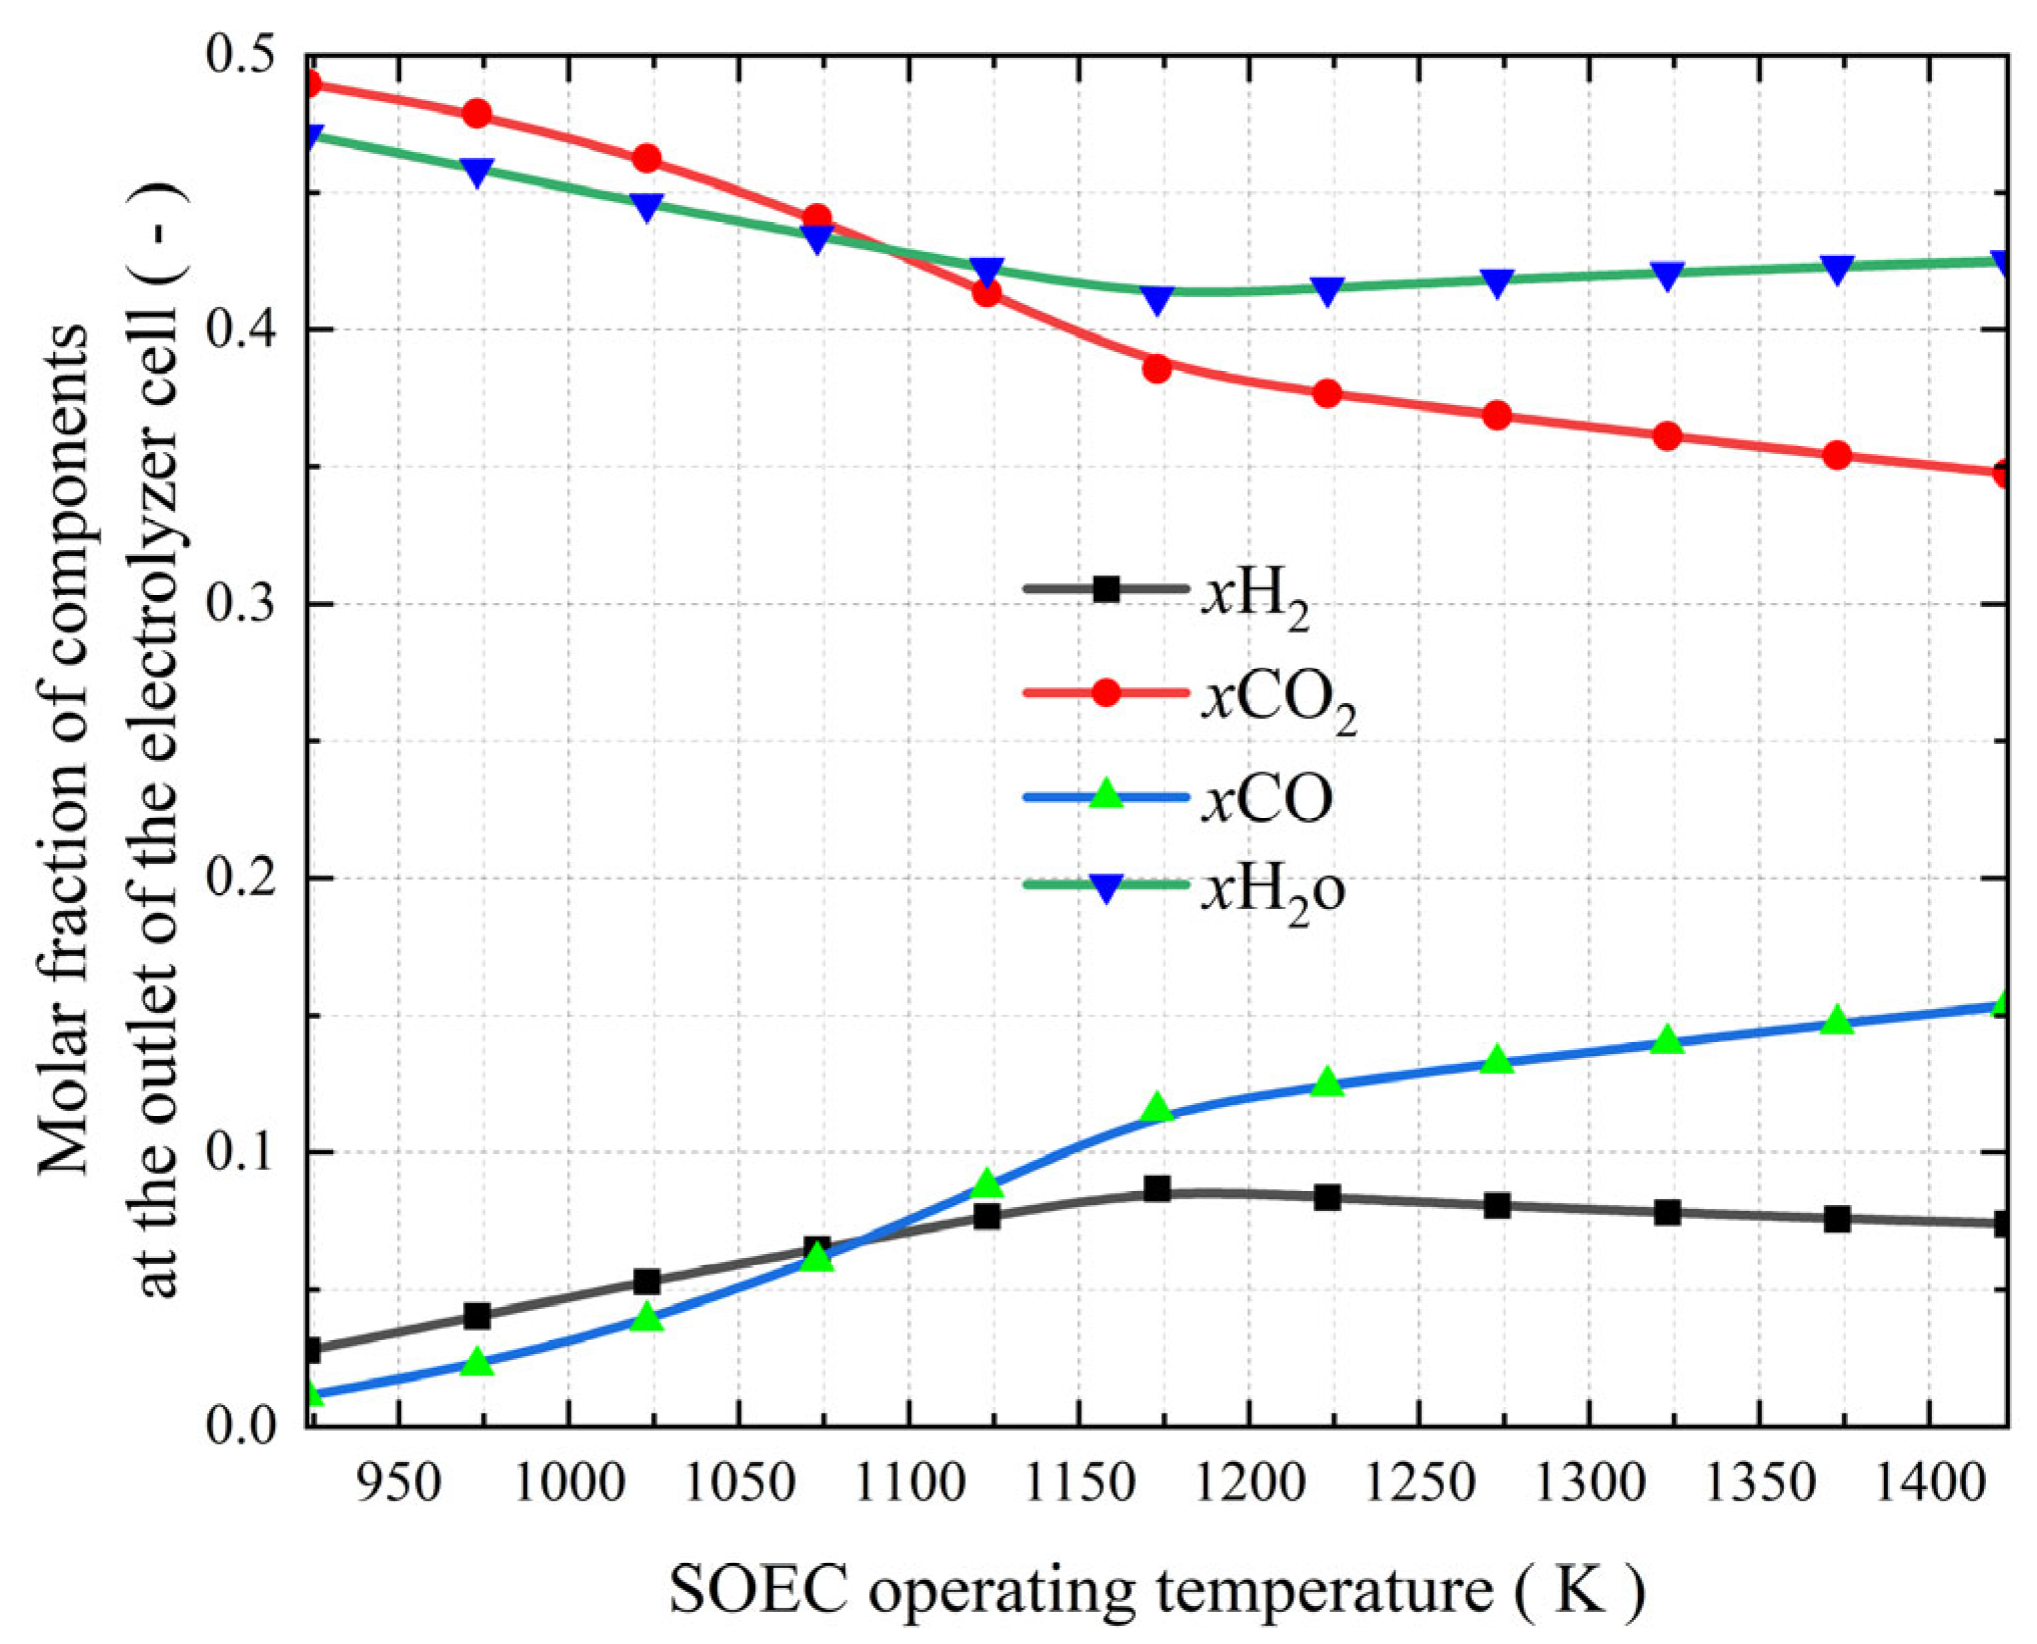
3.3. The Effect of SOEC Operating Temperature on the Co-Electrolysis of CO2 and H2O
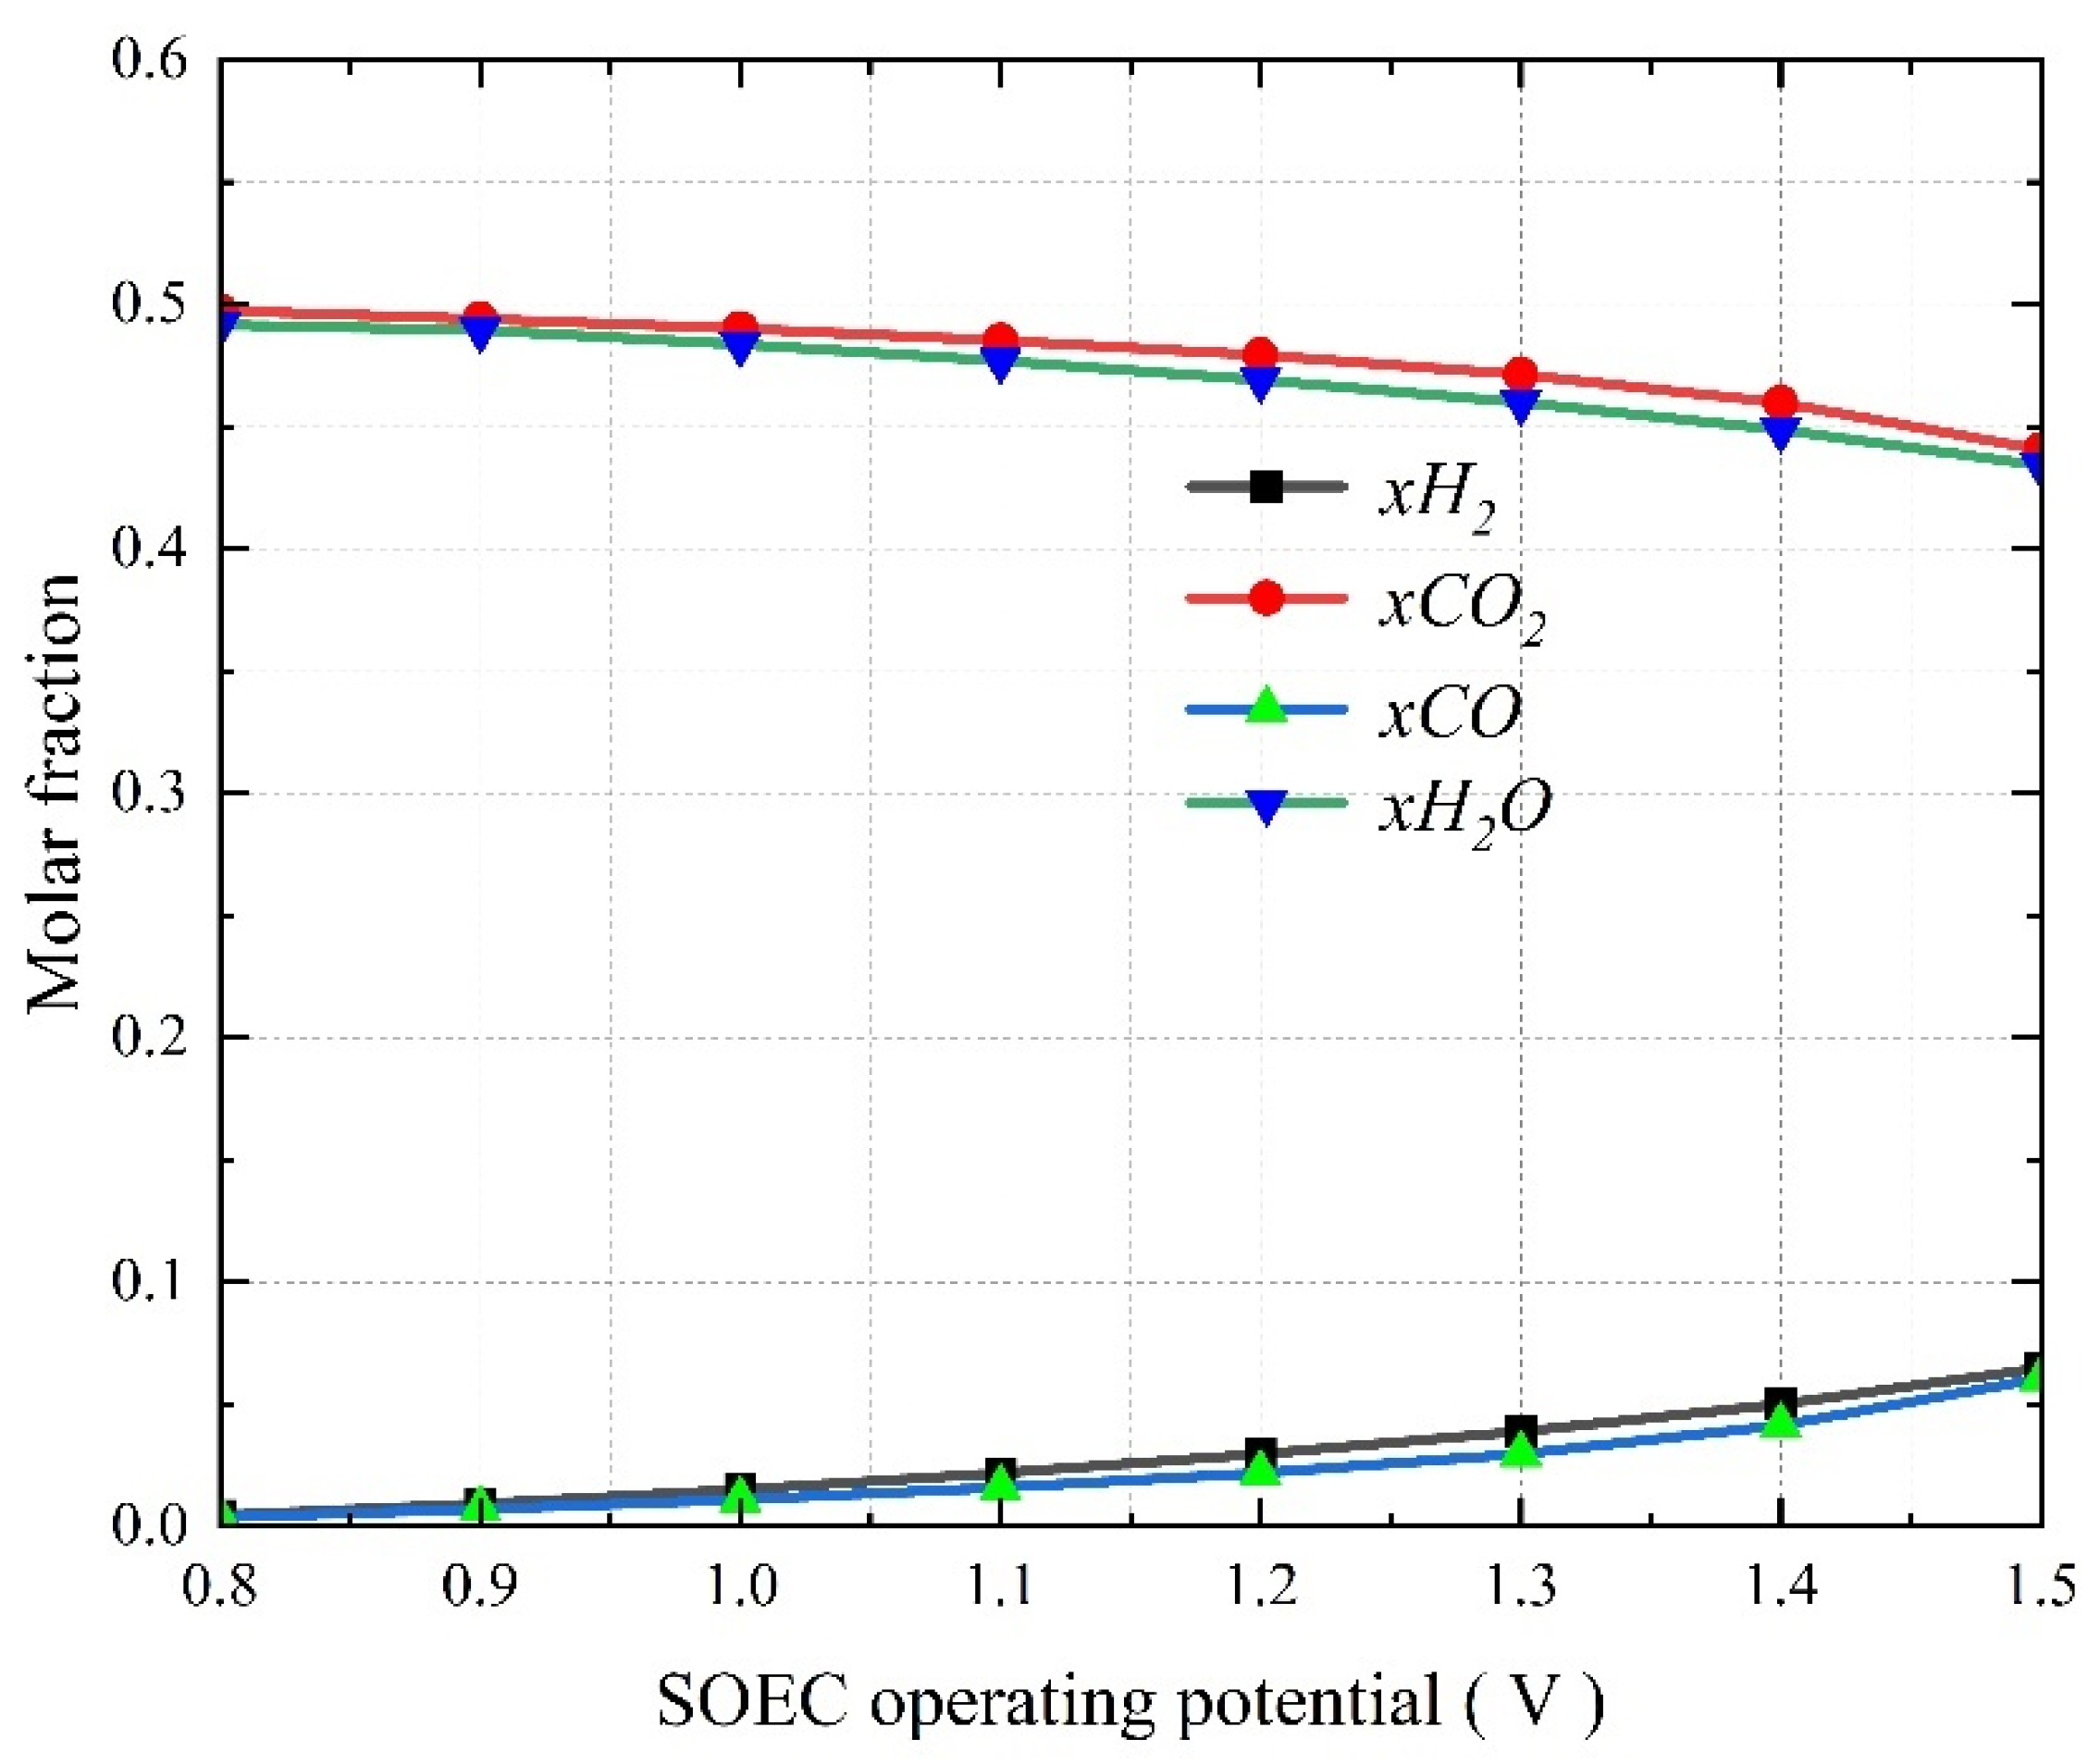
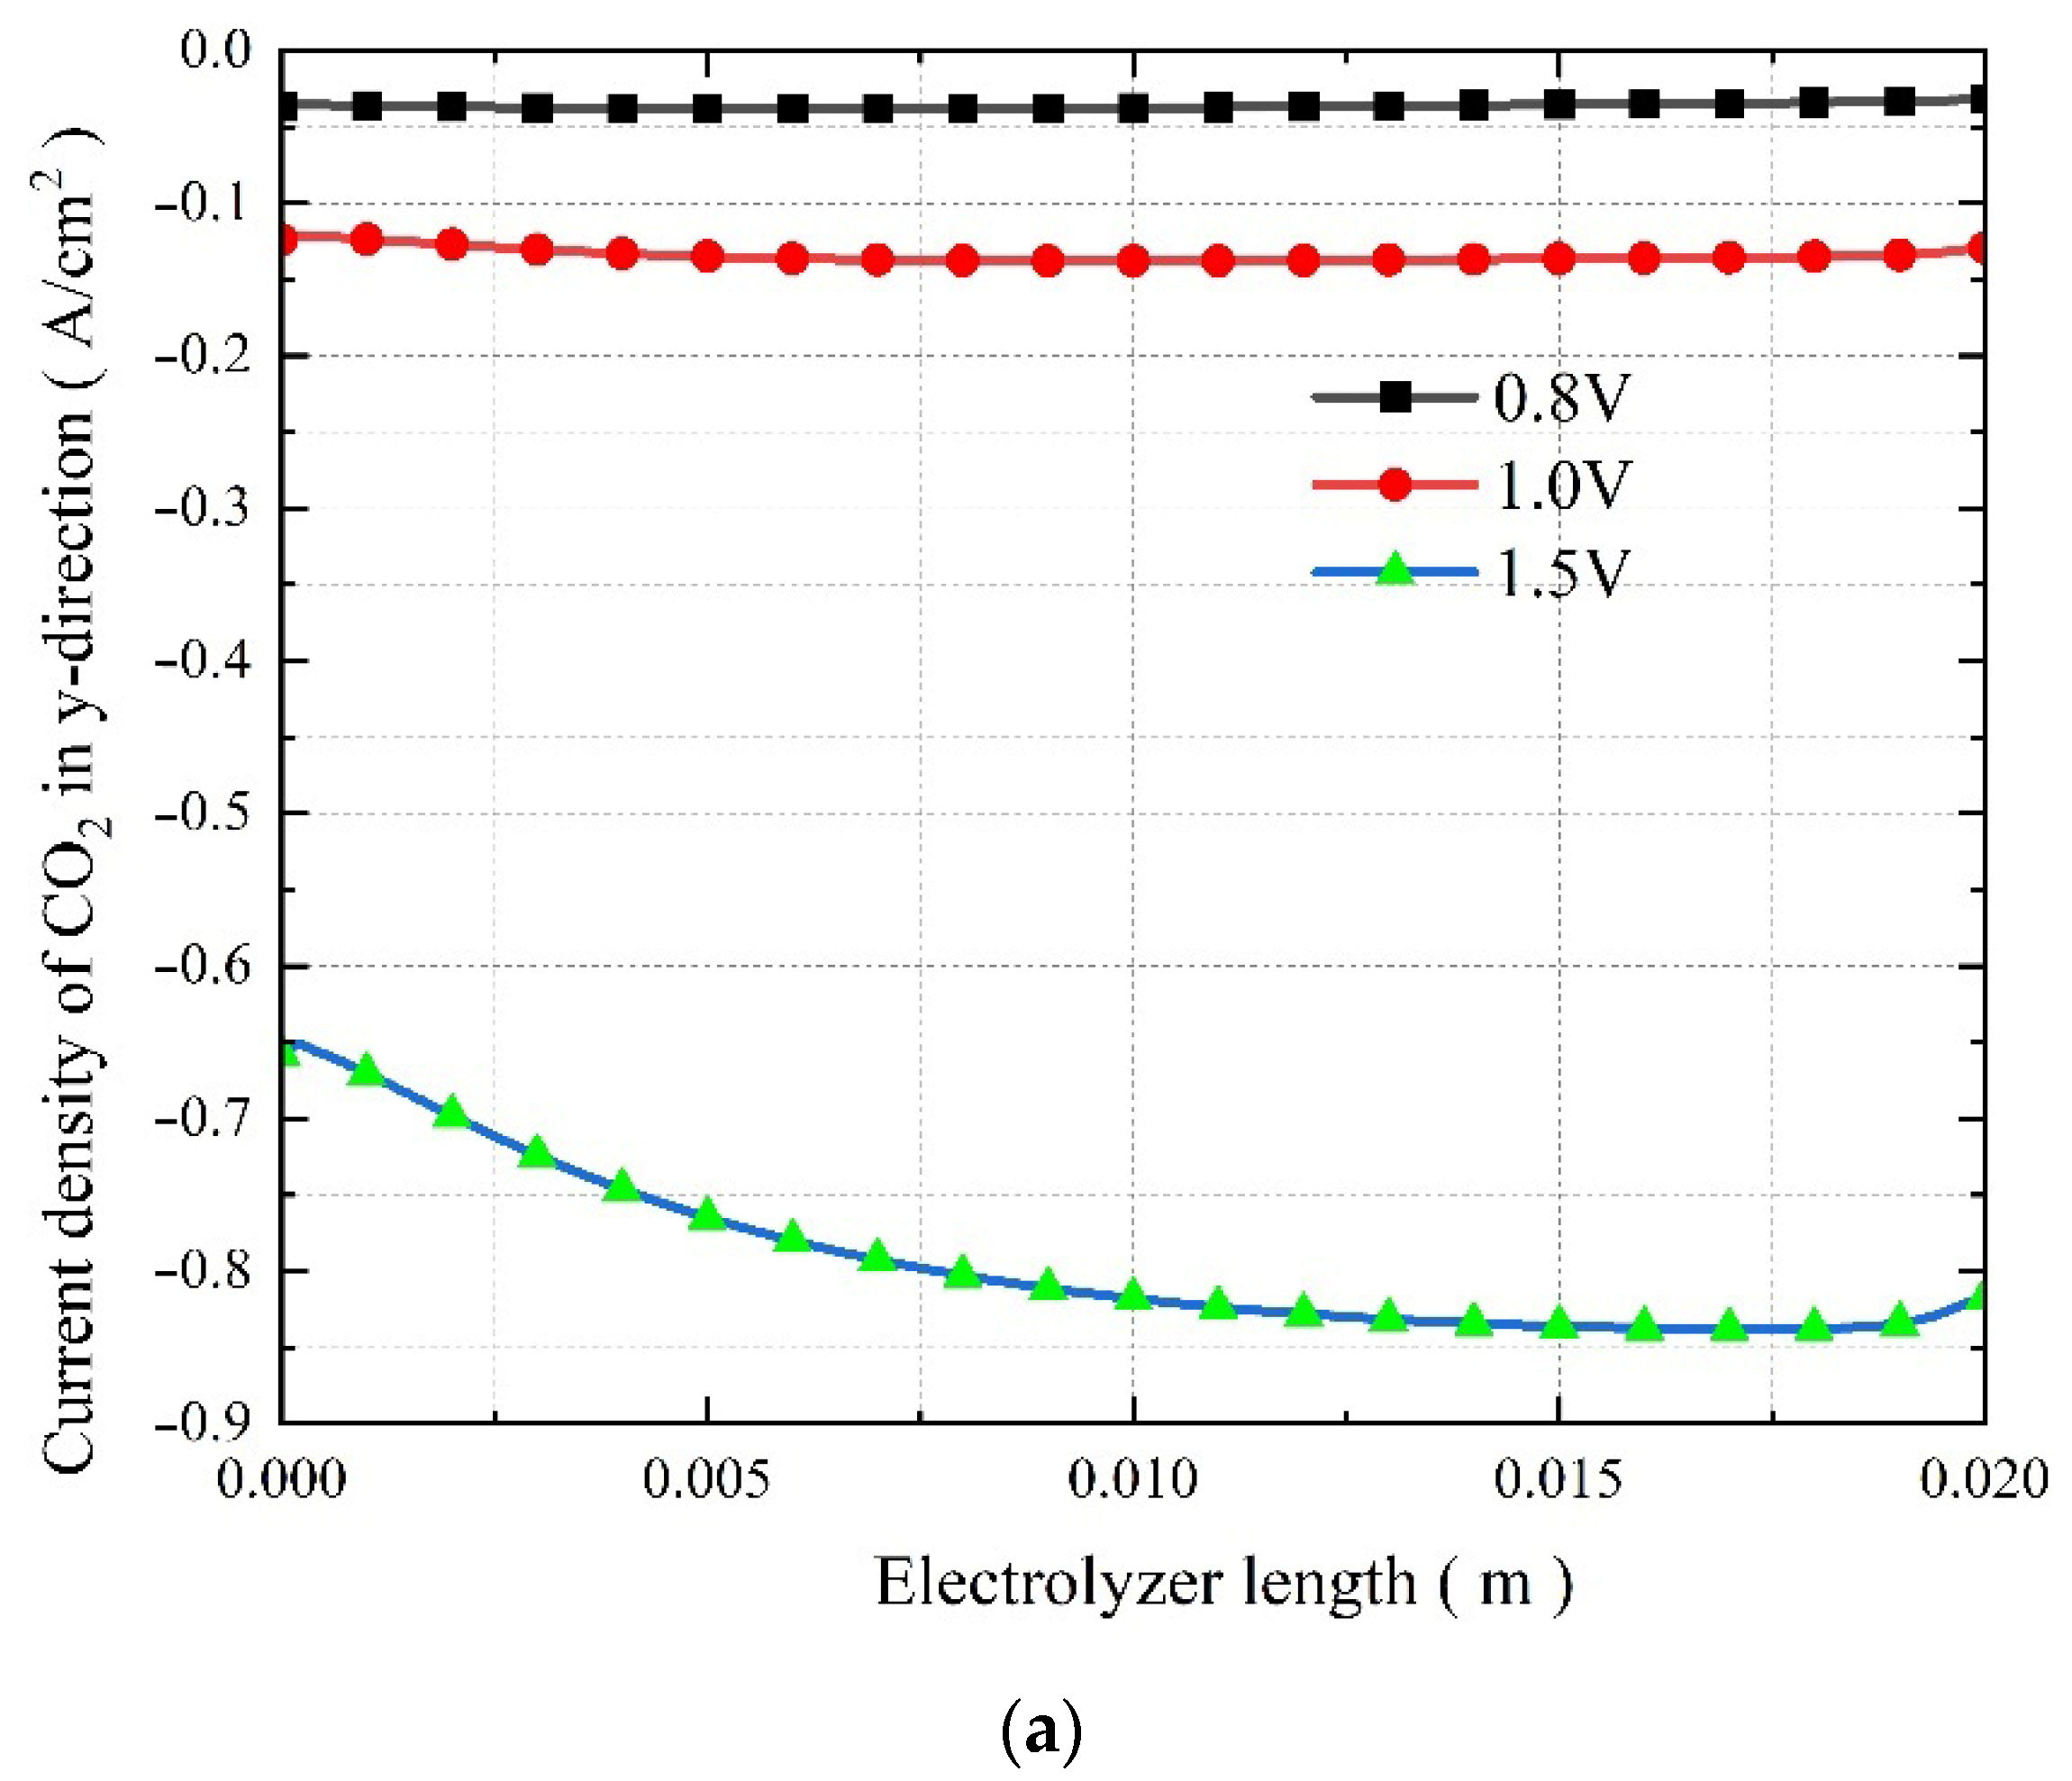
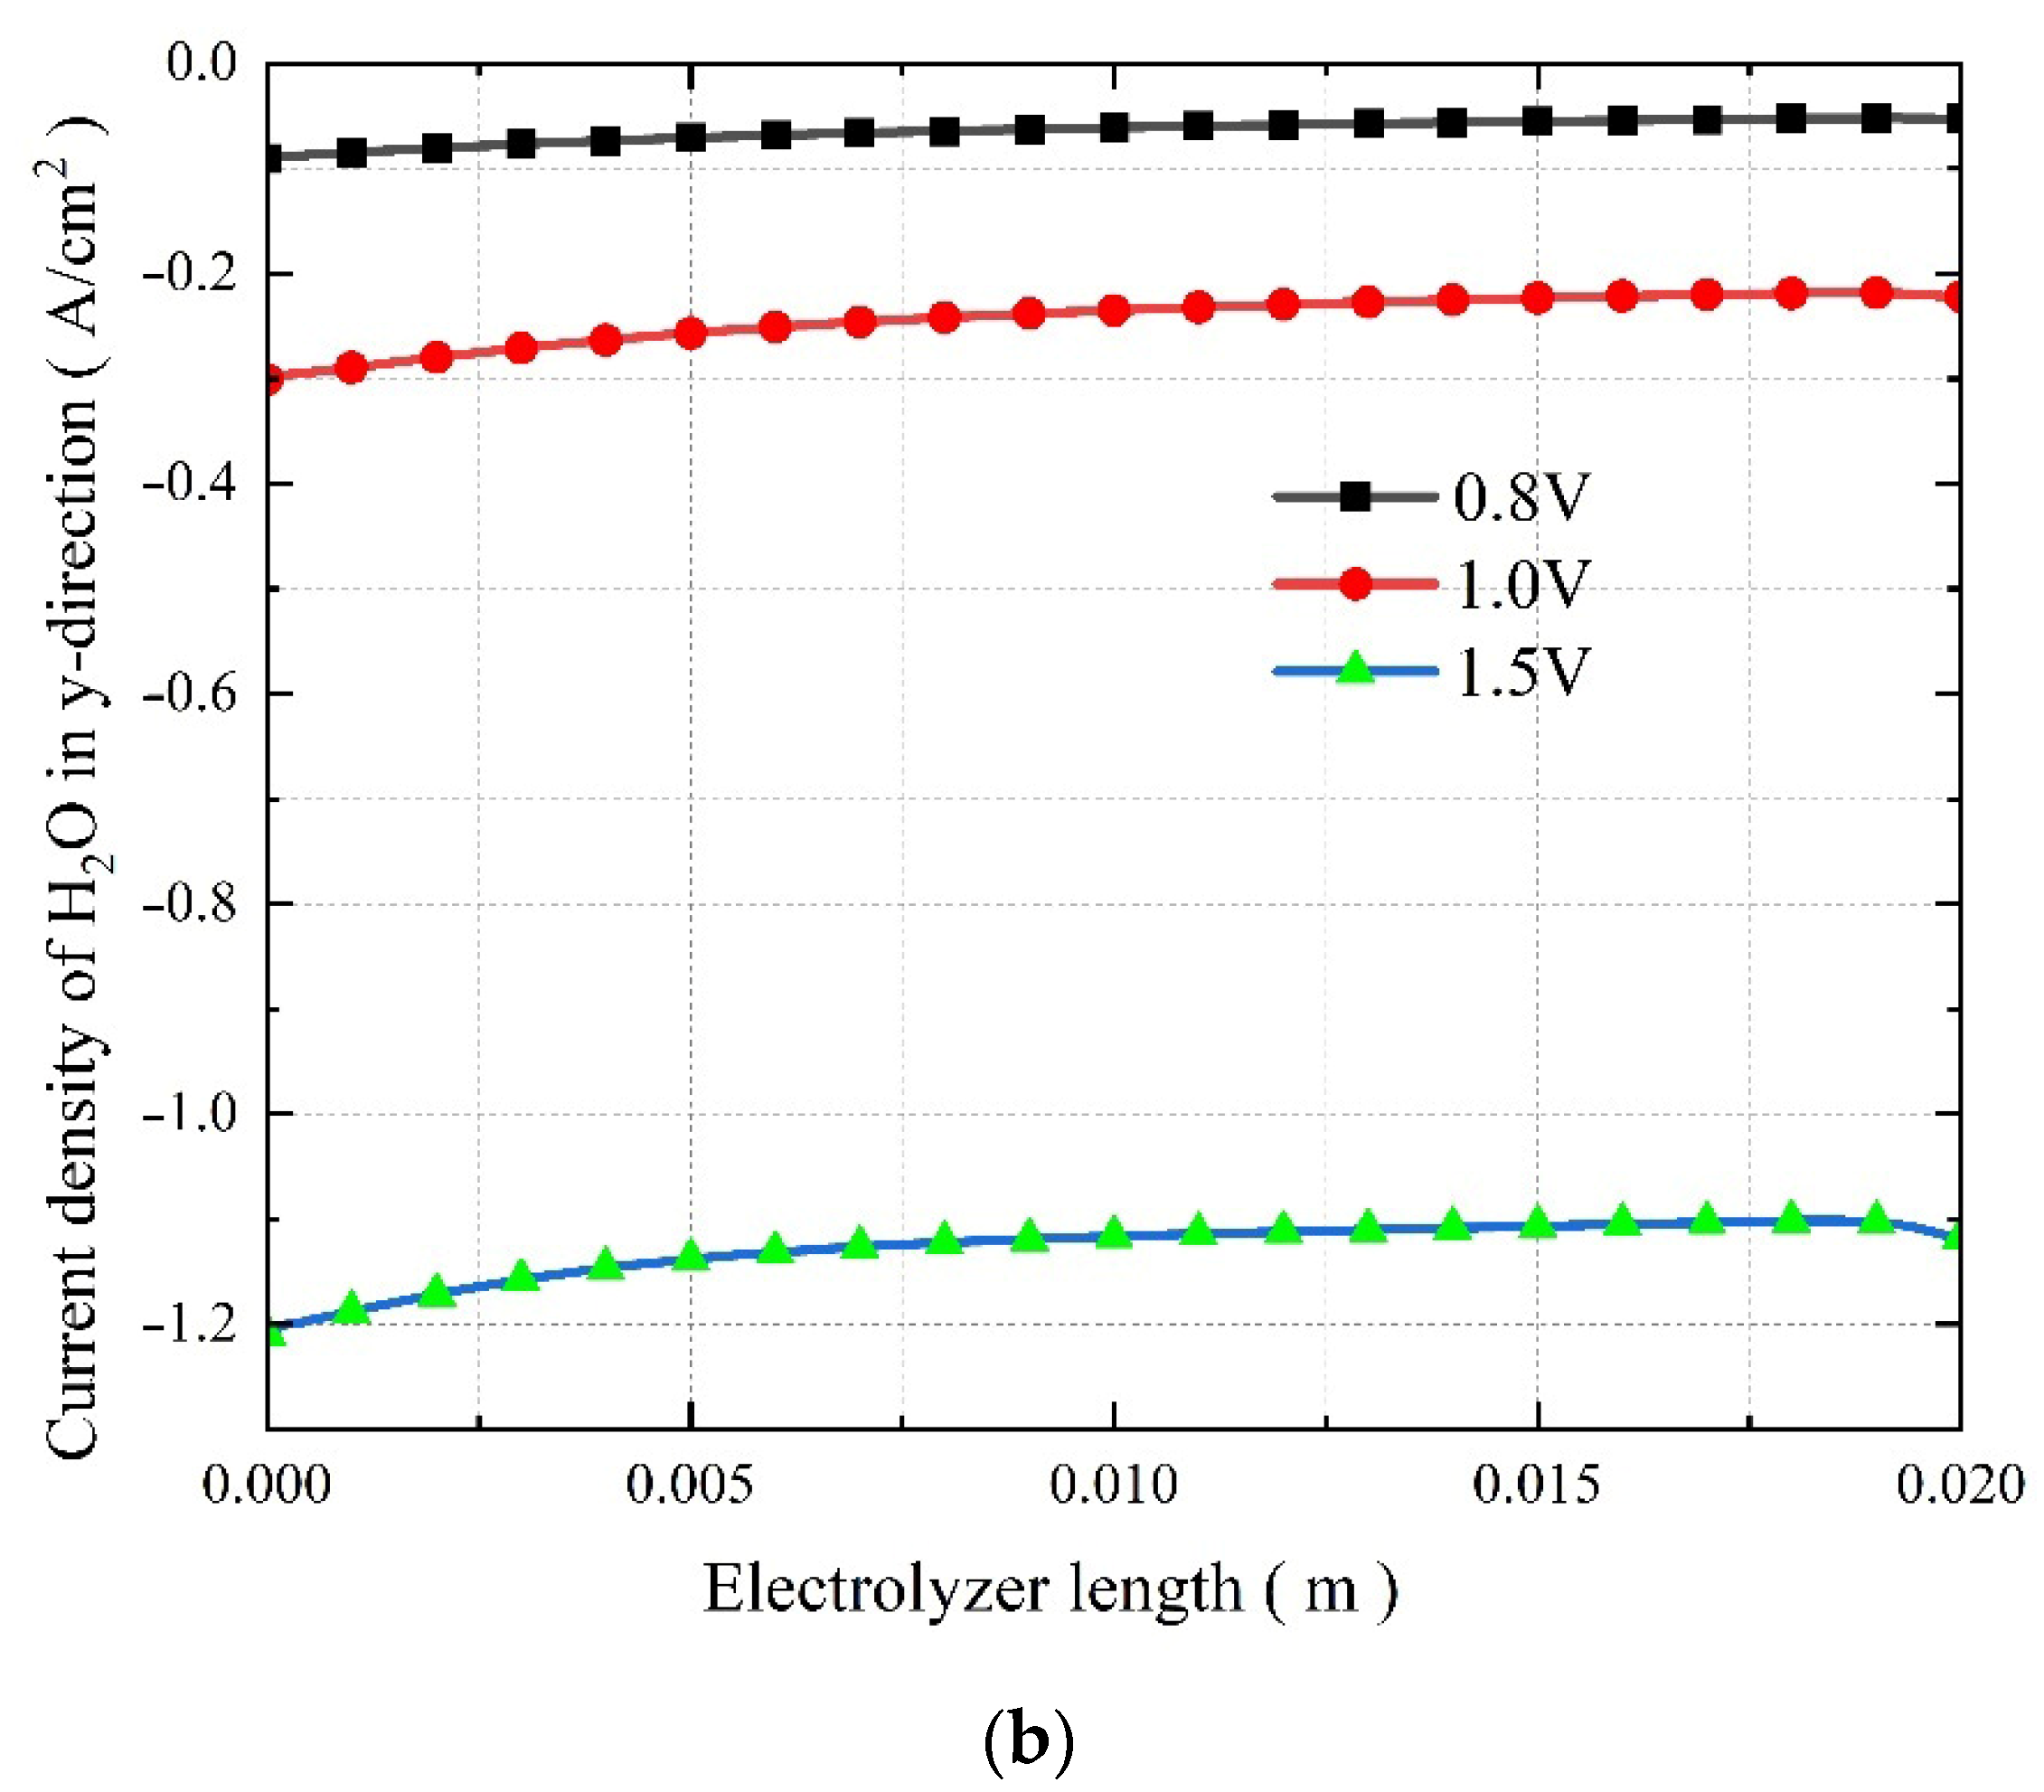
3.4. The Effect of Operating Voltage on the Co-Electrolysis of CO2 and H2O
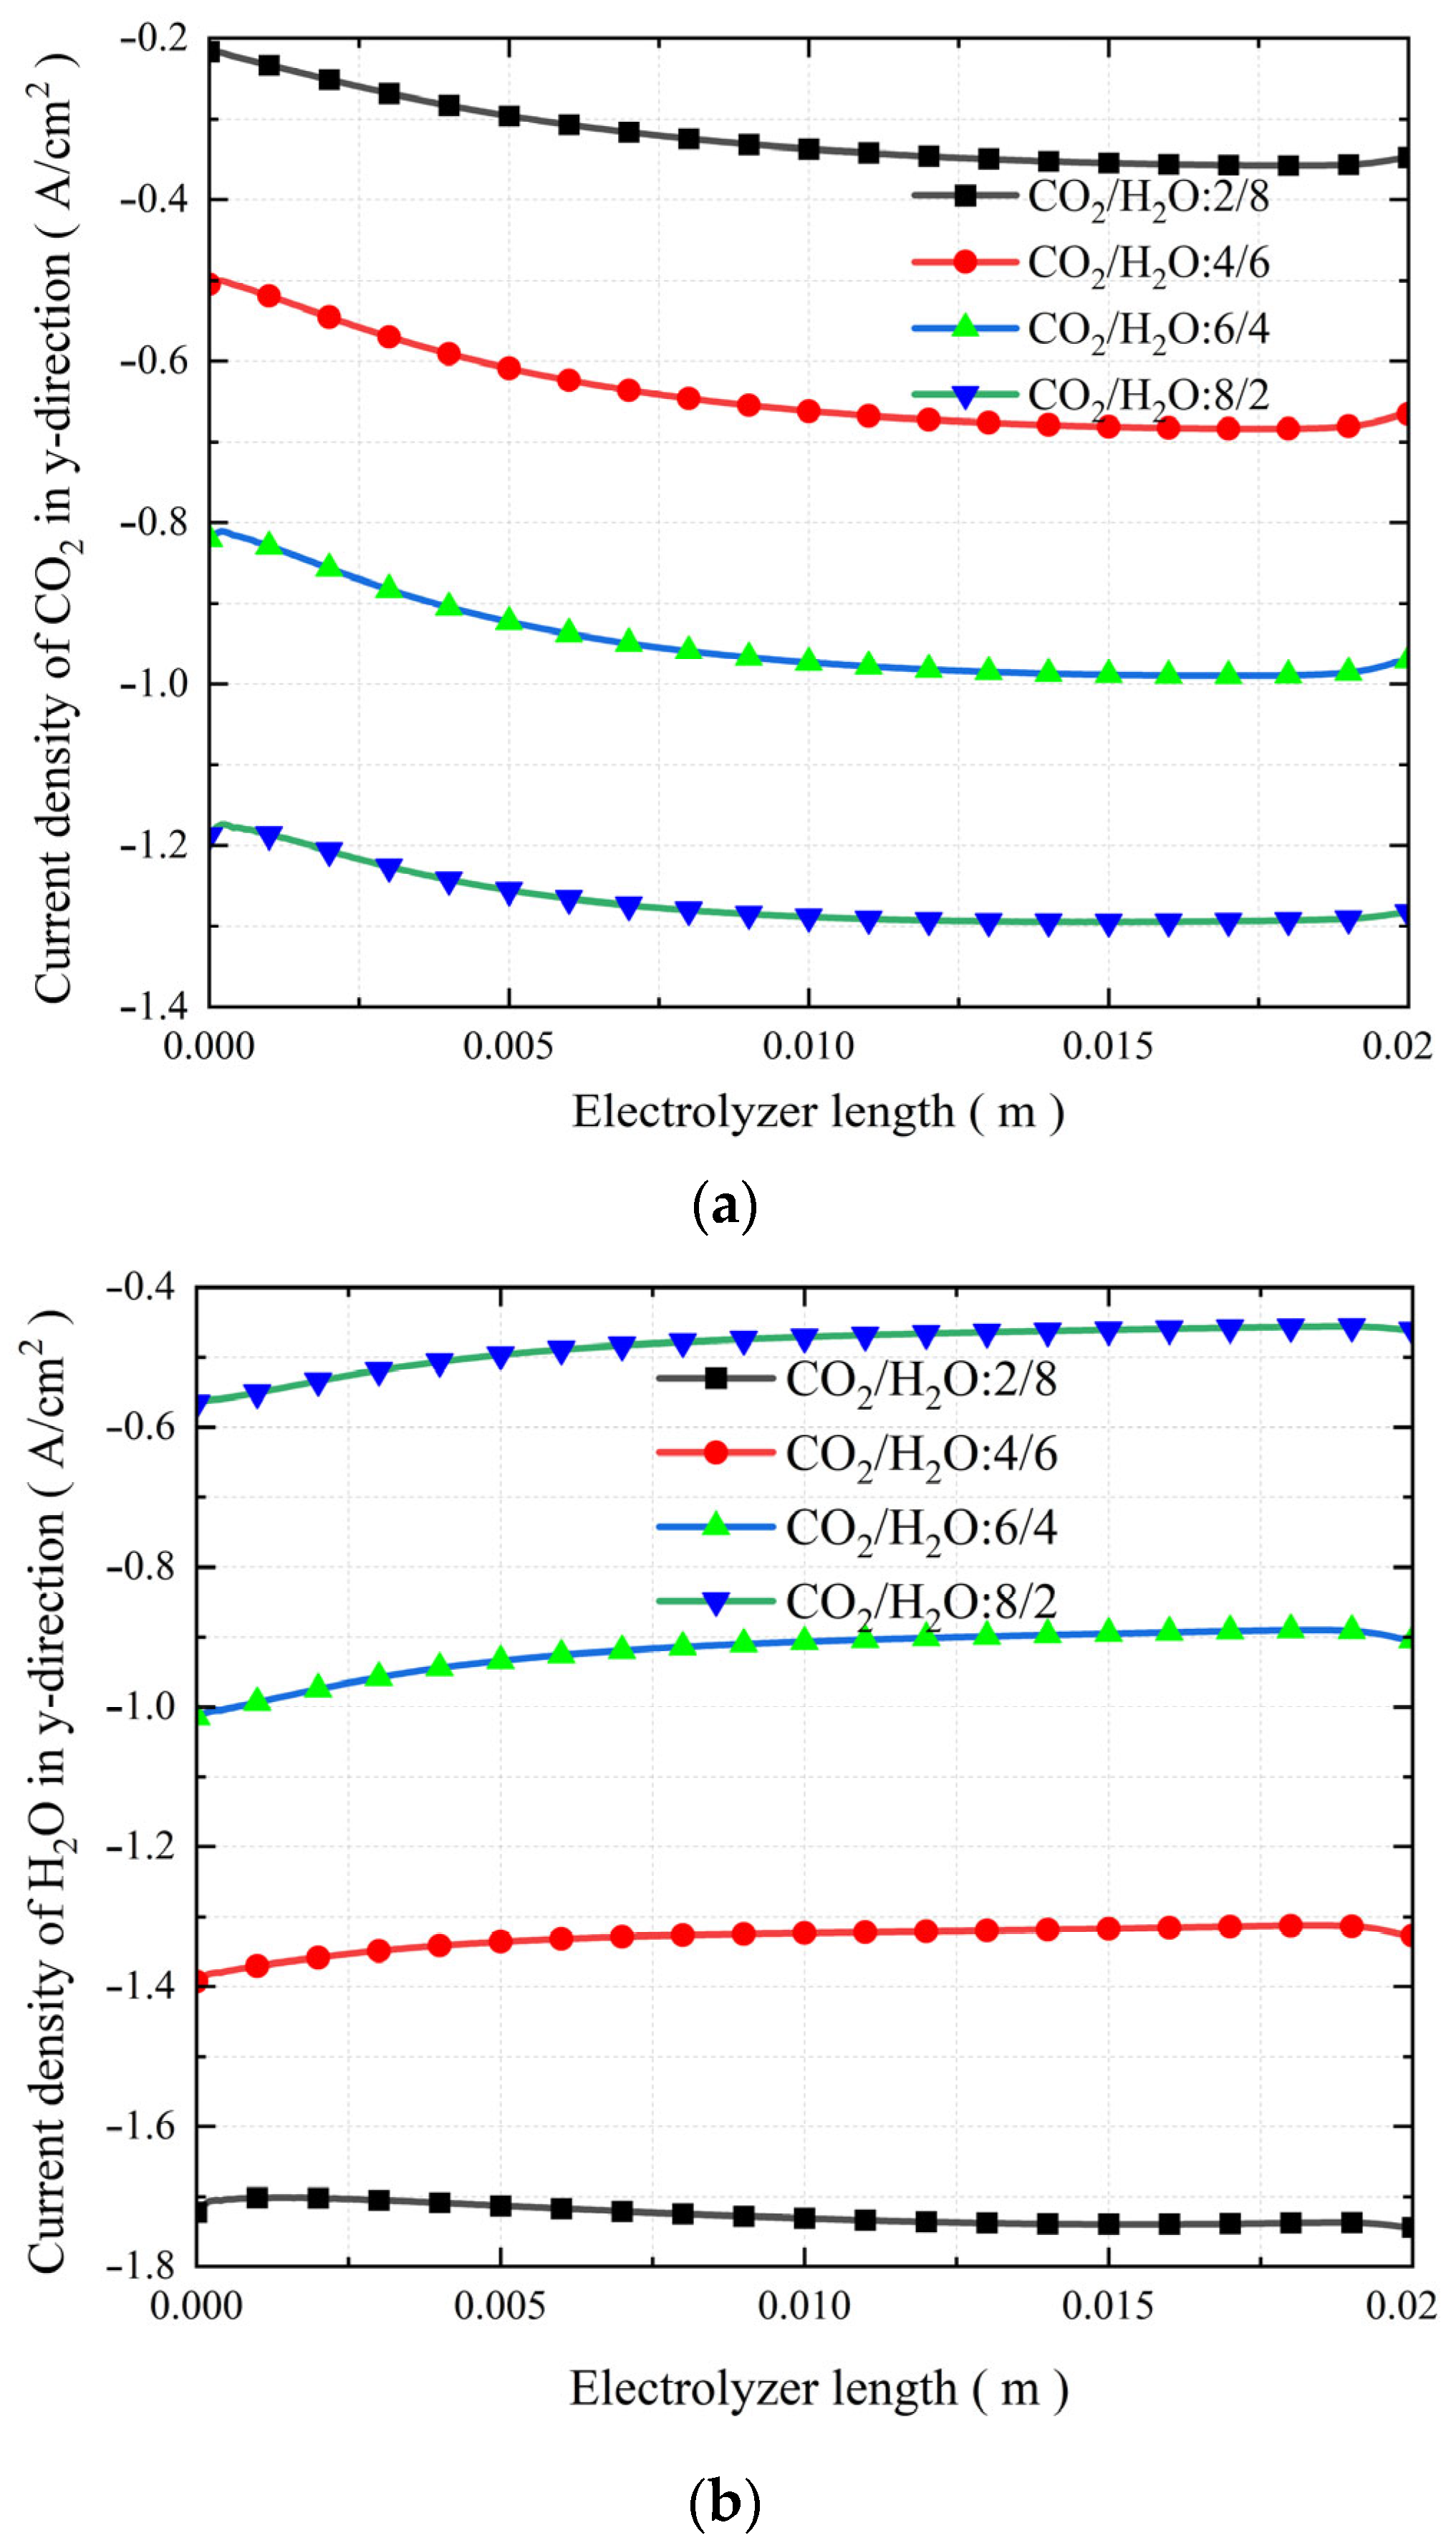
3.5. The Effect of Changes in the Molar Fraction of Inlet Substances
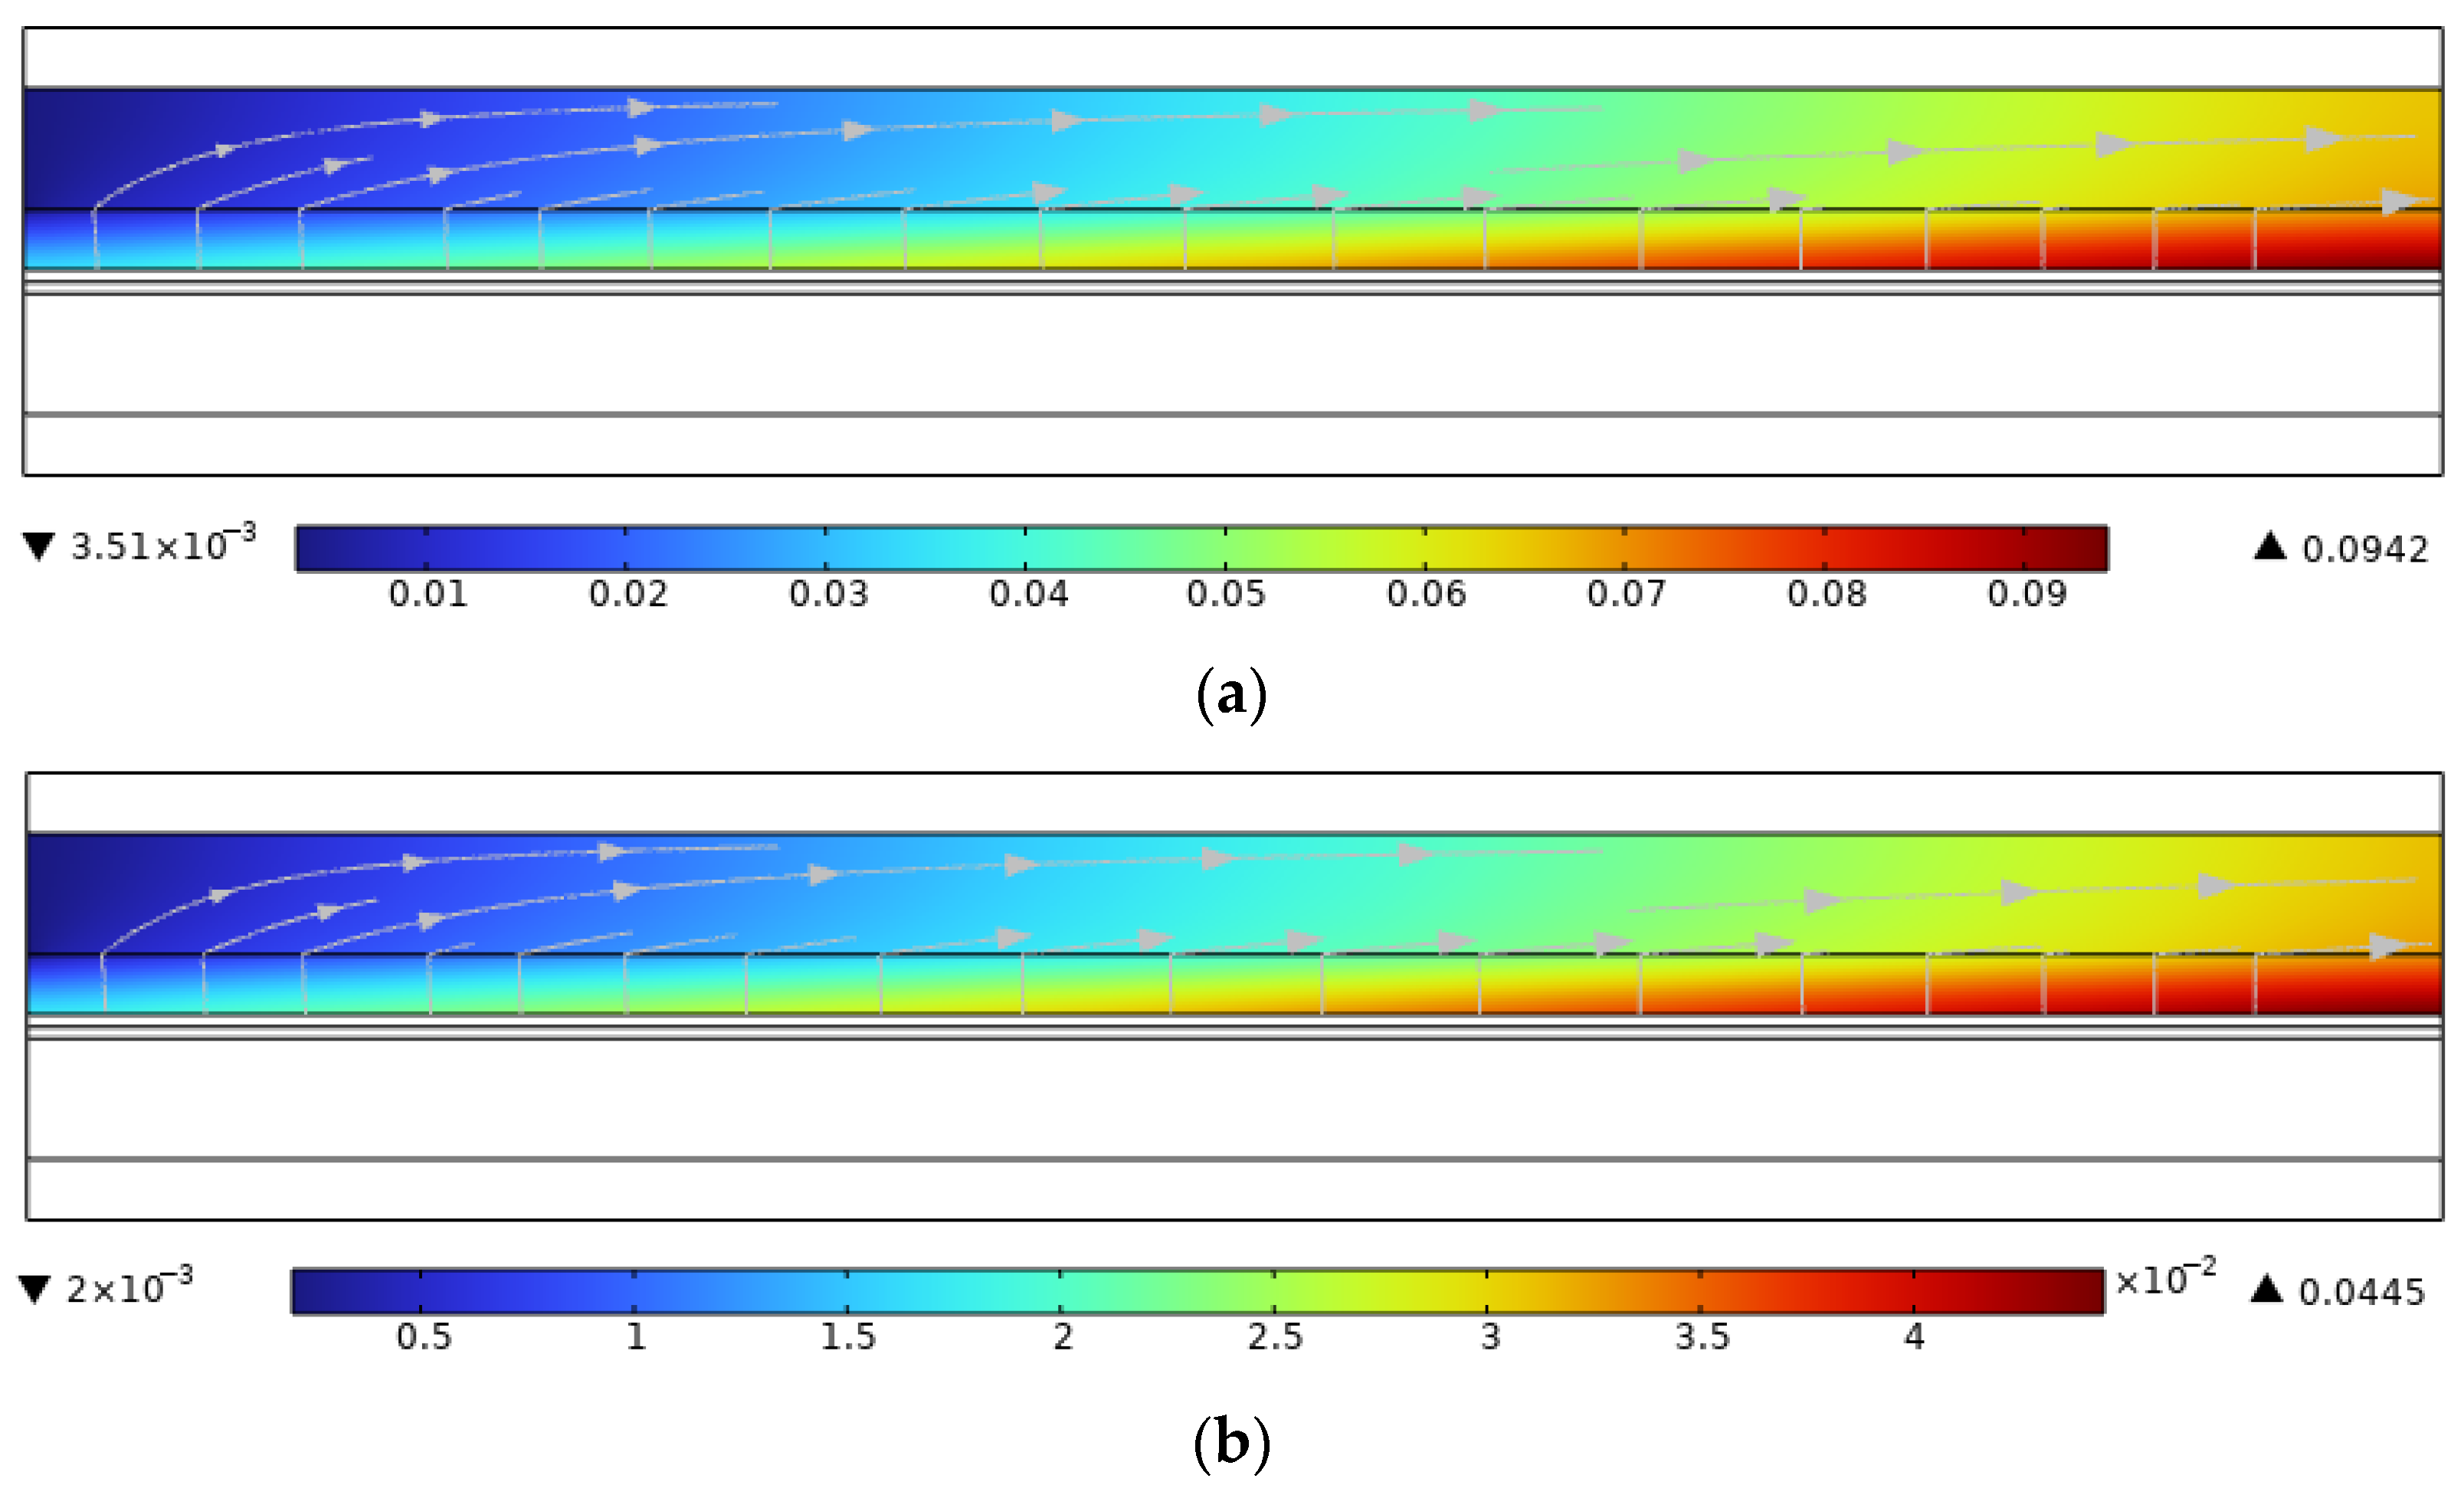
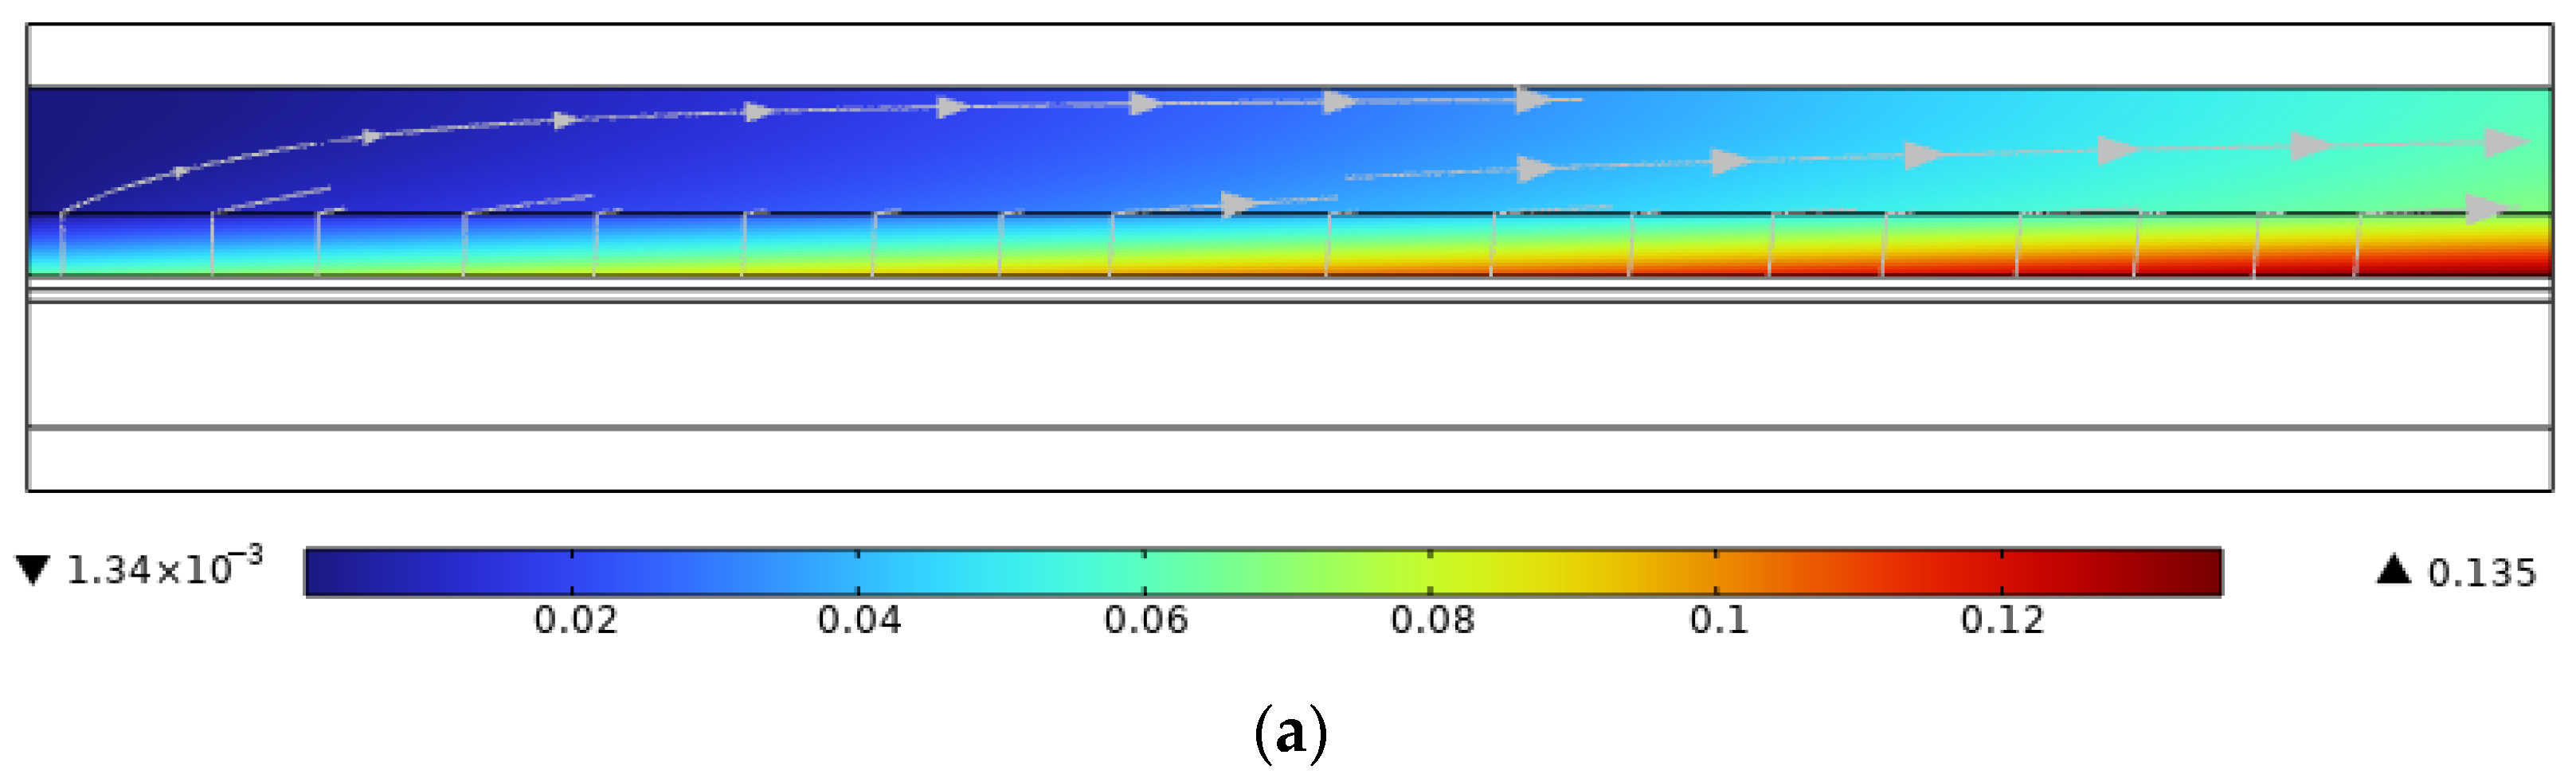
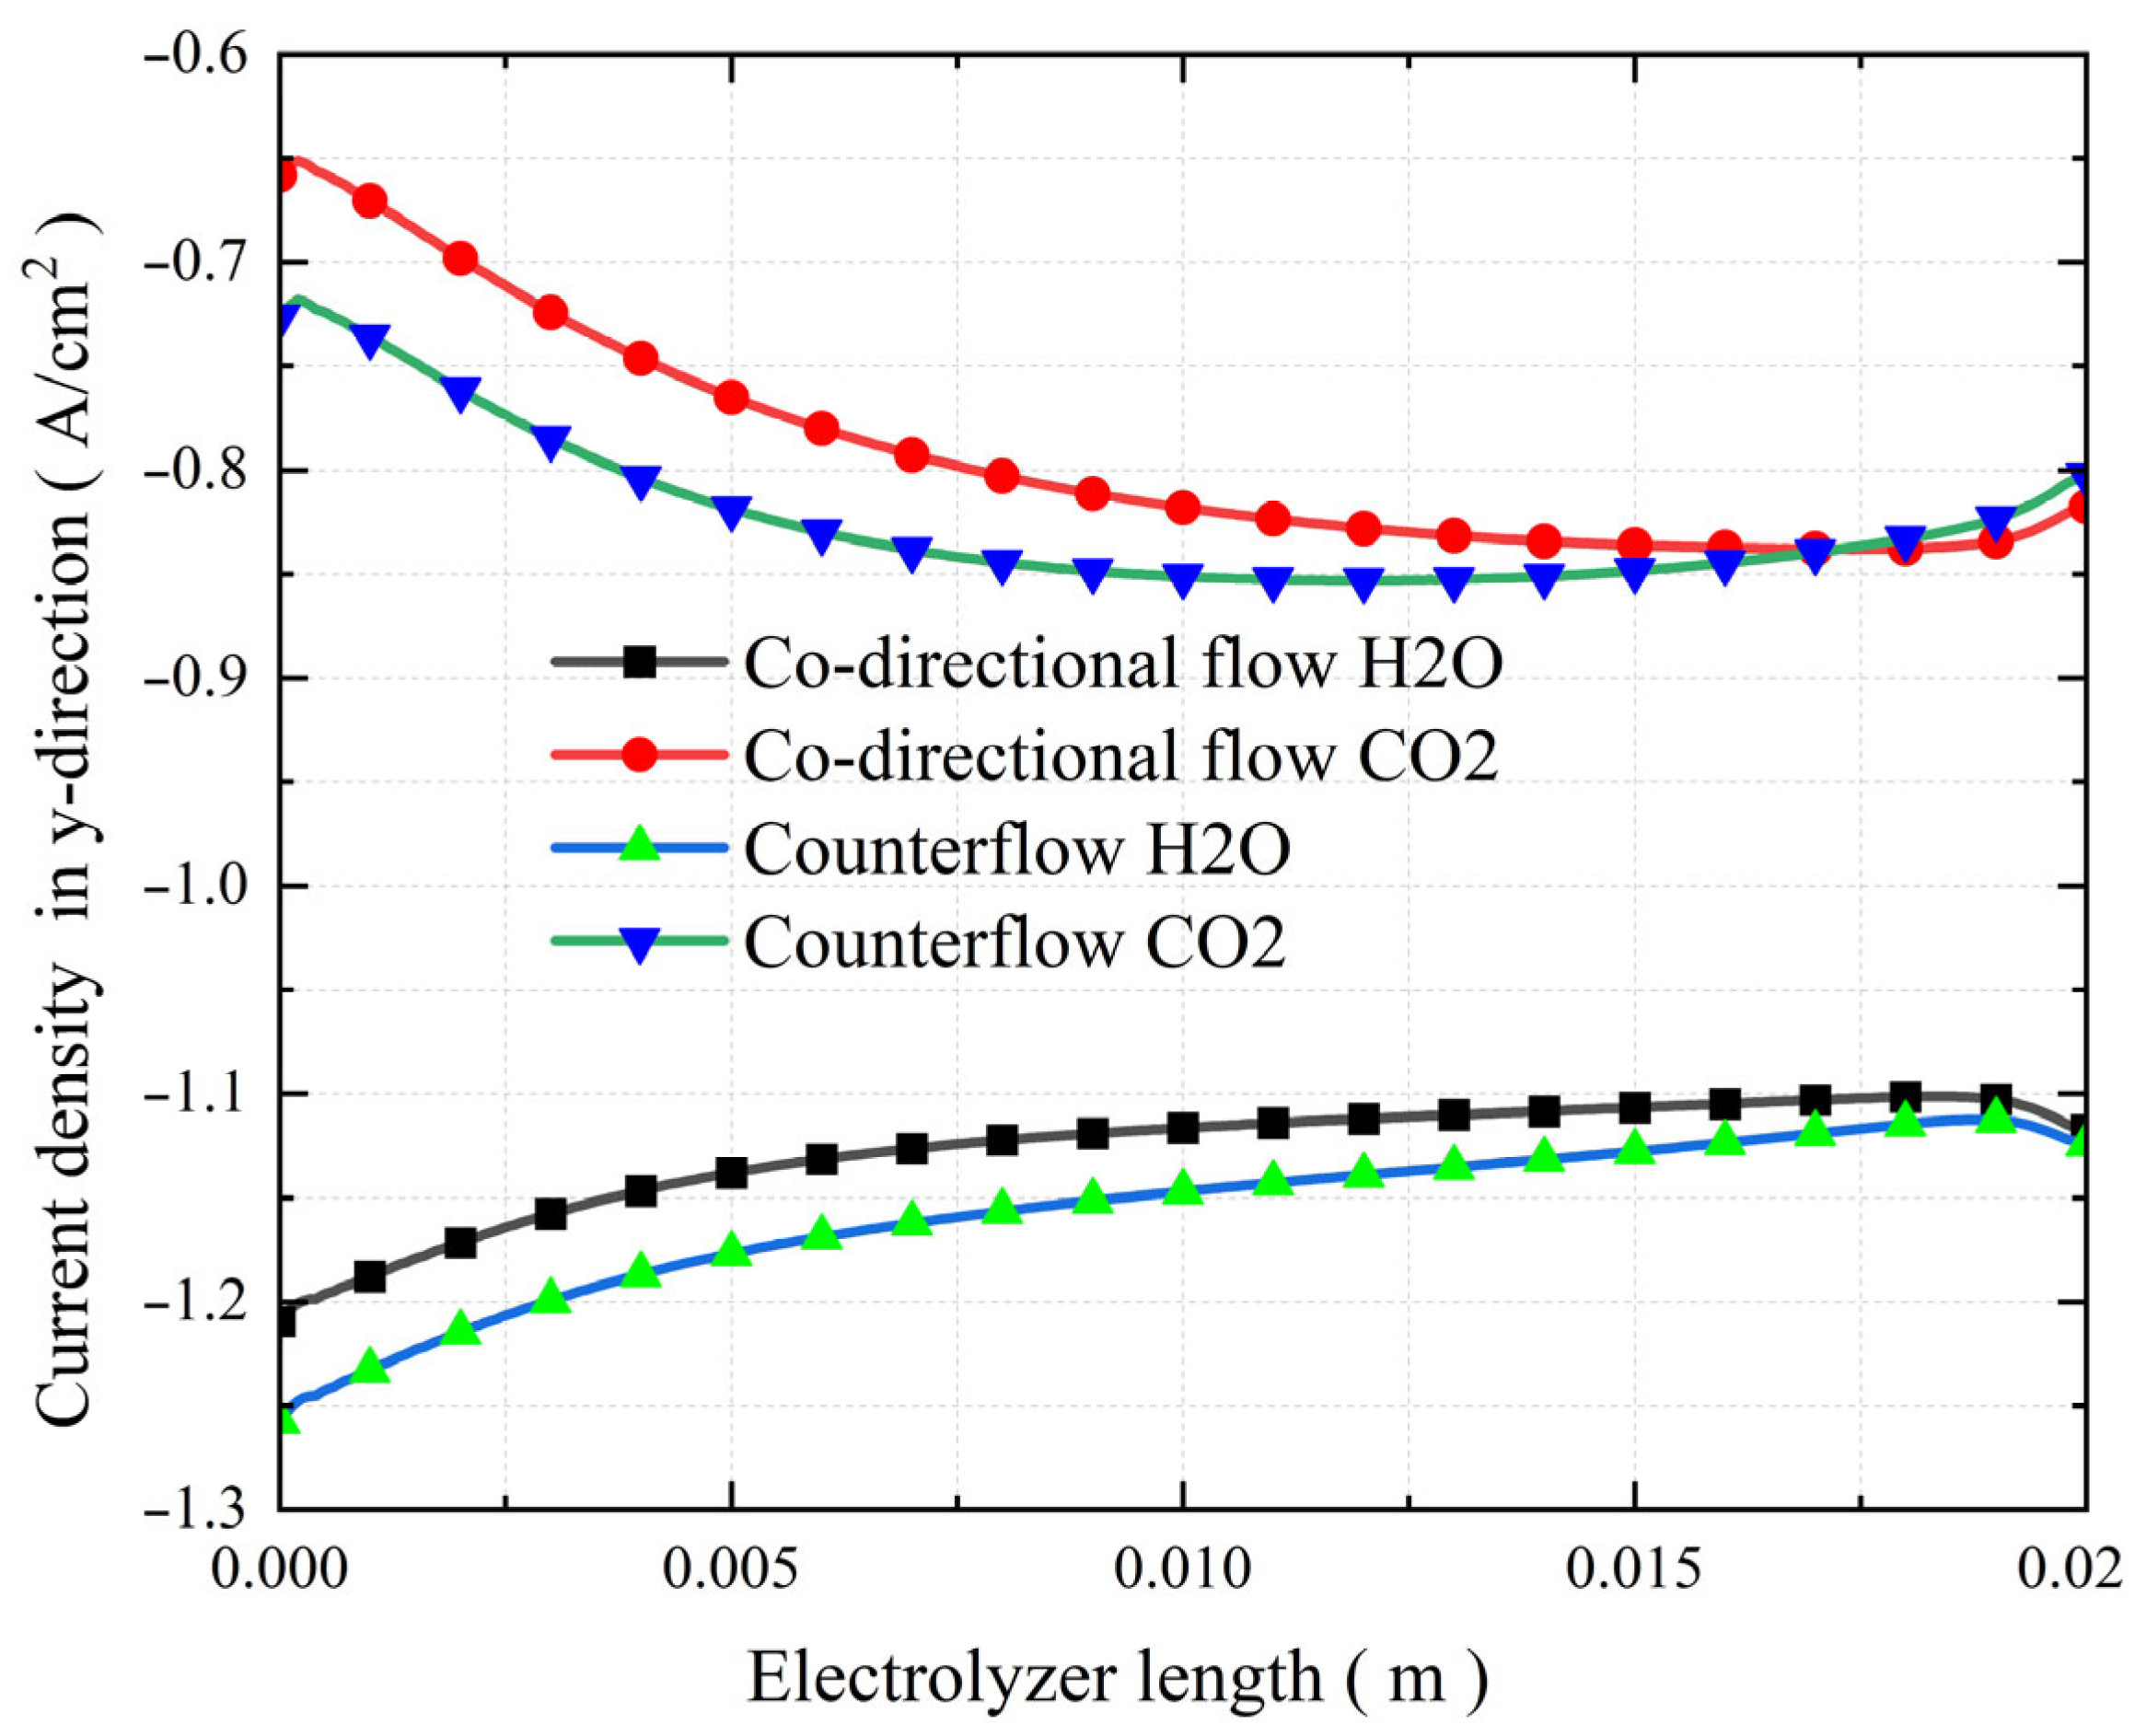
3.6. The Effect of Co-Directional Flow and Counterflow
3.7. Parametric Sensitivity: Voltage vs. Temperature vs. Flow Mode
4. Conclusions
Author Contributions
Funding
Data Availability Statement
Acknowledgments
Conflicts of Interest
References
- Zaman, K.; Moemen, M.A. Energy consumption, carbon dioxide emissions and economic development: Evaluating alternative and plausible environmental hypothesis for sustainable growth. Renew. Sustain. Energy Rev. 2017, 74, 1119–1130. [Google Scholar] [CrossRef]
- L’Orange Seigo, S.; Dohle, S.; Siegrist, M. Public perception of carbon capture and storage (CCS): A review. Renew. Sustain. Energy Rev. 2014, 38, 848–863. [Google Scholar] [CrossRef]
- Rubin, E.S. Understanding the pitfalls of CCS cost estimates. Int. J. Greenh. Gas Control 2012, 10, 181–190. [Google Scholar] [CrossRef]
- Mi, J.; Ma, X. Development Trend Analysis of Carbon Capture, Utilization and Storage Technology in China. Proc. Chin. Soc. Electr. Eng. 2019, 39, 2537–2543. [Google Scholar]
- Ahmed, S.; Khan, M.K.; Kim, J. Revolutionary advancements in carbon dioxide valorization via metal-organic framework-based strategies. Carbon Capture Sci. Technol. 2025, 15, 100405. [Google Scholar] [CrossRef]
- Zhang, W.Q.; Yu, B.; Chen, J.; Xu, J.M. Hydrogen Production through Solid Oxide Electrolysis at Elevated Temperatures. Prog. Chem. 2008, 20, 778–787. [Google Scholar]
- Dogu, D.; Gunduz, S.; Meyer, K.E.; Deke, D.J.; Co, A.C.; Ozkan, U.S. CO2 and H2O Electrolysis Using Solid Oxide Electrolyzer Cell (SOEC) with La and Cl- Doped Strontium Titanate Cathode. Catal. Lett. 2019, 149, 1743–1752. [Google Scholar] [CrossRef]
- Chen, B.; Xu, H.; Chen, L.; Li, Y.H.; Xia, C.R.; Ni, M. Modelling of One-Step Methanation Process Combining SOECs and Fischer-Tropsch-Like Reactor. J. Electrochem. Soc. 2016, 163, F3001–F3008. [Google Scholar] [CrossRef]
- Chen, B.; Xu, H.R.; Ni, M. Modelling of SOEC-FT Reactor: Pressure Effects on Methanation Process. Appl. Energy 2017, 185, 814–824. [Google Scholar] [CrossRef]
- Gerloff, N. Comparative Life-Cycle-Assessment analysis of three major water electrolysis technologies while applying various energy scenarios for a greener hydrogen production. J. Energy Storage 2021, 43, 102759. [Google Scholar] [CrossRef]
- Hu, K.; Fang, J.; Ai, X.; Huang, D.; Zhong, Z.; Yang, X. Comparative study of alkaline water electrolysis, proton exchange membrane water electrolysis and solid oxide electrolysis through multiphysics modeling. Appl. Energy 2022, 312, 118788. [Google Scholar] [CrossRef]
- Galadima, A.; Muraza, O. From synthesis gas production to methanol synthesis and potential upgrade to gasoline range hydrocarbons: A review. J. Nat. Gas Sci. Eng. 2015, 25, 303–316. [Google Scholar] [CrossRef]
- Ebbesen, S.D.; Knibbe, R.; Mogensen, M. Co-Electrolysis of Steam and Carbon Dioxide in Solid Oxide Cells. J. Electrochem. Soc. 2012, 159, F482–F489. [Google Scholar] [CrossRef]
- Ebbesen, S.D.; Mogensen, M. Electrolysis of Carbon Dioxide in Solid Oxide Electrolysis Cells. J. Power Sources 2009, 193, 349–358. [Google Scholar] [CrossRef]
- Choi, Y.; Byun, S.; Seo, D.W.; Hwang, H.J.; Kim, T.W. New design and performance evaluation of 1 kW-class reversible solid oxide electrolysis-fuel cell stack using flat-tubular cells. J. Power Sources 2022, 542, 231744. [Google Scholar] [CrossRef]
- Li, A.; Song, C.; Lin, Z. A multiphysics fully coupled modeling tool for the design and operation analysis of planar solid oxide fuel cell stacks. Appl. Energy 2017, 190, 1234–1244. [Google Scholar] [CrossRef]
- Guo, M.T.; Xiao, G.P.; Wang, J.Q.; Lin, Z.J. Parametric study of kW-class solid oxide fuel cell stacks fueled by hydrogen and methane with fully multiphysical coupling model. Int. J. Hydrogen Energy 2021, 46, 9488–9502. [Google Scholar] [CrossRef]
- Spacil, H.S.; Tedmon, C.S. Electrochemical dissociation of water vapor in solid oxide electrolyte cells: I. thermodynamics and cell characteristics. J. Electrochem. Soc. 1969, 116, 1618. [Google Scholar] [CrossRef]
- Akins, J.E. The oil crisis: This time the wolf is here. Foreign Aff. 1973, 51, 462–490. [Google Scholar] [CrossRef]
- Hartgen, D.T.; Neveu, A.J. The 1979 energy crisis: Who conserved how much? Transp. Res. Board Spec. Rep. 1980, 191, 157–165. [Google Scholar]
- Virkar, A.V. Mechanism of oxygen electrode delamination in solid oxide electrolyzer cells. Int. J. Hydrogen Energy 2010, 35, 9527–9543. [Google Scholar] [CrossRef]
- Zhang, L.; Zhu, L.; Virkar, A.V. Modeling of Oxygen Chemical Potential Distribution in Solid Oxide Electrolyzer Cells. J. Electrochem. Soc. 2019, 166, F1275–F1283. [Google Scholar] [CrossRef]
- Zhang, Y.; Chen, K.; Xia, C.; Jiang, S.P.; Ni, M. A model for the delamination kinetics of La0.8Sr0.2MnO3 oxygen electrodes of solid oxide electrolysis cells. Int. J. Hydrogen Energy 2012, 37, 13914–13920. [Google Scholar] [CrossRef]
- Yashima, M.; Kakihana, M.; Yoshimura, M. Metastable-stable phase diagrams in the zirconia-containing systems utilized in solid-oxide fuel cell application. Solid State Ion. 1996, 86–88, 1131–1149. [Google Scholar] [CrossRef]
- Hubert, M.; Laurencin, J.; Cloetens, P.; Morel, B.; Montinaro, D.; Lefebvre-Joud, F. Impact of nickel agglomeration on solid oxide cell operated in fuel cell and electrolysis modes. J. Power Sources 2018, 397, 240–251. [Google Scholar] [CrossRef]
- Chen-Wiegart, Y.C.K.; Kennouche, D.; Cronin, J.S.; Barnett, S.A.; Wang, J. Effect of Ni content on the morphological evolution of Ni-YSZ solid oxide fuel cell electrodes. Appl. Phys. Lett. 2016, 108, 083903. [Google Scholar] [CrossRef]
- Chen, M.; Liu, Y.L.; Bentzen, J.J.; Zhang, W.; Sun, X.F.; Hauch, A.; Tao, Y.K.; Bowen, R.B.; Hendriksen, P.V. Microstructural Degradation of Ni/YSZ electrodes in solid oxide electrolysis cells under high current. J. Electrochem. Soc. 2013, 160, F883. [Google Scholar] [CrossRef]
- Udagawa, J.; Aguiar, P.; Brandon, N.P. Hydrogen production through steam electrolysis: Model-based dynamic behaviour of a cathode-supported intermediate temperature solid oxide electrolysis cell. J. Power Sources 2008, 180, 46–55. [Google Scholar] [CrossRef]
- Wang, Y.; Banerjee, A.; Deutschmann, O. Dynamic behavior and control strategy study of CO2/H2O co-electrolysis in solid oxide electrolysis cells. J. Power Sources 2019, 412, 255–264. [Google Scholar] [CrossRef]
- Liu, C.; Dang, Z.; Xi, G. Numerical study on thermal stress of solid oxide electrolyzer cell with various flow configurations. Appl. Energy 2024, 353, 122041. [Google Scholar] [CrossRef]
- Beyrami, J.; Nakashima, R.N.; Nemati, A.; Frandsen, H.L. Lifetime and performance of solid oxide electrolysis stacks and systems under different operation modes and conditions. Int. J. Hydrogen Energy 2025, 102, 980–995. [Google Scholar] [CrossRef]
- Błaszczak, P.; Zając, M.; Ducka, A.; Matlak, K.; Wolanin, B.; Wang, S.F.; Mandziak, A.; Bochentyn, B.; Jasiński, P. High-temperature co-electrolysis of CO2/H2O and direct methanation over Co-impregnated SOEC: Bimetallic synergy between Co and Ni. Int. J. Hydrogen Energy 2022, 47, 35017–35037. [Google Scholar] [CrossRef]
- Zaghloul, M.A.; Mason, J.H.; Wang, M.; Buric, M.; Peng, Z.; Lee, S.; Ohodnicki, P.; Abernathy, H.; Chen, K.P. High spatial-resolution temperature profile measurements of solid-oxide fuel cells. Appl. Energy 2021, 288, 116633. [Google Scholar] [CrossRef]
- Xing, X.; Lin, J.; Song, Y.; Hu, Q.; Zhou, Y.; Mu, S. Optimization of hydrogen yield of a high-temperature electrolysis system with coordinated temperature and feed factors at various loading conditions: A model-based study. Appl. Energy 2018, 232, 368–385. [Google Scholar] [CrossRef]
- Luo, Y.; Shi, Y.X.; Li, W.Y.; Cai, N.S. Comprehensive Modeling of Tubular Solid Oxide Electrolysis Cell for Co-Electrolysis of Steam and Carbon Dioxide. Energy 2014, 70, 420–434. [Google Scholar] [CrossRef]
- Chi, J.; Yu, H.M. Water Electrolysis Based on Renewable Energy for Hydrogen Production. Chin. J. Catal. 2018, 39, 390–394. [Google Scholar] [CrossRef]
- Zhao, J.G.; Lin, Z.H.; Zhou, M.J. Three-Dimensional Modeling and Performance Study of High Temperature Solid Oxide Electrolysis Cell with Metal Foam. Sustainability 2022, 14, 7064. [Google Scholar] [CrossRef]
- Zhang, Z.; Guan, C.Z.; Xie, L.D.; Wang, J.Q. Design and Analysis of a Novel Opposite Trapezoidal Flow Channel for Solid Oxide Electrolysis Cell Stack. Energies 2023, 16, 159. [Google Scholar] [CrossRef]


| Parameter | Value |
|---|---|
| Cathode thickness (Cathode-supported) dc (um) | 500 |
| Electrolyte thickness, L (mm) | 100 |
| Anode thickness, da (mm) | 100 |
| Height of gas flow channel (mm) | 1 |
| Length of the planar SOEC (mm) | 20 |
| Thickness of interconnect (mm) | 0.5 |
| Electrode porosity, ε | 0.4 |
| Electrode tortuosity, | 3 |
| Gas permeability (m2) | 1 × 10⁻¹⁰ |
| Operating pressure, P (bar) | 1 |
| Operating temperature, T (K) | 1073 |
| Exchange current density for H2O electrolysis (A/m2) | 1 |
| Exchange current density for oxygen reaction (A/m2) | 1 |
| Exchange current density for CO2 electrolysis (A/m2) | 1 |
| Inlet mass flow rate (kg/s) | 0.0005 |
| Molar fraction of inlet H2O | 0.498 |
| Molar fraction of inlet CO2 | 0.5 |
| Molar fraction of inlet H2 | 0.001 |
| Molar fraction of inlet CO | 0.001 |
| Potential (V) | Experimental Current Density (50/50) (A/m2) | This Work’s Current Density (50/50) (A/m2) | Err. % | Experimental Current Density (50/50) (A/m2) | This Work’s Current Density (50/50) (A/m2) | Err. % |
|---|---|---|---|---|---|---|
| 1.0 | 872.87 | 996.29 | 14.1 | 1892.23 | 2396.4 | 26.7 |
| 1.1 | 3314.3 | 2764.7 | –16.6 | 4556.09 | 4392.3 | –3.6 |
| 1.2 | 5246 | 4558.7 | –13.1 | 6820.61 | 6554.5 | –3.9 |
| 1.3 | 6446.57 | 6593.2 | 2.3 | 8663.84 | 9139.6 | 5.5 |
| Molar Fraction of H2O | Molar Fraction of CO2 | Molar Fraction of CO | Molar Fraction of H2 | |
|---|---|---|---|---|
| CO2/H2O: 2/8 | 0.71792 | 0.18163 | 0.019477 | 0.080968 |
| CO2/H2O: 4/6 | 0.52663 | 0.35552 | 0.045637 | 0.07221 |
| CO2/H2O: 6/4 | 0.3433 | 0.52462 | 0.076542 | 0.055538 |
| CO2/H2O: 8/2 | 0.16721 | 0.68988 | 0.11123 | 0.031683 |
| Molar Fraction of H2O | Molar Fraction of CO2 | Molar Fraction of CO | Molar Fraction of H2 | |
|---|---|---|---|---|
| Counterflow | 0.43243 | 0.43828 | 0.062886 | 0.066402 |
| Co-directional flow | 0.43405 | 0.44059 | 0.060582 | 0.064787 |
| Variable | Scan Window | Gain in CO Yield () | Relative Change in Variable ( ) | Normalized S | Practical Impact |
|---|---|---|---|---|---|
| Voltage (V) | 0.8 → 1.5 V | ×15.0 | 0.88 | ≈1.0 | One extra 0.1 V raises CO~70%; strongest lever. |
| Temperature (T) | 923 → 1423 K | ×4.3 | 0.46 | ≈0.8 | High T cuts activation losses; second most effective. |
| Flow mode (F) | Co-flow → Counter-flow | +2.3% | discrete | ≈0.03 | Helps outlet utilization; minor but additive. |
Disclaimer/Publisher’s Note: The statements, opinions and data contained in all publications are solely those of the individual author(s) and contributor(s) and not of MDPI and/or the editor(s). MDPI and/or the editor(s) disclaim responsibility for any injury to people or property resulting from any ideas, methods, instructions or products referred to in the content. |
© 2025 by the authors. Licensee MDPI, Basel, Switzerland. This article is an open access article distributed under the terms and conditions of the Creative Commons Attribution (CC BY) license (https://creativecommons.org/licenses/by/4.0/).
Share and Cite
Xue, R.; Wang, J.; Chen, J.; Che, S. Multiphysics Modeling and Performance Optimization of CO2/H2O Co-Electrolysis in Solid Oxide Electrolysis Cells: Temperature, Voltage, and Flow Configuration Effects. Energies 2025, 18, 3941. https://doi.org/10.3390/en18153941
Xue R, Wang J, Chen J, Che S. Multiphysics Modeling and Performance Optimization of CO2/H2O Co-Electrolysis in Solid Oxide Electrolysis Cells: Temperature, Voltage, and Flow Configuration Effects. Energies. 2025; 18(15):3941. https://doi.org/10.3390/en18153941
Chicago/Turabian StyleXue, Rui, Jinping Wang, Jiale Chen, and Shuaibo Che. 2025. "Multiphysics Modeling and Performance Optimization of CO2/H2O Co-Electrolysis in Solid Oxide Electrolysis Cells: Temperature, Voltage, and Flow Configuration Effects" Energies 18, no. 15: 3941. https://doi.org/10.3390/en18153941
APA StyleXue, R., Wang, J., Chen, J., & Che, S. (2025). Multiphysics Modeling and Performance Optimization of CO2/H2O Co-Electrolysis in Solid Oxide Electrolysis Cells: Temperature, Voltage, and Flow Configuration Effects. Energies, 18(15), 3941. https://doi.org/10.3390/en18153941