Review

AI-Driven Load and Net-Load Forecasting in Renewable-Rich and Electric-Vehicle-Intensive Power Systems: An Evidence-Mapping Review


Grid Research Group—GIREI (Spanish Acronym), Electrical Engineering Deparment, Salesian Polytechnic University, Quito EC170702, Ecuador
*
Author to whom correspondence should be addressed.
Energies 2026, 19(11), 2571; https://doi.org/10.3390/en19112571
Submission received: 22 April 2026 / Revised: 5 May 2026 / Accepted: 19 May 2026 / Published: 26 May 2026
(This article belongs to the Special Issue Advanced Load Forecasting Technologies for Power Systems)

Abstract

Load forecasting is no longer only a point-prediction problem for aggregate demand. In renewable-rich and electric-vehicle-intensive power systems, forecasts must support net-load balancing, charging-demand management, uncertainty-aware operation, and spatially coupled decision-making. This review presents a quantitative evidence map based on a curated DOI-linked corpus of 116 papers published between 1960 and 2026. Each paper is coded by dominant model family, application theme, forecast horizon, and frontier feature tags. Publication era and dominant model family are strongly associated ( χ 2 ( 21 ) = 93.69 , p = 3.70 × 10 11 , Cramérś V = 0.519 ). Post-2020 studies are sharply enriched in transformer/graph-neural-network/foundation-model content (13/43 versus 0/73; Haldane-corrected odds ratio 65.07; Fisher p = 6.65 × 10 7 ), electric-vehicle or charging themes (7/43 versus 0/73; odds ratio 30.21; p = 6.91 × 10 4 ), and deep-learning content (14/43 versus 7/73; odds ratio 4.36; p = 2.76 × 10 3 ). To address category coarseness, the frontier family is further decomposed into transformer-only, graph-neural-network-only, hybrid spatiotemporal, and foundation-model subfamilies. The central conclusion is that the most important forecasting topic for current electrical power systems is not generic short-term load forecasting, but the integrated forecasting stack required by electrified, renewable-rich, and spatially coupled grids.

1. Introduction

Power-system forecasting is being reshaped by three concurrent structural shifts. First, global electricity demand is rising again under broader electrification, and low-emissions generation is expected to supply most of the incremental demand in the near term. Second, wind and solar are increasing the operational importance of net load, ramping events, curtailment, and forecast uncertainty. Third, electric vehicles and artificial-intelligence-related digital infrastructure are adding new forms of volatile, geographically concentrated demand. The International Energy Agency (IEA) highlights all three drivers in its recent electricity, renewables, electric-vehicle, and energy-and-artificial-intelligence reports [1,2,3,4]. In this environment, forecasting is no longer a narrow short-term demand exercise; it is a multi-task, multi-scale, uncertainty-sensitive decision problem.
The field has deep roots. Early work established filtering, state-estimation, exponential-smoothing, and weather-sensitive regression approaches for operational load forecasting [5,6,7,8]. Comparative studies then formalized evaluation logic for utilities and distribution systems [9,10,11]. Rule-based and fuzzy approaches addressed special days and anomalous operating conditions [12,13,14,15], while early artificial neural network work expanded the nonlinear modeling space and emphasized the importance of weather compensation, clustering, and preprocessing [16,17,18]. Since the mid-2010s, probabilistic forecasting, deep learning, attention-based temporal models, graph neural networks, and multi-task architectures have progressively entered the forecasting literature [19,20,21,22,23,24,25,26].
Although the topic is now highly active, the review literature is still fragmented. Many review papers remain centered on generic short-term load forecasting, while electric-vehicle charging, renewable-aware net-load forecasting, integrated energy systems, explainability, and reproducibility are treated as adjacent rather than central topics [19,27,28,29,30,31,32]. That framing is increasingly too narrow for renewable-rich and electric-vehicle-intensive grids. Operators now need forecasting stacks that connect aggregate system load, residual demand after variable generation, charging-demand dynamics, spatial coupling, and uncertainty-aware operation inside one engineering narrative.
This paper addresses that gap through a quantitative evidence map of AI-driven load and net-load forecasting in renewable-rich and electric-vehicle-intensive power systems. The paper makes five contributions. First, it organizes the field through a decision-oriented taxonomy spanning dominant model family, application theme, forecast horizon, and frontier feature flags. Second, it quantifies how the literature has shifted across eras using contingency analysis, diversity metrics, enrichment tests, and annual trend models. Third, it responds directly to the common complaint that “transformer/graph/foundation” categories are too coarse by separating mutually exclusive dominant-family coding from overlapping subfamily tags. Fourth, it synthesizes what the newest papers actually contribute to renewable-aware, electric-vehicle, and integrated-energy forecasting. Fifth, it proposes a benchmark and reporting checklist aimed at improving reproducibility and long-run citation value.

2. Review Scope, Protocol, and Statistical Methods

2.1. Corpus Design and Research Questions

The evidence map is built from a curated corpus of 116 DOI-linked papers published between 1960 and 2026, complemented by four recent IEA reports used only for high-level system context [1,2,3,4]. The corpus is intentionally structured rather than exhaustive. It combines four layers of literature: foundational statistical and operational studies, transition-era expert/fuzzy and neural-network work, benchmark and tutorial papers, and frontier studies on deep learning, transformer-based models, graph neural networks, electric-vehicle charging, net-load forecasting, and early foundation-model-style forecasting. The review workflow is summarized in Figure 1.
The manuscript is organized around four research questions:
1.
How has the dominant model family changed across publication eras?
2.
Which frontier features are statistically enriched in post-2020 literature?
3.
Which application themes and forecast horizons define the 2020–2026 frontier?
4.
What benchmarking and reporting gaps still limit fair comparison and deployment?

2.2. Coding Strategy and Response to Category Heterogeneity

Each paper was coded along the dimensions shown in Table 1. Dominant model family was coded as a mutually exclusive variable so that era-by-family contingency tests would remain interpretable. Application theme and forecast horizon were coded as thematic variables, while frontier features were coded as overlapping binary tags.
A key revision motivated by reviewer feedback is the separation of broad frontier coding from subfamily interpretation. Specifically, papers containing transformer-based models, graph neural networks, or foundation-model content are tracked in two parallel ways. First, they may be assigned to the broad dominant family “Transformer/GNN/FM” when that is the paper’s main technical contribution. Second, they receive overlapping subfamily tags—transformer only, graph neural network only, transformer + graph hybrid, or foundation model only—for a finer descriptive analysis. Inferential statistics therefore use the broad, mutually exclusive family coding, whereas the frontier synthesis in Section 5 uses the subfamily decomposition.

2.3. Statistical Methods and Notation

The quantitative synthesis combines descriptive statistics, contingency analysis, enrichment testing, and annual trend modeling. Era-by-family association is tested with Pearson’s chi-square statistic and summarized with Cramér’s V. To quantify diversification of the dominant-family distribution across eras, the review also computes Shannon entropy,
H = k = 1 K p k log 2 p k ,
where p k is the share of papers assigned to family k within the relevant era.
To test whether specific frontier features are over-represented in recent literature, the post-2020 subset (2020–2026) is compared against the pre-2020 baseline (1960–2019) using Fisher’s exact test. Because some pre-2020 cells are zero, odds ratios are reported with the Haldane–Anscombe correction. Since multiple feature tests are run in parallel, Benjamini–Hochberg false-discovery-rate-adjusted q values are also reported.
Annual trend models are estimated with a logistic specification,
logit Pr ( z i = 1 ) = β 0 + β 1 ( year i 2000 ) ,
where Pr ( z i = 1 ) is the probability that paper i contains the focal feature, β 0 is the intercept, and β 1 is the annual log-odds slope. The per-year odds multiplier is exp ( β 1 ) . After reviewer feedback, a second-pass consistency audit was performed for all transformer-, graph-, and foundation-tagged papers to ensure consistent separation of transformer-only, GNN-only, hybrid, and foundation-model papers.

2.4. Scope Limits

This review should be read as a curated evidence map rather than a claim of complete bibliographic exhaustiveness. Some papers combine several model families, some titles understate whether uncertainty is modeled explicitly, and some forecast horizons are operationally obvious but not named in the title. These limitations are mitigated by providing the coded corpus as machine-readable data, reporting raw counts alongside inferential statistics, and reserving strong inferential claims for broad feature tags rather than brittle micro-categories.

3. Historical Evolution from Classical Models to Frontier Architectures

3.1. Classical Statistical and Expert-System Foundations

The earliest forecasting studies were dominated by filtering, regression, smoothing, and state-estimation logic designed for utility operations. Kalman-style filtering, state-estimation-based load forecasting, exponential smoothing, and weather-sensitive models established a foundation in which interpretability and operational speed were more important than end-to-end feature learning [5,6,7,8]. Distribution-focused comparison papers then made an equally important contribution by insisting on realistic evaluation and fair method comparison [9,10,11,33,34]. Those concerns remain directly relevant to today’s benchmarking debates.
Expert systems and fuzzy logic extended the field by handling special days, anomalous operating regimes, and operator knowledge that classical regression handled awkwardly [12,13,14,35,36]. Although these methods are now mature, they should not be dismissed as mere historical curiosities. Their emphasis on regime awareness, robustness under abnormal conditions, and decision support foreshadows today’s interest in explainable and physics-informed forecasting.

3.2. Artificial Neural Networks, Recurrent Models, and Probabilistic Forecasting

The next major transition centered on artificial neural networks (ANNs). Early ANN papers showed that nonlinear load patterns could be learned effectively when weather compensation, feature engineering, and training strategy were handled carefully [16,17,37,38]. Subsequent wavelet-assisted and clustering-assisted variants reinforced a lesson that still holds today: preprocessing and data segmentation can matter as much as architecture choice [18,39,40]. Review papers from this period also helped standardize the language of short-term load forecasting [27,41].
Probabilistic forecasting then changed the evaluation target itself. Rather than asking only which model minimized point error, tutorial and competition literature emphasized calibration, quantiles, and scenario value [19,20]. This shift matters because reserve procurement, market participation, and peak-risk management are not symmetric-error problems. Uncertainty quantification became a core property of serious operational forecasting even when it was not explicitly named in every title [42,43].

3.3. Deep Learning, Transformers, Graph Neural Networks, and Foundation Models

After 2015, load forecasting absorbed the broader deep-learning transition in time-series analysis. Building, residential, and system-level studies adopted convolutional neural networks (CNNs), recurrent neural networks (RNNs), long short-term memory (LSTM) networks, hybrid decomposition pipelines, and attention mechanisms [21,22,44,45,46,47,48,49]. These studies improved representation learning, but they also increased the importance of leakage-safe validation and strong baselines.
The frontier has since diversified further. Transformer-based temporal models appeared first in recent system-load and probabilistic forecasting papers [23,50,51]. Graph neural network studies followed, especially in grid-aware or spatiotemporal settings where topology and regional interaction matter [24,52,53]. Hybrid transformer–GNN models now appear in integrated-energy and multi-horizon load forecasting [54,55]. Foundation models are a still earlier frontier, represented in the corpus by one broad review and one physics-informed applied paper [25,26]. This sequence already suggests that “transformer/GNN/foundation” is not a single homogeneous category, a point revisited quantitatively in Section 5.

4. Quantitative Evidence Map of the 116-Paper Corpus

4.1. Publication Growth and Method Diversification

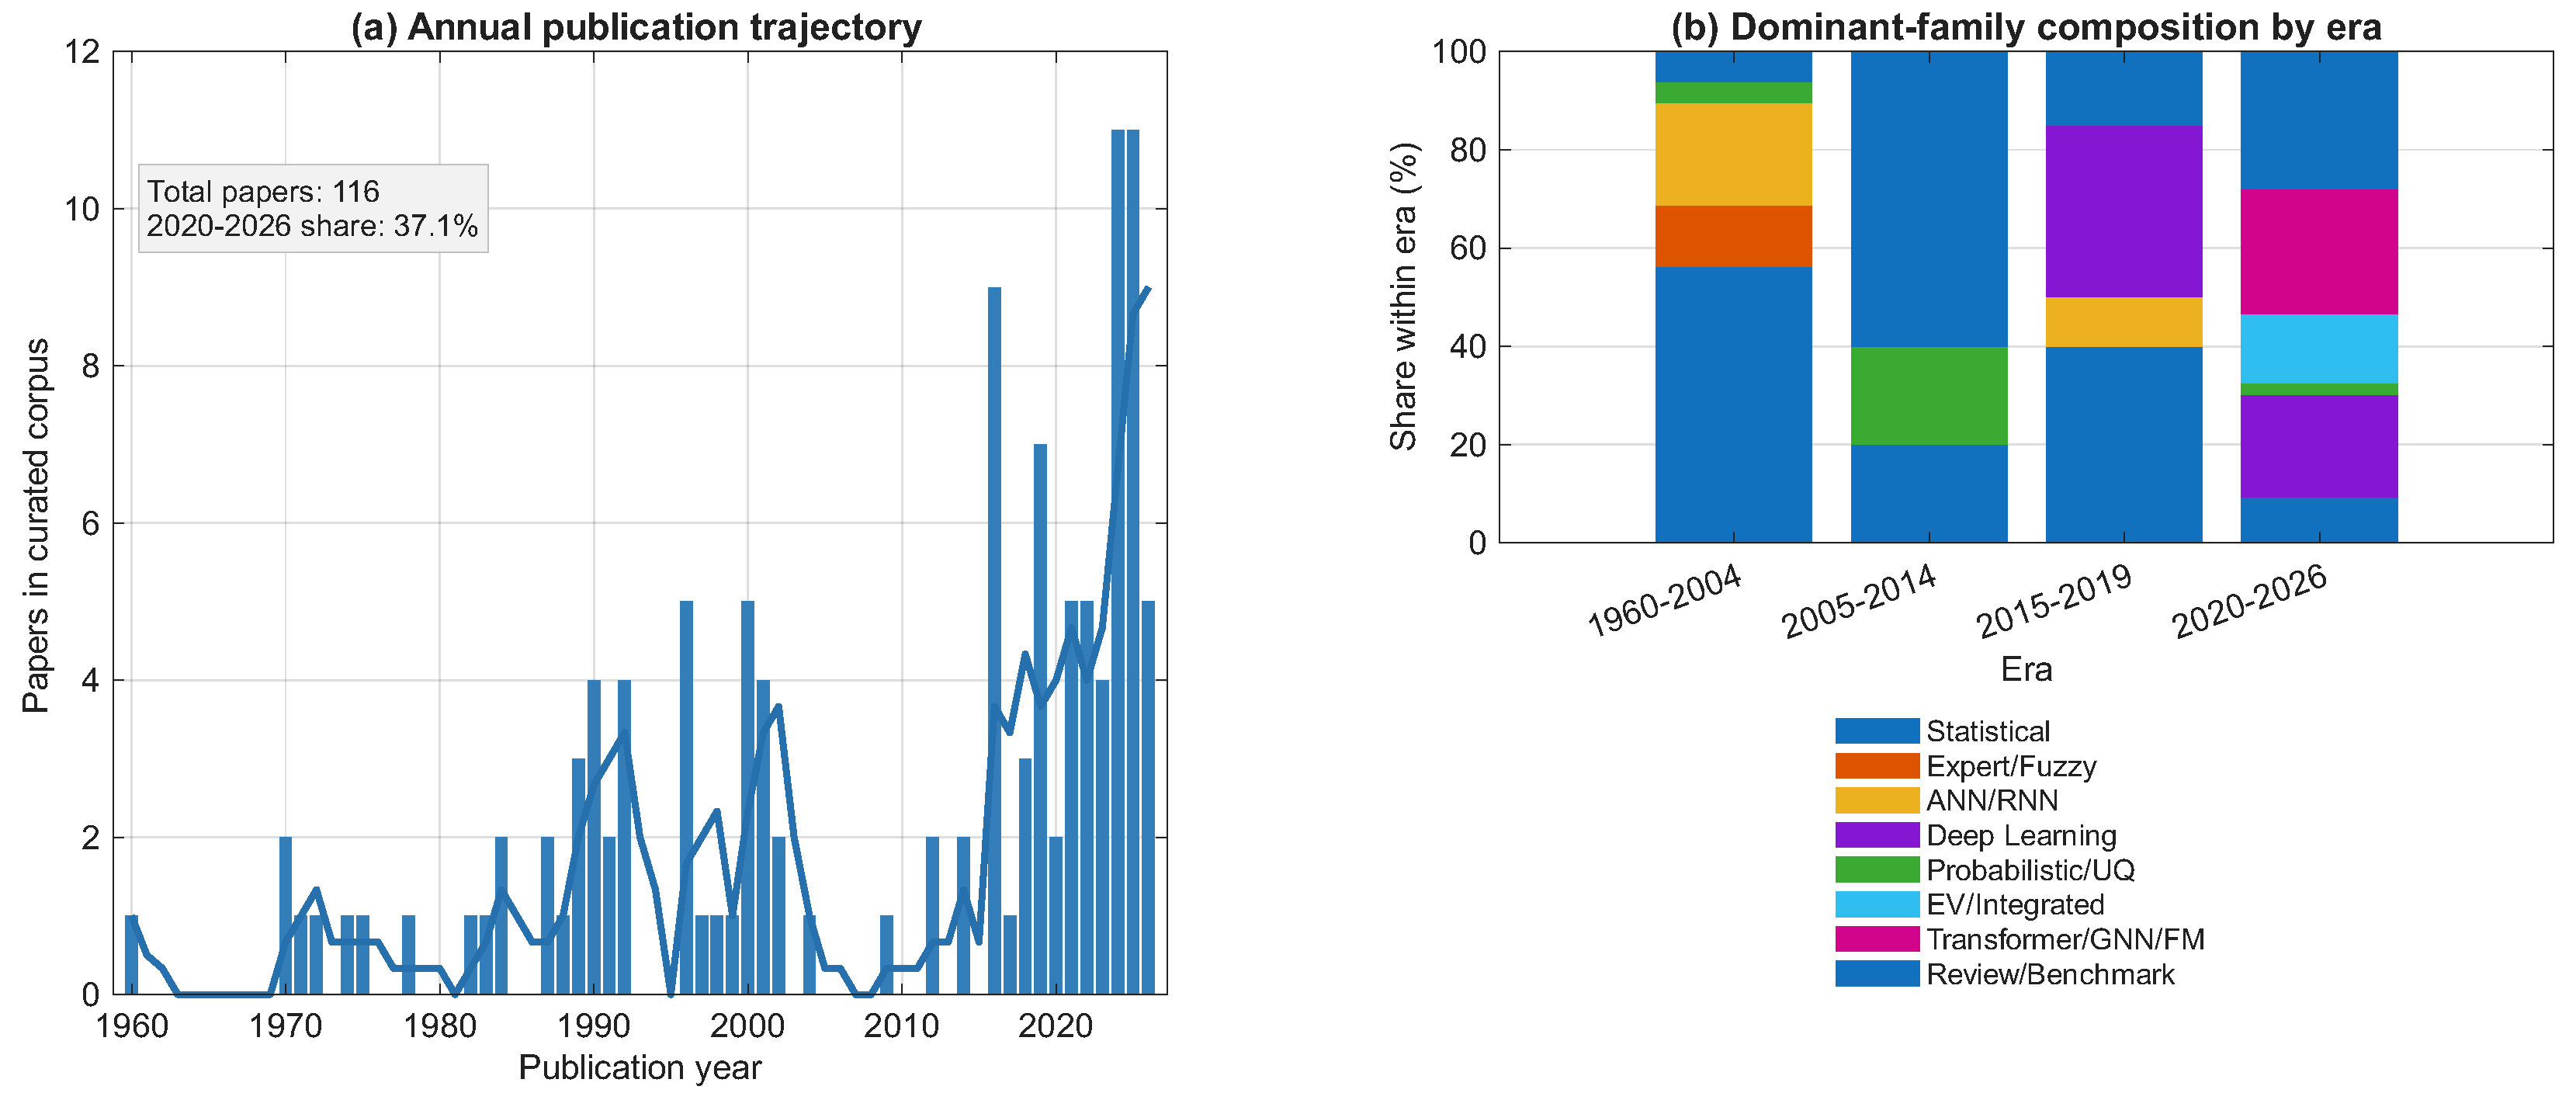
Figure 2 shows the historical trajectory of the curated corpus. Of the 116 DOI-linked papers, 43 were published during 2020–2026, so the most recent era alone accounts for 37.1% of the total sample. This concentration is notable because the corpus spans more than six decades. The topic is therefore not a mature, saturated niche; it is an actively reconfiguring research area.
Method diversity also increased over time. Normalized Shannon entropy of the dominant-family distribution rises from 0.585 in the 1960–2004 era to 0.777 in 2020–2026. The field is not simply publishing more papers; it is also operating in a broader methodological design space that now includes review/benchmark papers, integrated-energy studies, transformer-based models, graph learning, and early foundation-model work.

4.2. Era-by-Family Association

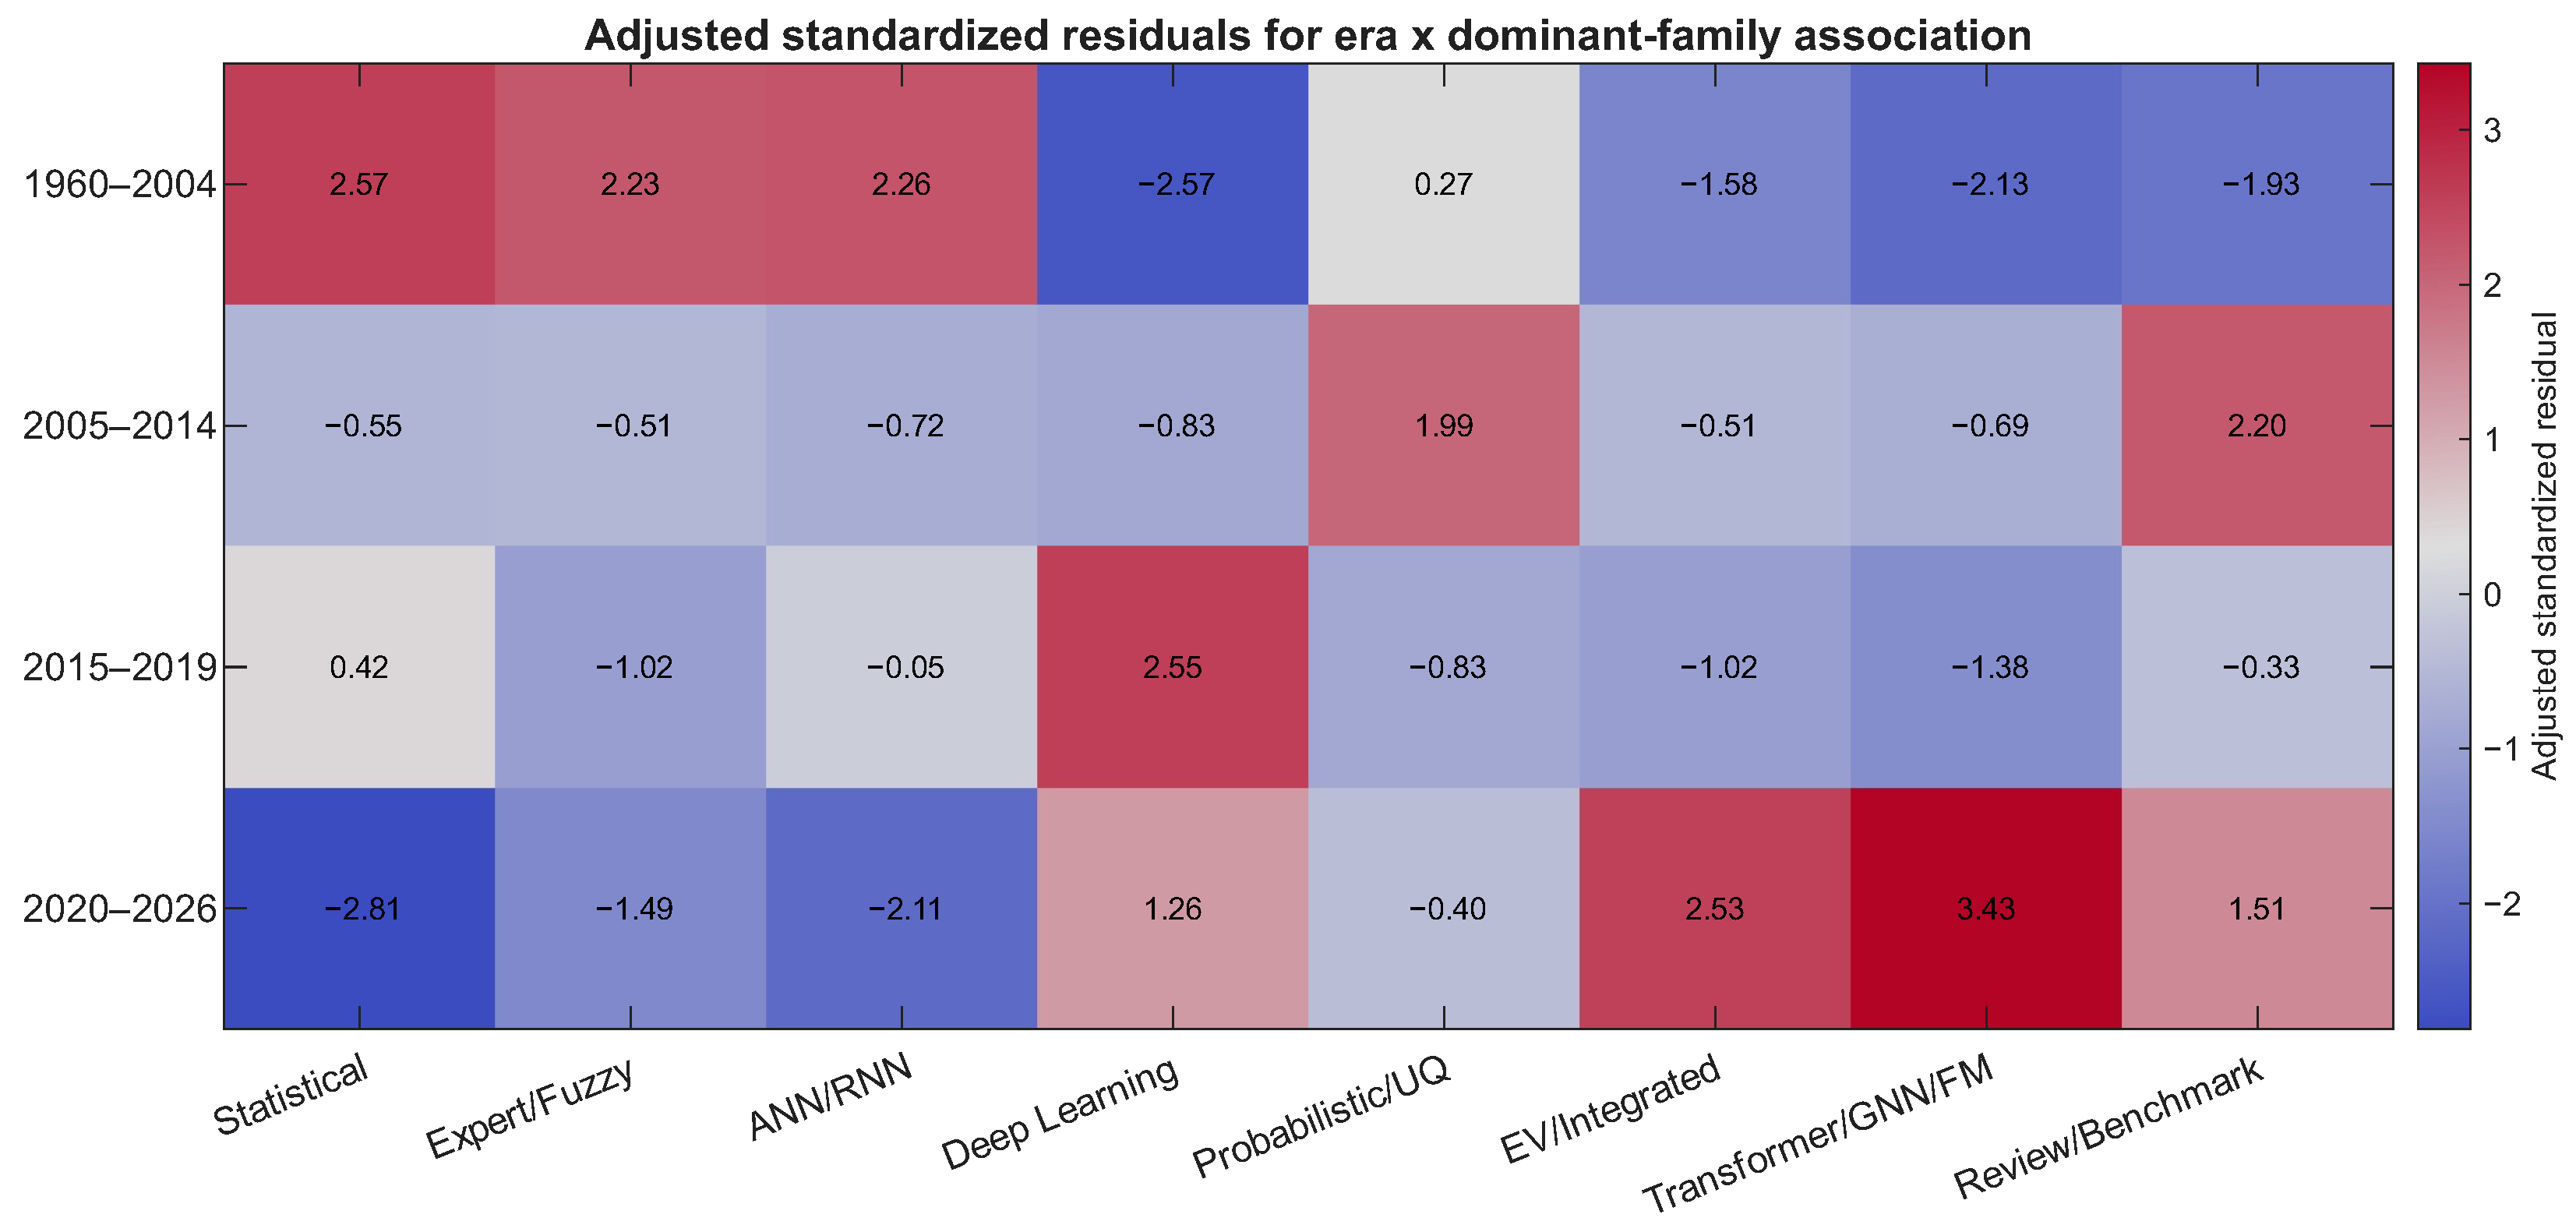
Publication era and dominant model family are strongly associated: χ 2 ( 21 ) = 93.69 , p = 3.70 × 10 11 , with Cramér’s V = 0.519 . This is not a marginal shift. It indicates a large structural change in how the literature is organized.
Figure 3 visualizes the standardized residuals of the era-by-family contingency table. Classical eras are overrepresented in statistical, expert/fuzzy, and ANN/RNN work, while the 2015–2019 transition period is overrepresented in deep learning. The 2020–2026 era is strongly overrepresented in transformer/GNN/FM papers (standardized residual = 3.43 ) and EV/Integrated papers (standardized residual = 2.53 ). These residuals make the temporal shift visible in a way that raw percentages alone cannot.
Table 2 reports maturity statistics sorted by median publication year, as requested in revision. The newest dominant families are Transformer/GNN/FM and EV/Integrated, both fully concentrated in the post-2020 subset. To avoid over-interpreting a young literature, the table now reports median year together with the interquartile range (IQR) and full year span. The 2025 median for the Transformer/GNN/FM family is therefore descriptive rather than a claim of maturity.

4.3. Post-2020 Enrichment and Yearly Trend Models

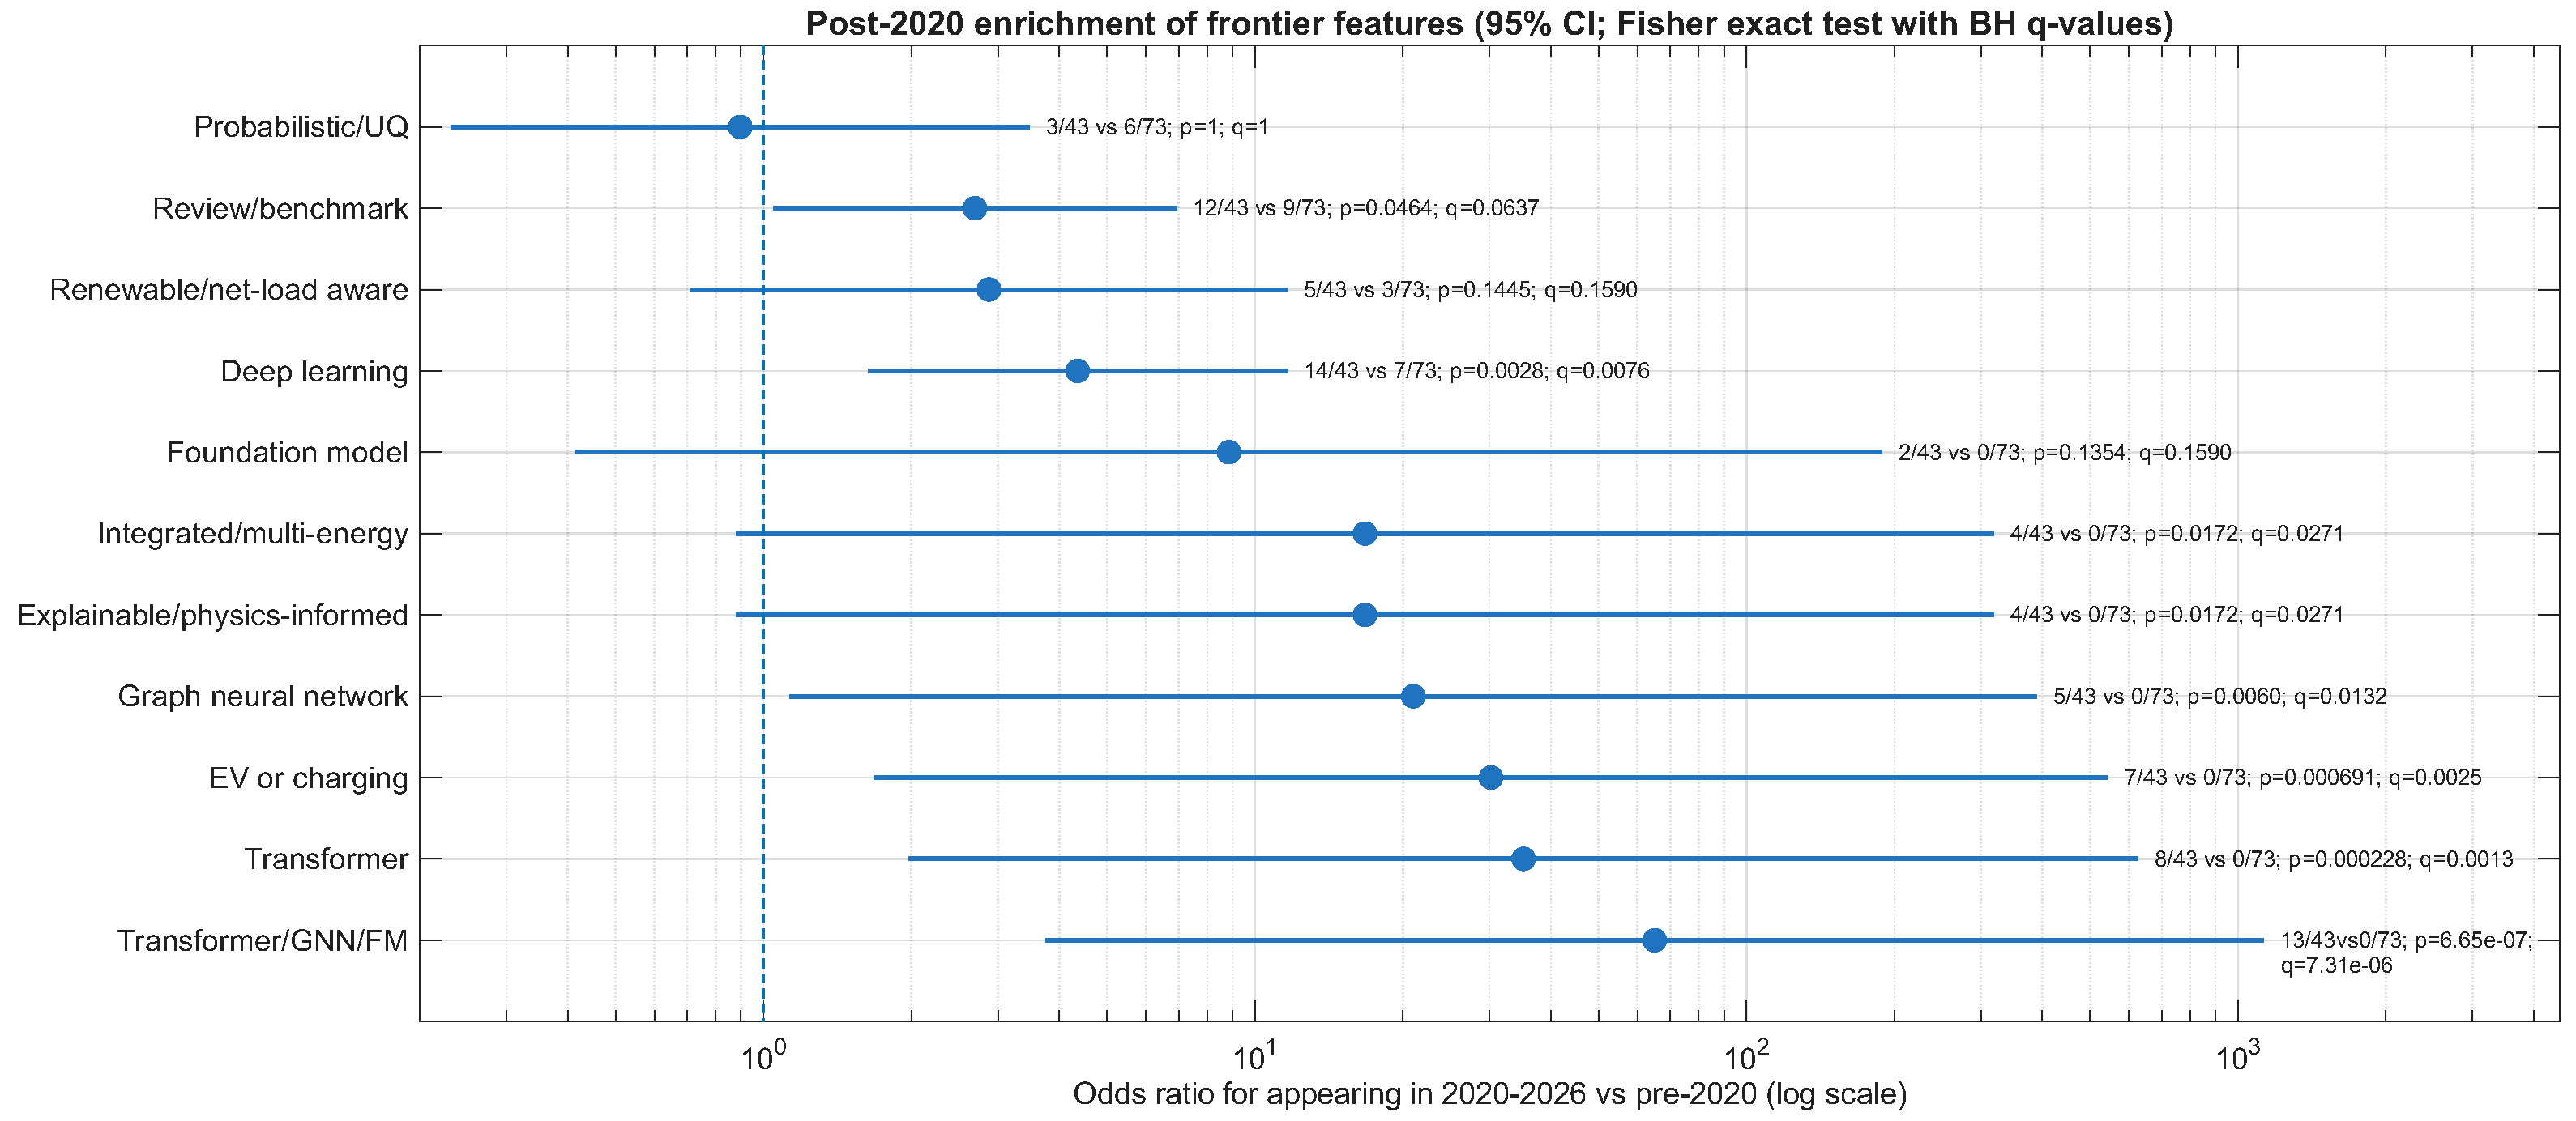
Table 3 and Figure 4 summarize which frontier features are statistically enriched after 2020. The strongest result is the broad transformer/GNN/foundation tag: 13 of 43 post-2020 papers contain at least one such feature, compared with none of the 73 pre-2020 papers. Using the Haldane–Anscombe correction, this corresponds to an odds ratio of 65.07 (95% confidence interval 3.75–1129.48; Fisher p = 6.65 × 10 7 ; q = 7.31 × 10 6 ).
Electric-vehicle or charging content is similarly concentrated in recent work (7/43 versus 0/73; odds ratio 30.21; p = 6.91 × 10 4 ), while deep-learning content also remains strongly enriched (14/43 versus 7/73; odds ratio 4.36; p = 2.76 × 10 3 ). Importantly, the revised table now reports raw counts as well as percentages, confidence intervals, exact p values, and false-discovery-rate-adjusted q values.
Two rows in Table 3 intentionally share identical statistics: Integrated/multi-energy and Explainable/physics-informed. This is not a data error. In the coded corpus, each feature appears in exactly 4 of 43 post-2020 papers and in 0 of 73 pre-2020 papers, so the Haldane-corrected odds ratio and Fisher test are necessarily identical.
The annual trend models reinforce the same interpretation. The odds that a paper contains any transformer/GNN/foundation tag multiply by 1.89 per publication year (95% confidence interval 1.21–2.97; p = 0.0053 ). The annual multiplier is 1.55 for EV or charging content ( p = 0.0497 ), 1.44 for transformer content specifically ( p = 0.0439 ), and 1.12 for deep-learning content ( p = 0.00236 ). The recent frontier is therefore not merely “more neural networks”; it is being pulled toward spatial, multi-task, and electric-vehicle-linked forecasting.

4.4. Application-Theme and Horizon Shifts

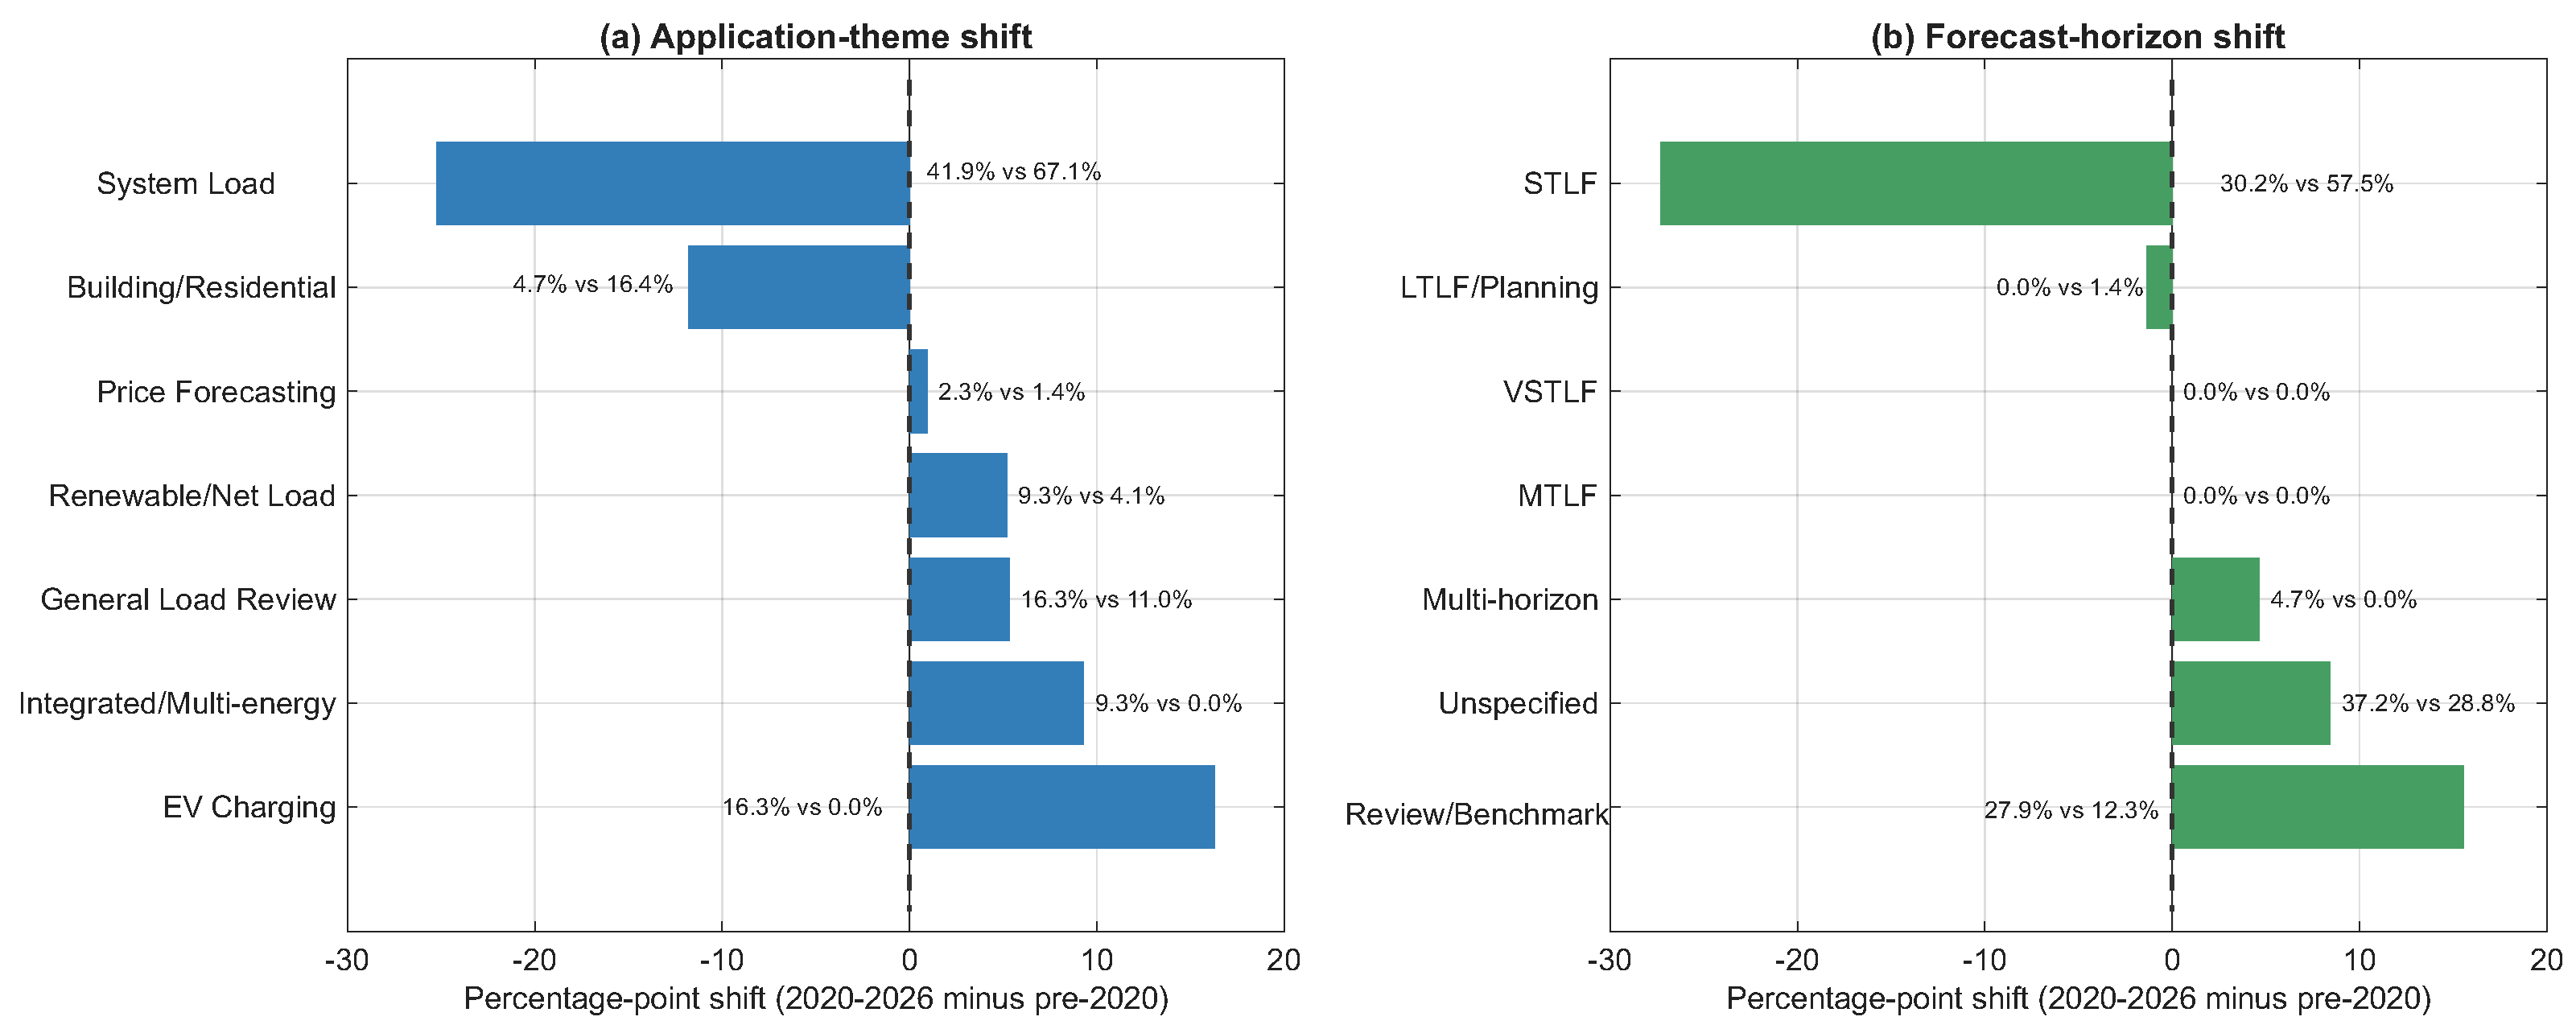
Application theme is also strongly associated with period: χ 2 ( 6 ) = 26.72 , p = 1.63 × 10 4 , Cramér’s V = 0.480 . Figure 5 shows how the frontier broadened after 2020. System load remains the largest theme, but its share drops from 67.1% before 2020 to 41.9% after 2020. At the same time, EV charging rises from 0.0% to 16.3% of the recent subset, integrated/multi-energy forecasting rises from 0.0% to 9.3%, and renewable/net-load work roughly doubles its share from 4.1% to 9.3%.
Forecast-horizon structure shifts as well. Short-term load forecasting remains important, but its share declines from 57.5% of pre-2020 papers to 30.2% in the frontier subset. Review/benchmark papers rise from 12.3% to 27.9%, and multi-horizon studies appear only in the recent era. In other words, the frontier is not just newer in method; it is broader in target and richer in evaluative self-reflection.

4.5. Venues and Journal Fit

The historical base of the corpus is anchored in power-systems and forecasting venues, led by IEEE Transactions on Power Systems with 26 papers. However, Energies is the second-most represented venue overall with 9 papers, and the most represented venue in the post-2020 subset with 8 papers. This makes Energies a particularly strong target journal for the present review: it already publishes recent work on deep-learning-based load forecasting, integrated energy systems, electric-vehicle charging demand, explainability, and grid-edge forecasting [23,29,30,32,51,56,57,58].

5. Frontier Synthesis for Renewable-Rich and Electric-Vehicle-Intensive Systems

5.1. Why Transformer-, Graph-, and Foundation-Model Papers Must Be Separated

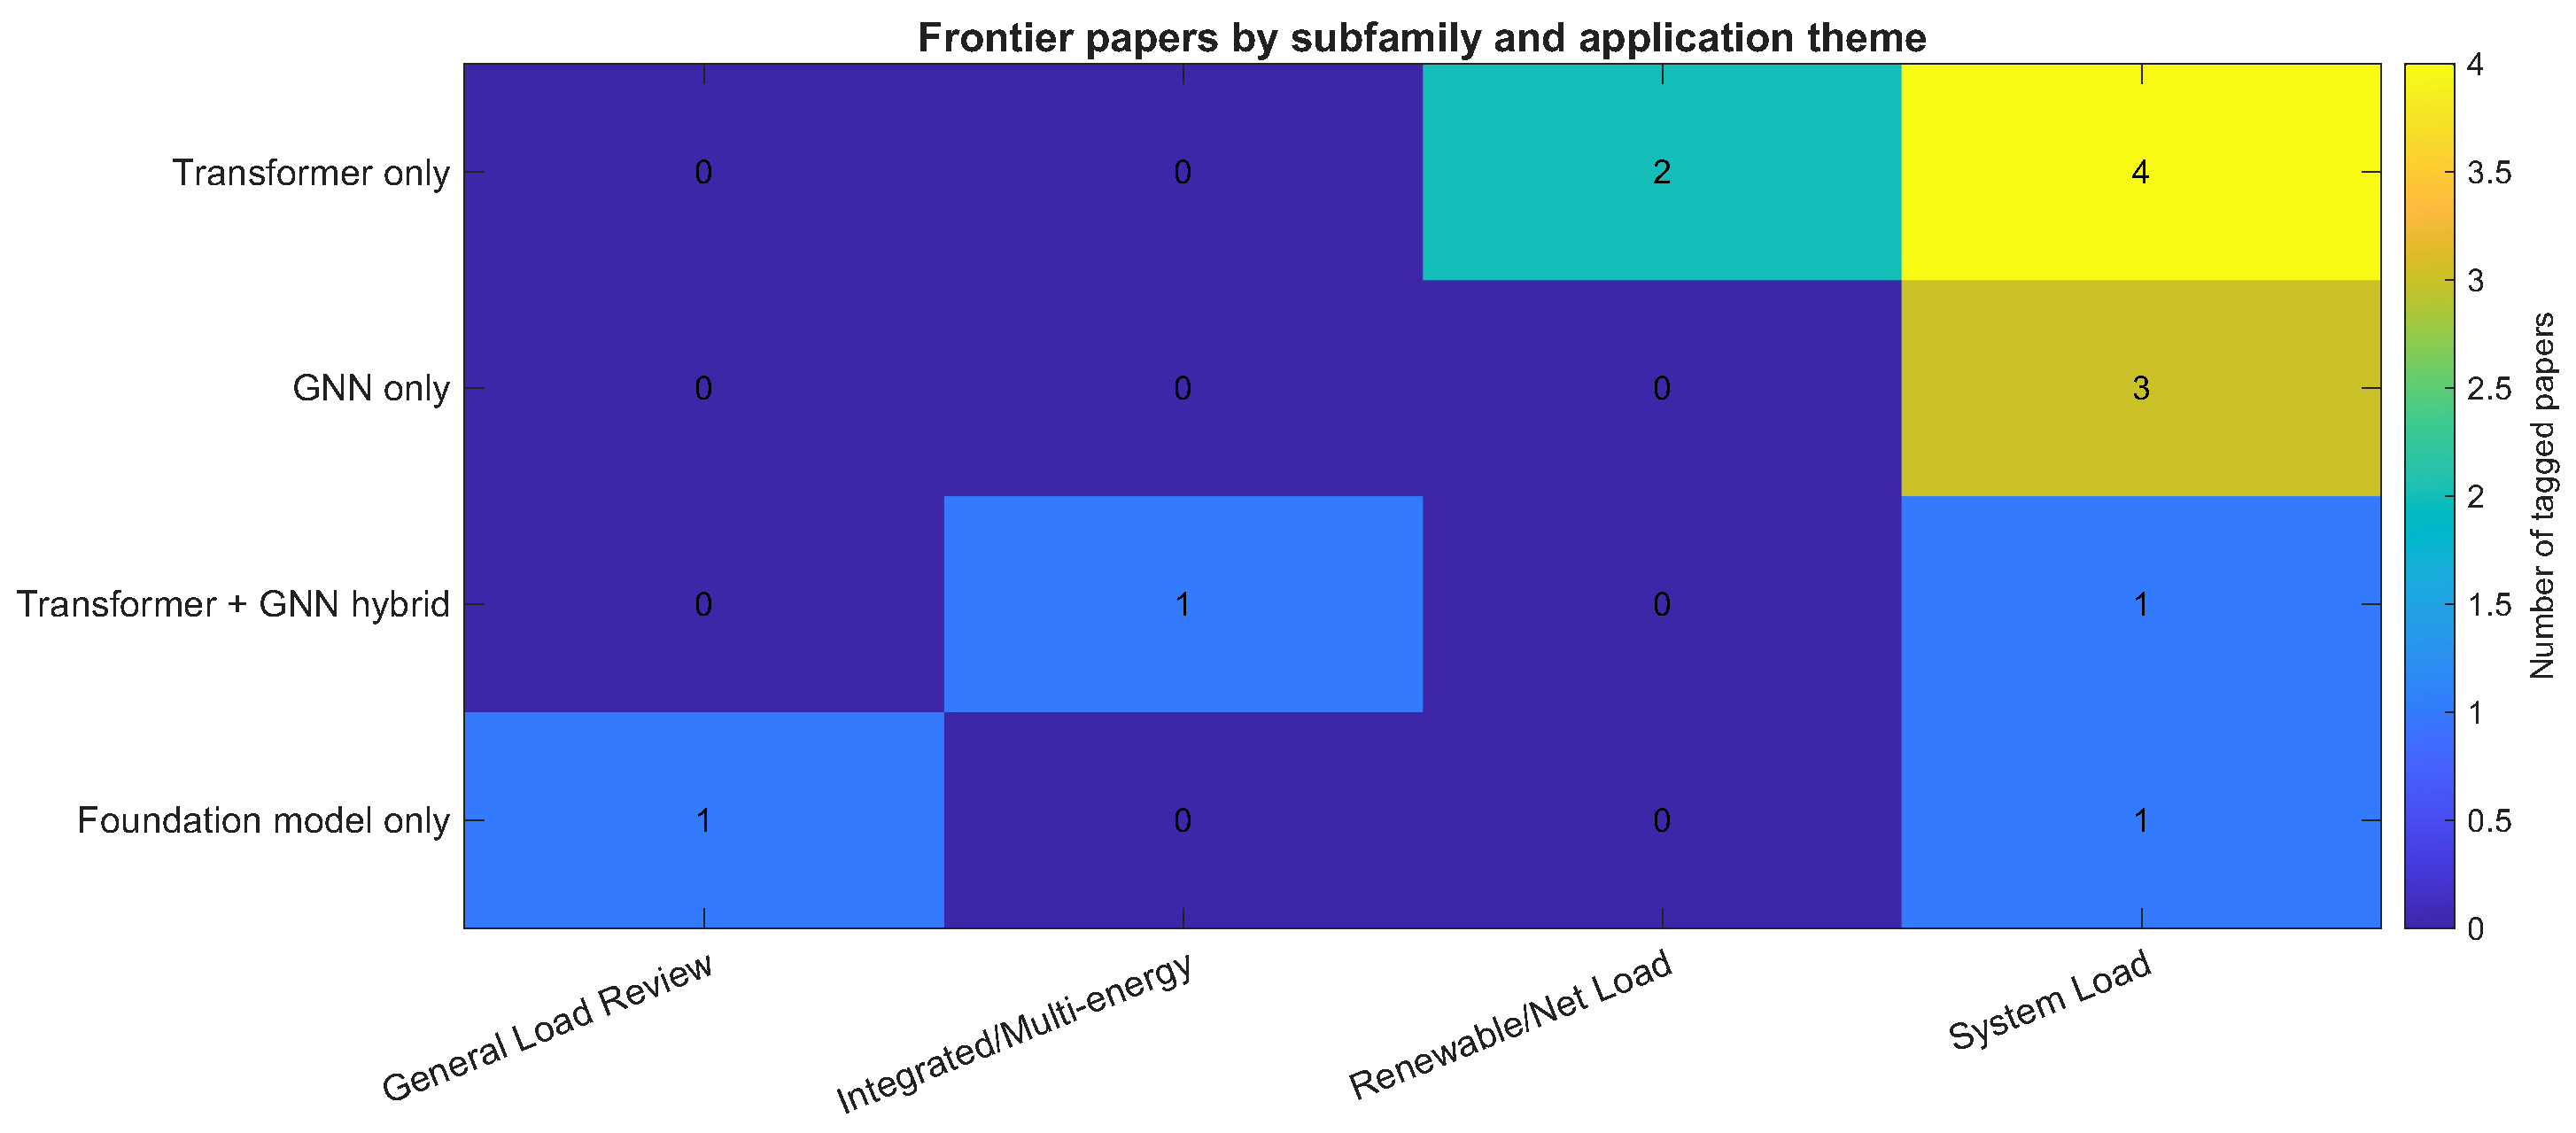
The broad frontier family is useful for inferential testing, but it is too coarse for interpretation. Table 4 and Figure 6 therefore separate the frontier into transformer-only, GNN-only, hybrid transformer–GNN, and foundation-model papers. Across all tagged papers, the corpus contains 6 transformer-only studies, 3 GNN-only studies, 2 hybrid transformer–GNN studies, and 2 foundation-model papers. Within the narrower set of papers whose dominant family is coded as Transformer/GNN/FM, the corresponding counts are 5, 3, 2, and 1. The difference arises because one transformer-focused review and one foundation-model review are coded primarily as Review/Benchmark rather than as dominant frontier-family papers.
This decomposition clarifies the evolution of the frontier. Transformer-only papers appear first and are concentrated in temporal sequence modeling, interpretable multi-horizon forecasting, and probabilistic net-load prediction [23,50,51,59]. GNN-only papers cluster later and almost entirely in system-load problems where topology or regional coupling is explicit [24,52,53]. Hybrid transformer–GNN papers appear when both long temporal context and spatial coupling matter, especially in integrated-energy and multi-scale forecasting [54,55]. Foundation models remain rare and recent, represented by a field-level review and an early physics-informed multi-task application [25,26]. Reviewer criticism of category coarseness was therefore justified, and the revised manuscript now treats these subfamilies separately.
From a selection perspective, the frontier subfamilies solve different problems. Transformers are most natural when long temporal context, exogenous covariates, and multi-horizon outputs dominate. GNNs are most natural when feeders, zones, or districts interact through spatial or topological coupling. Hybrid models are most useful when the problem is explicitly spatiotemporal and multi-task. Foundation-model work is still too early for blanket claims of superiority; its most plausible near-term value lies in transfer learning, cross-task pretraining, and physics-informed adaptation rather than brute model scale alone.

5.2. Net Load, Renewable Awareness, and Electric-Vehicle Charging Demand

The thematic shift quantified in Section 4.4 has a clear operational interpretation. Renewable-rich systems need forecasts of residual or net load rather than gross demand alone, because reserve, flexibility, and curtailment decisions depend on the interaction between demand and variable generation. Recent papers explicitly address high-renewable and net-load settings with hybrid deep-learning or transformer-based formulations [59,60,61,62]. Even when renewable awareness is not yet statistically dominant as a binary feature, it is increasingly embedded in the most operationally relevant forecasting problems.
Electric-vehicle charging creates a second frontier pressure. Charging demand is stochastic, spatially clustered, responsive to price and behavior, and increasingly coupled to smart-city management and renewable integration. The corpus captures this through charging-station forecasting, regional smart-city demand forecasting, explainable charging-demand models, and benchmark-oriented electric-vehicle reviews [31,57,63,64,65]. This theme is especially important for citation impact because it connects traditional power-system forecasting to mobility, urban energy management, and decarbonization research communities at the same time.
Integrated-energy forecasting plays a similar bridging role. Reviews and frontier models in this space show that multi-energy demand forecasting is no longer a niche add-on; it is one of the natural contexts in which hybrid transformer–GNN architectures become technically meaningful [28,29,54,66]. The modern forecasting stack is therefore best understood as unified forecasting for electrified, renewable-rich, and spatially coupled grids, not as a collection of isolated short-term load papers.

5.3. Benchmarking Metrics and Reproducibility

Methodological novelty alone does not make a paper influential. Highly cited review and benchmark papers are usually the ones that make comparison easier for the rest of the field. For this reason, the revised manuscript expands its treatment of metrics and reporting discipline.
For observed values y t and point forecasts y ^ t , the mean absolute error (MAE), root mean square error (RMSE), and mean absolute percentage error (MAPE) are
MAE = 1 n t = 1 n | y t y ^ t | ,
RMSE = 1 n t = 1 n ( y t y ^ t ) 2 ,
MAPE = 100 n t = 1 n y t y ^ t y t .
MAE measures average absolute deviation, RMSE penalizes large forecast misses more strongly, and MAPE expresses error on a percentage scale but can be unstable when the denominator approaches zero. For probabilistic forecasting, point metrics are insufficient. For a quantile forecast q τ at probability level τ , the pinball loss is
L τ ( y t , q τ ) = τ ( y t q τ ) , y t q τ , ( τ 1 ) ( y t q τ ) , y t < q τ .
This metric directly supports calibration-oriented comparisons relevant to reserve management, ramping risk, and peak-demand control.
Four benchmarking failures still recur across the literature. First, some papers allow data leakage through feature construction, weather alignment, or normalization. Second, uncertainty is often discussed but not evaluated rigorously. Third, strong classical and neural baselines are sometimes missing, which makes modern gains look larger than they are. Fourth, reproducibility is weakened by incomplete reporting of splits, preprocessing, hyperparameter search, and compute cost. Table 5 summarizes a reporting checklist designed to improve practical value and citation durability.

5.4. Research Agenda

The evidence map points to five near-term research priorities. First, the field needs unified multi-task forecasting that treats load, net load, renewable output, charging demand, and price as coupled targets rather than isolated tasks. Second, transferable pretraining and foundation-model ideas should be evaluated for cross-region adaptation and cold-start performance, not only for raw accuracy on single datasets [25,26]. Third, graph-aware models should be paired with explicit topology assumptions and physics-informed constraints so that spatial learning improves robustness rather than adding opaque complexity [24,52,55]. Fourth, electric-vehicle charging needs stronger public benchmarks and multi-city datasets because it is now one of the fastest-growing frontier themes [31,65]. Fifth, future reviews can maximize impact by becoming reproducible meta-benchmarks rather than simple catalogues of architectures.

6. Conclusions

This review examined the evolution of load and net-load forecasting from classical statistical models to deep learning, transformers, graph neural networks, and early foundation-model studies. Using a curated DOI-linked corpus of 116 papers, it showed that 37.1% of the sample was published during 2020–2026, that era and dominant model family are strongly associated ( χ 2 ( 21 ) = 93.69 , p = 3.70 × 10 11 , Cramér’s V = 0.519 ), and that transformer/GNN/foundation tags, electric-vehicle content, and deep-learning content are sharply enriched in recent work.
The revised analysis also clarifies an important conceptual point raised in peer review: the frontier family is not homogeneous. Transformer-only, GNN-only, hybrid spatiotemporal, and foundation-model papers occupy different parts of the recent literature and serve different operational roles. Combined with the application-theme shift toward electric-vehicle charging, integrated energy systems, and renewable-aware forecasting, this supports a broader conclusion. The most important forecasting topic in current electrical power systems is not generic short-term load forecasting, but the integrated forecasting stack required by electrified, renewable-rich, and spatially coupled grids.
For Energies, this is a strong review domain because it connects power-system operation, artificial-intelligence methodology, renewable integration, electric mobility, and benchmarking discipline within one engineering framework. The combination of evidence mapping, transparent statistics, frontier decomposition, and reproducibility guidance is also designed to improve citation durability after publication.

Author Contributions

M.J. and D.C.: Conceptualization, methodology, formal analysis, visualization, writing—original draft preparation, and writing—review and editing. All authors have read and agreed to the published version of the manuscript.

Funding

This work was supported by Universidad Politécnica Salesiana and GIREI—Smart Grid Research Group.

Data Availability Statement

The original contributions presented in this study are included in the article. Further inquiries can be directed to the corresponding author.

Conflicts of Interest

The author declares no conflict of interest.

Abbreviations

ANNArtificial Neural Network
BHBenjamini–Hochberg
CNNConvolutional Neural Network
EVElectric Vehicle
FMFoundation Model
GNNGraph Neural Network
IEAInternational Energy Agency
IQRInterquartile Range
LSTMLong Short-Term Memory
MAEMean Absolute Error
MAPEMean Absolute Percentage Error
MTLFMedium-Term Load Forecasting
RNNRecurrent Neural Network
RMSERoot Mean Square Error
STLFShort-Term Load Forecasting
UQUncertainty Quantification
VSTLFVery-Short-Term Load Forecasting

References

  1. International Energy Agency. Electricity 2025. 2025. Available online: https://www.iea.org/reports/electricity-2025 (accessed on 17 April 2026).
  2. International Energy Agency. Renewables 2025. 2025. Available online: https://www.iea.org/reports/renewables-2025 (accessed on 17 April 2026).
  3. International Energy Agency. Global EV Outlook 2025. 2025. Available online: https://www.iea.org/reports/global-ev-outlook-2025 (accessed on 17 April 2026).
  4. International Energy Agency. Key Questions on Energy and AI. 2026. Available online: https://www.iea.org/reports/key-questions-on-energy-and-ai (accessed on 17 April 2026).
  5. Kalman, R.E. A new approach to linear filtering and prediction problems. J. Basic Eng. 1960, 82, 35–45. [Google Scholar] [CrossRef] [Scilit]
  6. Toyoda, J.; Chen, M.S.; Inoue, Y. An application of the state estimation to the short-term load forecasting, Part I and Part II. IEEE Trans. Power Appar. Syst. 1970, PAS-89, 1678–1688. [Google Scholar] [CrossRef] [Scilit]
  7. Christiaanse, W.R. Short-term load forecasting using general exponential smoothing. IEEE Trans. Power Appar. Syst. 1971, PAS-90, 900–911. [Google Scholar] [CrossRef] [Scilit]
  8. Gupta, P.C.; Yamada, K. Adaptive short-term forecasting of hourly loads using weather information. IEEE Trans. Power Appar. Syst. 1972, PAS-91, 2085–2094. [Google Scholar] [CrossRef] [Scilit]
  9. Willis, H.L.; Northcote-Green, J.; Buri, D. Comparison tests of fourteen distribution load forecasting methods. IEEE Trans. Power Appar. Syst. 1984, PAS-103, 1190–1197. [Google Scholar] [CrossRef] [Scilit]
  10. Moghram, I.; Rahman, S. Analysis and evaluation of five short-term load forecasting techniques. IEEE Trans. Power Syst. 1989, 4, 1484–1491. [Google Scholar] [CrossRef] [Scilit]
  11. Huang, S.J.; Shih, K.R. A standard procedure for comparing short-term load forecasting techniques. Electr. Power Syst. Res. 1992, 26, 17–24. [Google Scholar] [CrossRef] [Scilit]
  12. Rahman, S.; Hazim, O. An expert system based algorithm for short-term load forecast. IEEE Trans. Power Syst. 1988, 3, 1181–1190. [Google Scholar] [CrossRef] [Scilit]
  13. Rahman, S.; Hazim, O. A rule-based short-term load forecasting algorithm. IEEE Trans. Power Syst. 1990, 5, 750–757. [Google Scholar] [CrossRef] [Scilit]
  14. Mori, H.; Kobayashi, N. Optimal fuzzy inference for short-term load forecasting. IEEE Trans. Power Syst. 1996, 11, 390–396. [Google Scholar] [CrossRef] [Scilit]
  15. Wu, C.L.; Ho, J.M.; Lee, D.T. Automatic fuzzy model identification for short-term load forecast. IEE Proc.-Gener. Transm. Distrib. 1999, 146, 477–482. [Google Scholar] [CrossRef] [Scilit]
  16. Park, D.C.; El-Sharkawi, M.A.; Marks, R.J. Electric load forecasting using an artificial neural network. IEEE Trans. Power Syst. 1991, 6, 442–449. [Google Scholar] [CrossRef] [Scilit]
  17. Park, D.C.; El-Sharkawi, M.A.; Marks, R.J. Electric load forecasting using an artificial neural network with weather compensation. IEEE Trans. Power Syst. 1996, 11, 990–995. [Google Scholar] [CrossRef] [Scilit]
  18. Huang, C.M.; Huang, C.J.; Wang, M.L. Evolving wavelet-based networks for short-term load forecasting. IEE Proc.-Gener. Transm. Distrib. 2001, 148, 222–228. [Google Scholar] [CrossRef] [Scilit]
  19. Hong, T.; Fan, S. Probabilistic electric load forecasting: A tutorial review. Int. J. Forecast. 2016, 32, 914–938. [Google Scholar] [CrossRef] [Scilit]
  20. Hong, T.; Pinson, P.; Fan, S.; Zareipour, H.; Troccoli, A.; Hyndman, R.J. Probabilistic energy forecasting: Global Energy Forecasting Competition 2014 and beyond. Int. J. Forecast. 2016, 32, 896–913. [Google Scholar] [CrossRef] [Scilit]
  21. Farsi, B.; Amayri, M.; Bouguila, N.; Eicker, U. On short-term load forecasting using machine learning techniques and a novel parallel deep LSTM-CNN approach. IEEE Access 2021, 9, 31191–31212. [Google Scholar] [CrossRef] [Scilit]
  22. Rafi, S.H.; Nahid-Al-Masood; Deeba, S.R.; Islam, M.M. A short-term load forecasting method using integrated CNN and LSTM network. IEEE Access 2021, 9, 32436–32448. [Google Scholar] [CrossRef] [Scilit]
  23. Li, J.; Sun, Y.; Zhang, W. A Transformer based approach to electricity load forecasting. Electr. J. 2024, 37, 107370. [Google Scholar] [CrossRef] [Scilit]
  24. Wu, K.; Zhao, Y.; Chen, Z. MRGNN: Multi-resolution graph neural network for electricity load forecasting. Energy Rep. 2025, 13, 1188–1201. [Google Scholar] [CrossRef] [Scilit]
  25. Ferdaus, M.M.; Dam, T.; Sarkar, M.R.; Uddin, M.; Anavatti, S.G. Foundation Models for Clean Energy Forecasting: A Comprehensive Review. Renew. Sustain. Energy Rev. 2026, 226, 116452. [Google Scholar] [CrossRef] [Scilit]
  26. Li, X.; Zhang, Q.; Chen, M. GridFM: A physics-informed foundation model for multi-task energy forecasting using real-time NYISO data. Energies 2026, 19, 357. [Google Scholar] [CrossRef] [Scilit]
  27. Alfares, H.K.; Nazeeruddin, M. Electric load forecasting: Literature survey and classification of methods. Int. J. Syst. Sci. 2002, 33, 23–34. [Google Scholar] [CrossRef] [Scilit]
  28. Liu, X.; Wang, J.; Qin, Y. Review and prospect of data-driven techniques for load forecasting in integrated energy systems. Appl. Energy 2022, 321, 119269. [Google Scholar] [CrossRef] [Scilit]
  29. Liu, X.; Zhang, H.; Wang, Z. Multi-energy coupling load forecasting in integrated energy systems: A review. Sustainability 2024, 16, 10082. [Google Scholar] [CrossRef] [Scilit]
  30. Liu, J.; Wu, H.; Peng, L. A comprehensive review on deep learning approaches for short-term load forecasting. Renew. Sustain. Energy Rev. 2024, 189, 114031. [Google Scholar] [CrossRef] [Scilit]
  31. Gómez, P.; Kumar, A.; Rahman, M. Machine learning-based electric vehicle charging demand forecasting: A systematized literature review. Energies 2025, 18, 4779. [Google Scholar] [CrossRef] [Scilit]
  32. Ramos, D.; Faria, P.; Vale, Z. Linking short-term electricity demand forecasting and explainable AI: A review for building energy applications. Appl. Energy 2026, 412, 127658. [Google Scholar] [CrossRef] [Scilit]
  33. Willis, H.L.; Northcote-Green, J.; Wang, J. Forecasting distribution system loads using curve shape clustering. IEEE Trans. Power Appar. Syst. 1983, PAS-102, 3174–3181. [Google Scholar] [CrossRef] [Scilit]
  34. Willis, H.L.; Tram, H.N. Load transfer coupling regression curve fitting for distribution load forecasting. IEEE Trans. Power Appar. Syst. 1984, PAS-103, 3652–3659. [Google Scholar] [CrossRef] [Scilit]
  35. Kim, C.I.; Hwang, J.H.; Kim, H. Short-term forecasting for special days in anomalous load conditions using neural networks and fuzzy inference method. IEEE Trans. Power Syst. 2000, 15, 559–565. [Google Scholar] [CrossRef]
  36. Liang, R.H.; Cheng, C.C. Combined regression-fuzzy approach for short-term load forecasting. IEE Proc.-Gener. Transm. Distrib. 2000, 147, 261–266. [Google Scholar] [CrossRef] [Scilit]
  37. Khotanzad, A.; Abaye, A. ANN-based short-term load forecasting system. IEEE Trans. Power Syst. 1992, 7, 491–499. [Google Scholar] [CrossRef] [Scilit]
  38. Park, D.C.; El-Sharkawi, M.A.; Marks, R.J. Electric load forecasting using an artificial neural network for anomalous load periods. IEEE Trans. Power Syst. 1996, 11, 1231–1236. [Google Scholar] [CrossRef] [Scilit]
  39. Mori, H.; Kobayashi, N. Deterministic annealing clustering for ANN-based short-term load forecasting. IEEE Trans. Power Syst. 2001, 16, 545–551. [Google Scholar] [CrossRef] [Scilit]
  40. Kim, C.I.; Ko, H.S. Kohonen neural network and wavelet transform based approach to short-term load forecasting. Electr. Power Syst. Res. 2002, 63, 169–176. [Google Scholar] [CrossRef] [Scilit]
  41. Hippert, H.S.; Pedreira, C.E.; Souza, R.C. Neural networks for short-term load forecasting: A review and evaluation. IEEE Trans. Power Syst. 2001, 16, 44–55. [Google Scholar] [CrossRef] [Scilit]
  42. Pinson, P. Very-short-term probabilistic forecasting of wind power with generalized logit-normal distributions. J. R. Stat. Soc. Ser. C 2012, 61, 555–576. [Google Scholar] [CrossRef] [Scilit]
  43. Zhou, J.; Hong, T.; Wang, K. Quantile regression neural networks for probabilistic load forecasting. Int. J. Forecast. 2020, 36, 1277–1290. [Google Scholar] [CrossRef] [Scilit]
  44. Marino, D.L.; Amarasinghe, K.; Manic, M. Building energy load forecasting using deep neural networks. In IECON 2016–42nd Annual Conference of the IEEE Industrial Electronics Society; IEEE: Piscataway, NJ, USA, 2016; pp. 7046–7051. [Google Scholar] [CrossRef] [Scilit]
  45. Mocanu, E.; Nguyen, P.H.; Gibescu, M.; Kling, W. Deep learning for estimating building energy consumption. Sustain. Energy Grids Netw. 2016, 6, 91–99. [Google Scholar] [CrossRef] [Scilit]
  46. Kim, T.Y.; Cho, S.B. Predicting residential energy consumption using CNN-LSTM neural networks. Energy 2019, 182, 72–81. [Google Scholar] [CrossRef] [Scilit]
  47. Kong, W.; Dong, Z.Y.; Hill, D.J.; Luo, F. Short-term residential load forecasting based on LSTM recurrent neural network. IEEE Trans. Smart Grid 2019, 10, 841–851. [Google Scholar] [CrossRef] [Scilit]
  48. Jia, T.; Li, L.; Wang, S. A short-term power load forecasting method based on CEEMDAN, CNN and BiLSTM. Sustainability 2022, 14, 16460. [Google Scholar] [CrossRef] [Scilit]
  49. Wen, L.; Zhou, K.; Yang, S. Load demand forecasting of residential buildings using a deep learning model. IEEE Access 2020, 179, 106073. [Google Scholar] [CrossRef] [Scilit]
  50. Lim, B.; Arik, S.O.; Loeff, N.; Pfister, T. Temporal Fusion Transformers for interpretable multi-horizon time series forecasting. Int. J. Forecast. 2021, 37, 1748–1764. [Google Scholar] [CrossRef] [Scilit]
  51. Khan, S.; Abbas, A.; Haider, A. CNNs-Transformer based day-ahead probabilistic load forecasting for weekends with limited data availability. Energy 2024, 301, 130666. [Google Scholar] [CrossRef] [Scilit]
  52. Orji, U.; Güven, Ç.; Stowell, D. Grid-Aware Spatio-Temporal Graph Neural Networks for Multi-Horizon Load Forecasting. SIGENERGY Energy Inform. Rev. 2025, 5, 52–65. [Google Scholar] [CrossRef] [Scilit]
  53. Wang, Z.; Liu, Y.; Wu, J. Multi-scale graph learning with seasonal and trend awareness for electricity load forecasting. Processes 2025, 13, 3865. [Google Scholar] [CrossRef] [Scilit]
  54. Ghosh, A.; Xu, X.; Li, Y. Short-term multi-energy load forecasting method based on Transformer spatio-temporal graph neural network. Energies 2025, 18, 4466. [Google Scholar] [CrossRef] [Scilit]
  55. Yang, H.; Zhou, K.; Qiu, J. Short-term power load forecasting based on spatial-temporal dynamic graph and multi-scale Transformer. J. Comput. Des. Eng. 2025, 12, 159–176. [Google Scholar] [CrossRef] [Scilit]
  56. Phyo, P.P.; Jeenanunta, C. Short-term energy forecasting using machine-learning-based models and time-series decomposition. Symmetry 2022, 14, 160. [Google Scholar] [CrossRef] [Scilit]
  57. Zhang, J.; Wang, X.; Chen, K. Short-term load forecasting model of electric vehicle charging station based on multi-channel CNN and TCN. Energies 2022, 15, 2633. [Google Scholar] [CrossRef] [Scilit]
  58. Mansour, A.; Ali, M.; Dey, S. Artificial intelligence and machine learning-based decision support system for forecasting electric vehicles’ power requirement. Technol. Forecast. Soc. Change 2024, 205, 123396. [Google Scholar] [CrossRef] [Scilit]
  59. Zhang, L.; Wang, Y.; Li, P. Probabilistic net load forecasting based on transformer network and Gaussian process-enabled residual modeling learning method. Renew. Energy 2024, 236, 120253. [Google Scholar] [CrossRef] [Scilit]
  60. Tang, B.; Zhou, T.; Qiu, J. Enhancing short-term load forecasting accuracy in high-renewable grids with hybrid SCN-LSTM. Appl. Sci. 2024, 14, 11606. [Google Scholar] [CrossRef] [Scilit]
  61. Tang, Y.; Zhou, L.; Li, K. Enhancing power load forecasting accuracy under high renewable energy penetration with a MSN-KAN framework. Results Eng. 2026, 24, 109275. [Google Scholar] [CrossRef] [Scilit]
  62. Celik, U.; Wang, J.; Hong, T. Transformer-based renewable energy forecasting: A comprehensive review. Renew. Sustain. Energy Rev. 2026, 215, 116356. [Google Scholar] [CrossRef] [Scilit]
  63. Wang, H.; Cheng, Z.; Li, S. Forecasting electric vehicle charging demand in smart cities using hybrid deep learning of regional spatial behaviours. Energies 2025, 18, 3425. [Google Scholar] [CrossRef] [Scilit]
  64. Singh, R.; Zhao, Y.; Li, Q. Predicting EV charging demand in renewable-energy-powered grids using explainable machine learning. Sustainability 2025, 17, 4158. [Google Scholar] [CrossRef] [Scilit]
  65. Kumar, N.; Hu, J.; Bansal, P. Benchmarking medium-term electric vehicle charging demand forecasting. J. Supercomput. 2025, 81, 12801–12829. [Google Scholar] [CrossRef] [Scilit]
  66. Khan, M.; Li, X.; Yao, J. Comparison of prediction and forecasting artificial intelligence approaches for district heating load. Energy 2023, 271, 126661. [Google Scholar] [CrossRef] [Scilit]
Figure 1. Workflow used in the revised evidence-mapping review. The inferential layer is applied to the coded corpus; the narrative synthesis interprets those statistics for renewable-rich and electric-vehicle-intensive power-system operation.
Energies 19 02571 g001
Figure 2. Publication growth and diversification of the coded corpus. Panel (a) shows annual publication counts and a three-year moving average; panel (b) shows dominant-family composition within each era.
Energies 19 02571 g002
Figure 3. Standardized residuals for the era-by-family contingency table. Positive residuals indicate families that appear more often than expected under independence; negative residuals indicate under-representation.
Energies 19 02571 g003
Figure 4. Post-2020 enrichment of frontier features. The plotted points show Haldane-corrected odds ratios and 95% confidence intervals. Right-hand annotations report raw counts (post-2020 versus pre-2020) and Benjamini–Hochberg-adjusted q values.
Energies 19 02571 g004
Figure 5. Share shifts between the pre-2020 baseline and the 2020–2026 frontier. Panel (a) compares application themes; panel (b) compares forecast-horizon categories. “pp” denotes percentage-point change.
Energies 19 02571 g005
Figure 6. Frontier papers decomposed by transformer/GNN/foundation-model subfamily and application theme. The counts refer to all tagged papers, not only those whose dominant family is coded as Transformer/GNN/FM.
Energies 19 02571 g006
Table 1. Coding dimensions used in the evidence map.
DimensionLevels Used in This ReviewPurpose
Dominant model familyStatistical; Expert/Fuzzy; Artificial Neural Network/Recurrent Neural Network (ANN/RNN); Deep Learning; Probabilistic/Uncertainty Quantification (UQ); EV/Integrated; Transformer/GNN/FM; Review/BenchmarkTracks the historical methodological transition and supports era-by-family association testing.
Application themeSystem Load; General Load Review; Building/Residential; Renewable/Net Load; Integrated/Multi-energy; EV Charging; Price ForecastingIdentifies what the recent frontier is actually about beyond generic “load forecasting”.
Forecast horizonVery-short-term load forecasting (VSTLF); Short-term load forecasting (STLF); Medium-term load forecasting (MTLF); Long-term load forecasting/planning (LTLF/Planning); Multi-horizon; Review/Benchmark; Implicit/UnspecifiedDistinguishes operational forecasting from planning and tutorial literature.
Frontier feature flagsTransformer; Graph Neural Network (GNN); Foundation Model; EV or charging; Renewable/net-load awareness; Explainable or physics-informed learning; Integrated/multi-energy; Probabilistic/UQ; Review/benchmarkEnables enrichment tests and subfamily decomposition.
Venue and timeJournal title; publication year; era binsSupports journal-fit interpretation, temporal trend analysis, and diversity metrics.
Table 2. Family-level maturity statistics for the 116-paper DOI-linked corpus, sorted by median publication year.
FamilynShareMedianIQRSpanPost-2020
(%)Year(%)
Transformer/GNN/FM119.52025.02024.0–2025.02021–2026100.0
EV/Integrated65.22024.02023.3–2024.82022–2025100.0
Review/Benchmark2118.12022.02014.0–2025.01982–202657.1
Deep Learning1613.82020.52018.8–2022.02016–202656.3
Probabilistic/UQ43.42006.01992.5–2014.01970–202025.0
ANN/RNN1210.31998.01992.0–2001.31991–20190.0
Expert/Fuzzy65.21997.51991.5–1999.81988–20000.0
Statistical4034.51994.01986.3–2016.01960–202610.0
Table 3. Frontier features enriched in 2020–2026 relative to the pre-2020 baseline.
FeaturePost-20Pre-20ORCI (95%)pq
Transformer/GNN/FM13/430/7365.13.8–1129 6.6 × 10 7 7.3 × 10 6
Transformer8/430/7335.22.0–627 2.3 × 10 4 1.3 × 10 3
EV/charging7/430/7330.21.7–544 6.9 × 10 4 2.5 × 10 3
Deep learning14/437/734.361.63–11.6 2.8 × 10 3 7.6 × 10 3
Graph neural network5/430/7321.01.1–390 6.0 × 10 3 1.3 × 10 2
Integrated/multi-energy4/430/7316.80.88–319 1.7 × 10 2 2.7 × 10 2
Explainable/physics-informed4/430/7316.80.88–319 1.7 × 10 2 2.7 × 10 2
Review/benchmark12/439/732.691.05–6.93 4.6 × 10 2 6.4 × 10 2
Foundation model2/430/738.860.42–189 1.35 × 10 1 1.59 × 10 1
Renewable/net-load5/433/732.880.71–11.6 1.45 × 10 1 1.59 × 10 1
Probabilistic/UQ3/436/730.900.23–3.481.0001.000
Table 4. Subfamily decomposition of transformer-, GNN-, and foundation-model papers.
SubfamilyTaggedDominantMedianSpanThemes
Transformer only652024.02021–2026Load; renewable/net-load
GNN only332025.02025Load
Transformer + GNN (hybrid)222025.02025Multi-energy; load
Foundation model212026.02026Review; load
Table 5. Recommended benchmarking and reporting checklist for forecasting studies.
No.ItemWhy It Matters
A. Problem definition and data
1Forecast task and use caseDifferent applications (feeder vs system level) require distinct targets, horizons, and evaluation criteria.
2Horizon and update frequencyAvoids vague labels (e.g., “short-term”) and clarifies deployment conditions.
3Data provenance and coverageEnsures datasets reflect renewable- and EV-rich operating regimes.
4Missing data and outliersReport preprocessing choices; gains often arise from cleaning rather than model design.
B. Experimental design
5Leakage-safe data splitsEnsures valid out-of-sample evaluation.
6Baseline models (classical + ML)Prevents overstating gains from complex architectures.
7Realistic exogenous featuresInputs (weather, mobility, markets) must be available at forecast time.
8Metrics (point + probabilistic)Accuracy alone is insufficient for risk-sensitive decisions.
9Statistical significanceDistinguishes real improvements from random variation.
C. Evaluation and deployment
10Compute cost and latencyRelevant for retraining, edge deployment, and real-time operation.
11Ablation/sensitivity analysisVerifies whether added complexity yields measurable benefit.
12Spatial granularity and topologyCritical for graph-based and regional forecasting claims.
13Calibration diagnosticsRequired for net-load, EV peak, and reserve forecasting.
14Explainability evidenceSupports trust and adoption in operational environments.
15Reproducibility (code and splits)Enables reuse, fair comparison, and long-term impact.
Disclaimer/Publisher’s Note: The statements, opinions and data contained in all publications are solely those of the individual author(s) and contributor(s) and not of MDPI and/or the editor(s). MDPI and/or the editor(s) disclaim responsibility for any injury to people or property resulting from any ideas, methods, instructions or products referred to in the content.