1. Introduction
The global transition toward sustainable, low-carbon energy systems has intensified interest in green hydrogen as a key driver of decarbonization in sectors such as heavy industry, transport, and power generation. The energy and industrial sectors are responsible for 42% and 26% of CO
2 emissions worldwide, respectively [
1]. Green hydrogen, produced using renewable energy sources, offers an environmentally friendly alternative to fossil-fuel-based hydrogen, contributing to both energy security and climate change mitigation. However, the feasibility and competitiveness of green hydrogen production depend heavily on spatial and environmental factors, including renewable energy potential, water availability, infrastructure accessibility, and proximity to demand centers.
Several studies have used a combination of Geographic Information Systems (GIS) and multi-criteria decision-making (MCDM) techniques to identify the most suitable locations for establishing renewable energy farms. GIS serves as a computational framework for the acquisition, management, and spatial analysis of geo-referenced data, enabling the integration of layers such as climate patterns, topography, and land use into a unified coordinate system. The Analytic Hierarchy Process (AHP) is an MCDM framework designed to model complex problems by decomposing them into a multi-level functional hierarchy of goals, criteria, and alternatives. AHP employs a ratio scale derived from reciprocal pairwise comparison matrices, converting qualitative expert judgments into quantitative weights by computing the principal eigenvector. AHP provides multi-criteria weighing of factors such as solar irradiance, slope, and grid proximity, while GIS applies weighted linear combination (WLC) to generate suitability maps. This hybrid approach quantifies the trade-offs among conflicting spatial variables, enabling the identification of optimal sites for renewable infrastructure by balancing mathematical consistency and spatial precision.
AHP presented the best ability to achieve the objectives of this study when compared to other MCDM techniques. AHP is best suited for GIS-based suitability mapping because it produces weighted linear combinations that are easily computed across raster layers [
2]. Other methods, such as Technique for Order of Preference by Similarity to Ideal Solution (TOPSIS) and ViseKriterijumska Optimizacija I Kompromisno Resenje (VIKOR), require calculating distances to an ideal solution for every single alternative. In a GIS environment with millions of pixels (raster data of the site), the computational overhead for other MCDM techniques, such as TOPSIS, is significantly higher than the simple overlay analysis allowed by AHP [
3]. AHP’s pairwise comparison matrix allows experts to compare two criteria at a time, which is more intuitive for stakeholders than the direct weighting required by the complex super-matrices of the Analytic Network Process (ANP) [
4].
Kamati et al. [
5] used an AHP-and-GIS approach to determine potential locations for wind and solar photovoltaic (PV) energy plants in the central and north regions of Namibia. Their findings showed that the highest potential for solar PV energy plants is in the northwest, southwest, and southern regions, whereas only the northwest region is highly suitable for wind power plants. Dahani et al. [
1] also used MCDM and GIS to identify the most promising locations in Morocco for a green ammonia unit via a land-suitability analysis. Their findings showed that the levelized cost of ammonia (LCOA) ranges from
$646 to
$687 per ton. Sun et al. [
6] presents a framework for evaluating suitable locations and technical potential for large-scale solar PV and concentrated solar power (CSP) plants by combining GIS and MCDM methods.
Xu et al. [
7] combined interval AHP and GIS to select the best wind farm sites in the Wafangdian region, China. Their study employed a multi-criteria decision-making framework to identify feasible areas for wind farm development, emphasizing biodiversity conservation and production safety as primary factors. The study determined the relative importance of evaluation criteria, including social impact, economic benefits, terrain, and environmental protection. The results revealed that 30.2% of the study area was suitable for wind power installation, with only 3.36% classified as highly suitable.
Noorollahi et al. [
8] applied a geographic information system approach to determine the potential of wind energy in Markazi province in western Iran. The MCDM method and site selection criteria for wind resource assessment were developed for the study area. Criteria investigated included technical, environmental, economic, and geographic standards. Their results were favorable for electricity production from wind in western Iran in accordance with international standards. The results showed that 28% of the study area is capable of hosting large wind farms.
Despite Namibia’s abundant renewable energy potential and growing national interest in hydrogen development, there is limited detailed research on where green hydrogen production would be most suitable and sustainable. Current feasibility studies often focus on technical and economic factors without considering the full range of spatial, environmental, and infrastructural constraints that impact project viability and suitability. In Lüderitz, challenges such as limited freshwater resources, sensitive coastal ecosystems, and the need for grid and port infrastructure demand careful spatial analysis. Without a systematic GIS-based decision-making framework, site selection for green hydrogen projects risks overlooking key sustainability criteria, potentially leading to a suboptimal or environmentally harmful development.
On this basis, the study proposes an AHP method to evaluate the spatial suitability of Lüderitz, Namibia, for green hydrogen production by weighing key criteria, including renewable energy potential, water resource availability, land use, topography, and proximity to infrastructure. By applying pairwise comparisons to these factors, the AHP method transforms expert judgment into quantitative weights that represent the relative importance of each site selection driver. These weights are then integrated with spatial datasets within a GIS environment to produce a suitability map, providing a multi-criteria decision-making framework for identifying the most favorable areas for hydrogen infrastructure development.
2. Materials and Methods
This paper employs a GIS-based multi-criteria decision-making approach to assess the suitability of Lüderitz for green hydrogen production.
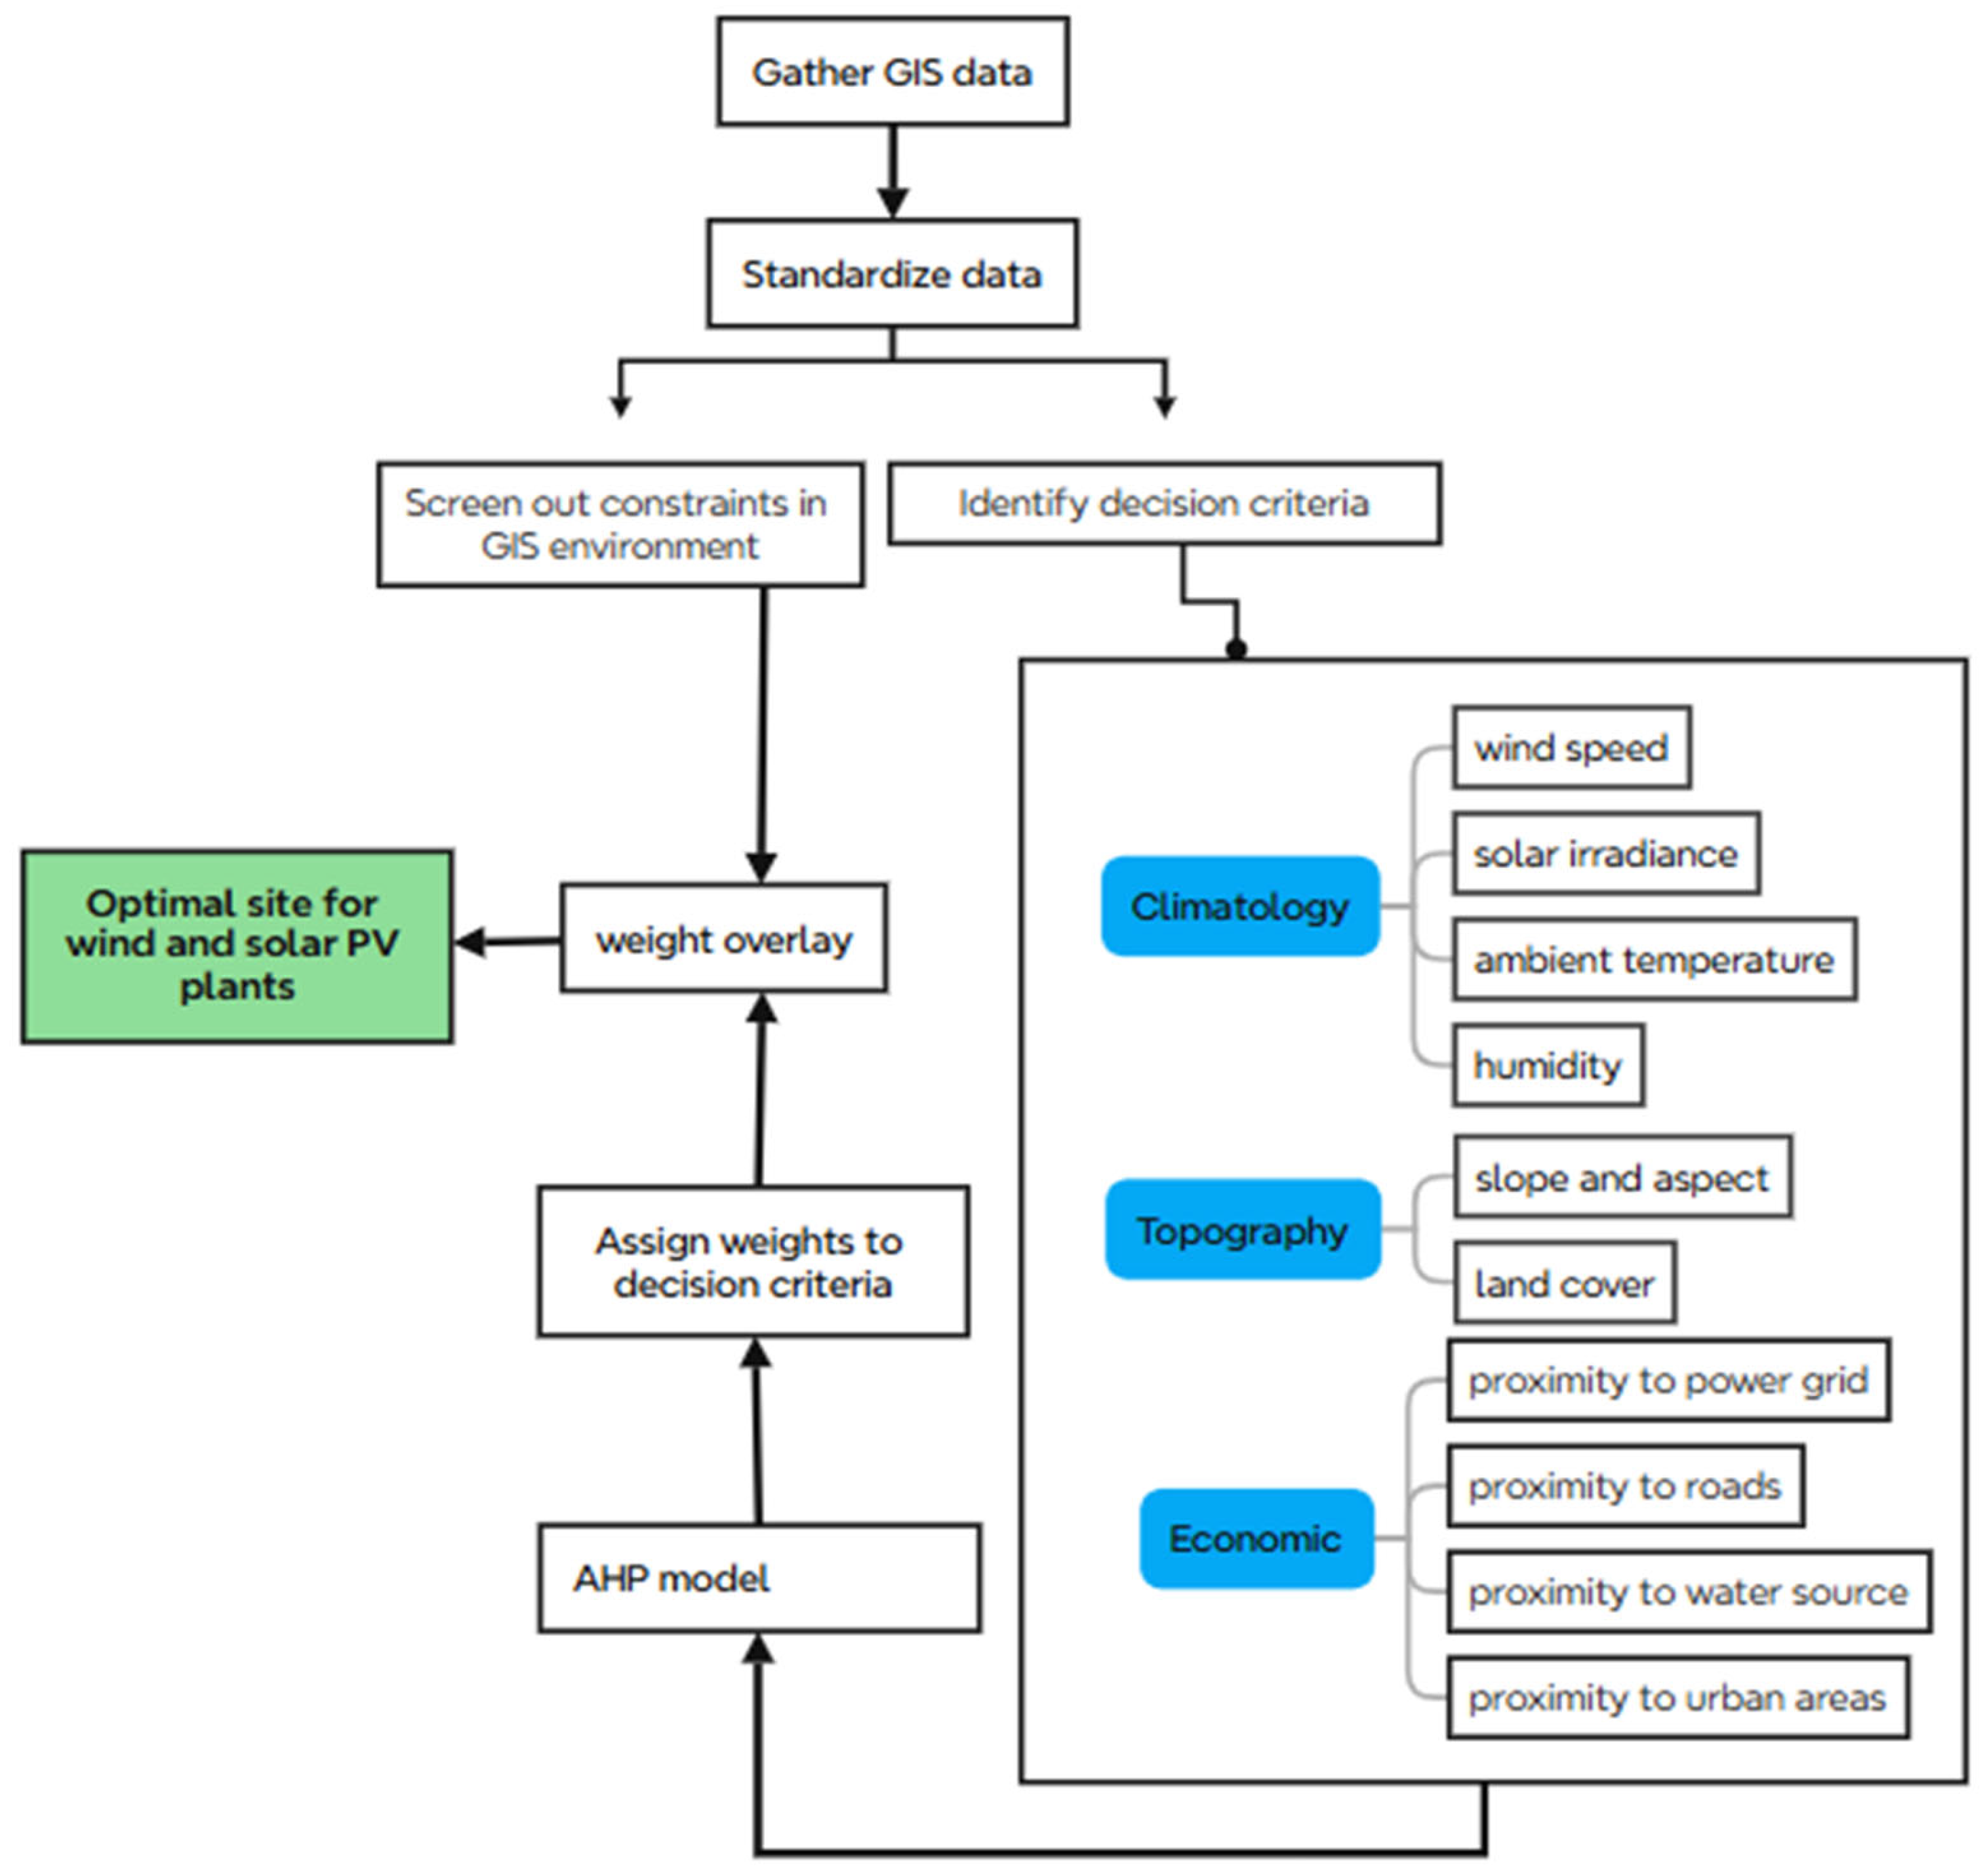
The methodology employed to identify the optimal sites at Lüderitz has three macro phases of analysis. The first phase of the analysis is screening and data preparation. The primary objective of this phase of analysis is to eliminate the unsuitable areas for further consideration. The second phase of the analysis is to identify a suitable site and define decision criteria for selecting the best site. The third phase of the analysis uses AHP to weigh the criteria and identify the best sites for wind and solar power plants to produce green hydrogen. The evaluation criteria considered in the analysis are climatology (technical), topography, and proximity to infrastructure (economic), as shown in
Figure 1.
2.1. Description of the Study Area
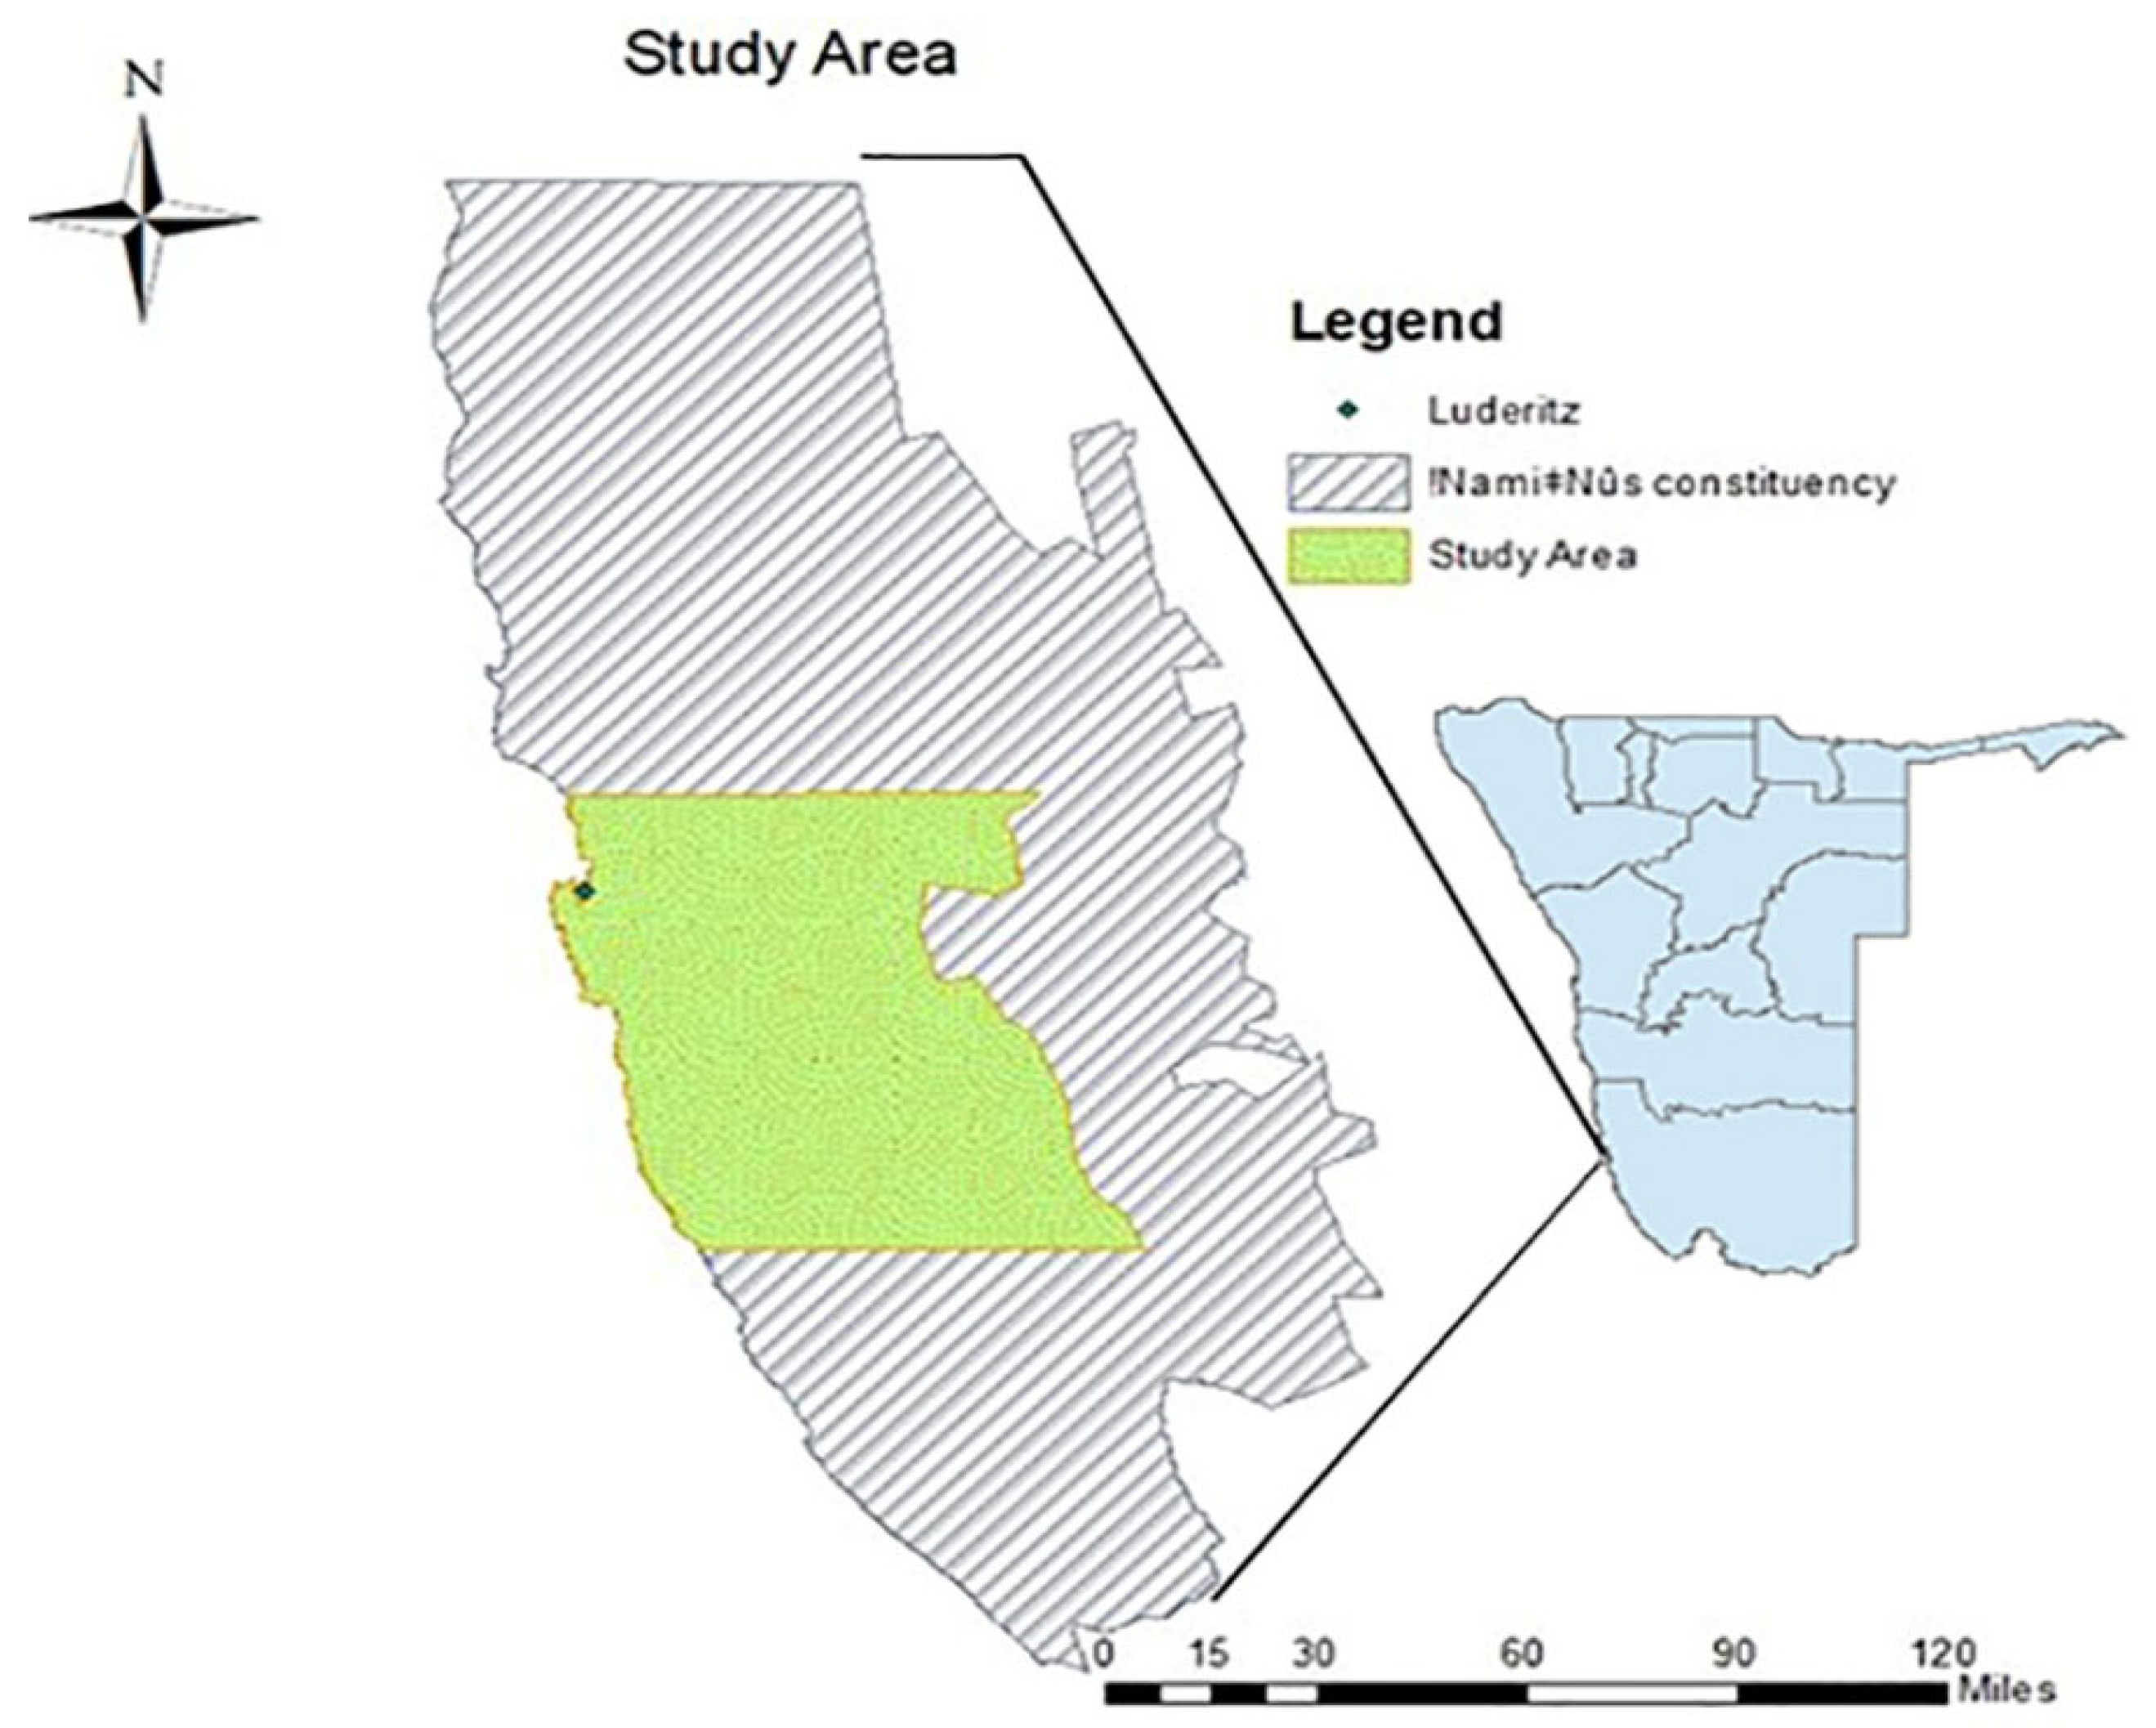
The assessment focuses on a strategically significant area within Namibia’s Tsau//Khaeb National Park, in the !Karas region. As depicted in
Figure 2, the area under study is located at 26.6420° S, 15.1639° E, with a total area of 11,344.53
. The designated study area coincides with the geographical footprint of the pioneering industrial-scale Hyphen green hydrogen project. This area is characterized by a high-yield renewable energy profile, defined by exceptional solar irradiance and sustained coastal wind speeds.
In this study, ArcGIS 10.8 was utilized to analyze geographic and meteorological data, identifying optimal locations for solar panels and wind turbines that considered factors such as sunlight exposure, wind patterns, topography, and proximity to existing infrastructure. It was used to create detailed maps and models to visualize potential energy yields and assess environmental impacts.
2.2. Identification of Study Area Criteria
Factors facilitating the identification of optimal sites are classified as weighted criteria, whereas factors precluding site suitability are defined as constraints. In this study, weighted criteria for site selection are categorized into three primary domains: climatology, topography, and economics. These domains are further disaggregated into nine distinct sub-criteria. Each sub-criterion is rigorously analyzed to evaluate its specific characteristics, advantages, and technical implications for the development of wind and solar photovoltaic (PV) power plants.
While certain criteria are influenced by national energy policies, technological preferences, and regional site requirements, the overarching objective is to identify an optimal set of parameters that ensures a renewable energy scheme operates at peak capacity. Consequently, variables such as topography, wind speed, ambient temperature, proximity to road networks, power grid accessibility, and solar irradiation are integrated as weighted criteria within an AHP-MCDM framework.
2.3. Input Data
Meteorological data, essential for assessing energy potential, can lead to erroneous conclusions if affected by calibration errors or equipment malfunctions at weather stations or in satellites. Therefore, the data collected in this study were investigated for these potential errors, ensuring data accuracy through validation and cross-verification. This study utilized a dual-source validation approach, comparing meteorological data from the Global Wind and Solar Atlases against NASA Earthdata. The investigation focused on verifying wind speeds, solar irradiance, and ambient temperatures. The study used the standard deviation to detect anomalous data points and noise, ensuring that sudden, non-physical fluctuations did not adversely affect the energy potential assessments. This comparative synthesis enabled the removal of outliers, yielding a high-fidelity dataset suitable for reliable energy modeling. The data used in this study were obtained from different spatial references, including the related literature, open sources, and government agencies, as shown in
Table 1.
To ensure spatial consistency and minimize geometric distortions during the multi-criteria evaluation, the study implemented a standardized geospatial processing workflow in ArcGIS. The harmonization process was conducted in two stages. First, all primary datasets were first re-projected into the WGS 1984 UTM Zone 33S coordinate system, as shown in
Table 1. This Universal Transverse Mercator (UTM) projection was selected to provide a conformal representation of the study area, preserving local angles and shapes, which is critical for accurate mapping of datasets. Spatial Resolution Harmonization: After projection, the ArcGIS Resample tool was used to bridge the resolution gap between datasets. For continuous environmental variables (wind speed and solar irradiance), interpolation was used, yielding a smoother surface that more accurately represents the continuous nature of atmospheric phenomena than a simple nearest neighbor approach. For discrete thematic layers, nearest neighbor assignment was used.
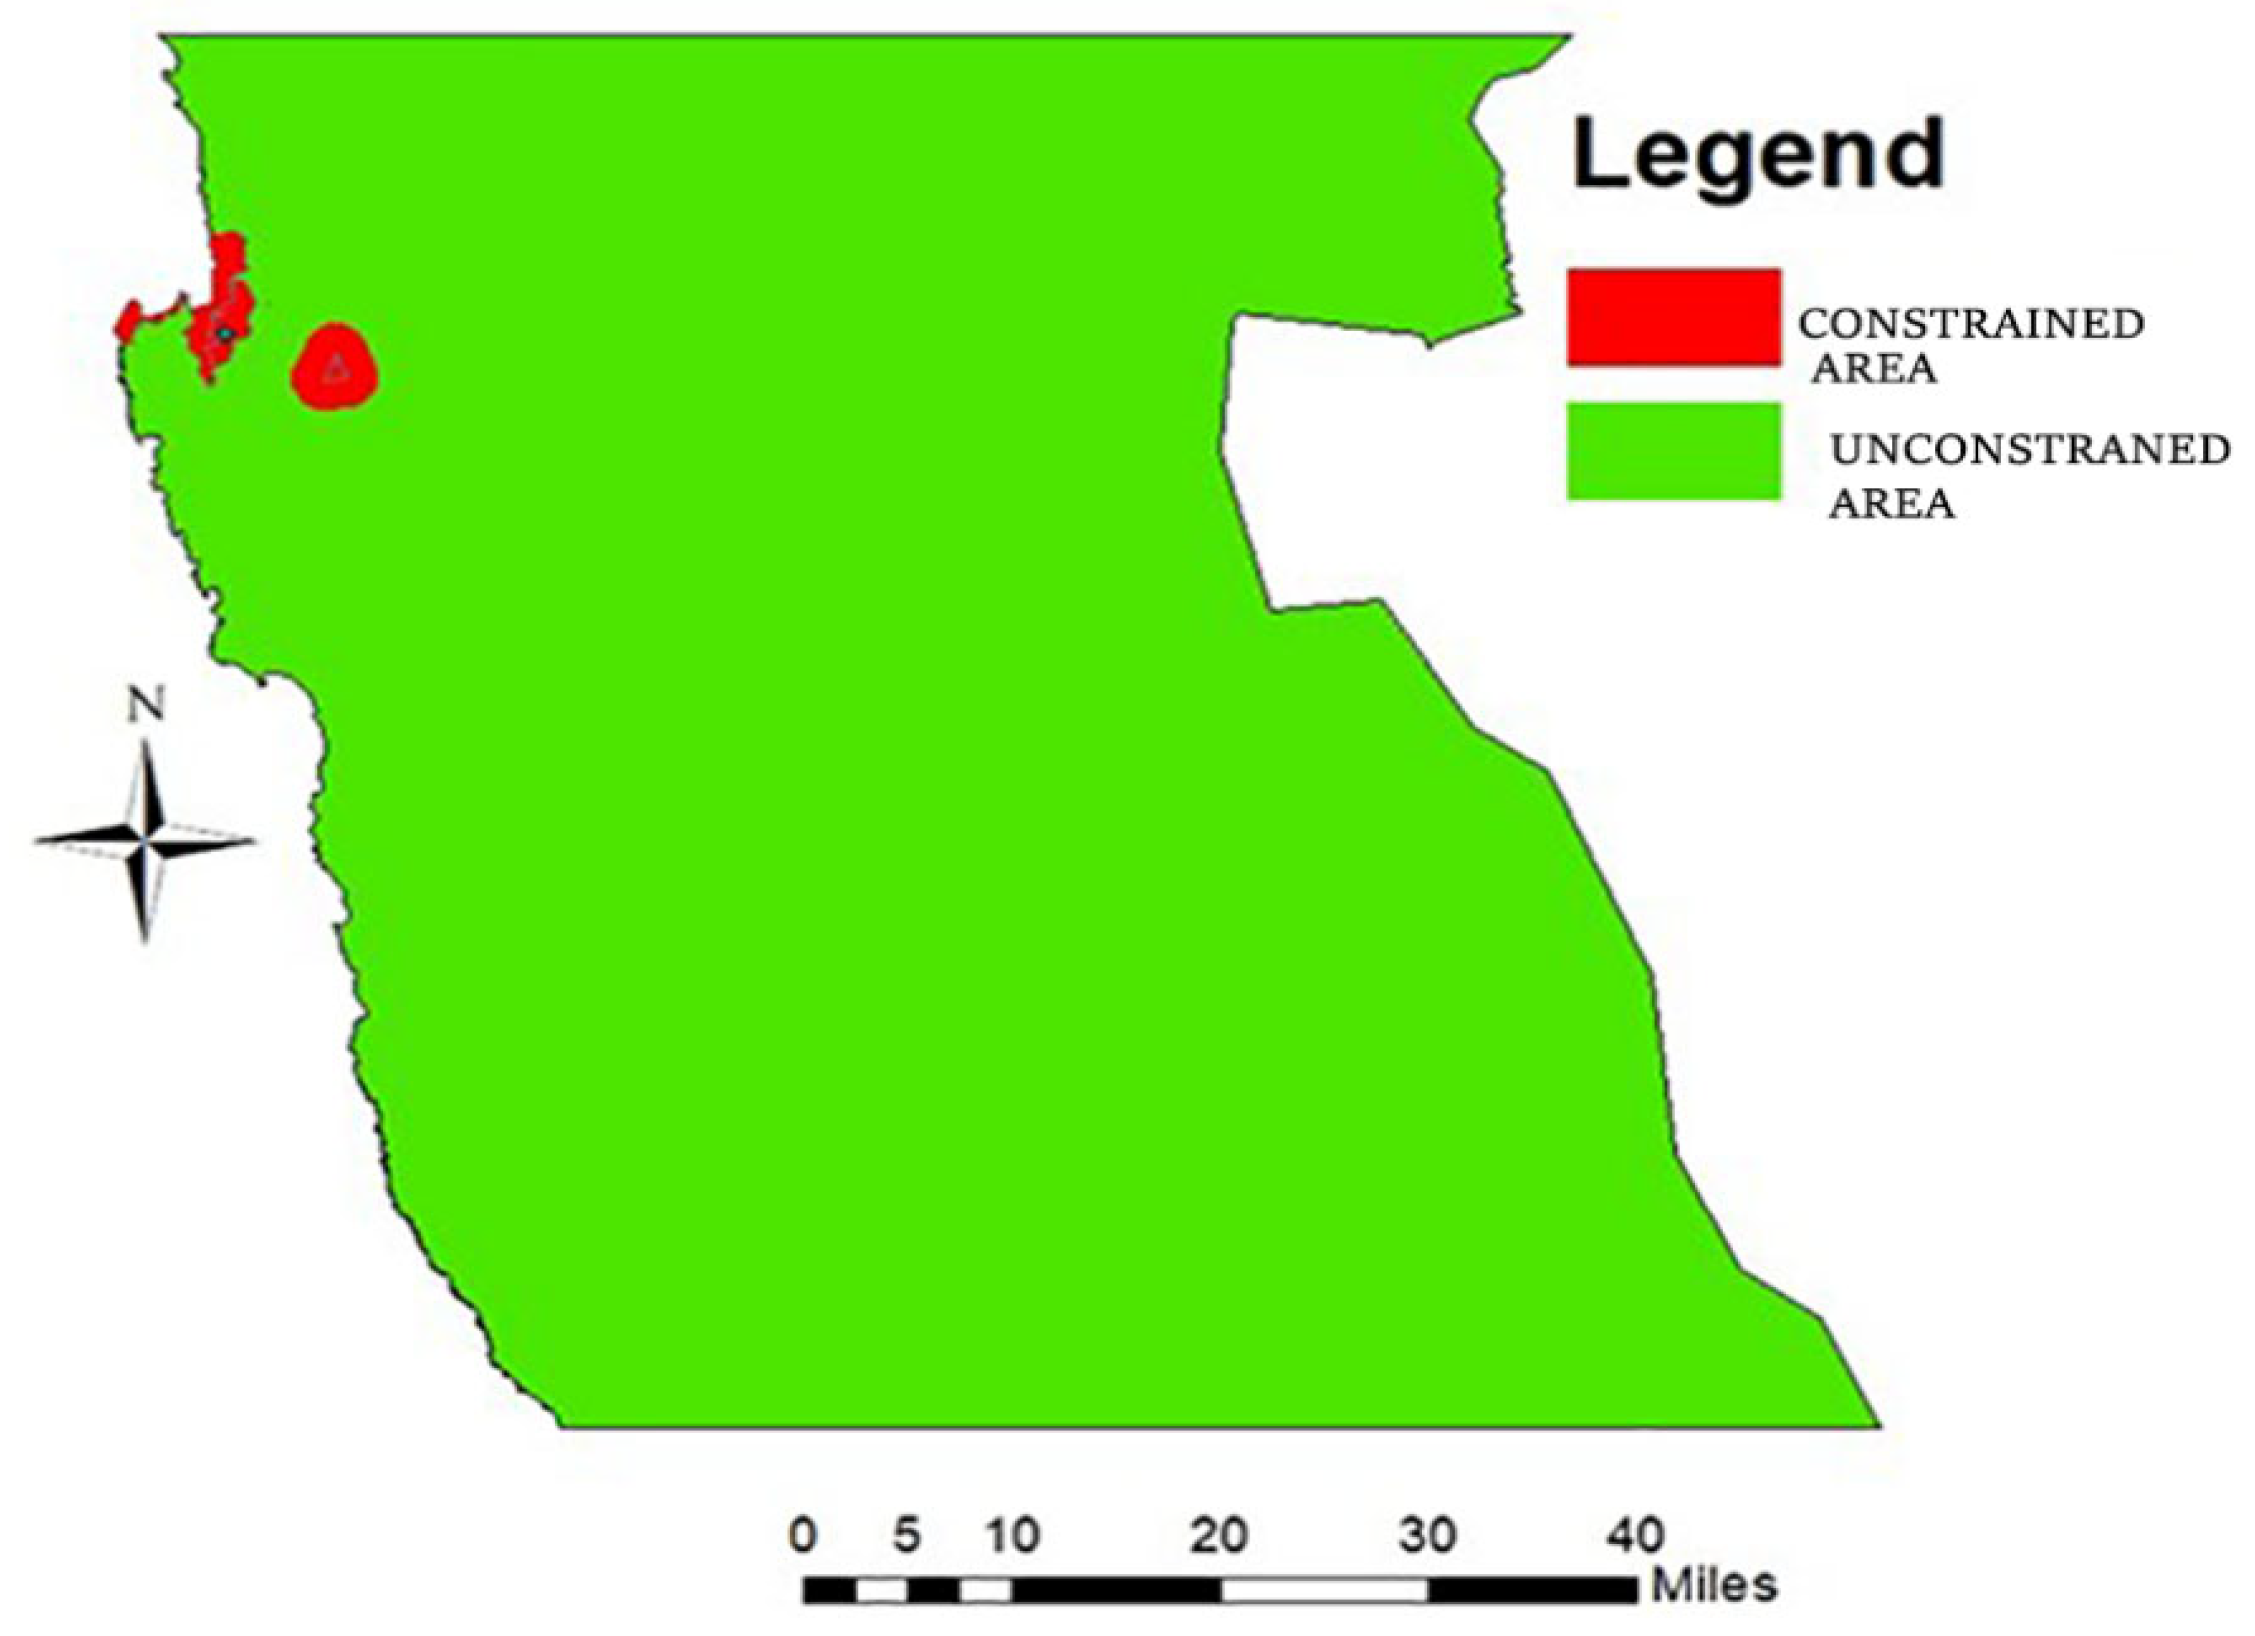
2.4. Screening-Out Constraints
Constraints include mostly environmental regulations related to airports, noise control, forests, agricultural lands, and protected areas (including wetlands, national parks, important bird areas, and water bodies). These areas, including their buffer zones, must be excluded from further consideration of green hydrogen suitability assessments. An overview of the threshold criteria for constraint factors influencing the suitability of an area for both wind and solar power plant development is provided in
Table 2.
2.4.1. Existing Airports
Wind farm development near airports is restricted due to collision risks, radar/navigation interference, wake turbulence, and impacts on future development. A 25,000 m buffer zone is required for international/military airports, and 2500 m is required for smaller airfields [
12]. Since Lüderitz Airport is a small domestic airfield, a 2500 m buffer was applied to the wind and solar site selection area and removed.
2.4.2. Urban Areas
Setting up a wind farm in urban areas involves several considerations to maximize efficiency, minimize impacts, and comply with regulations. A distance of 500 m from urban areas is the minimum threshold distance for setting up a wind farm. Placing wind farms away from urban areas helps minimize noise and visual pollution impacts on the local population.
While rare, there is a risk of mechanical failures, such as blade throw or ice throw, where parts of the turbine or ice accumulated on blades can be projected at high speeds. Keeping wind farms away from populated areas mitigates these safety risks.
2.4.3. Protected Area
Protected areas such as natural, archaeological, and historic sites, tourist areas, wildlife areas, and cultural heritage sites were studied. Such protected areas and areas within a 500 m buffer zone from such areas are classified as unsuitable areas.
2.4.4. Land Cover
Certain types of land, including forests, woodlands, and wetlands, are not suitable for both solar and wind farms. Trees in forests and woodlands hinder wind flow, reducing the efficiency of wind turbines. Wetlands are not conducive to electrical installations due to their unstable and often waterlogged ground conditions. As a result, these areas are excluded from wind farm suitability assessments to ensure optimal performance and safety of the installations. The area under study is located in the Namib Desert, with no vegetation taller than one meter covering the land, making land cover of very little concern.
2.4.5. Important Bird Areas
Wind energy can negatively affect birds through collision, death, displacement, barriers, and habitat loss or degradation. Therefore, avoiding wind farms on important bird areas (IBAs) is the most effective way to prevent or reduce these impacts.
2.5. Analytic Hierarchy Process (AHP)
AHP is a structured technique for organizing and analyzing complex decisions based on mathematics and psychology. It was developed by Thomas L. Saaty in the 1970s, and in 1983, Saaty partnered with Ernest Forman to develop expert software [
11]. It represents an accurate approach to quantifying the weights of decision criteria. Individual experts’ experiences are utilized to estimate the relative magnitudes of factors through pairwise comparisons [
12]. Each respondent compares the relative importance of each pair of items using a specially designed questionnaire. The relative importance of the criteria can be determined by using the AHP by comparing them, and, if applicable, their sub-criteria, in pairs by experts or decision-makers. AHP is one of the most widely used methods in the literature for determining optimal locations for installing wind and solar PV energy plants. It is the most widely used multi-criteria decision-making technique integrated within GIS, which assigns weights to criteria and can manage inconsistent judgments.
AHP Mathematical Model
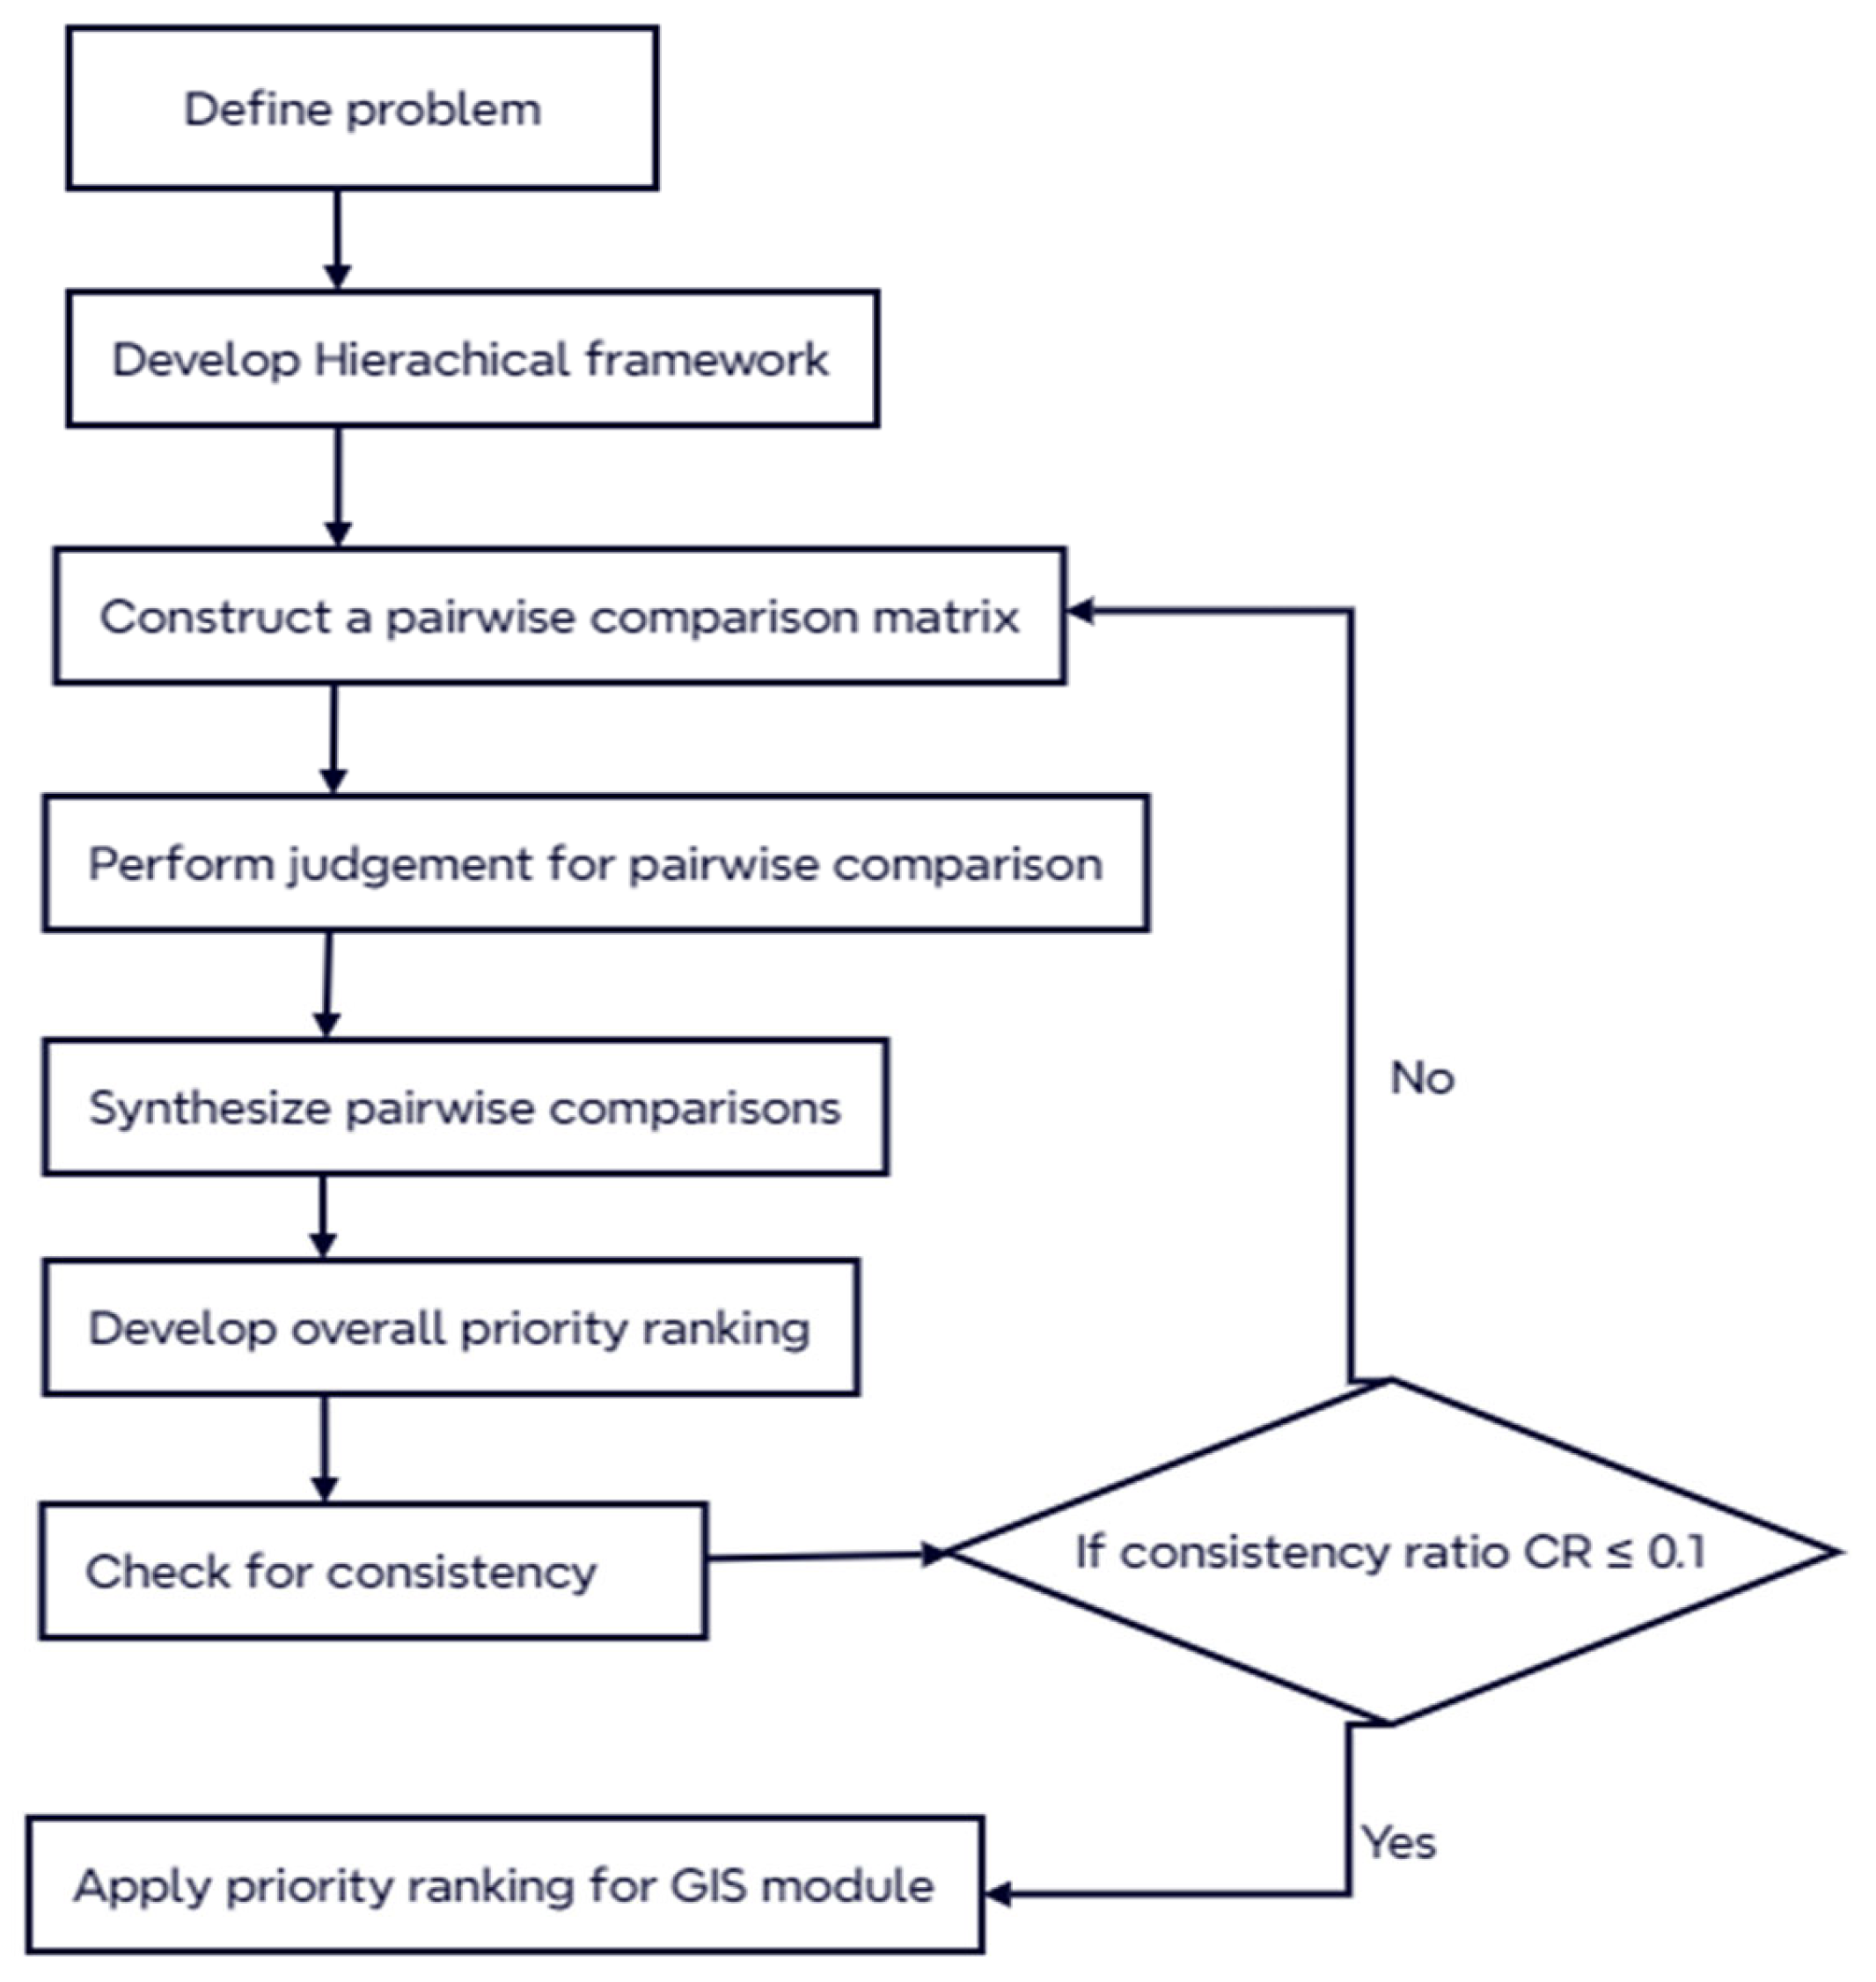
In this study, the following steps are used for identifying optimal sites for RE plant deployment. First, the decision problem is structured into a hierarchy in the AHP process by defining the main goal (selecting the best locations for RE plants) and the criteria. As shown in
Figure 3, the decision problem is organized into a hierarchical model, with the top level representing the objective of selecting the optimal sites for PV utility-scale plants. The second level lists the decision criteria and sub-criteria for wind and solar site selection.
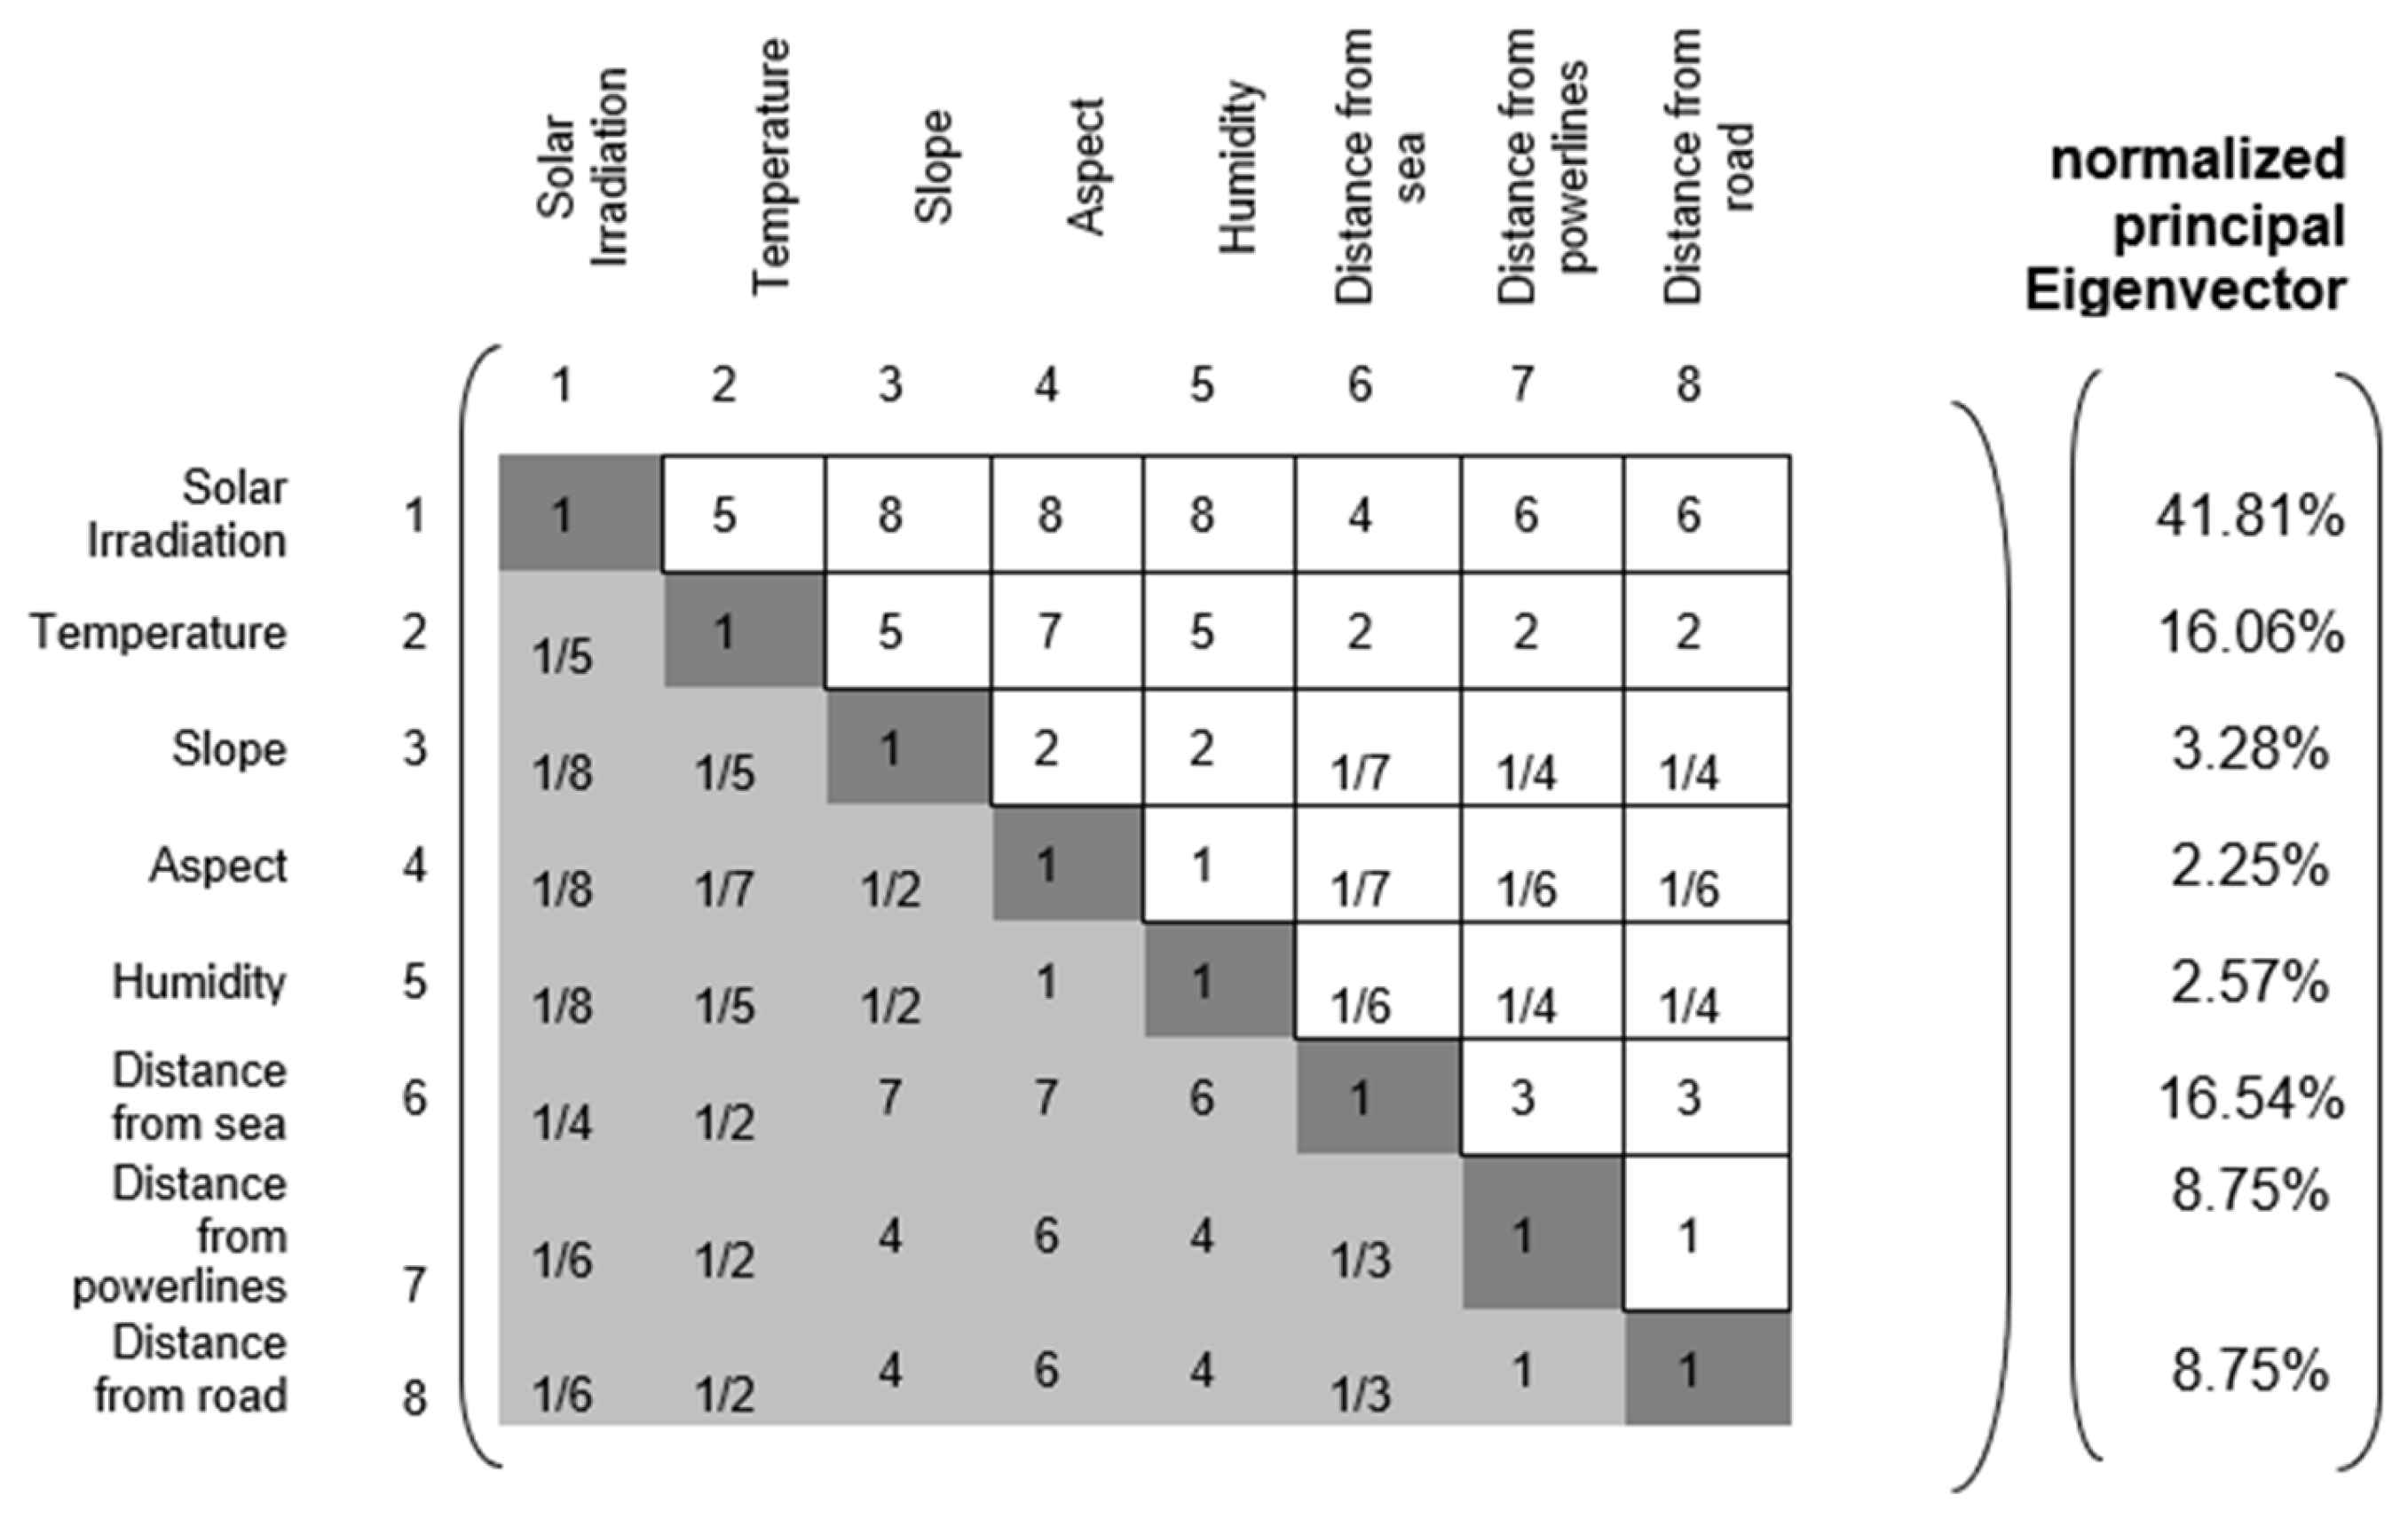
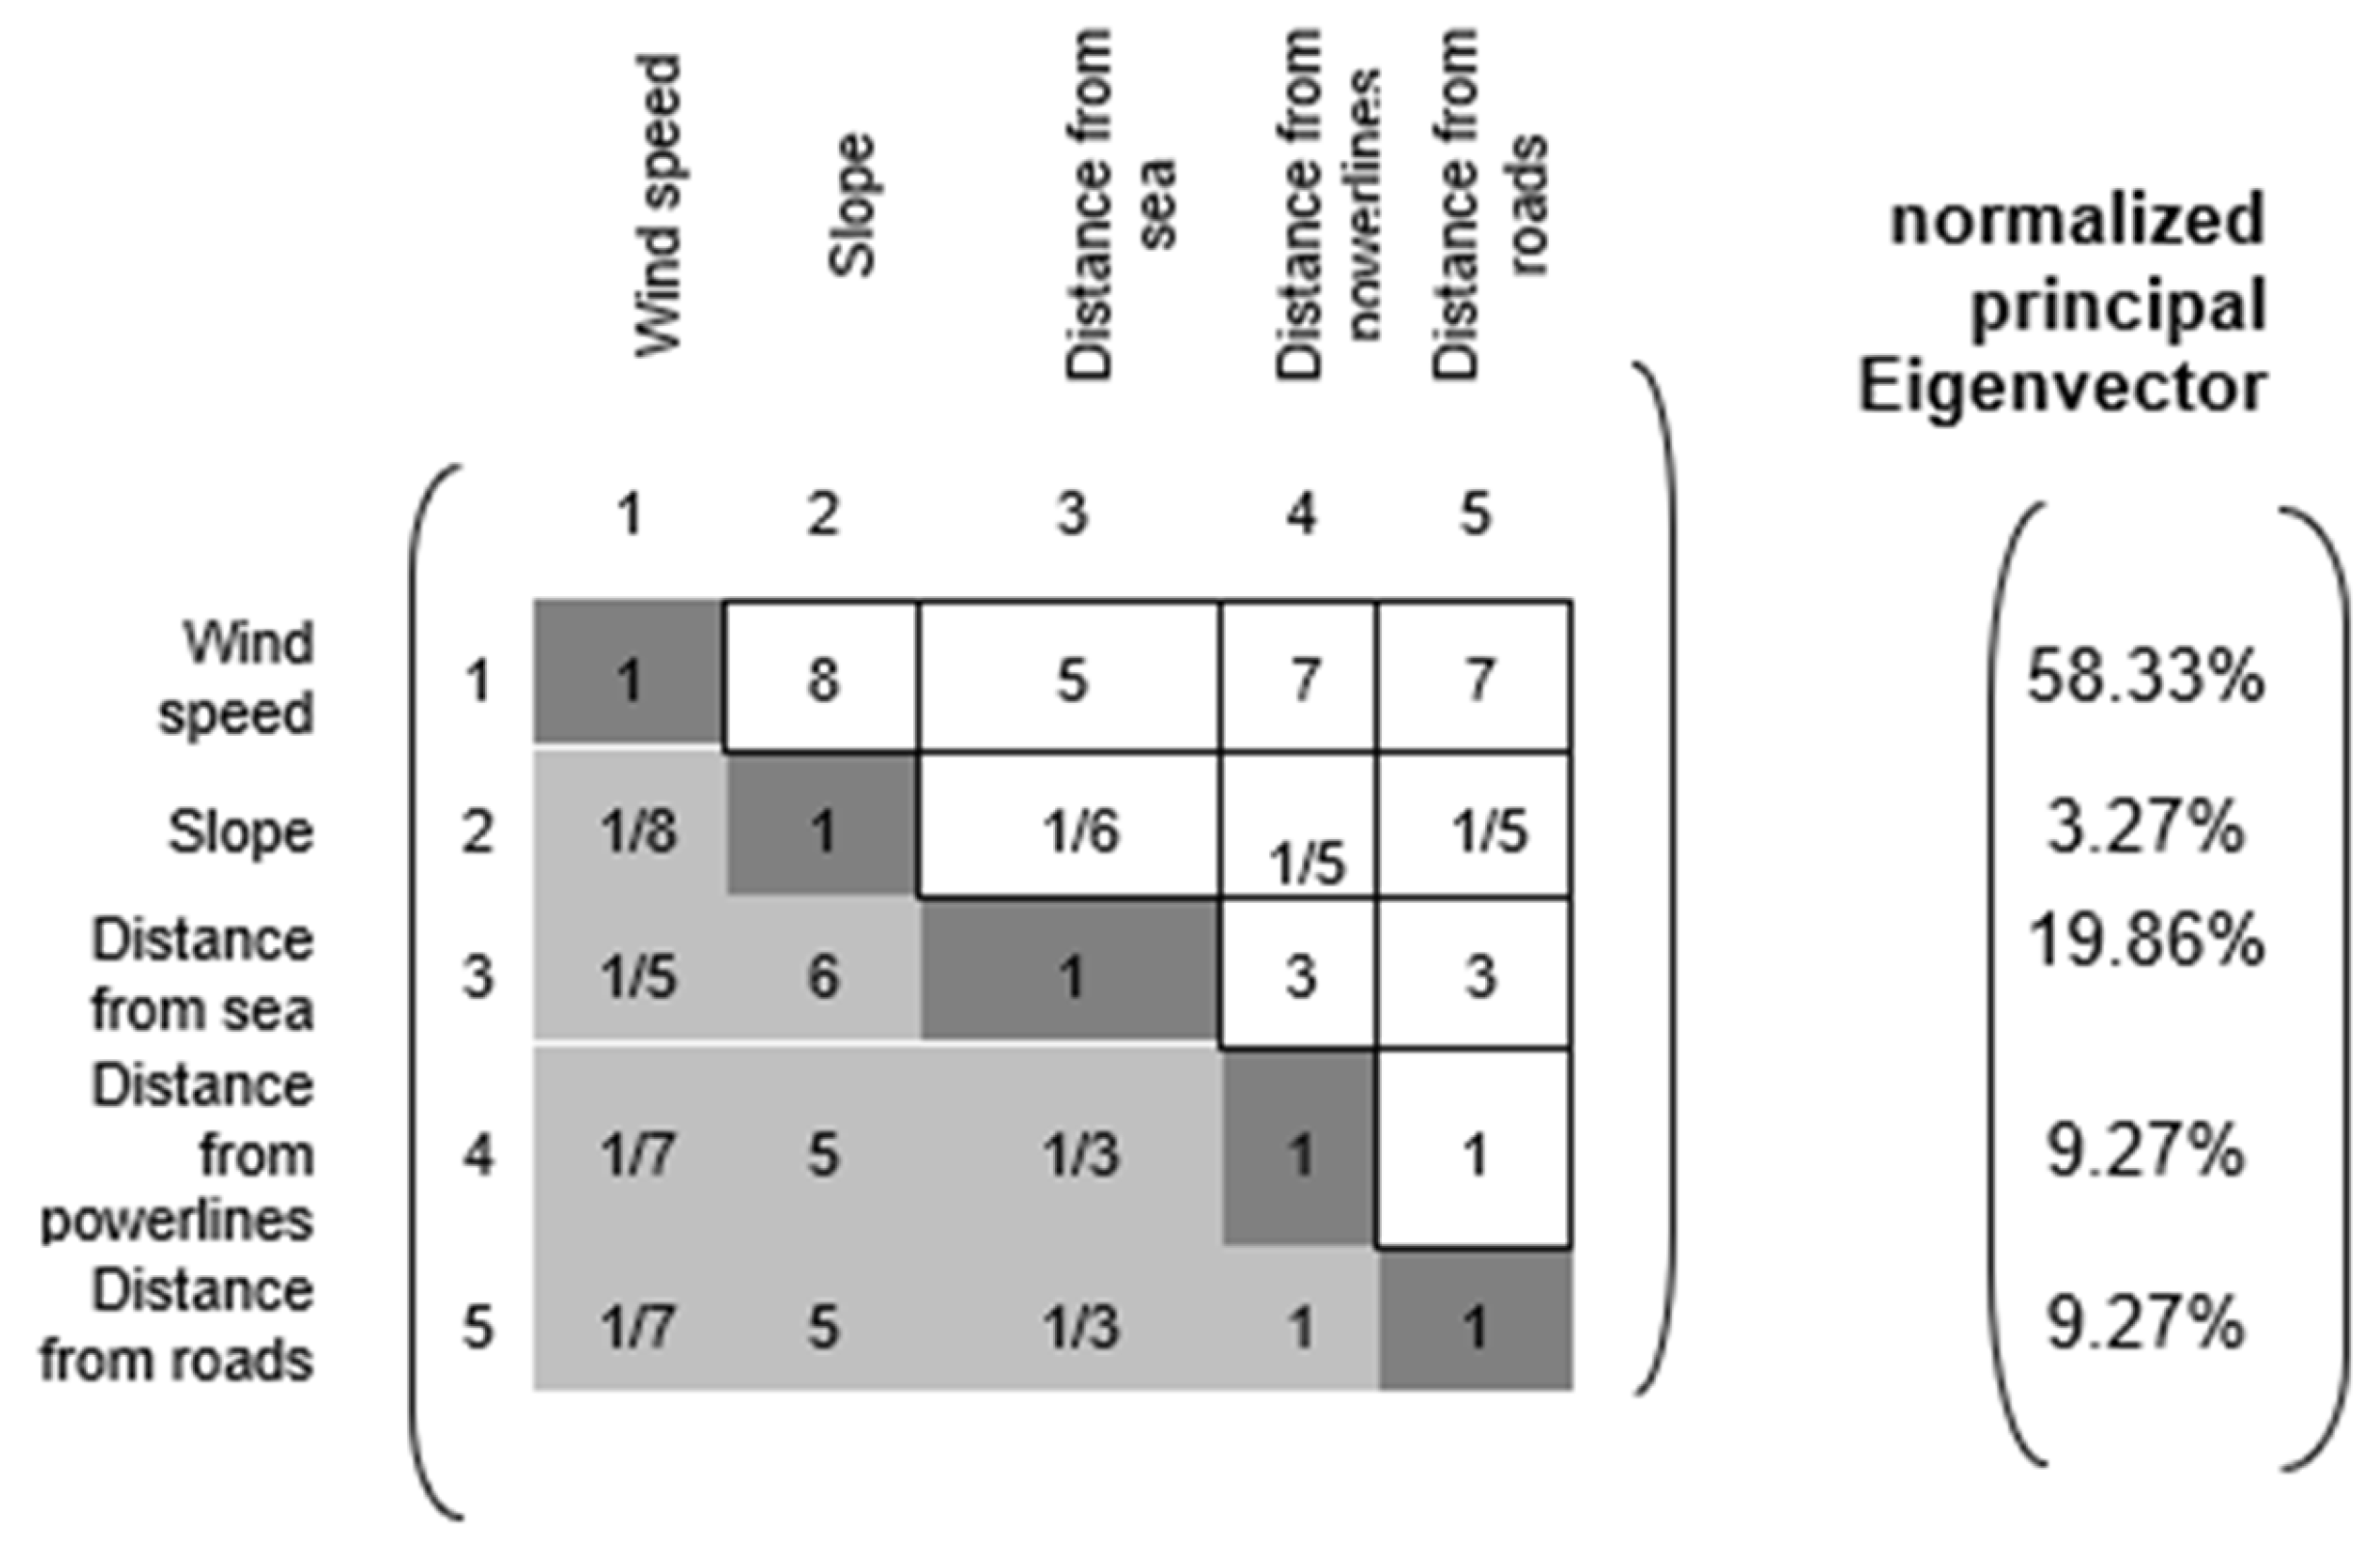
The second step is to compare the criteria using Saaty’s numerical scale from one to nine based on their importance, as shown in
Table 3. The score points of the criteria are then applied in the construction of a pairwise comparison matrix [
14].
The pairwise comparison matrix C is a square matrix (n × n), where n is the number of criteria. For each cell
, the matrix C represents the comparison values between the
-row criteria relative to the
-column criterion. If the cell
> 1, the
criteria are more important than the
criteria and vice versa.
Step three involves deriving the normalized pairwise comparison matrix to determine the priority (weights) of each criterion. In a normalized pairwise comparison matrix M, the sum of each column must equal 1. This is achieved by calculating
for each cell in matrix C using Equation (2).
Step four is to determine the overall weight vector. The criteria weight vector (
) is calculated by averaging across rows to obtain the relative weights, as given by Equation (3).
where a is the number of values in the row.
Step five is to compute the consistency ratio (CR) of the matrix. The degree of consistency in the analysis is considered acceptable if CR ≤ 0.1; otherwise, the judgments must be revised to identify and correct the source of the inconsistency. CR and CI are calculated using Equations (4) and (5), respectively.
where
is the maximum eigenvalue of the comparison matrix, and n is the size of the matrix. RI represents values of the random consistency index depending on the number of criteria N considered in matrix C. Saaty’s RI values are shown in
Table 4.
2.6. Data Reclassification
In this study’s geospatial modeling, unclassified raster maps are the primary data in continuous format, where each cell retains a precise, high-fidelity quantitative value that captures the full spectrum of environmental variability. Unclassified maps are reclassified by discretizing continuous values into criterion-specific classes (scales) based on predefined thresholds (suitability criteria). This transition from raw measurement to categorical grouping facilitates MCDM by normalizing datasets into a common scale of relative importance.
2.7. Solar Power Analysis
Criteria affecting the site selection of a solar power plant are analyzed in this section. All criteria are classified according to their suitability. The criteria and their classification ranges are shown in
Table 5.
2.7.1. Solar Irradiation
Solar irradiation is a crucial factor in assessing a region’s potential. It measures the amount of energy received per unit area on the Earth’s surface, expressed in watt-hours per square meter. PV systems use Global Horizontal Irradiation (GHI), which represents the total radiation received by a horizontal surface from the Sun. While solar irradiation is a question of technical feasibility, it is also an economic consideration. For cost-effective operations, solar PV panels require a minimum GHI of 1300 kWh/m
2/y [
5]. Raster-format Global Horizontal Irradiation data was collected from the Global Solar Atlas at 250 m for GIS analysis. It represents the yearly time average from 2013 to 2023 (10 years) in kWh/
.
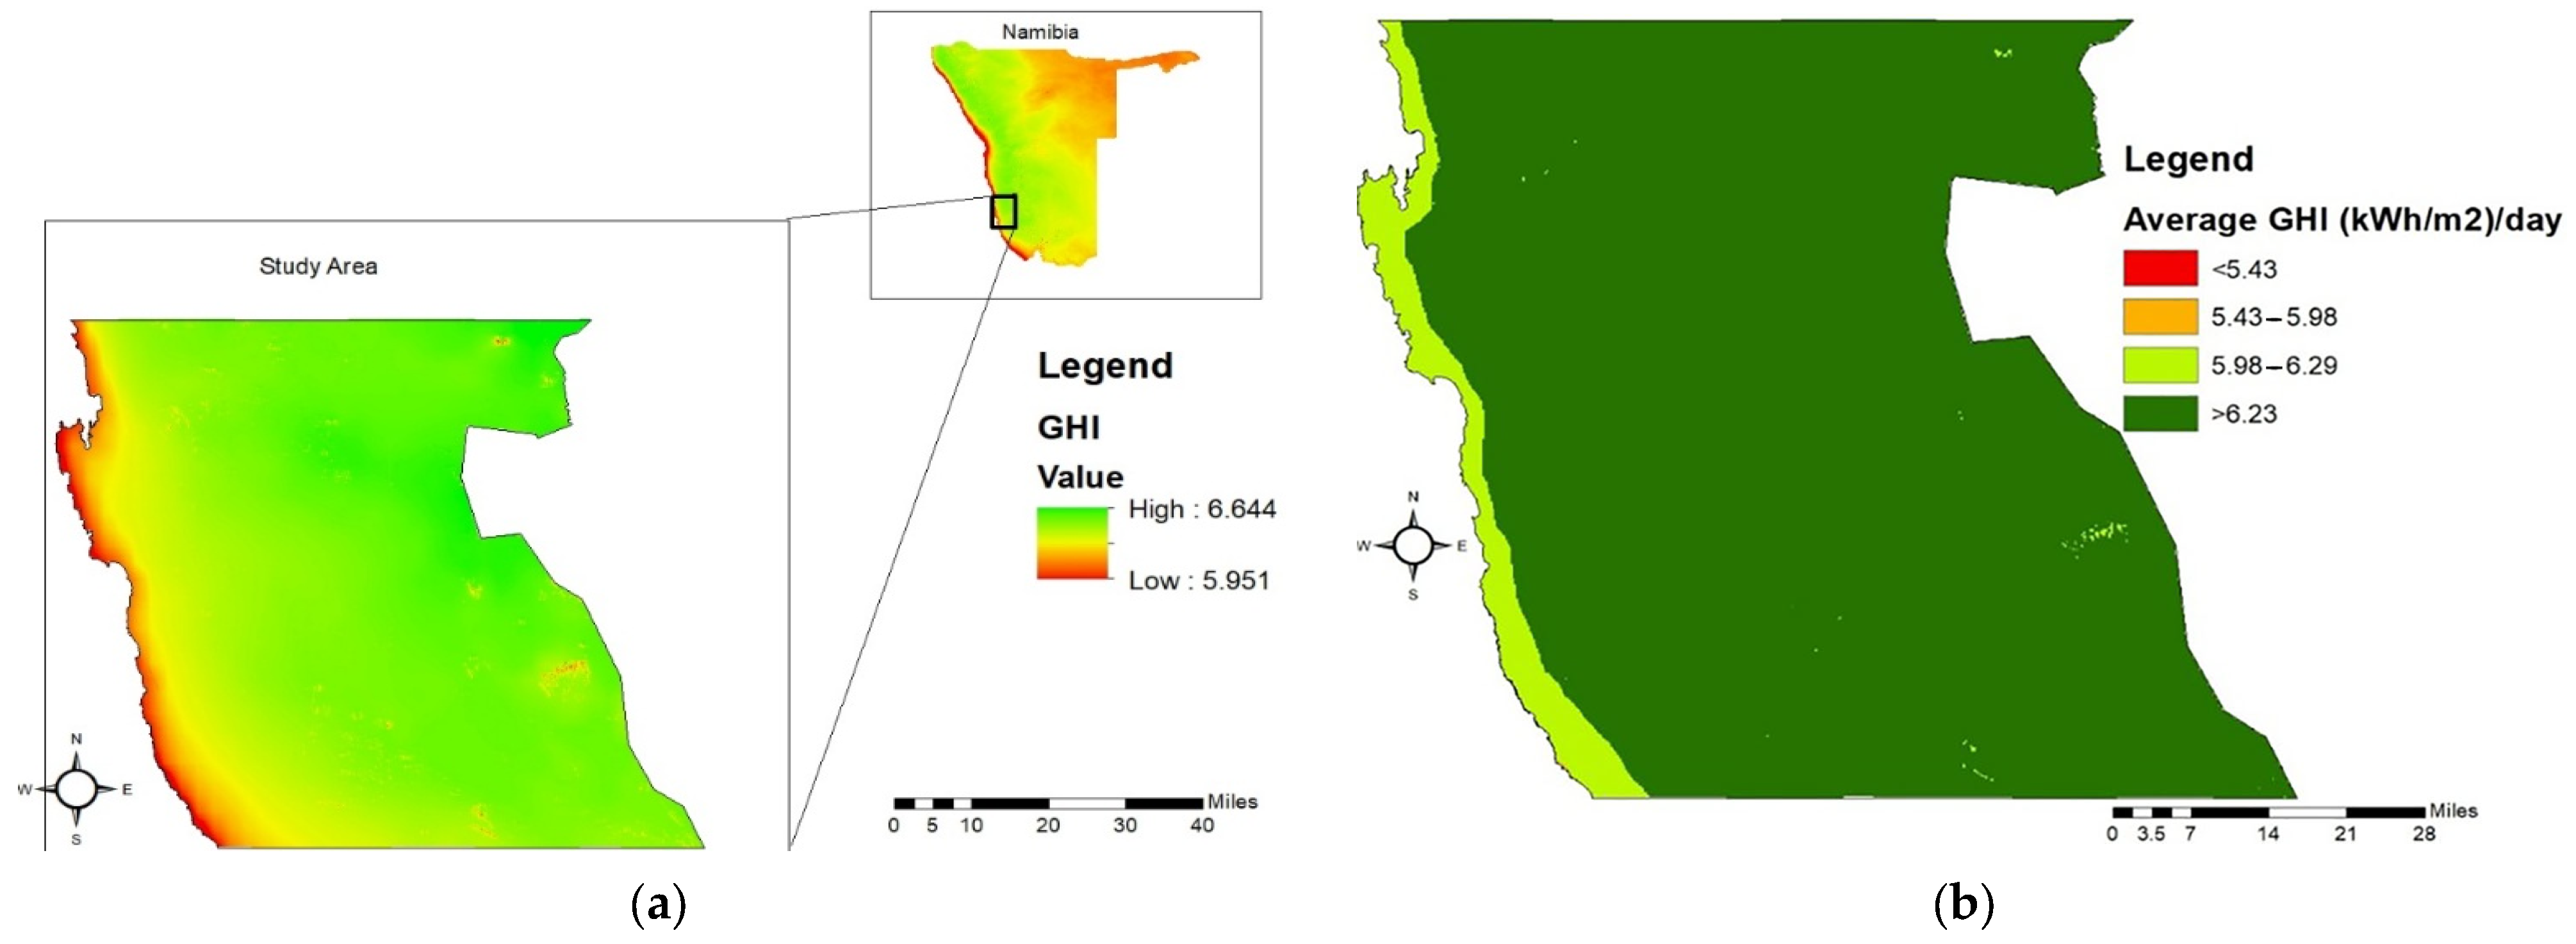
Figure 4a shows the unclassified and re-classified ranges of daily average solar irradiation in k
. The 4 suitability classes are shown in
Figure 4b.
2.7.2. Air Temperature
An increase in air temperature decreases panel efficiency. Kocabaldir and Yucel [
15] have shown that the amount of generated energy declines by about 0.4–0.5% for every 1 °C rise in cell temperature above 25 °C. The relationship between solar efficiency and temperature is given by Equation (6). A linear equation can describe their relationship as follows.
where:
- -
is the efficiency of the PV cell at temperature T.
- -
is the reference efficiency of the PV cell at the reference temperature (usually 25 °C or 298 K).
- -
T is the operating temperature of the PV cell.
- -
is the reference temperature, typically 25 °C (298 K).
- -
β is the temperature coefficient of efficiency, which is a negative value representing the rate of efficiency decrease per degree Celsius increase in temperature. The manufacturer typically provides it, and it is typically in the range of −0.2%/°C to −0.5%/°C for many silicon-based PV cells.
The solar cell temperature can be calculated from Equation (7).
where
- -
is the solar cell temperature;
- -
is the air temperature;
- -
is the nominal reference temperature.
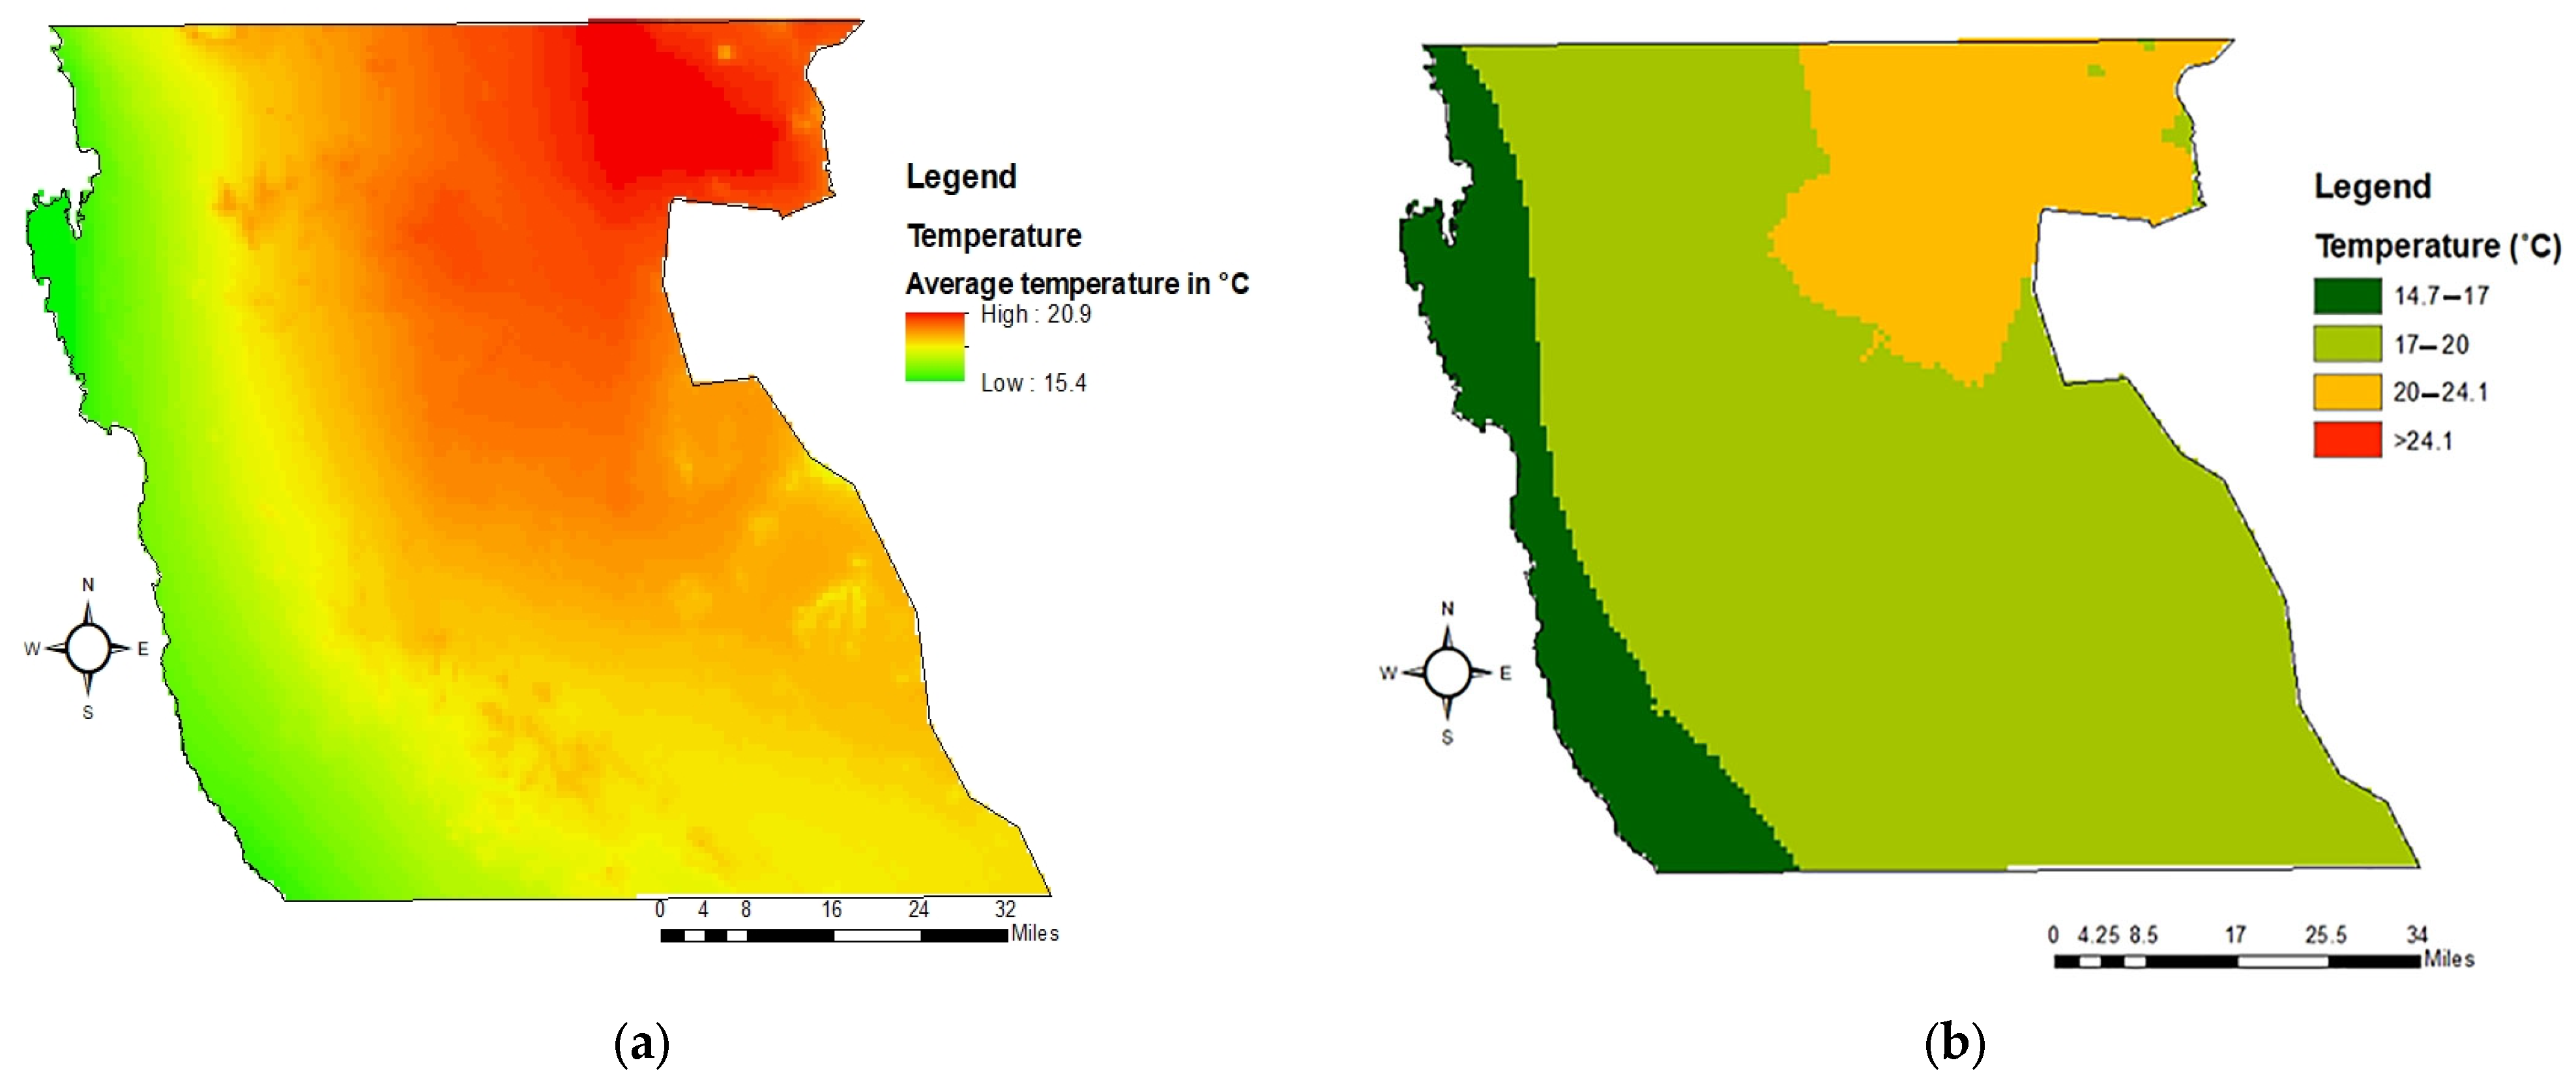
Therefore, areas with lower temperatures have increased solar efficiency, making them preferred for solar installations. The unclassified and reclassified map for temperature averages is shown in
Figure 5. From the map, cooler temperatures can be observed along the coast, with temperatures warming as you go inland. The lowest average temperature recorded is 15.4 °C to 20.9 °C, placing the overall study area in the high and moderate suitability classes, as shown in
Figure 5.
2.7.3. Humidity
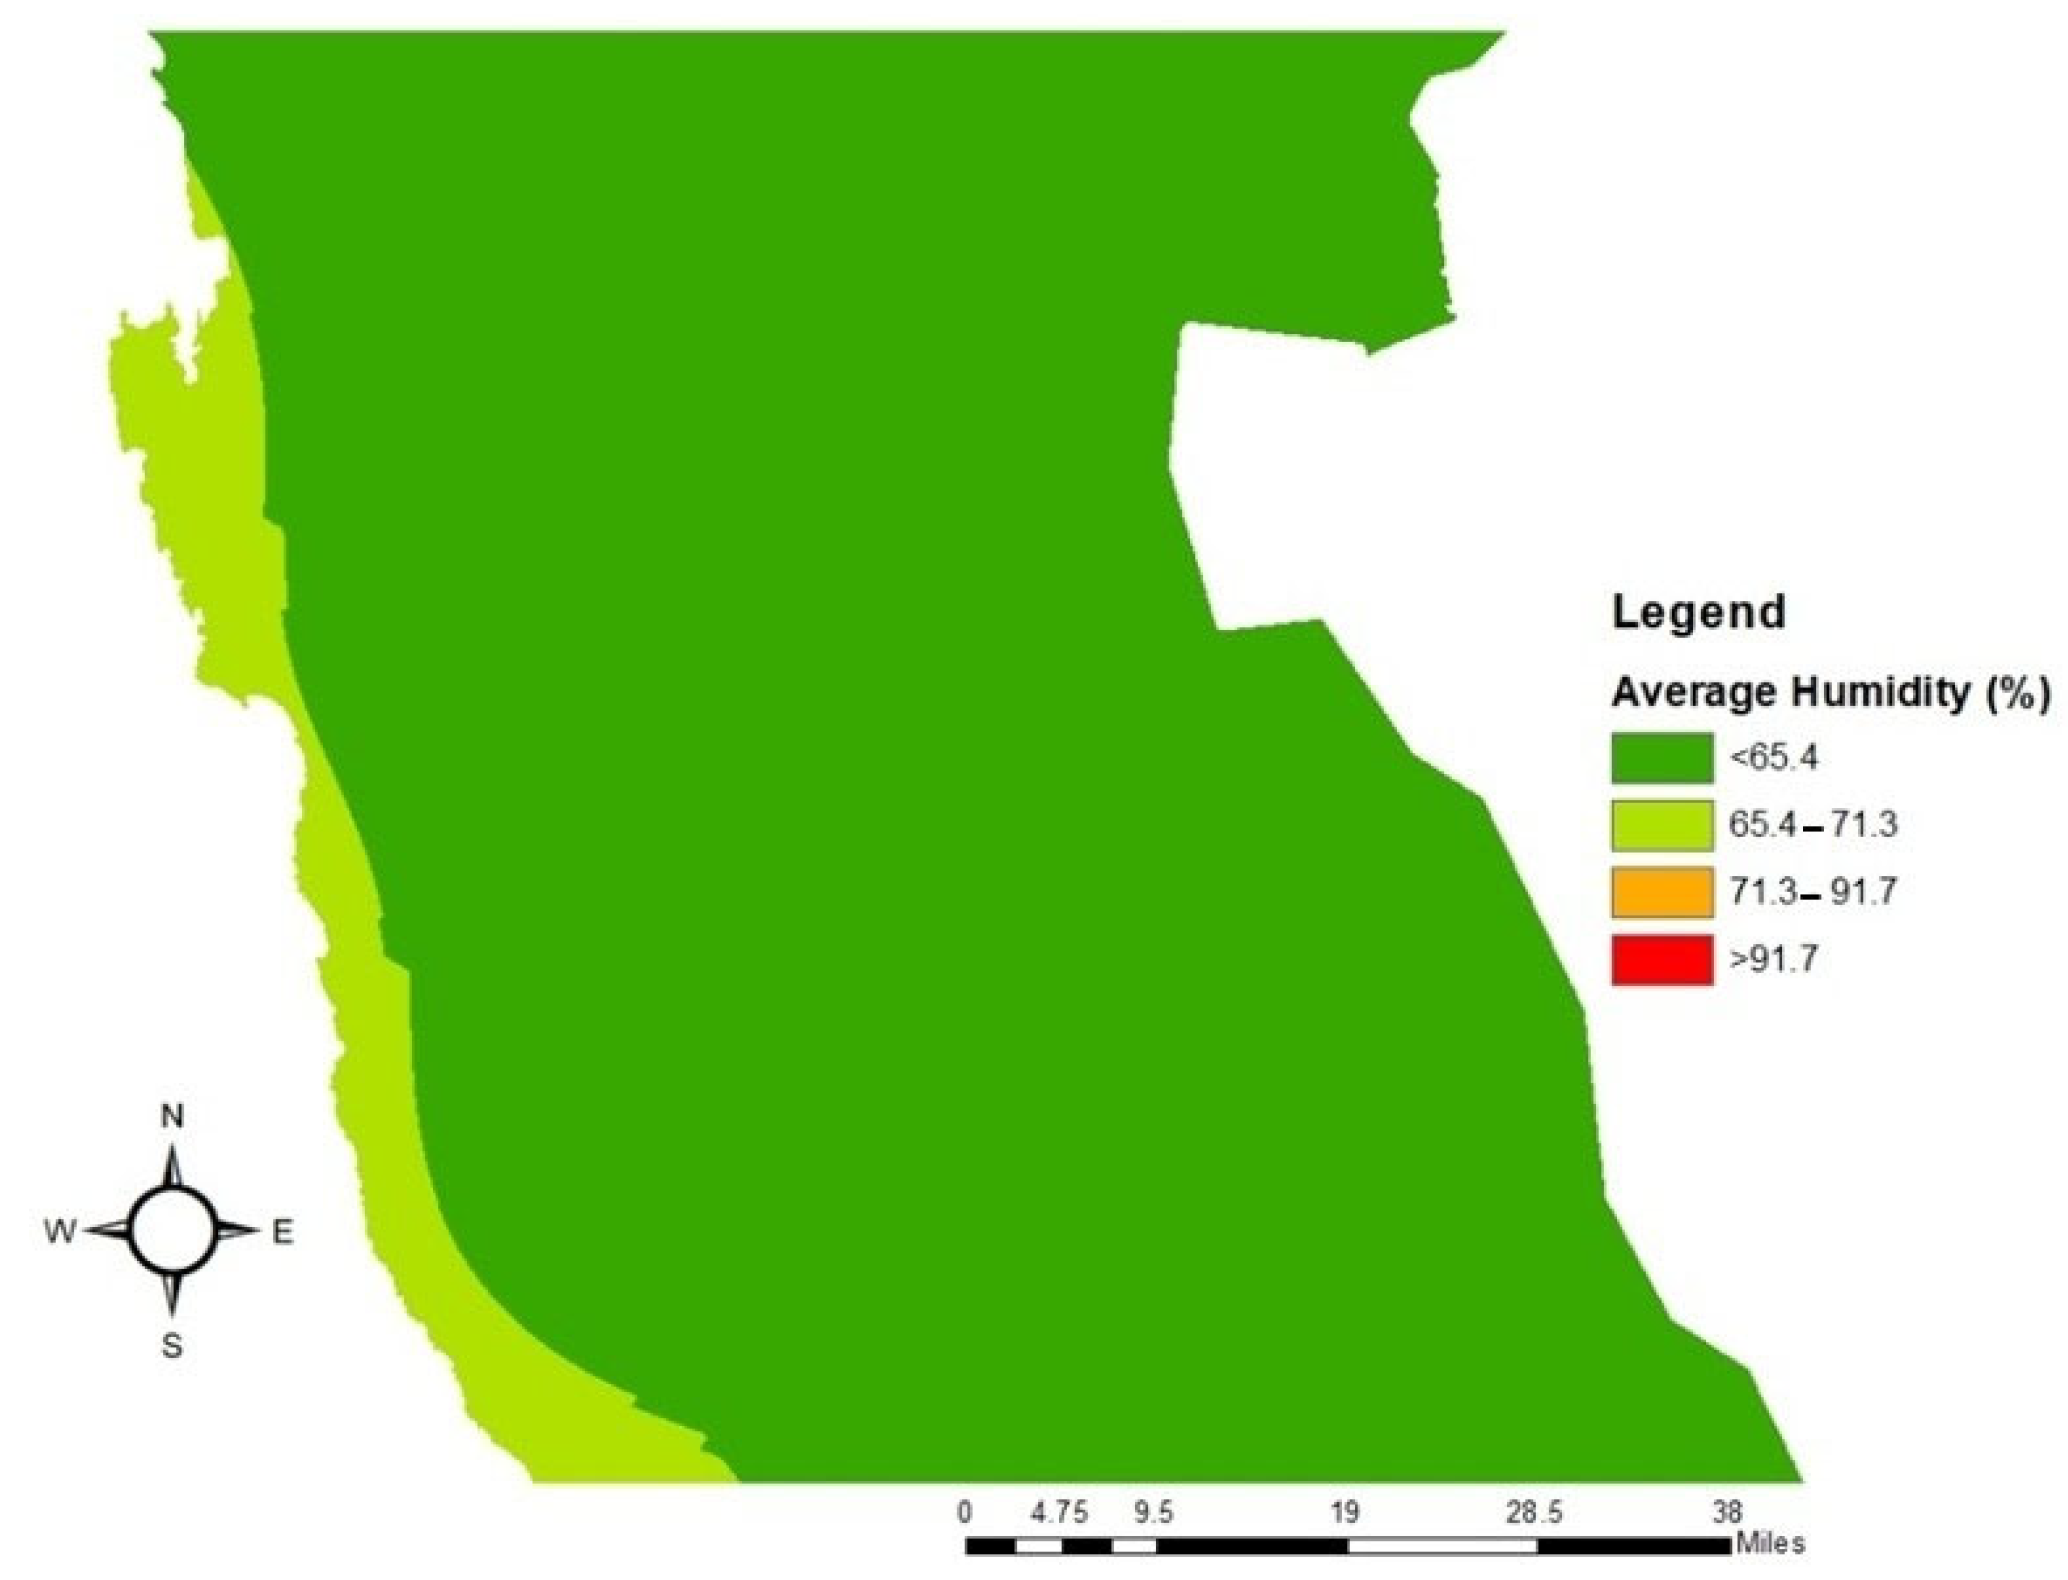
Humidity reduces solar efficiency in two ways: water vapor reflects or refracts sunlight away from the cells, and prolonged exposure to heat and moisture degrades panel hardware over time. These effects impact both crystalline silicon and thin-film modules. Regional humidity levels (2012–2022) are illustrated in
Figure 6.
2.7.4. Slope (Solar)
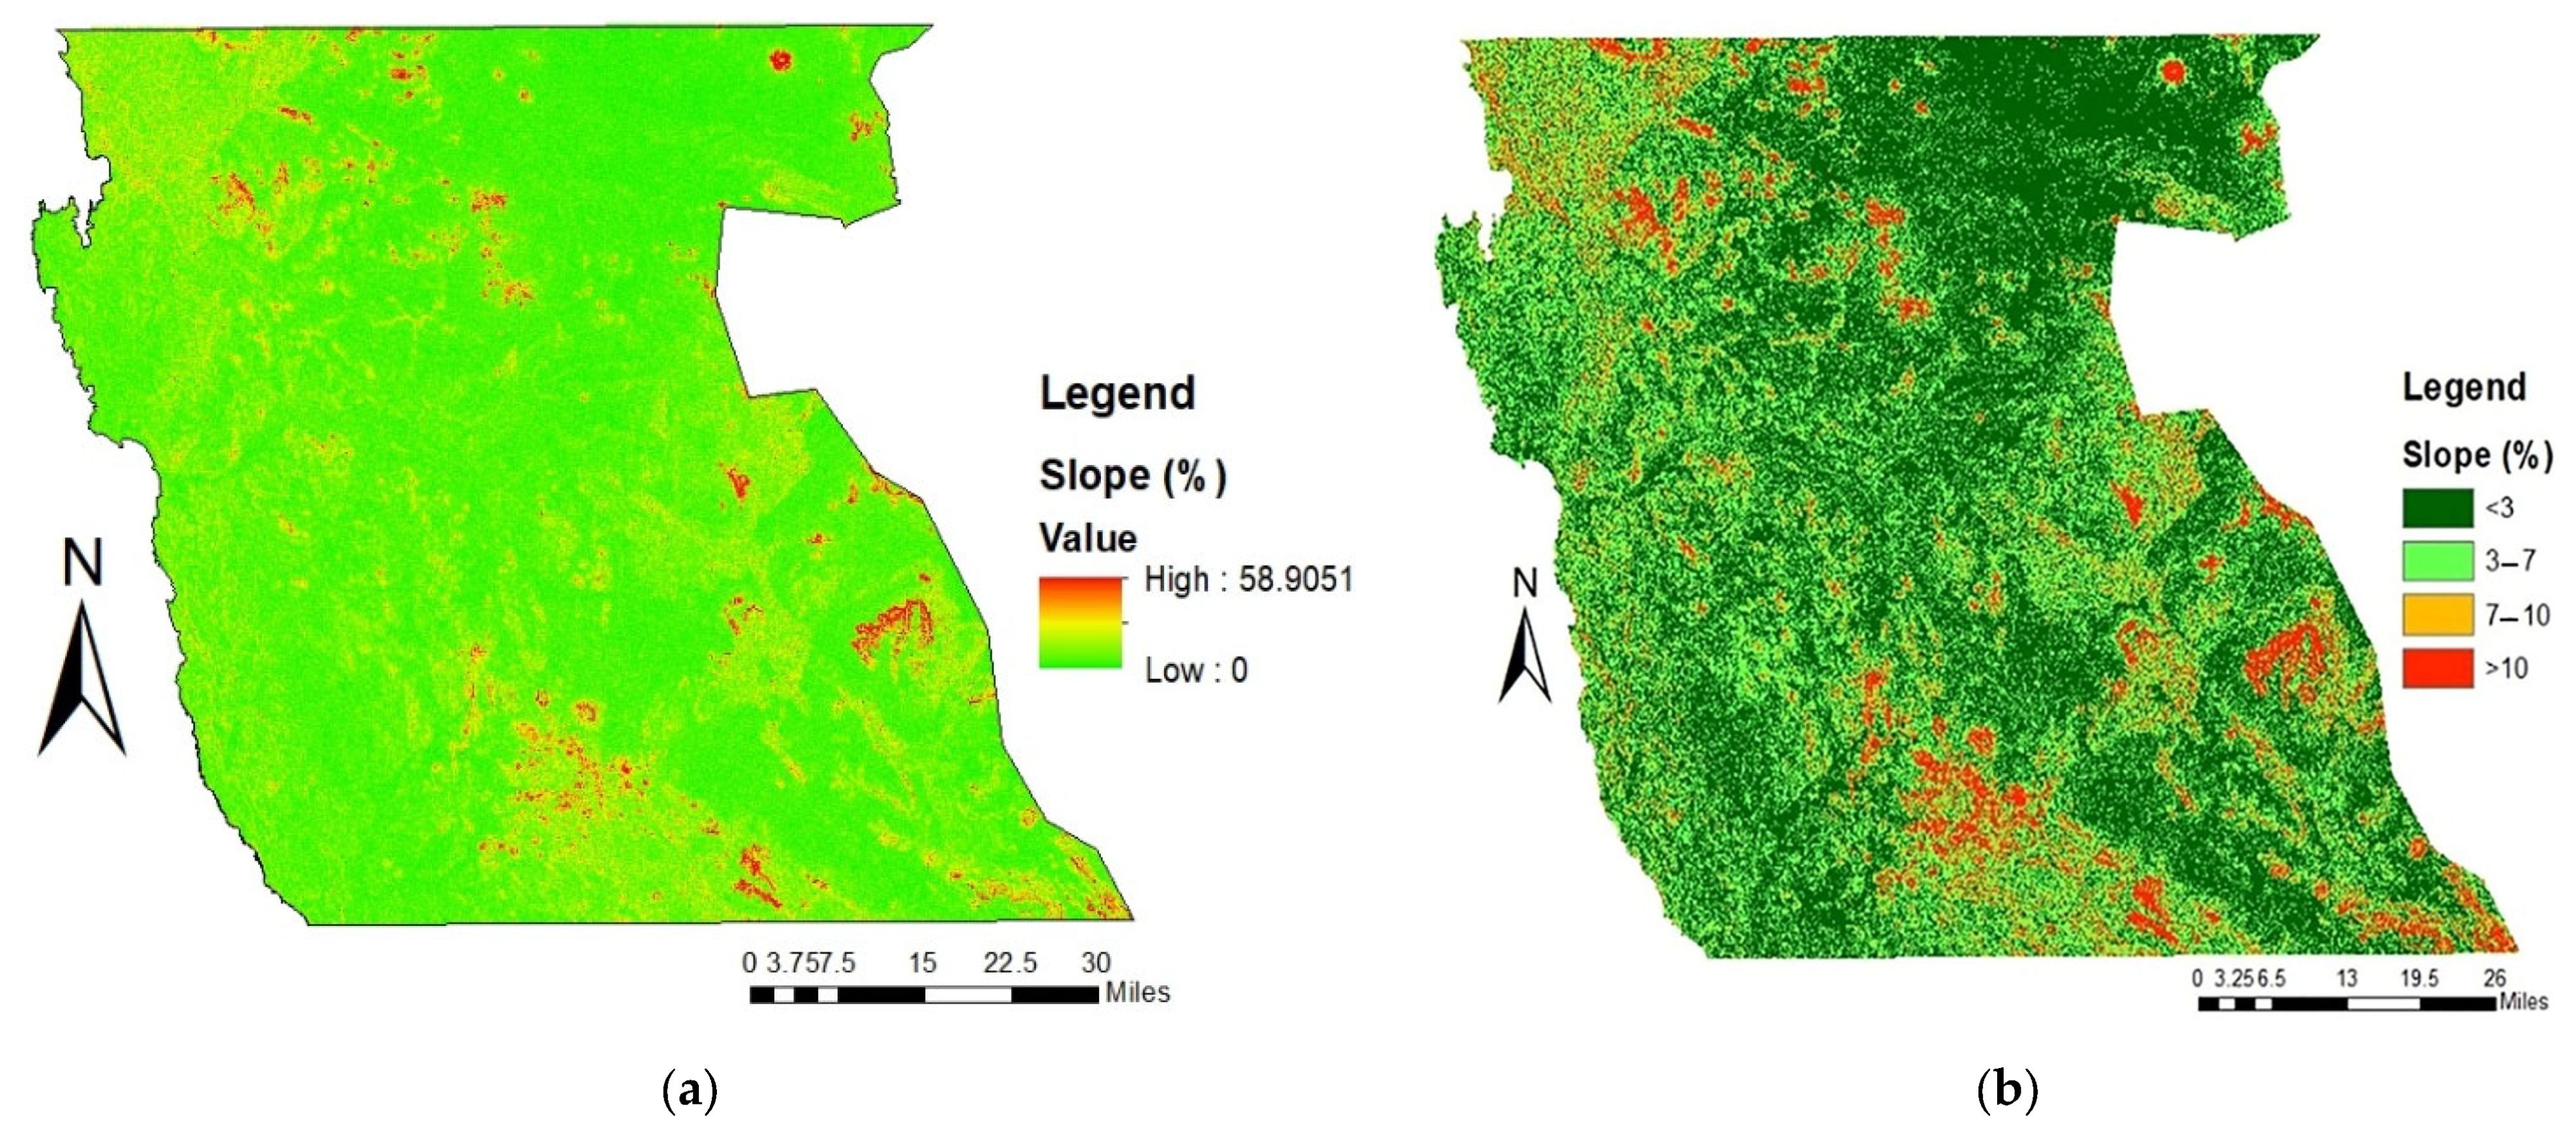
Flat terrain is desired for solar plants. In most studies, only 3–10% slope degrees have been considered to exclude very steep areas [
10]. As the slope increases to 3%, the investment cost increases gradually.
Based on the slope map above, more than 90% of the study area has good slopes, making it very suitable for solar installations. The slope orientation map is shown in
Figure 7.
2.7.5. Aspect
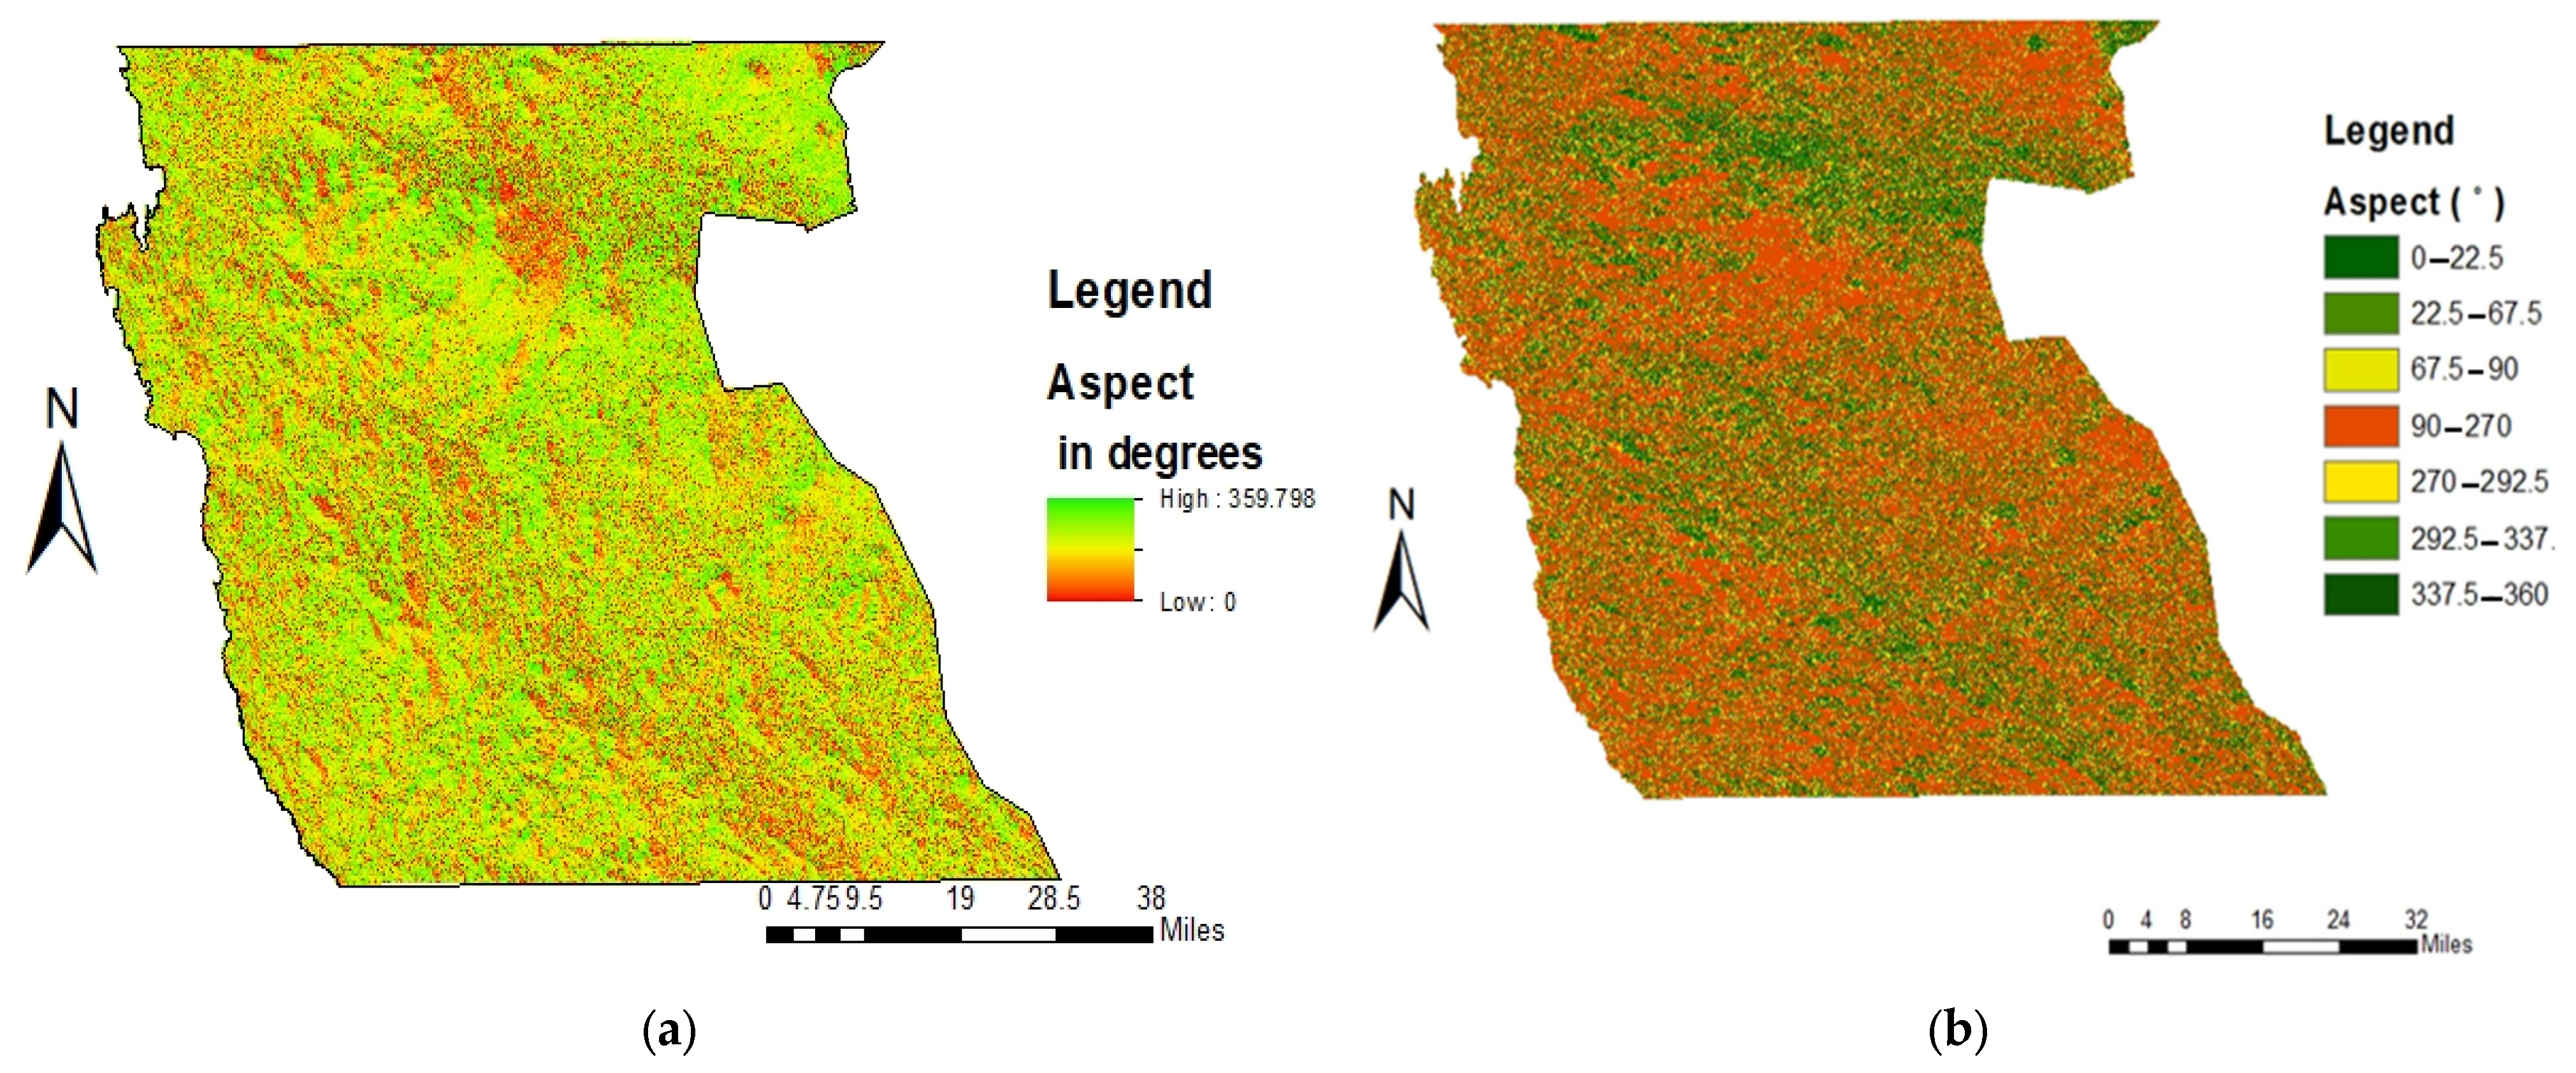
In this criterion, north-facing lands are preferred because south-facing lands are less suitable. This is due to the sun moving across the sky from east to west in Namibia, with the highest point directly north at noon. When solar panels face north, they capture sunlight throughout the day, maximizing their power output. The aspect mapping of the study area is shown in
Figure 8.
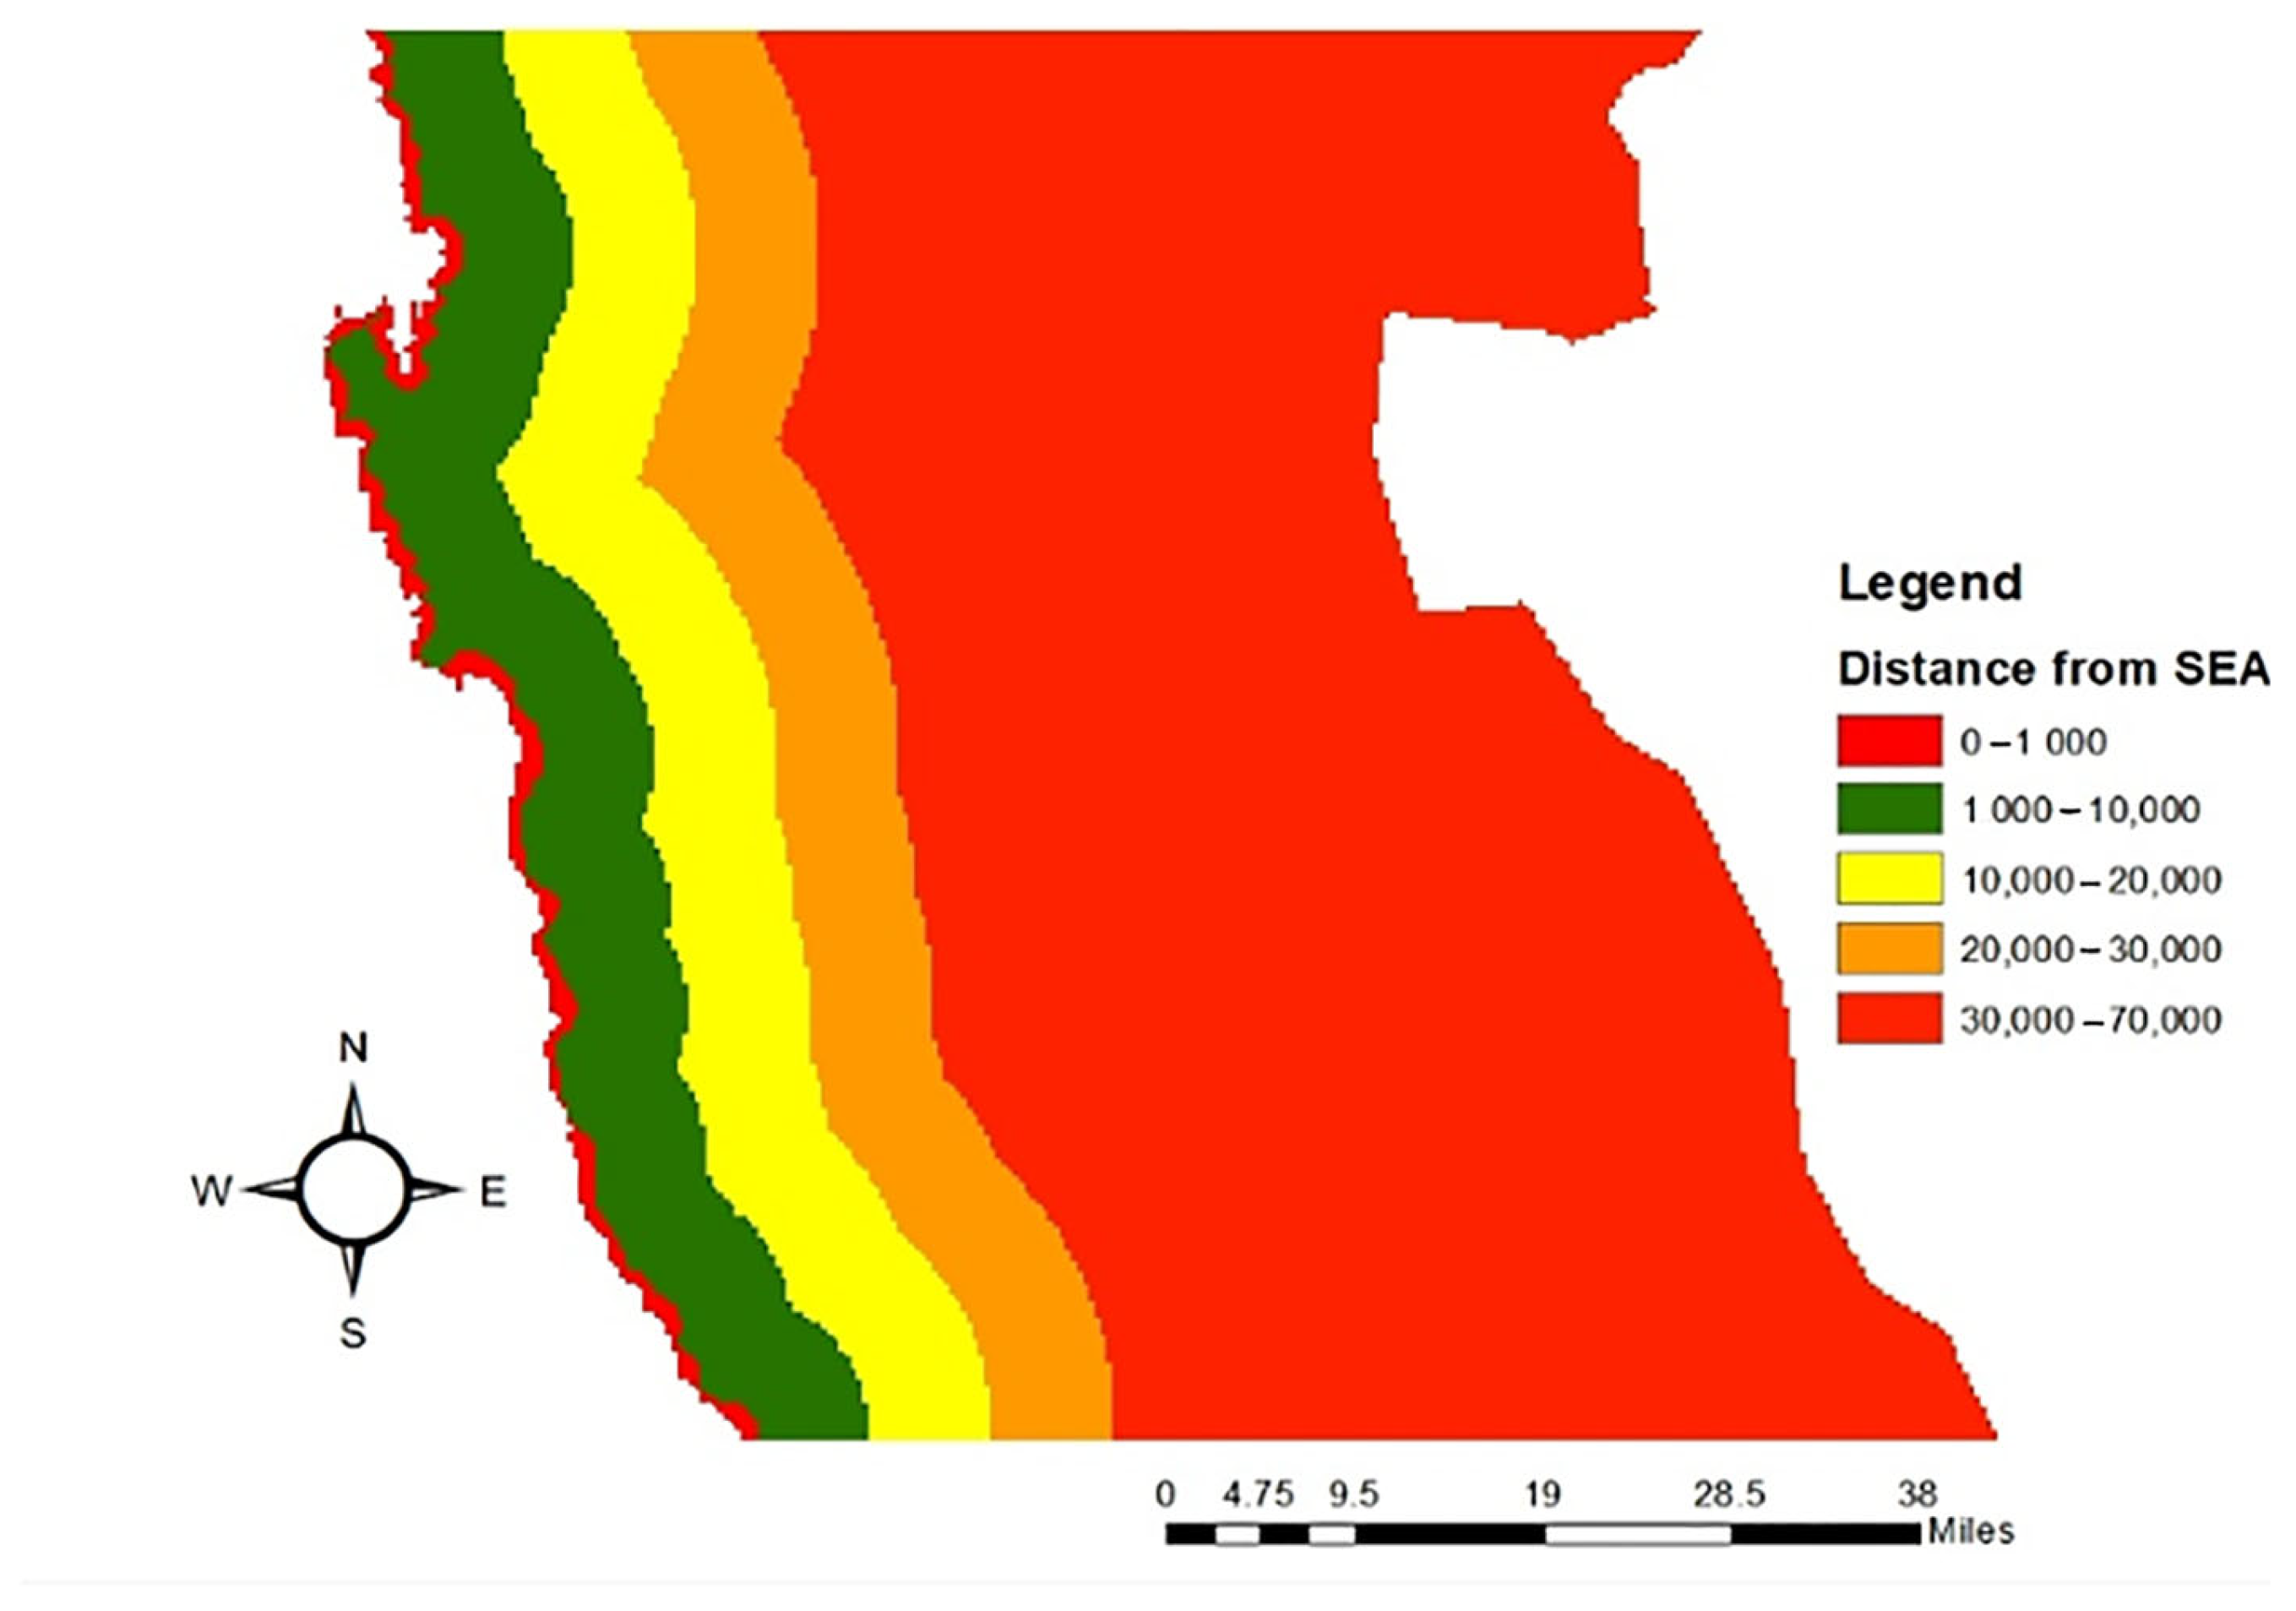
2.7.6. Proximity to Sea
Due to the renewable resources assessment in this study being carried out for green hydrogen, proximity to the sea is of vital consideration. This is to optimize the distances among the renewable energy plants, the electrolysis plant, the desalination plant, and the water source (the sea). The proximity to the sea is shown in the map in
Figure 9.
A green hydrogen plant should be situated at an optimal distance from the sea to reduce the distance to water desalination. When renewable power plants are placed close to the sea, it minimizes the power losses in transmission over long distances to desalination and electrolysis plants. Hence, locating the plant at an optimal distance from the sea is essential for operational efficiency, cost-effectiveness, and environmental sustainability.
Additionally, a green hydrogen plant needs to be in optimal proximity to the sea because the pipes carrying the produced hydrogen to seaports need to be short. This is to reduce the cost of pipes and the exposure of hydrogen to a greater range of environmental conditions as the pipe length increases.
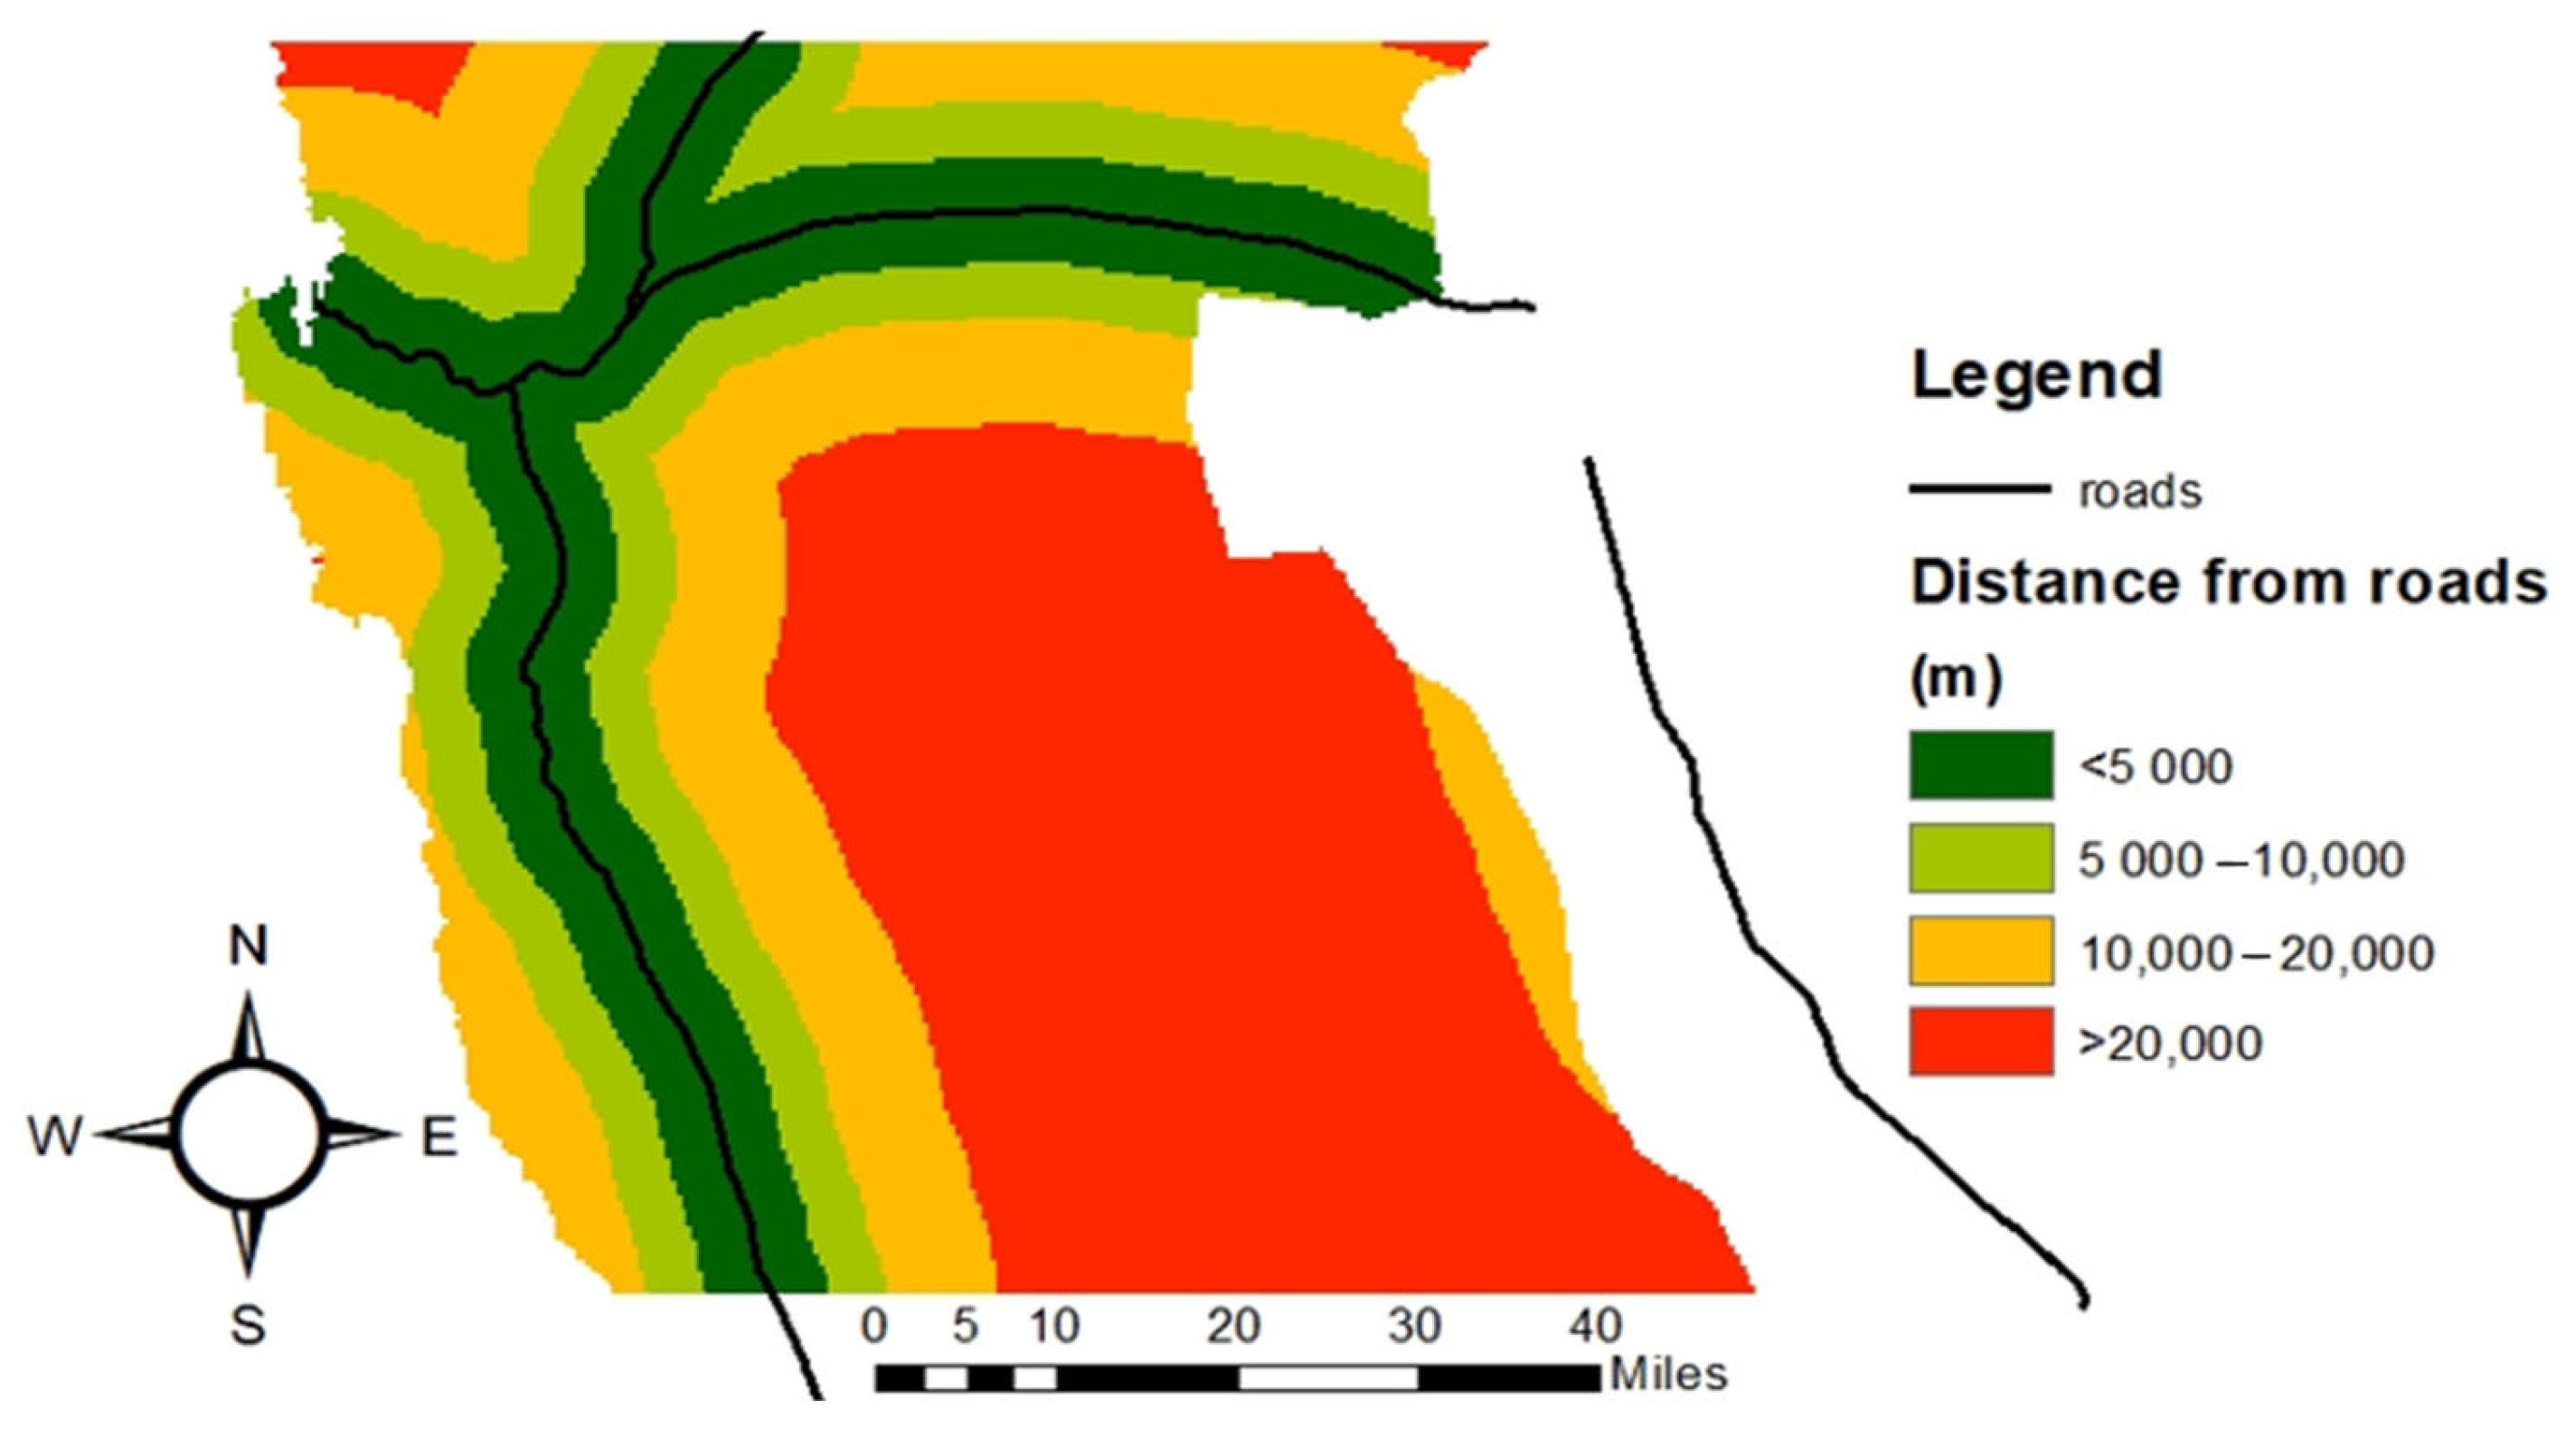
2.7.7. Proximity to Roads
Transportation costs are a dominant factor in any power plant installation. This is the case for hydrogen production plants, where hydrogen could be transported using multi-element gas container trailers, etc. Thus, areas far from roads are not economically feasible and are less suitable. Therefore, locations within 5000 m are selected as highly suitable for solar PV. Locations within 5000 m to 10,000 m are suitable, those within 10,000 m to 20,000 m are moderately suitable, and those within greater than 20,000 m are considered unsuitable (see
Figure 10).
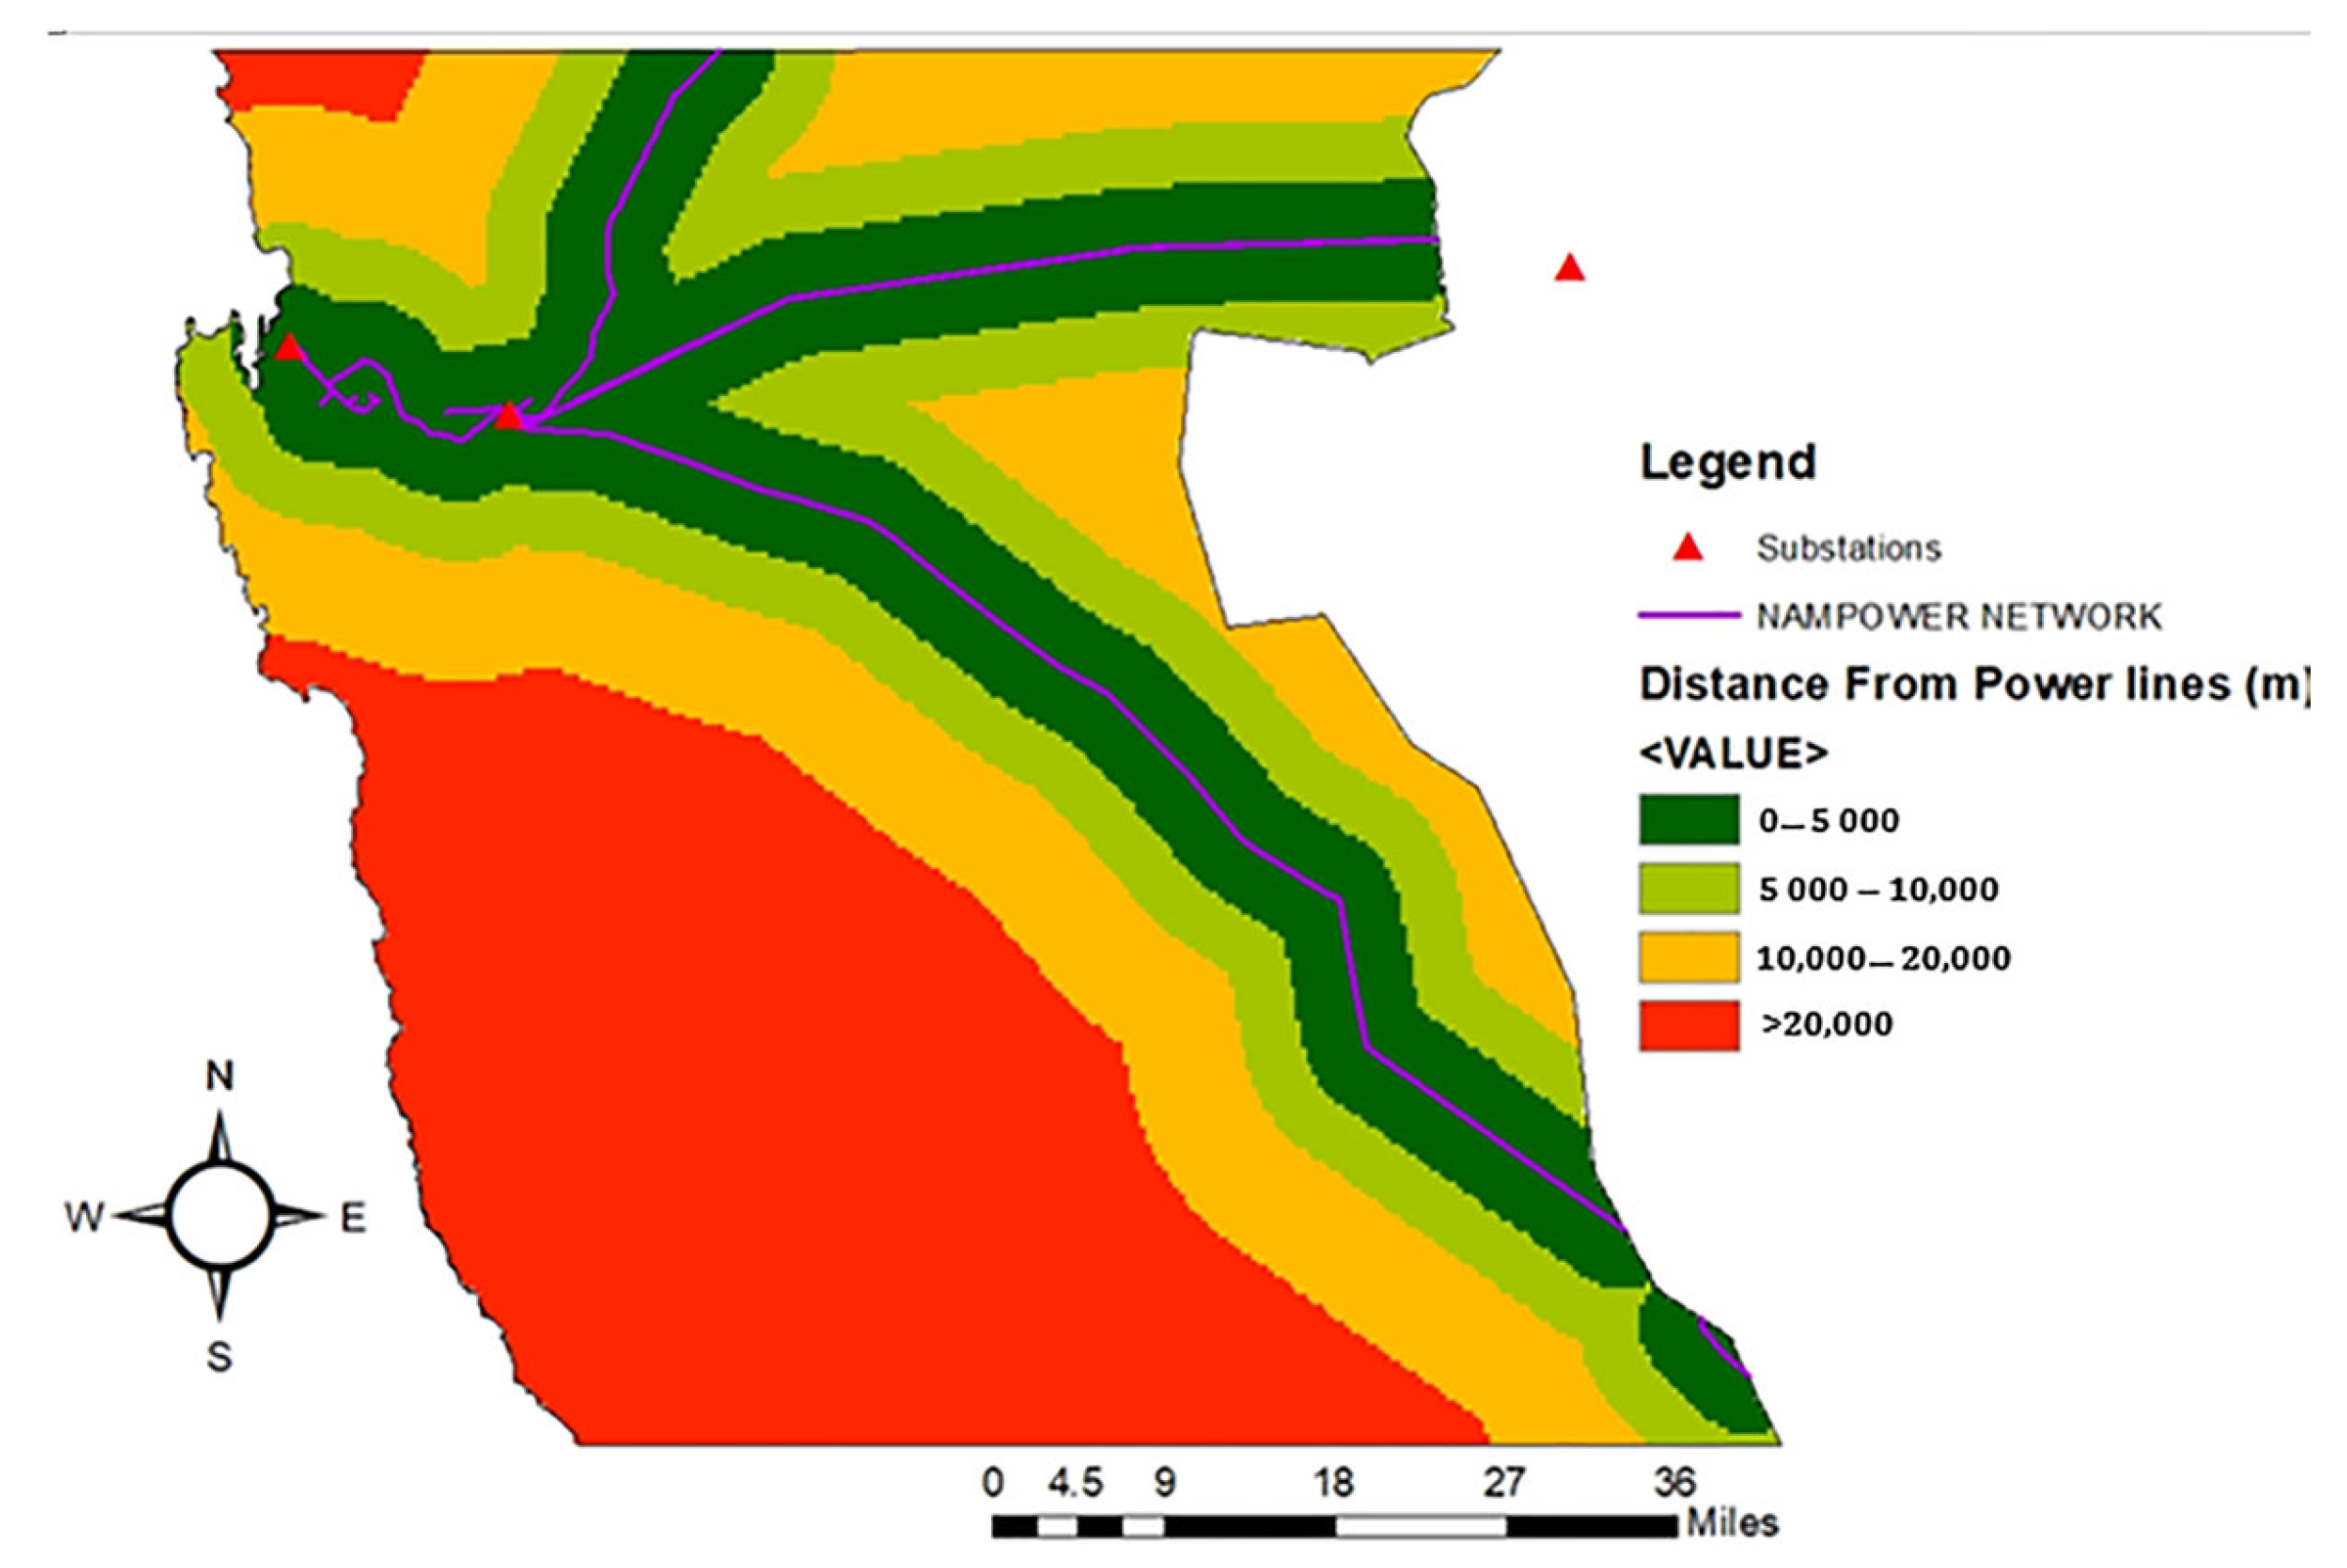
2.7.8. Proximity to Power Lines
For this study, the connection to the power line is solely to feed extra energy into the grid, not to draw energy from it. All renewable plants proposed in this study are utility-scale plants that can either connect directly to substations or tap a 69 kV or higher transmission line.
Figure 11 shows proximity analysis for power transmission lines.
2.8. Wind Power Analysis
This section analyzes site selection criteria for wind power plants. Economic criteria, common to both solar and wind, were discussed previously. Wind farm site selection criteria are classified in
Table 6 according to their suitability ranges.
2.8.1. Wind Speed
Wind resources are a key technical criterion that influence the siting of a wind farm in any location. The amount of wind energy that can be generated from a particular location is proportional to the cube of the wind speed at that location and is given by Equation (8):
where:
- -
P(v) is the average wind energy in watts (W) at a particular location,
- -
is the air density in kg/,
- -
A is the sweep area in of the rotor blades,
- -
v is the average wind speed in m/s.
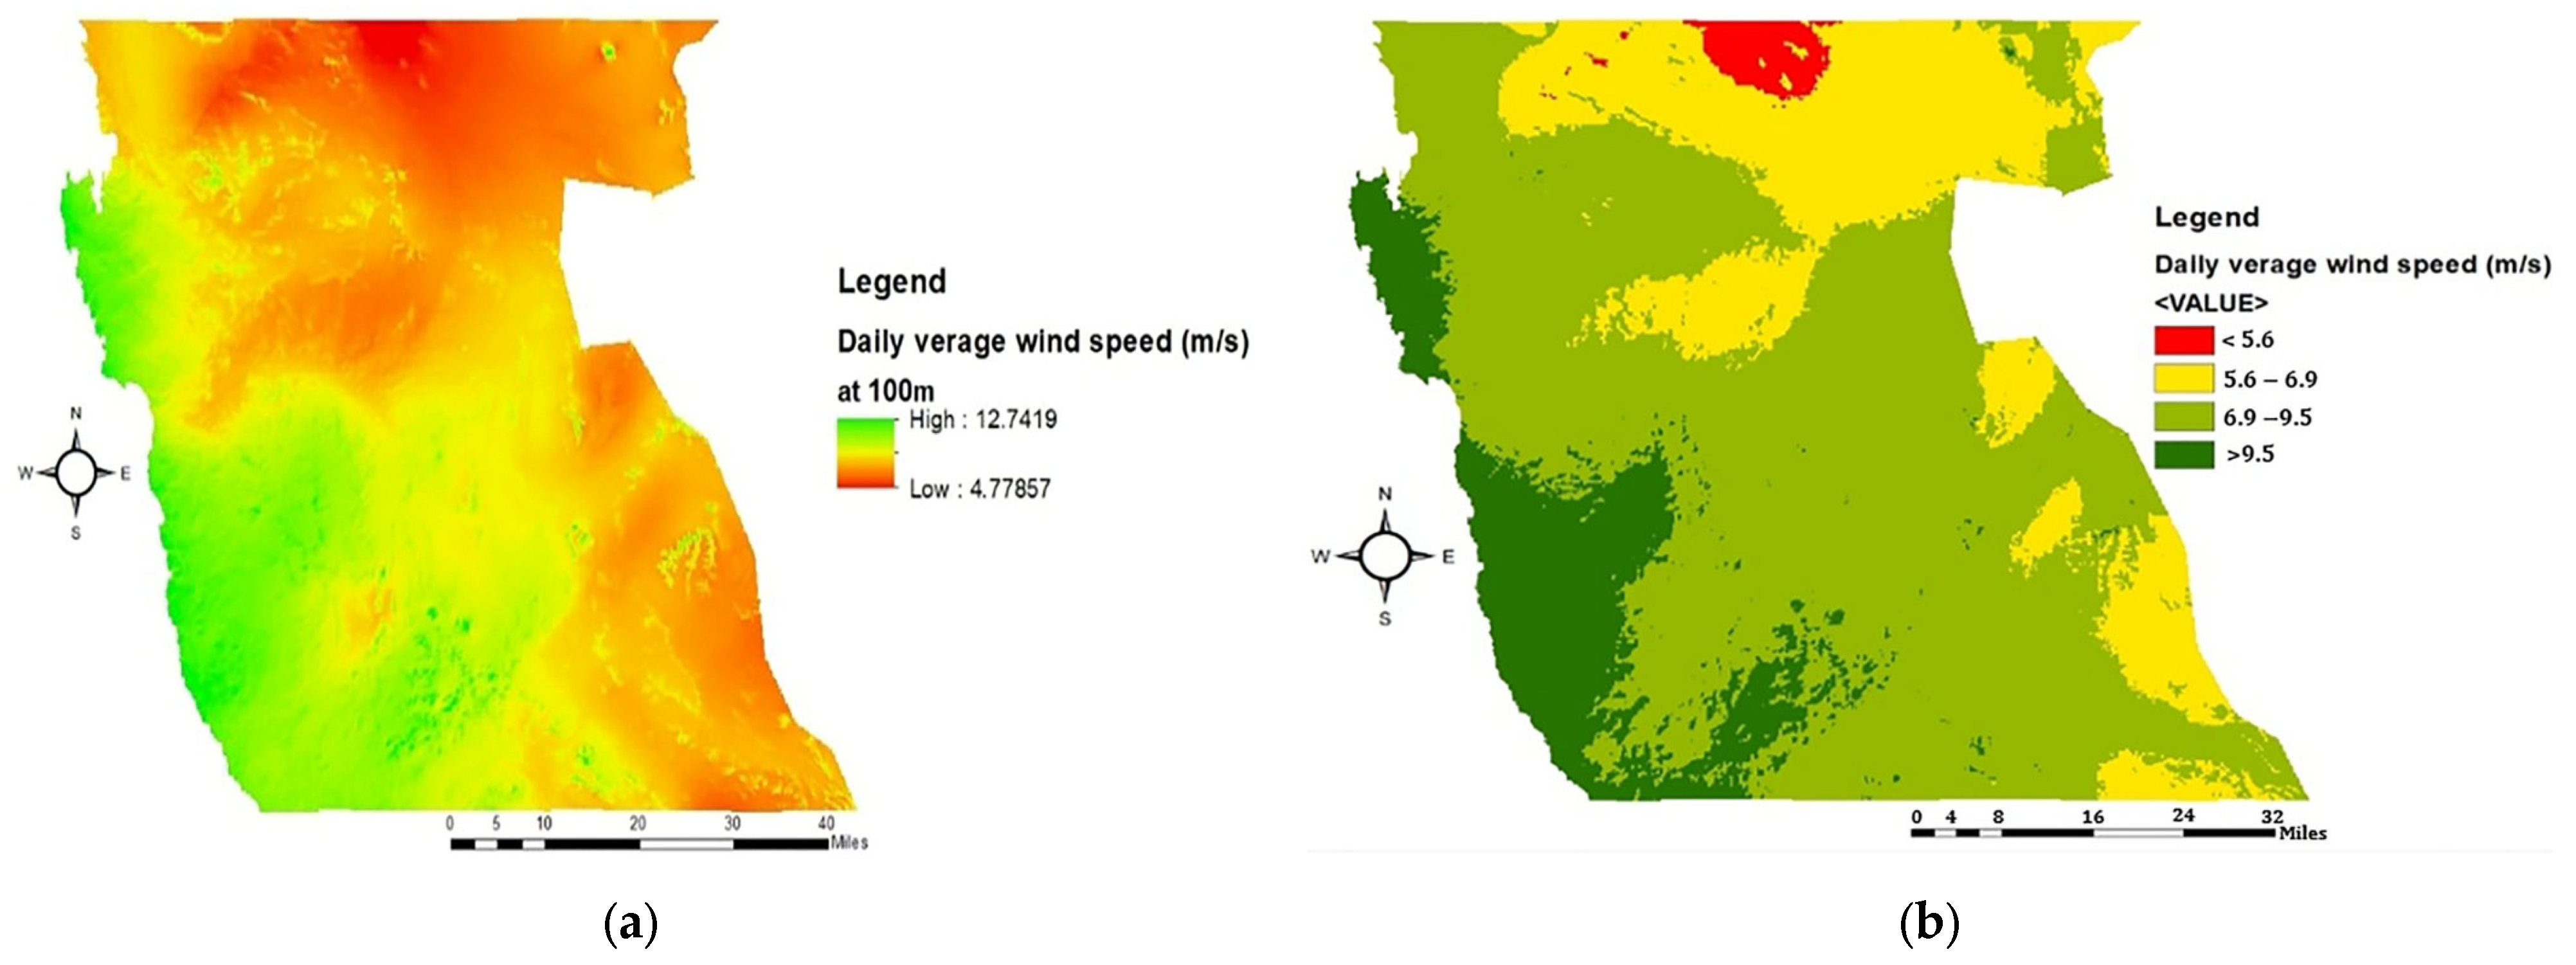
A wind data raster data file was obtained for a period of 10 years (2013–2023).
Figure 12a shows the unclassified wind speed ranges of the study area. Good wind speeds are observed as one moves close to the coastline. The ArcGIS reclassifying tool was applied to the wind speed raster data to reclassify it into four suitability classes, identifying the class each area falls into. The reclassified map is shown in
Figure 12b.
2.8.2. Slope (Wind)
Slope plays a major role in renewable energy installation. It is worth noting that the solar site selection suitability classes for slopes differ from those for wind. An increase in slope ratio decreases wind speed. When the slope ratio is less than 2.9%, the surface is highly suitable; when it exceeds 8.5%, the surface is considered unsuitable.
4. Conclusions
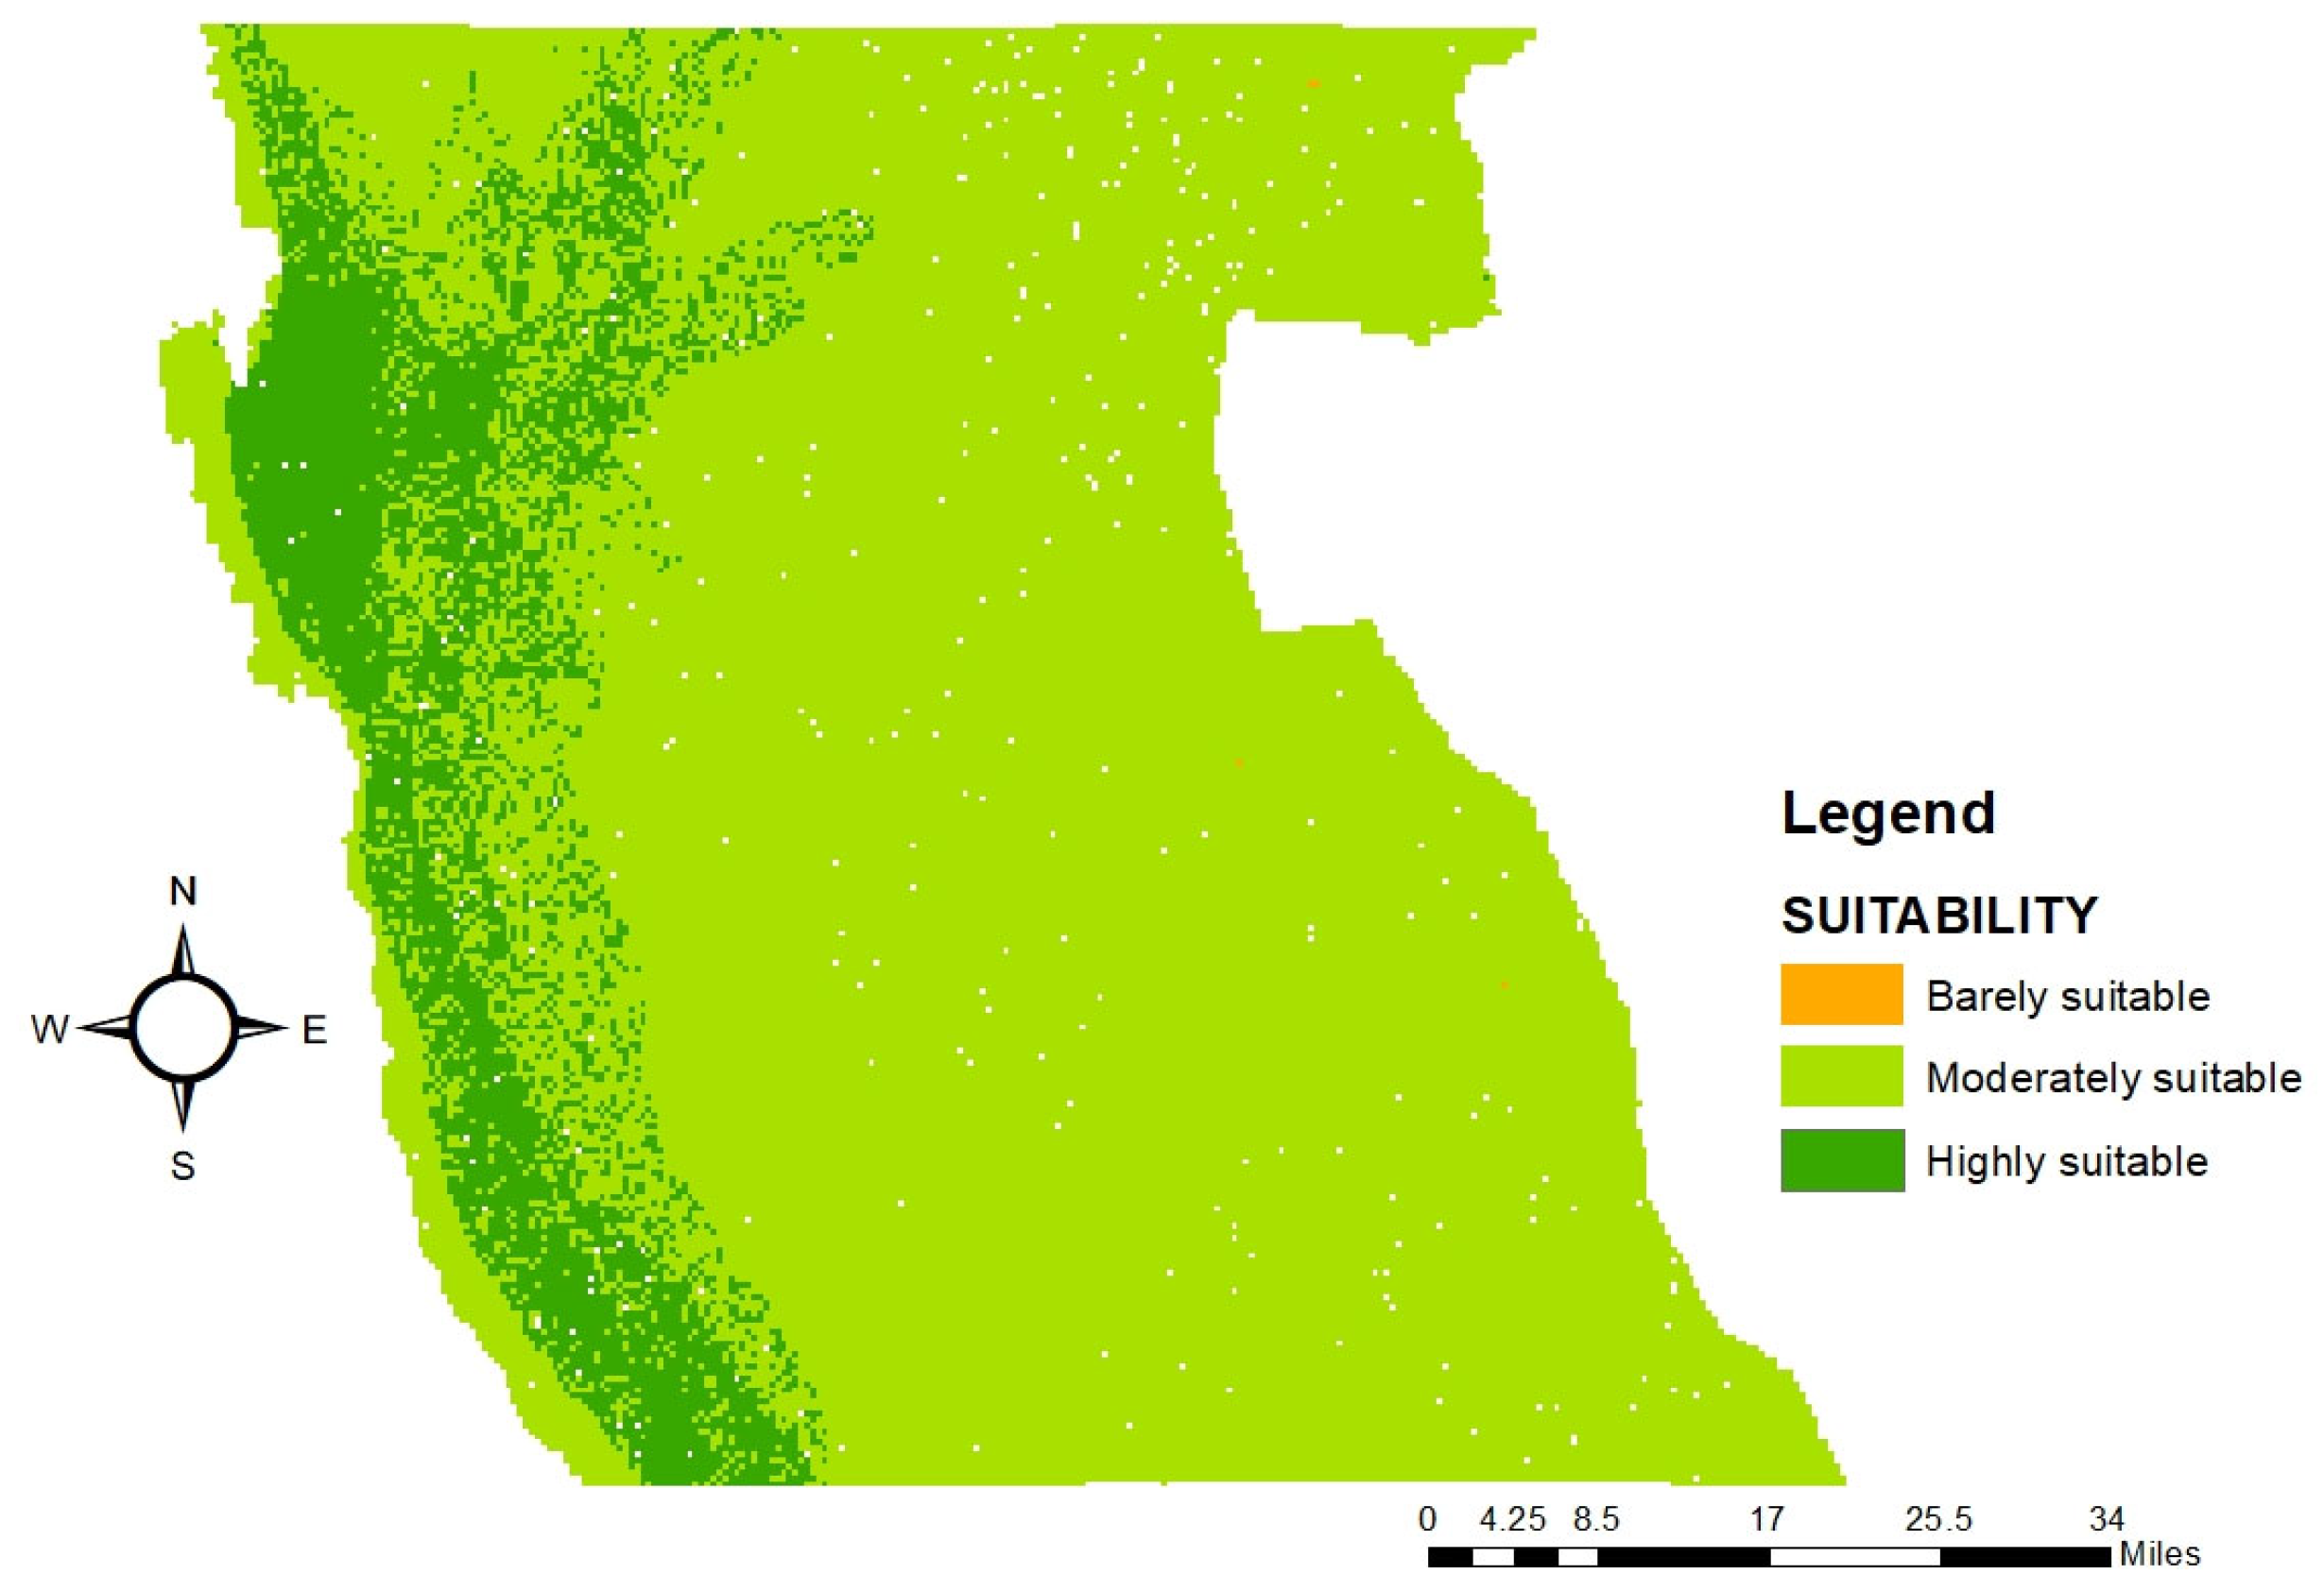
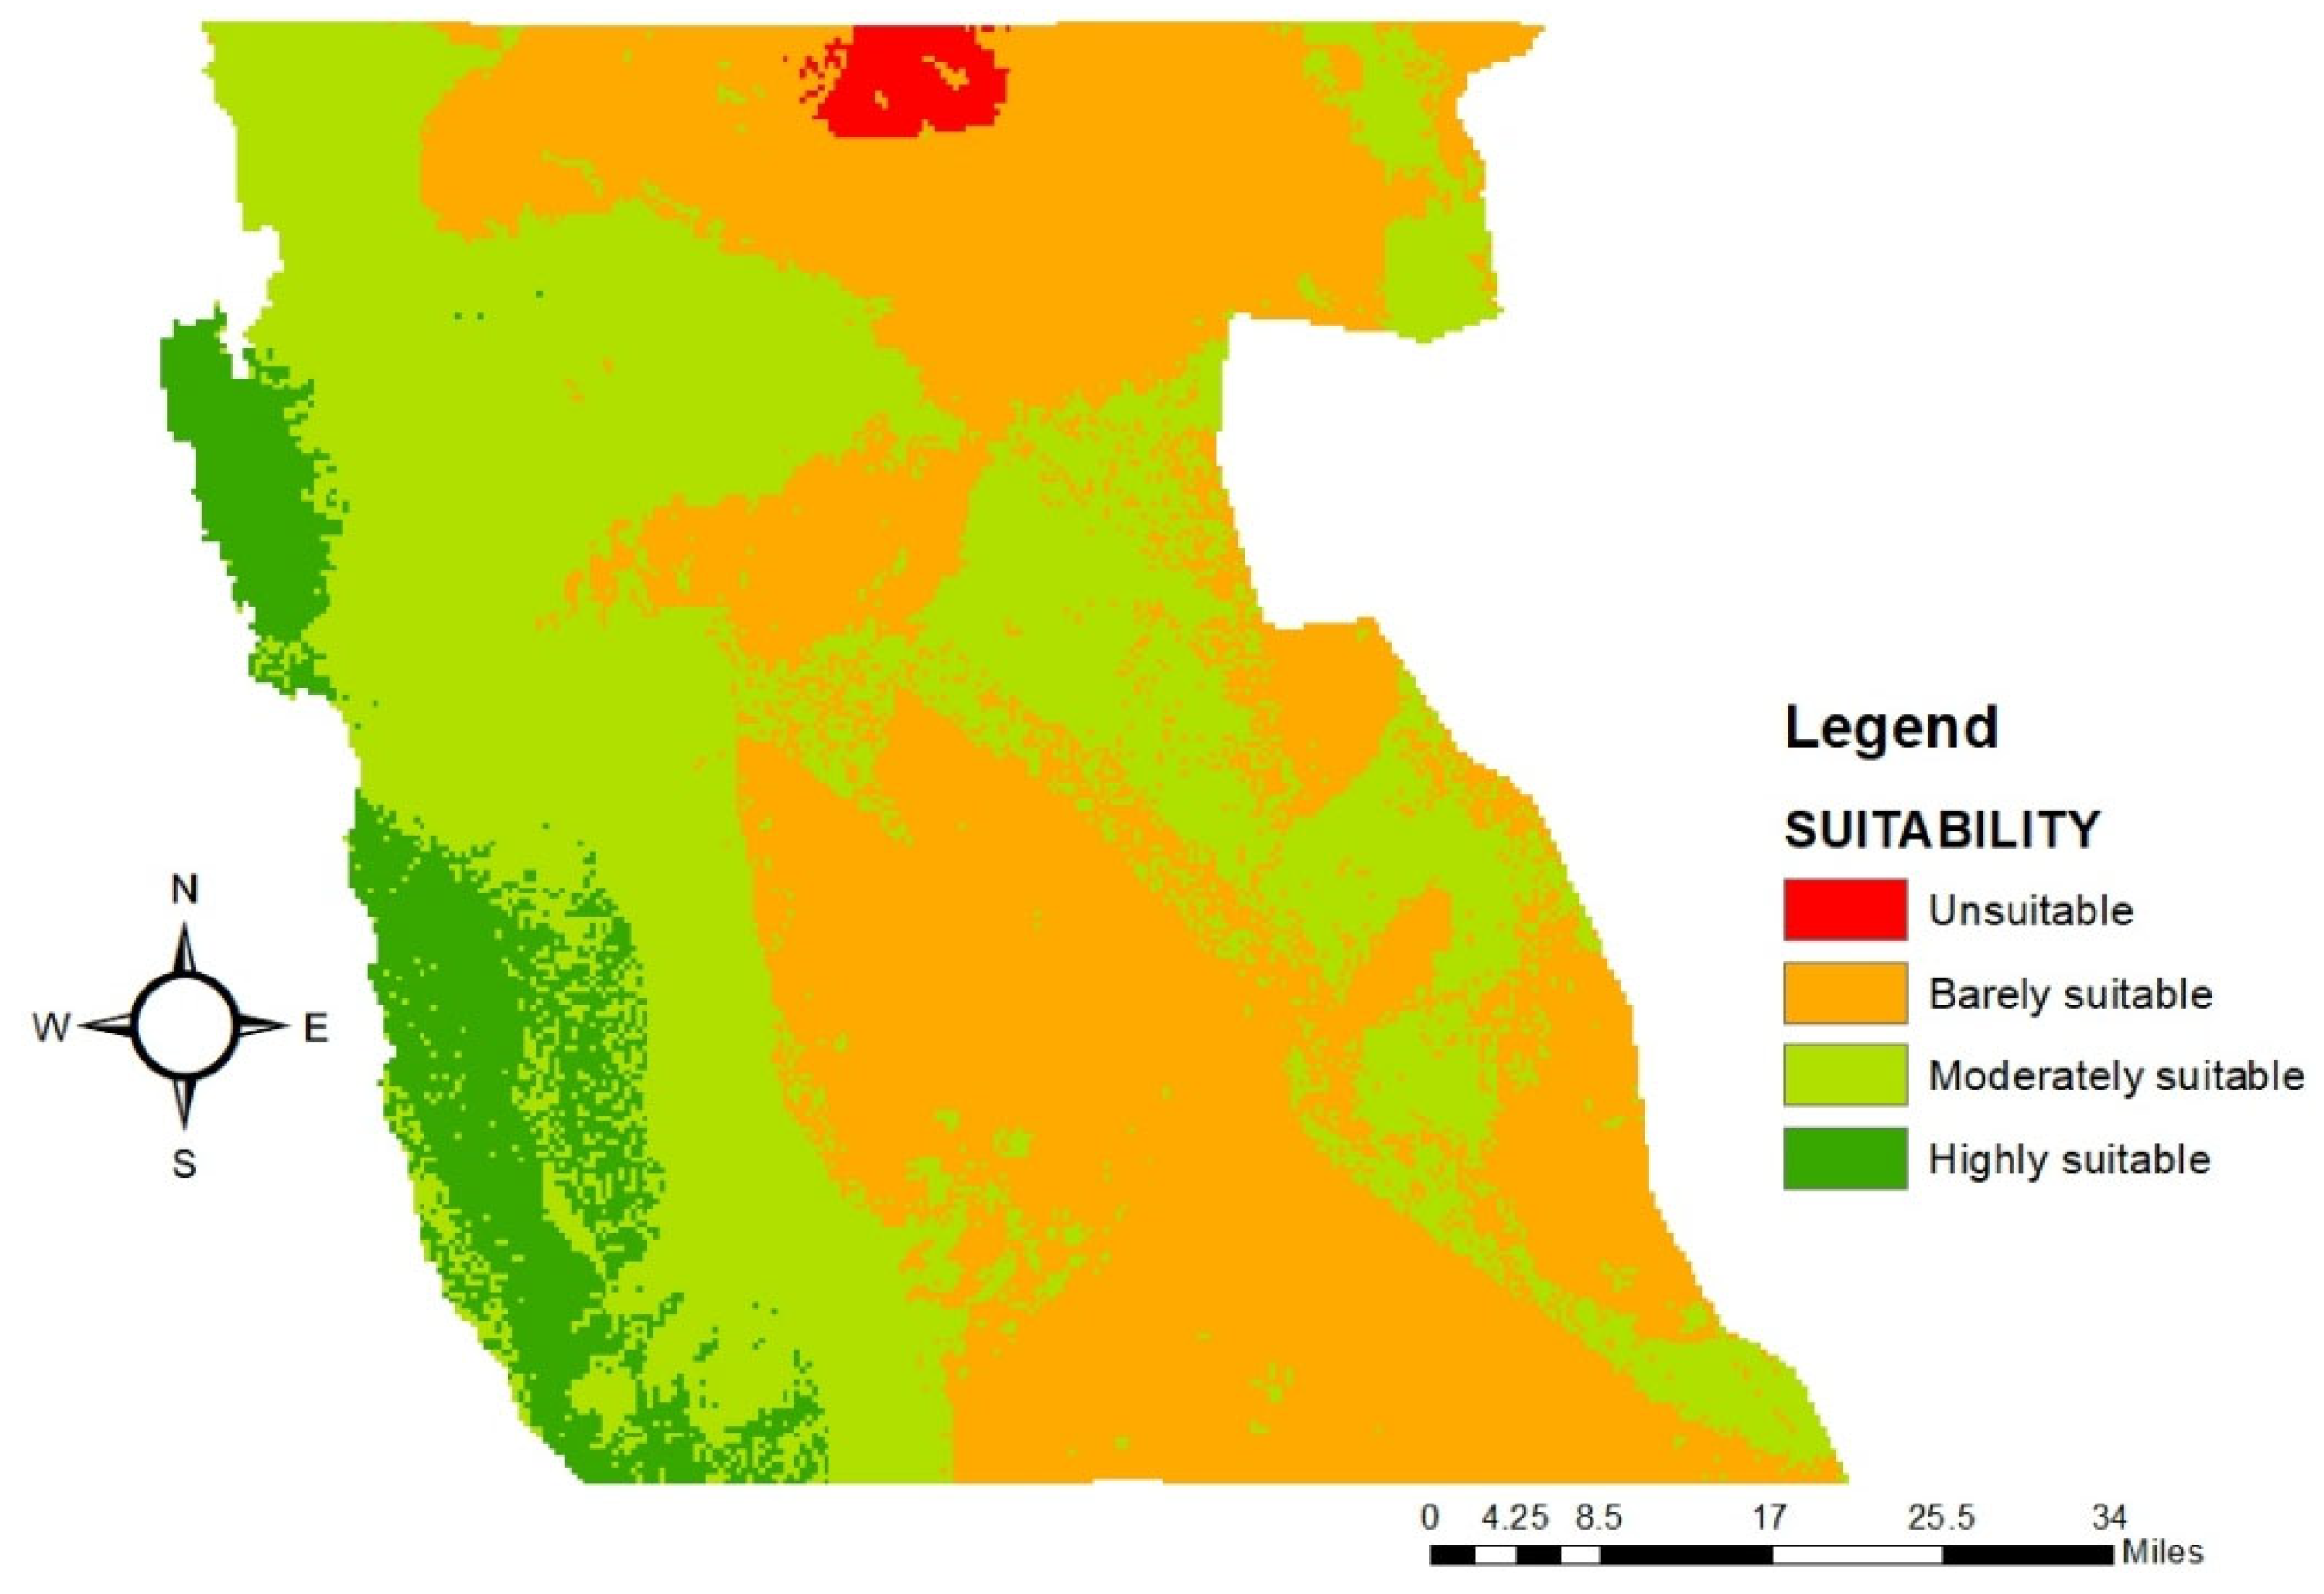
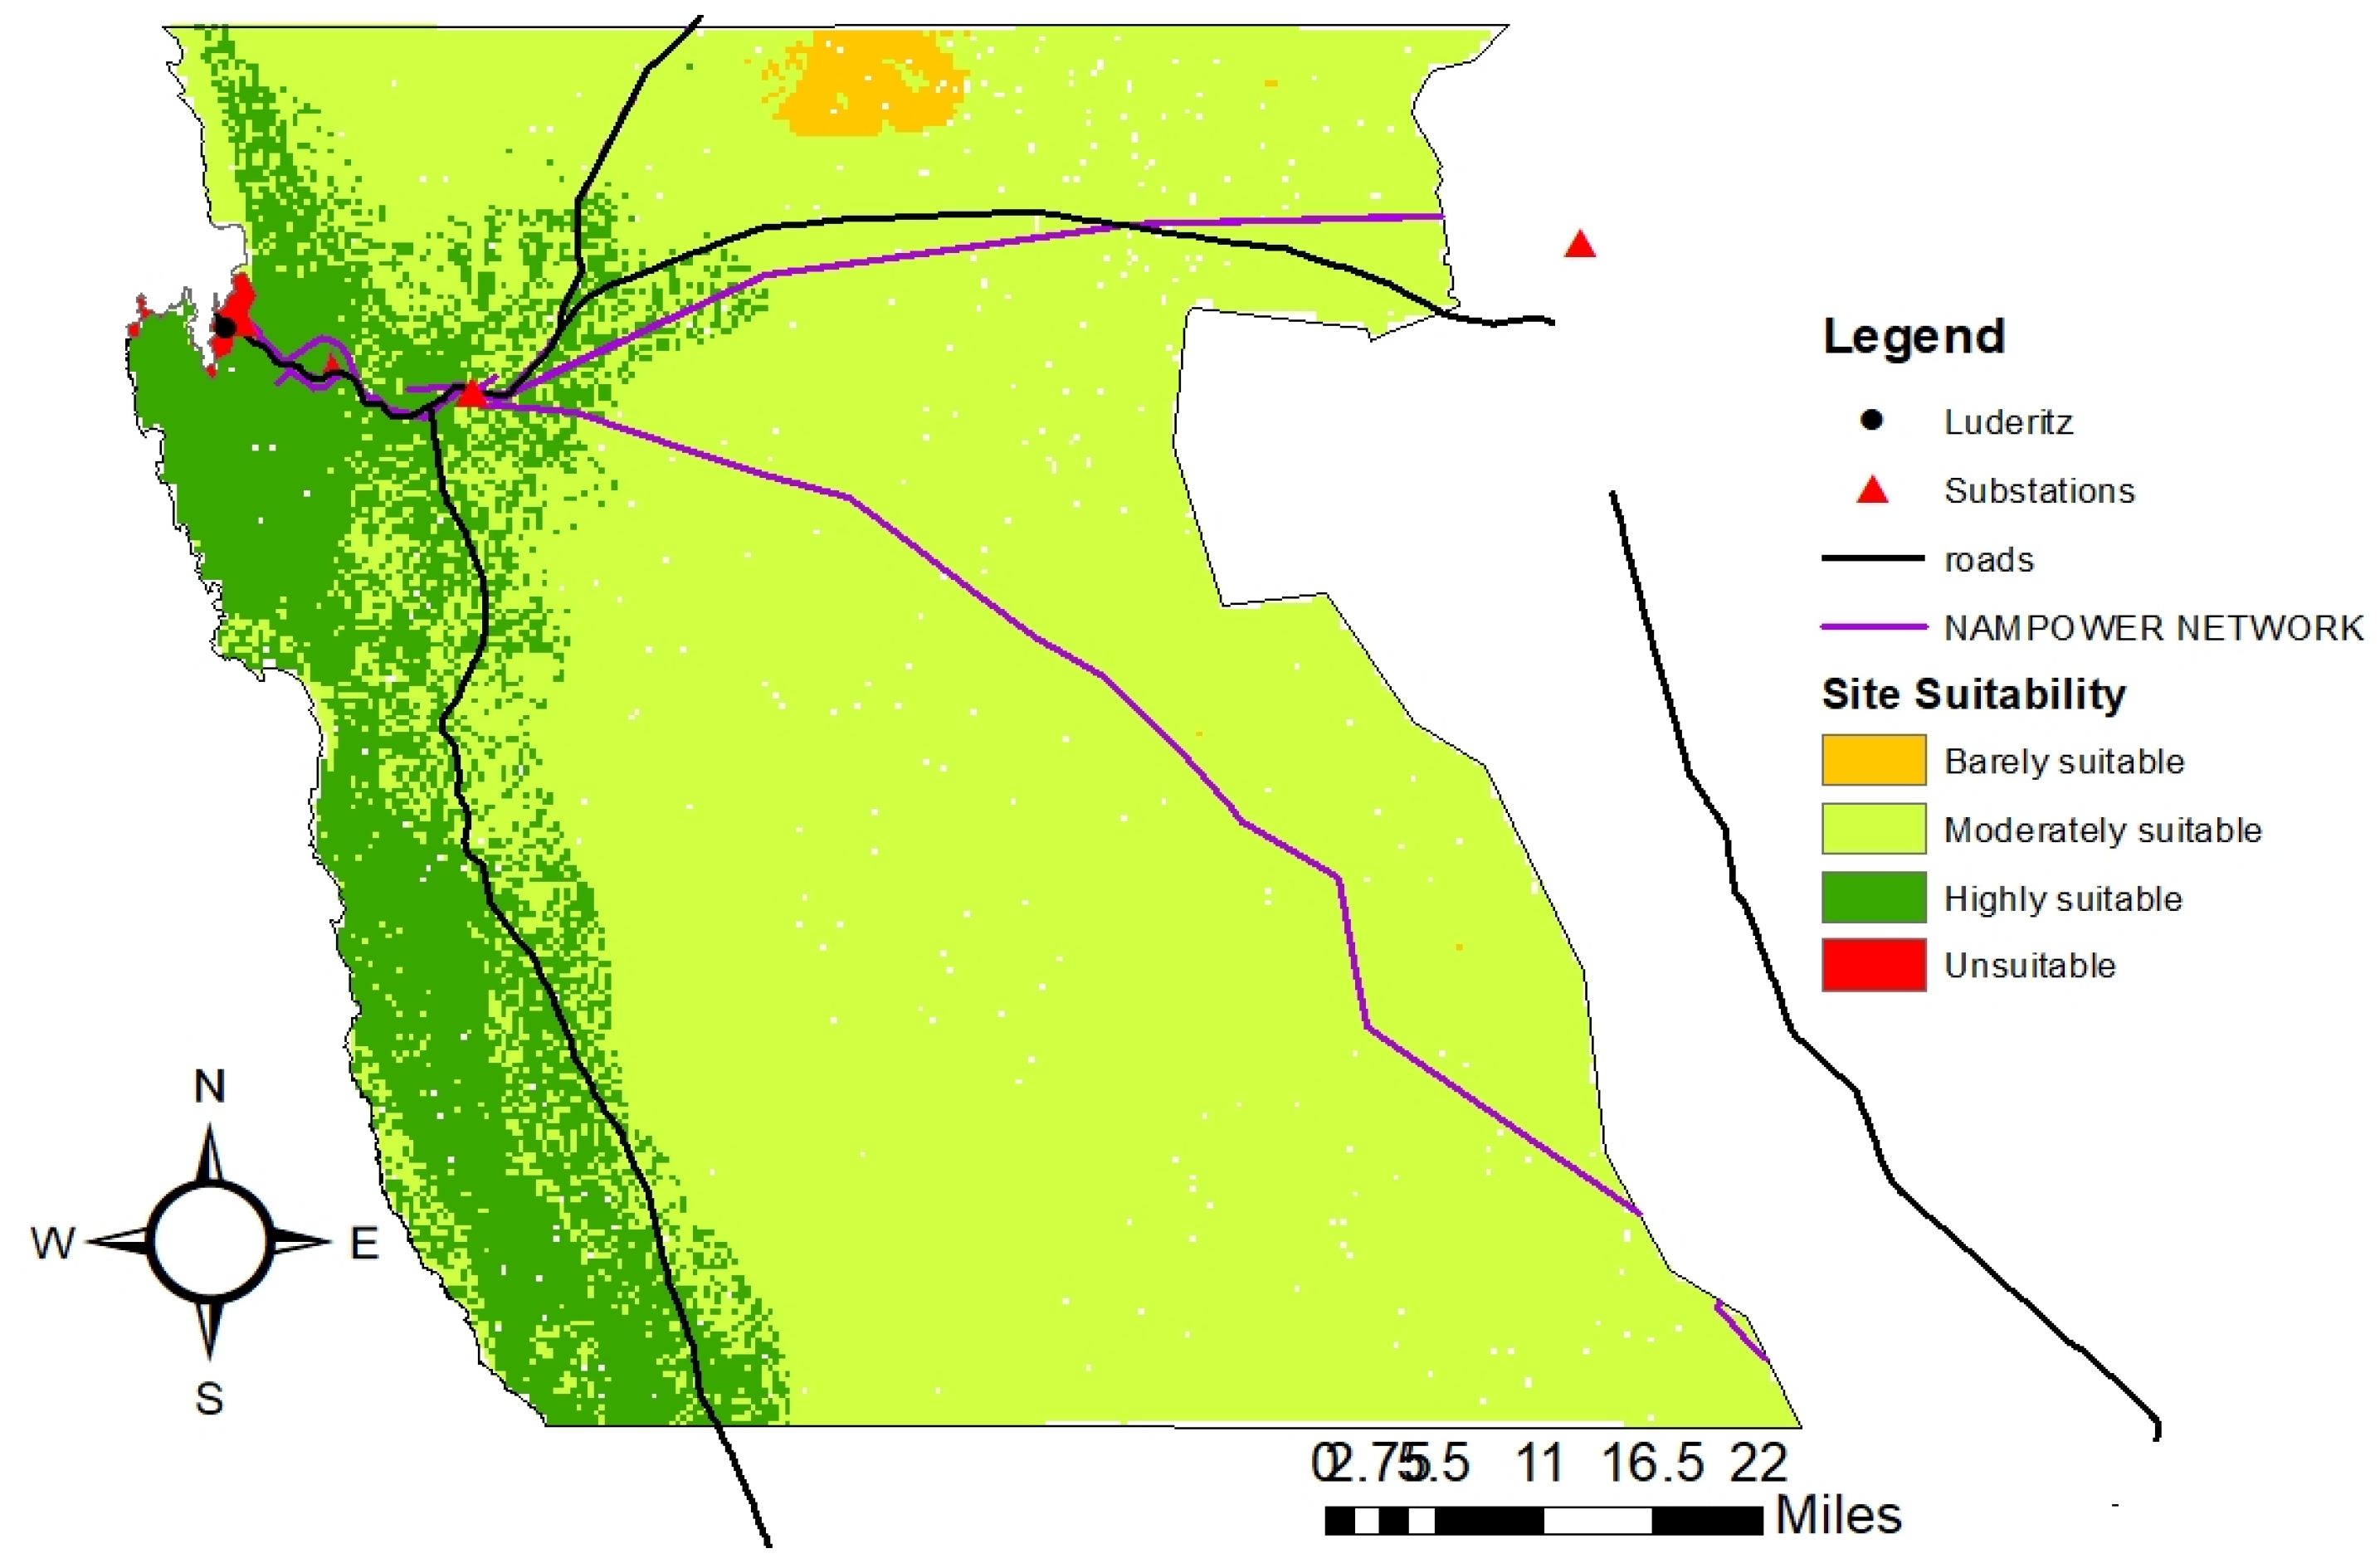
The integration of AHP and GIS for wind and solar site selection has proven highly effective. AHP’s robust framework for multi-criteria decision-making enabled a systematic evaluation of critical criteria, including wind speed, solar radiation, land use, proximity to infrastructure, and protected areas. By assigning appropriate weights to these criteria through pairwise comparisons, AHP ensures that the most relevant factors are prioritized, resulting in a comprehensive and objective assessment of potential sites. GIS complements AHP by providing advanced spatial analysis and visualization capabilities. It enabled the integration and management of diverse spatial data layers used in this study, facilitating a holistic analysis of all relevant factors. The spatial analysis tools in GIS apply weights derived from AHP to generate detailed suitability maps, categorizing areas into distinct suitability classes. In this research, the analysis of the optimized map revealed that 20% of the area is most suitable, 68% is moderately suitable, 8% is barely suitable, and 4% is unsuitable for wind and solar energy projects.
Overall, the combined use of AHP and GIS in this research has facilitated a thorough and nuanced analysis of potential sites for wind and solar energy projects. This integrated approach ensured the identification of the most viable locations, optimizing economic and technical outcomes by focusing resources on regions with the highest potential. This approach can be applied to other regions for renewable site analysis. This work contributes meaningfully to advancing Namibia’s role in the global transition toward sustainable, renewable energy solutions.