Article

Supercritical CO2 Foam Stability in the Presence of Oil

Department of Physics and Technology, University of Bergen, 5009 Bergen, Norway
*
Author to whom correspondence should be addressed.
Energies 2025, 18(23), 6227; https://doi.org/10.3390/en18236227
Submission received: 13 October 2025 / Revised: 3 November 2025 / Accepted: 14 November 2025 / Published: 27 November 2025
(This article belongs to the Special Issue CO2 Capture, Utilization and Storage)

Abstract

Foam is a field-proven technique to reduce CO2 mobility and mitigate the impacts of reservoir heterogeneity in CO2-enhanced oil recovery (CO2-EOR). However, foams are unstable and tend to break down in the presence of oil. Screening foam generation and stability in the presence of oil, at representative reservoir pressure and temperature, at core-scale is critical for successful upscaling. This study investigates the effect of oil on foam generation and stability across a range of foam qualities (fg = 0.30 to 1.0) and injection velocities (4 ft/day to 16 ft/day). Foam quality and rate scans using Bentheimer sandstone cores were conducted in presence/absence of oil (n-decane and Troll crude) at reservoir conditions (60 °C and 180 bar). Foam quality scans co-injected supercritical CO2 and foaming solutions with increasing foam quality (fg = 0.30 to 1.0) to determine the optimal foam quality (highest apparent viscosity foam). T optimal foam quality was then used in rate scans to determine the effect of injection velocity on foam strength. In addition, two separate core floods at two fixed foam qualities (fg = 0.30 and 0.70) were performed to determine the oil recovery factor during foam injection. Strong foam was generated, in both the presence and absence of oil, but oil significantly reduced foam strength. The foam apparent viscosity was reduced by ~93% (Troll crude) and ~90% (n-decane) compared to foam in the absence of oil. Increasing the surfactant concentration from 0.10 wt.% to 1.0 wt.% significantly enhanced the foam mobility control, with the apparent viscosity in the presence of oil increasing from 7.9 cP to 25.9 cP. The optimal foam quality in the presence of both oils ranged from fg = 0.60 to 0.70. Foam rate scans revealed shear-thinning rheology (foam viscosity decreased at higher flow rates), which is beneficial for maintaining field-scale injectivity. This study provides critical insights into how oil impacts supercritical CO2 foam strength, stability mechanisms, and oil recovery at reservoir conditions, crucial for field-scale implementation in CO2-EOR and CO2 storage projects.

1. Introduction

Carbon capture, utilization, and storage (CCUS) is crucial for reducing anthropogenic CO2 emissions during the energy transition [1,2,3,4]. In CCUS, CO2 is captured at an industrial point source, transported to a storage site, and injected into a geological formation for permanent storage or oil recovery. CO2-enhanced oil recovery (EOR) is an effective method to increase oil recovery while simultaneously sequestering CO2. CO2 is an excellent solvent in EOR processes because it is miscible with many crude oils at reservoir conditions [5]. Above the minimum miscibility pressure (MMP), CO2 can dissolve in and swell the oil, reducing its viscosity and increasing recovery [6]. Despite the success of CO2-EOR, a significant portion of the oil can remain unrecovered due to poor reservoir sweep efficiency. The low viscosity of supercritical CO2 leads to an unfavorable mobility ratio, due to the higher viscosity of oil and water, resulting in viscous fingering with early gas breakthrough [7]. In addition, the low density of CO2 causes gravity override, reducing oil recovery in lower parts of the reservoir [5]. Both issues contribute to poor sweep efficiency and costly CO2 recycling. The success of CO2-EOR and CO2 storage processes, particularly in heterogenous reservoirs, depends on reducing CO2 mobility in the reservoir.
Foam is a field-proven technology that increases CO2 sweep efficiency by effectively reducing CO2 mobility [8,9,10]. Mobility control foam can divert CO2 from high permeability zones to lower permeability zones, contacting more areas of the reservoir and displacing fluids more effectively [11,12,13]. Foam is defined as a dispersion of gas in a liquid phase separated by a thin continuous liquid film called lamellae [14]. Foam can be generated by either co-injection or by alternating slug injection of CO2 and foaming solution. All foams are thermodynamically unstable, but can be stabilized by amphiphilic compounds, such as surfactants [15]. Surfactants are categorized based upon their electrostatic charge (anionic, non-ionic, cationic, and zwitterionic). Surfactants are screened on reservoir rock and selected based on their stability at reservoir conditions. In the laboratory, surfactant adsorption tests are completed to ensure minimal adsorption to the rock surface. In addition, chemical stability, the surfactant concentration on foam strength, foam quality, and rate scans are conducted.
In EOR processes, surfactants have been used to lower interfacial tension between water and oil [16] and alter the wettability of fractured surfaces in oil-wet reservoirs [17]. Such wettability alteration may create a less favorable environment for CO2 foam, or in some cases a more favorable one, depending on the direction of the wettability shift. The process of altering wettability is dependent on temperature, salinity, pH, and charge of chemical. Wettability affects fluid distribution in the porous media, and interfacial properties of crude oil can contribute to alter wettability of the rock surface [18,19]. Wettability is known to affect foam strength. Reference [20] reported that strong foams are not expected to be stable in porous media that are less water-wet (intermediate-wet or oil-wet systems). Recognizing these complexities and understanding CO2 foam generation and stability at reservoir conditions is crucial for successful field scale implementation.
Foam quality and rate scans reveal important information on foam flow regimes, helping to identify the optimal foam quality and injection velocities while providing input into numerical models. Foam flow exists in two distinct regimes: low-quality (wet) regime and high-quality (dry) regime [20]. In the low-quality regime, apparent viscosity increases with increasing foam quality and gas is added to the predominantly liquid flow. The opposite is reported for the high-quality regime, where apparent viscosity decreases with increasing foam quality, where the liquid films may become too thin [21,22]. The optimal foam quality is the highest apparent viscosity foam and is also the transition from the low-quality to high-quality regime as determined by a foam quality scan.
For mobility control foam to be successful, foam generation must occur faster than the rate of coalescence. The stability of foam in porous media can be reduced by high temperature, high pressure, the presence of oil, low surfactant concentrations, and high salinities [7,23,24,25,26,27].
Interactions between foam and oil are complex, and the presence of oil can have a detrimental effect on foam [28,29]. In the presence of oil, foam is generally less effective at reducing CO2 mobility than it is without residual oil [30,31]. The polar components in oil can partition at the gas–liquid interface, displacing surfactant and destabilizing the lamellae [32]. With less surfactant at the interface, the local surface tension in lamellae is not sufficiently reduced and the thin film can rupture. The type of crude oil is significant, because lighter oils often destabilize foam more (due to their composition) than heavier oils. AlYousef, Gizzatov [33] reported reduced foam stability and strength at crude oil concentrations as low as 5%. Oil has been described as an antifoaming agent, where the oil enters the lamellae and destabilizes them, causing film rupture and coalescence [34,35]. The detrimental effects from oil on foam result in overall lower foam viscosity and therefore weaker foam [36]. Formation of oil–water macroemulsions can tie up surfactant at the oil/water interface, effectively reducing foam stability [32]. Furthermore, the presence of polar components from crude oil can alter the wettability on the pore walls of the reservoir rock [37,38,39].
Despite the promising results of foam for CO2 mobility control, most laboratory studies have examined gaseous-phase foam in the absence of oil. These studies were often conducted under conditions that do not reflect the high pressure and temperature typical of subsurface reservoirs, where CO2 is in supercritical state. Consequently, existing foam models lack data on key interactions between foam, oil and reservoir rock under reservoir conditions. This study addresses these gaps by evaluating supercritical CO2 foam performance in the presence of oil, at a high pressure and temperature.
Modeling efforts are dependent on deriving input parameters from steady-state foam-quality and rate scans [38,39]. However, existing datasets have limited critical details relevant to supercritical CO2, high pressure, high temperature, and systems containing oil. New experimental data obtained with oil present advances to our fundamental understanding of supercritical CO2 foams and improves field-scale foam modeling.
In this study, we present a core-flood experimental study of CO2 foam, stabilized by a nonionic surfactant, under reservoir conditions in the presence of oil. We conduct experiments at a high pressure (180 bar) and temperature (60 °C) to ensure that CO2 is supercritical. These conditions reflect in situ phase behavior and provide realistic solvent power and density for oil swelling. Foam quality and rate scans were performed in homogeneous Bentheimer sandstone cores, with two different residual oils (Troll crude oil and single-component oil, n-decane) permitting the evaluation of how oil composition influences foam stability and oil-displacement efficiency. In addition, two surfactant concentrations (0.10 and 1.0 wt.%) were tested to investigate the effect of surfactant concentration on foam robustness (strength and stability) in the presence of residual oil.
The overall objective was to determine the impact of residual oil on CO2 foam generation and strength. In particular, to identify the optimal foam quality (gas fraction) in the presence of oil, evaluate the rheological response of foam in porous media, and assess the oil recovery during foam injection. By comparing n-decane (first contact miscible with CO2) with realistic crude oil (multi-contact miscible with CO2), we gain insight into how oil composition and miscibility influence foam behavior. The findings provide guidance for field applications of CO2 foam in EOR and CO2 storage, including surfactant design and operational considerations, while also providing key input parameters for numerical foam models when upscaling from laboratory to field scale.

2. Materials

2.1. Fluids

A synthetic brine consisting of 3.5 wt.% (35,000 ppm) NaCl was used for all experiments. This moderate salinity (seawater) was chosen to eliminate additional variables (such as high-salinity effects on surfactant precipitation or viscosity) and to ensure surfactant stability, so that differences in foam strength could be attributed to oil effects rather than brine chemistry. The brine was mixed with a nonionic, water-soluble surfactant (Surfonic L24-22) and a linear C12–C14 ethoxylated alcohol surfactant with a critical micelle concentration (CMC) of ~0.05 wt.% [40,41]. This surfactant was selected for its high-temperature stability and expected low adsorption on quartz rich sandstone; notably, the surfactant was successfully used at 0.5 wt.% in a field pilot [42]. High purity CO2 (99.999%) was used in all experiments. At 60 °C and 180 bar, CO2 is in a supercritical state with a density of 0.7 g/mL and a viscosity of 0.05 cP summarized in Table 1 (fluid properties) and obtained from the NIST database [43]. Properties are assumed constant across the core and negligible variation in CO2 density.
Table 1 shows the fluid properties of the gaseous phase (CO2) and oleic phase (n-decane and Troll crude). n-decane, a paraffinic mineral oil that is first contact miscible with CO2 under our experimental conditions [44]. In contrast, Troll crude is a light, low-sulfur North Sea crude oil and it is expected to be multi-contact miscible with CO2. The dynamic contacts between CO2 and oil would eventually yield miscibility, although there remains an interface initially. The minimum miscibility pressure for similar light oils with CO2 is on the order of 120–150 bar, and our conditions (180 bar) ensure miscibility. However, the presence of foam introduces complexity to the concept of miscible displacement. To ensure consistency and minimize experimental variability, both oils were filtered through a low permeable core, removing solid contaminants that could interfere with flow or foam stability.

2.2. Rock Properties

The experiments were performed in a Bentheimer sandstone core, a relatively homogeneous, water-wet, high-permeability (~2 D) sandstone composed of mainly quartz (97 wt.%) with minor feldspar and clays (e.g., kaolinite ~2%, chlorite ~1%) [45]. Bentheimer sandstone is a well categorized analog and was selected as a reference rock for flow through porous media and foam studies. The high-permeable rock has previously been utilized in CO2 foam studies [46,47,48].
Rock properties are summarized in Table 2. The core material was cut and dried for 72 h at 60 °C. All core material was saturated with 100% brine under a vacuum procedure, and porosity and pore volume were determined from the dry and wet weight difference. Absolute permeability was calculated using Darcy’s law, by injecting brine at three different injection rates. Permeability measurements were repeated 2–3 times for reproducibility in the same core, except for runs using Troll crude, where a new core was used due to the strong effects of crude oil. The absolute permeability reported is an average of multiple measurements. Between experiments, the core was thoroughly cleaned by flushing ~3 pore volumes of isopropanol (IPA) azeotrope followed by more than 10 pore volumes of 3.5 wt.% NaCl brine.

2.3. Experimental Setup

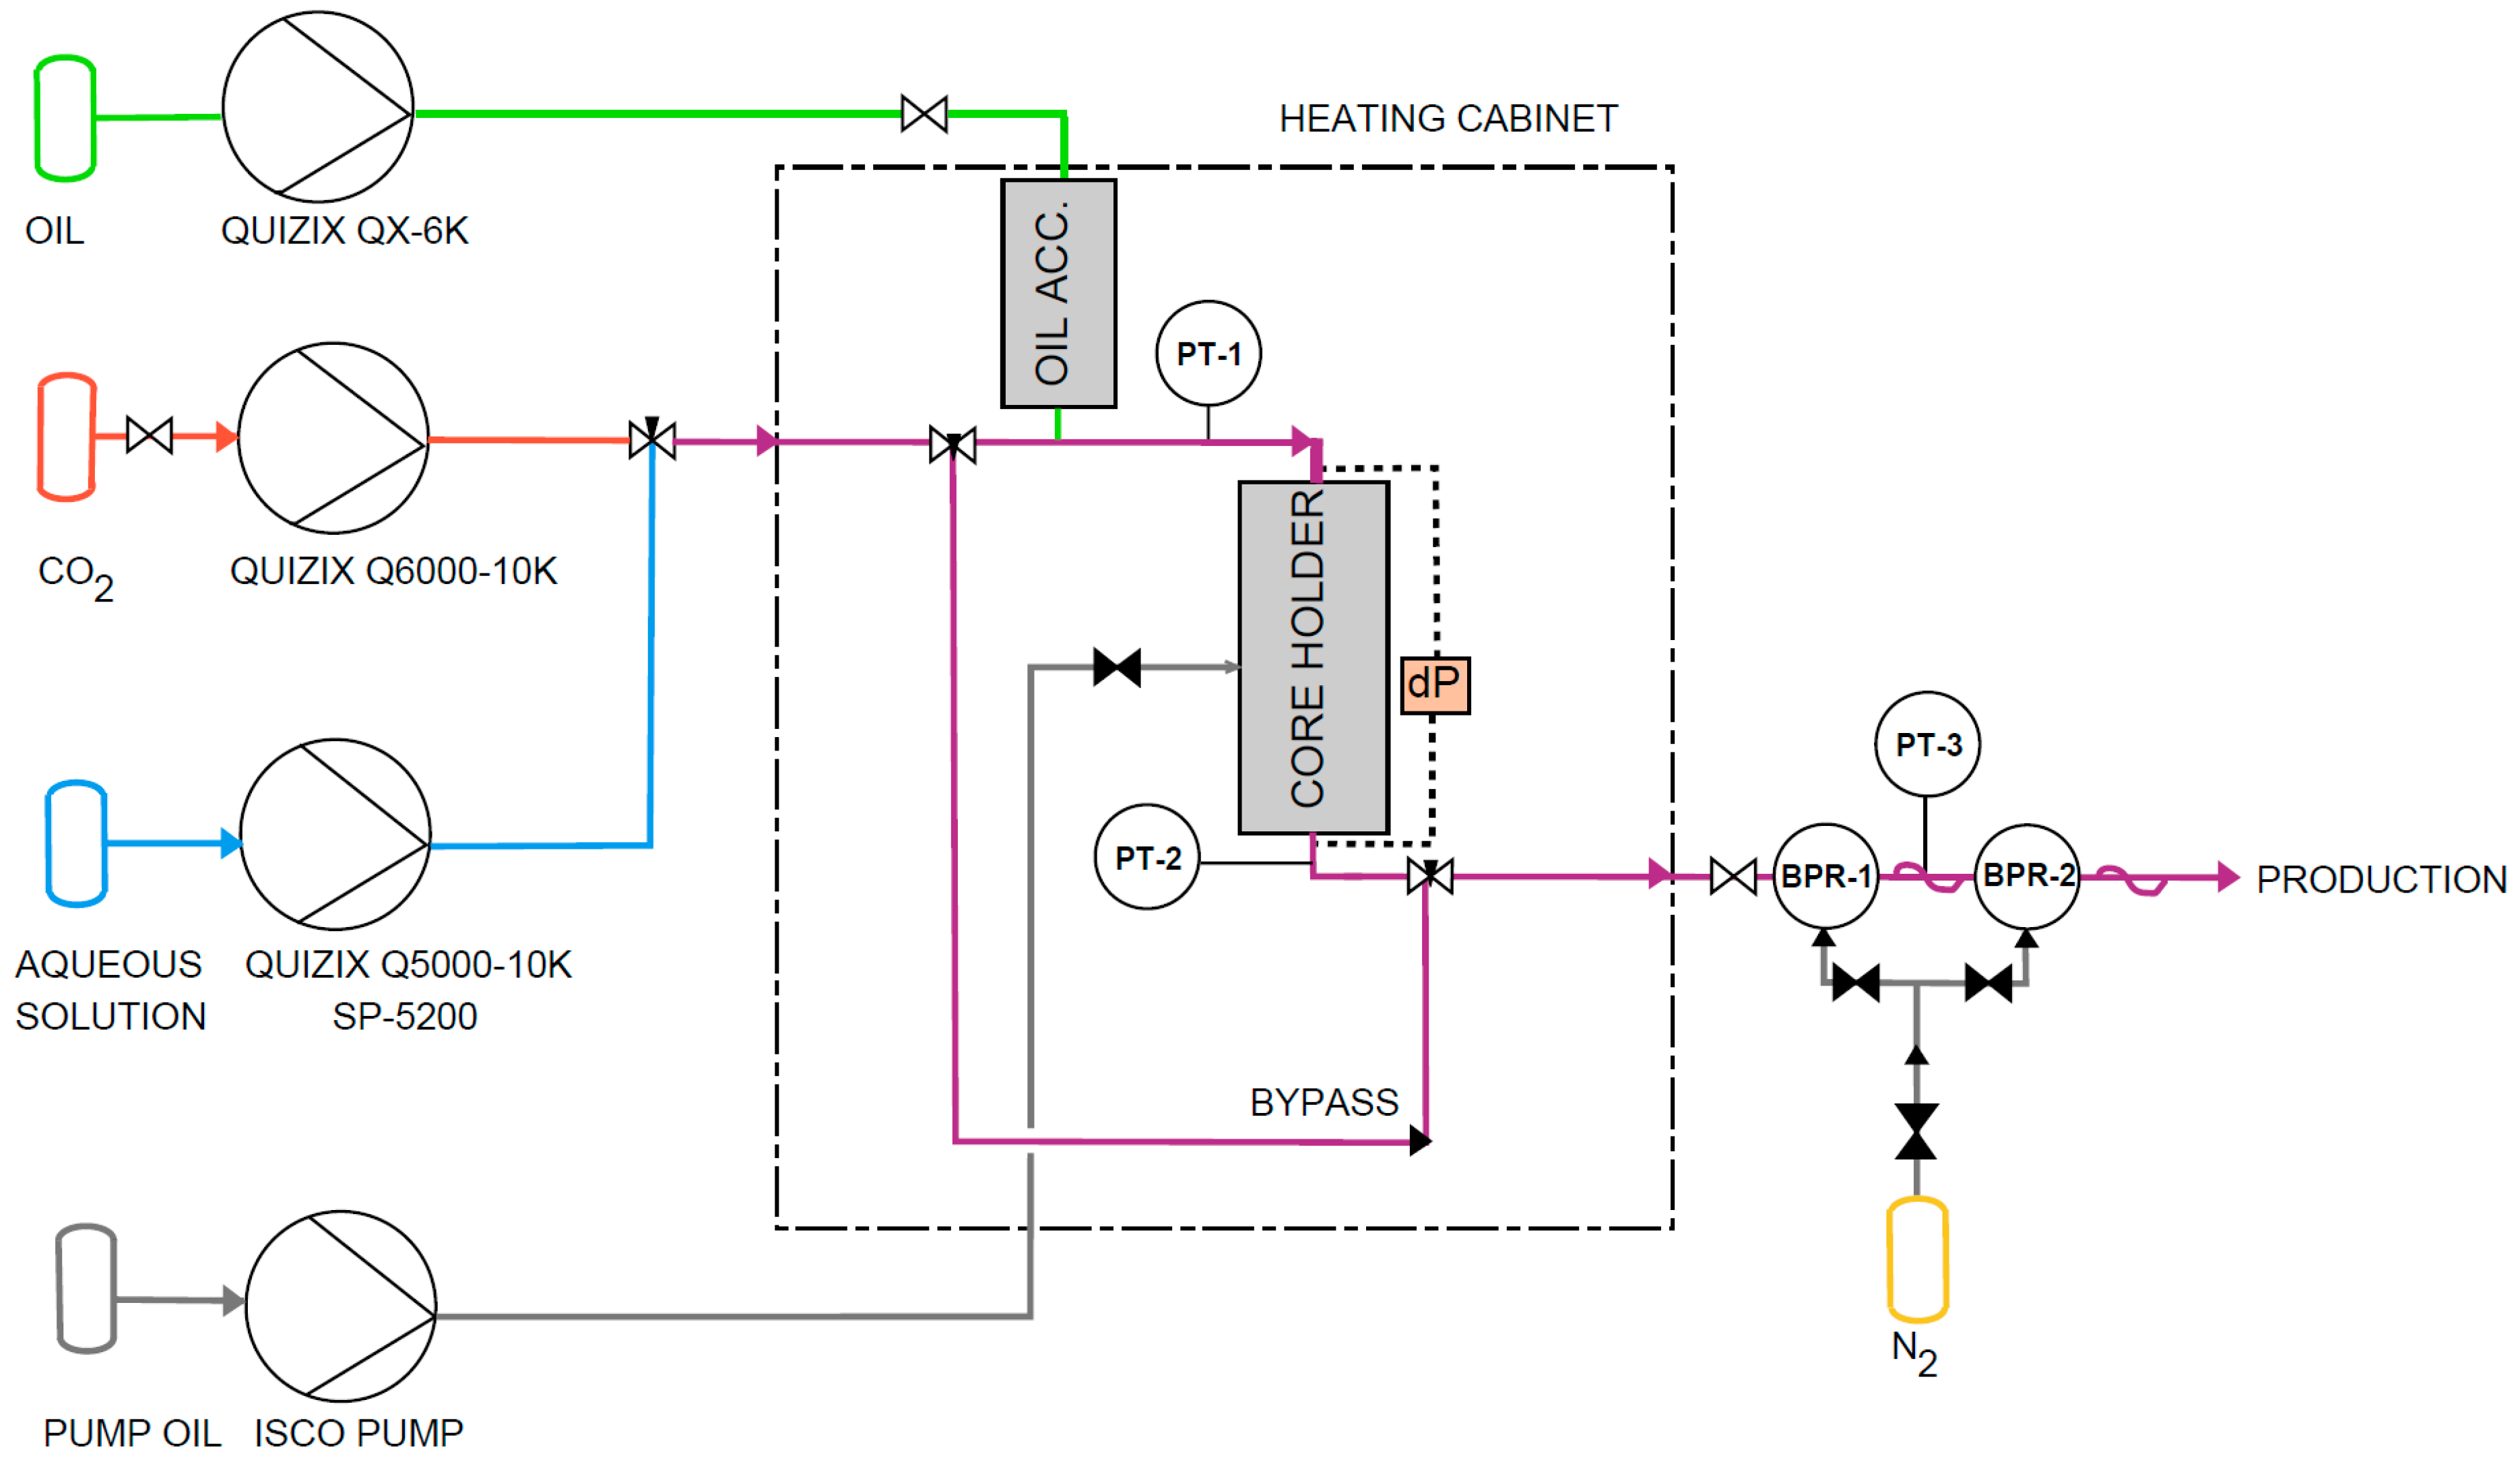
Figure 1 shows the high pressure and high temperature core flooding experimental setup. Cores were wrapped in a 0.50 mm nickel foil to prevent the surrounding Teflon sleeve from swelling due to radial diffusion of CO2. The core was mounted in a vertically oriented core holder and pressurized to 180 bar with a confining pressure of 202 bar. System pressure was regulated by two back pressure regulators (BPR) connected in series, set to 180 bar and 120 bar, respectively. The two BPRs were heat traced at (40 °C) to avoid the Joule–Thompson cooling effect and connected in series to eliminate pressure fluctuations during the multi-phase flow. The core holder was mounted in a heating cabinet set to 60 °C. Troll crude was injected through an accumulator mounted inside the heating cabinet, while a separate pump located outside the cabinet was used to inject n-decane. Production fluids were continuously monitored, and CO2 was captured in an adsorption column. Pressure was measured at both the inlet and outlet of the core, and a differential pressure transducer monitored the pressure drop across the core.
The CO2 injection rate was controlled by a high-pressure pump operating at a constant-rate, and the injected volume at temperature and pressure was determined from the pump rate and injection time, and with CO2 density. Effluent was collected in the adsorption column for disposal, where the CO2 volume was not used in quantitative analysis.

3. Methods

3.1. Foam Quality and Rate Scans

Foam strength was evaluated using steady-state co-injection experiments, including foam quality and rate scans. Foam quality (gas fraction) scans were designed to identify the optimal gas fraction (fg) for maximum foam strength. Rate scans determine the rheological behavior and the optimal injection velocity at a fixed foam quality. Both foam quality and rate scans were repeated three times, where the differential pressure was monitored until steady state. Foam quality scans were performed by co-injection of CO2 and surfactant solution at a fixed Darcy velocity of 4 ft/day. Foam quality was monotonically increased from fg = 0.30 to 1.0, where each foam quality was injected until a steady state was obtained. Foam quality, or gas fraction, is the ratio of gas flow rate to the total flow rate of gas and liquid, and can be expressed mathematically as follows:
f g = q g q g + q l i q ,
where qg is the amount of gas present in the co-injection and qliq is the aqueous phase. In this work, the aqueous includes brine or foaming solution. Foam quality scans with CO2 and brine are called baseline quality scans and are used for benchmarking the foam behavior under relevant conditions. Foam qualities were controlled by simultaneously setting the liquid pump rate and CO2 pump rate to achieve the desired volumetric fractions at reservoir conditions. System pressure and temperature were regulated by the BPRs and thermostat oven, and CO2 density variations are assumed to be negligible over the broad range of foam qualities studied.
Rate scans were completed by co-injecting CO2 and foaming solution at the optimal foam quality identified from the quality scan, starting at 16 ft/day. The injection velocity was reduced with 4 ft/day increments down to 4 ft/day, after the system reached steady state. The injection velocities were selected across a range of velocities to investigate rheological behavior and for comparison with previous laboratory studies.

3.2. Foam Quality and Rate Scans in the Presence of Residual Oil

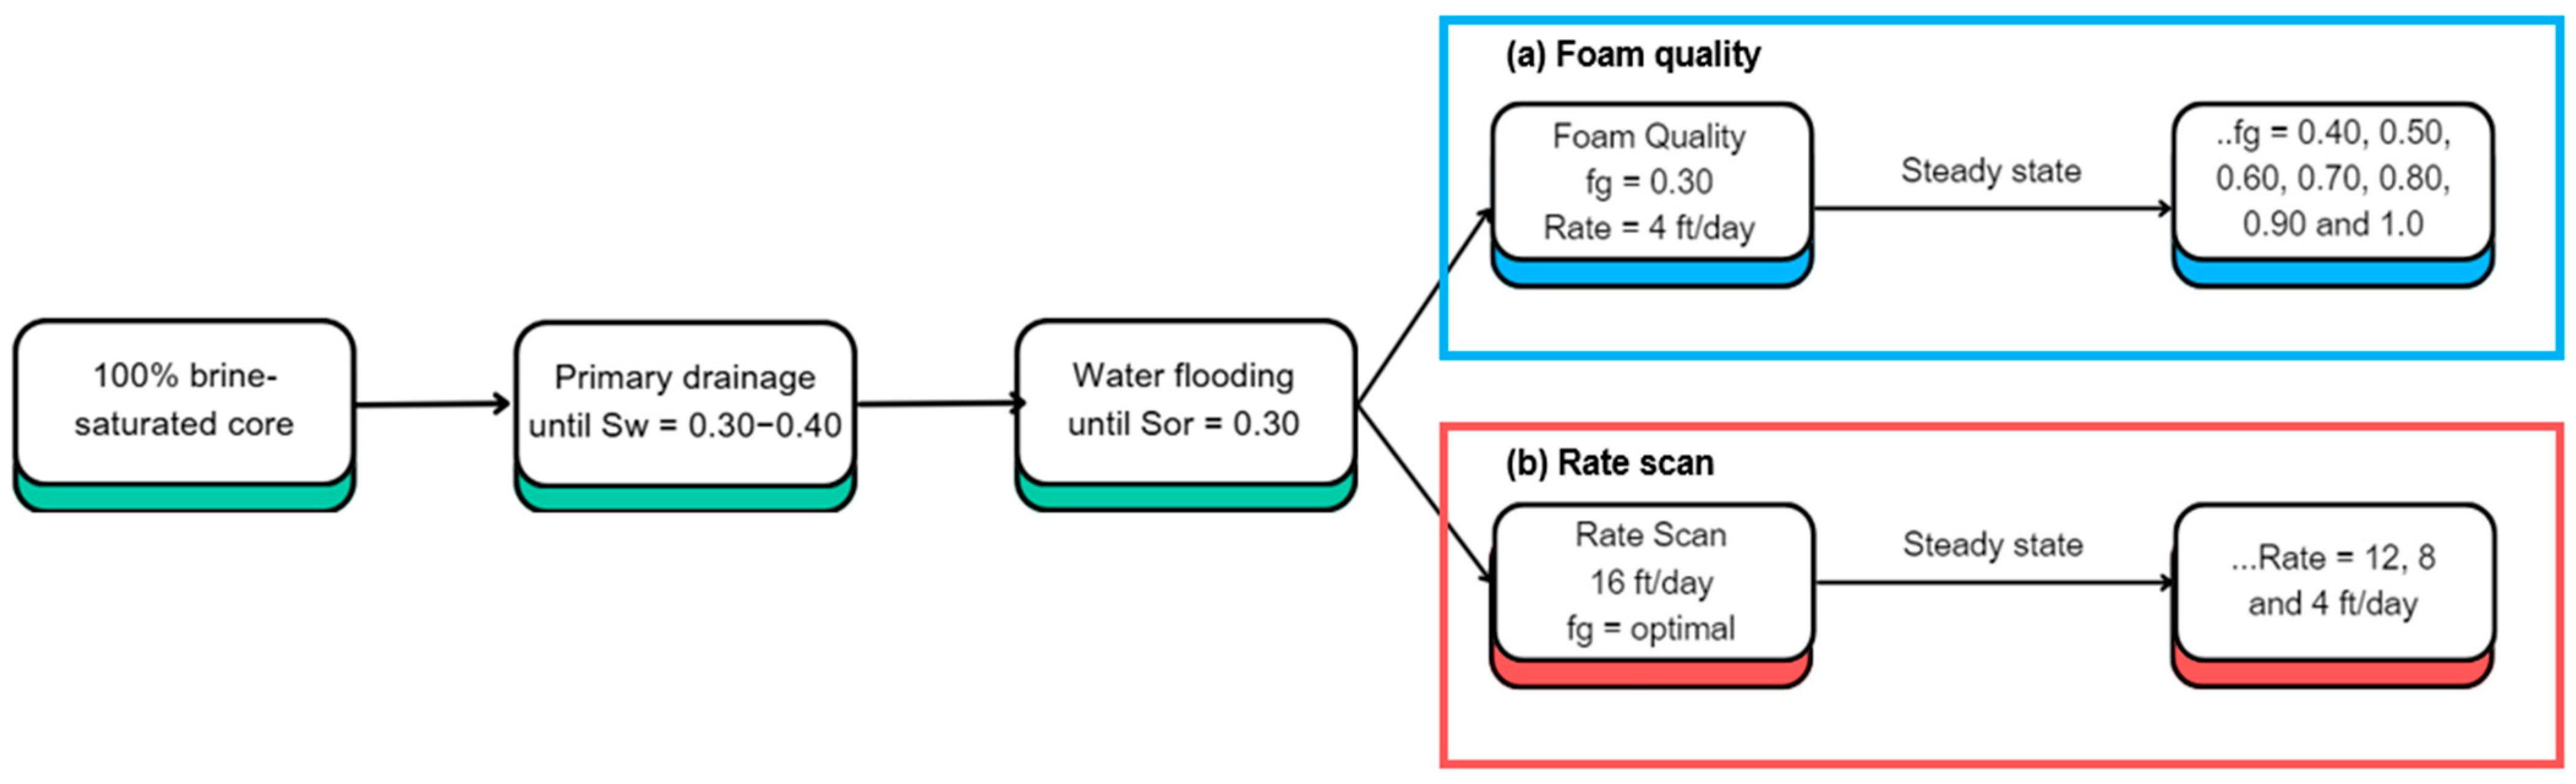
To evaluate foam behavior in the presence of oil, foam quality and rate scans were performed following a pre-flush procedure to establish residual oil saturation. The cores were initially 100% saturated with 3.5 wt.% brine, then drained with either n-decane or Troll crude at 4 and 8 ft/day until water saturation (Sw) reached 0.30–0.40. A subsequent waterflood at the same velocities reduced oil saturation to a residual level (Sor) of approximately 0.20 to 0.30. Effluent volumes were monitored continuously, and residual oil saturation was calculated by mass balance. The objective was not to alter the wettability in the core, and no surfactant solution was present during the pre-flush stage. After the pre-flush stage, the same procedure as in 3.1 was followed for foam quality and rate scans.
Figure 2 illustrates the experimental procedure for establishing residual oil saturation, including (a) a foam quality scan or (b) a foam rate scan.
Foam strength was quantified by its apparent viscosity ( μ a p p ), a metric for characterizing foam mobility in porous media. At each foam quality and rate scan, steady state was defined as the point at which pressure drops across the core stabilized over time. Under these conditions, apparent viscosity can be calculated using a modified Darcy’s law:
μ a p p = k u G a s + u L i q u i d p ,
where k is the absolute permeability, uGas and uLiquid are the injection velocities for gas and aqueous solution, respectively and p is the pressure gradient. Higher apparent viscosity values correspond to stronger foam, indicating greater resistance to flow and improved mobility control. The optimal foam quality was identified as the gas fraction that yielded the highest apparent viscosity during steady-state flow. This approach enables direct comparison of foam performance across different surfactant concentrations, oil saturations and injection velocities. Apparent viscosity values are reported as an average of multiple experiments, and error bars represent the standard deviation of the steady-state measurements.

3.3. Single Cycle Injection

Single-cycle foam injections were conducted to evaluate the impact of foam quality and surfactant concentration in the presence of residual oil. The initial saturation, primary drainage and waterflooding procedures followed the same protocol as described in Section 3.2. In these experiments, CO2 and foaming solution were co-injected at a constant Darcy velocity of 4 ft/day at two foam qualities fg = 0.30 and 0.70 (Figure 3).
Production performance was calculated and evaluated by recovery factors (RF) and pore volumes (PV) were injected by the following:
R F = S o i S o r S o i ,
where Soi is the initial oil saturation before foam quality scans, and Sor is the residual oil saturation after foam injection. This approach enabled direct comparison of oil recovery efficiency across two foam qualities and surfactant concentrations.

4. Results and Discussion

CO2 foam was evaluated as a mobility control agent for EOR, with focus on the impact of residual oil. Apparent viscosity trends were evaluated under varying surfactant concentration and oil saturation to assess foam strength and sweep efficiency.

4.1. Foam Quality Scans at Low Surfactant Concentrations

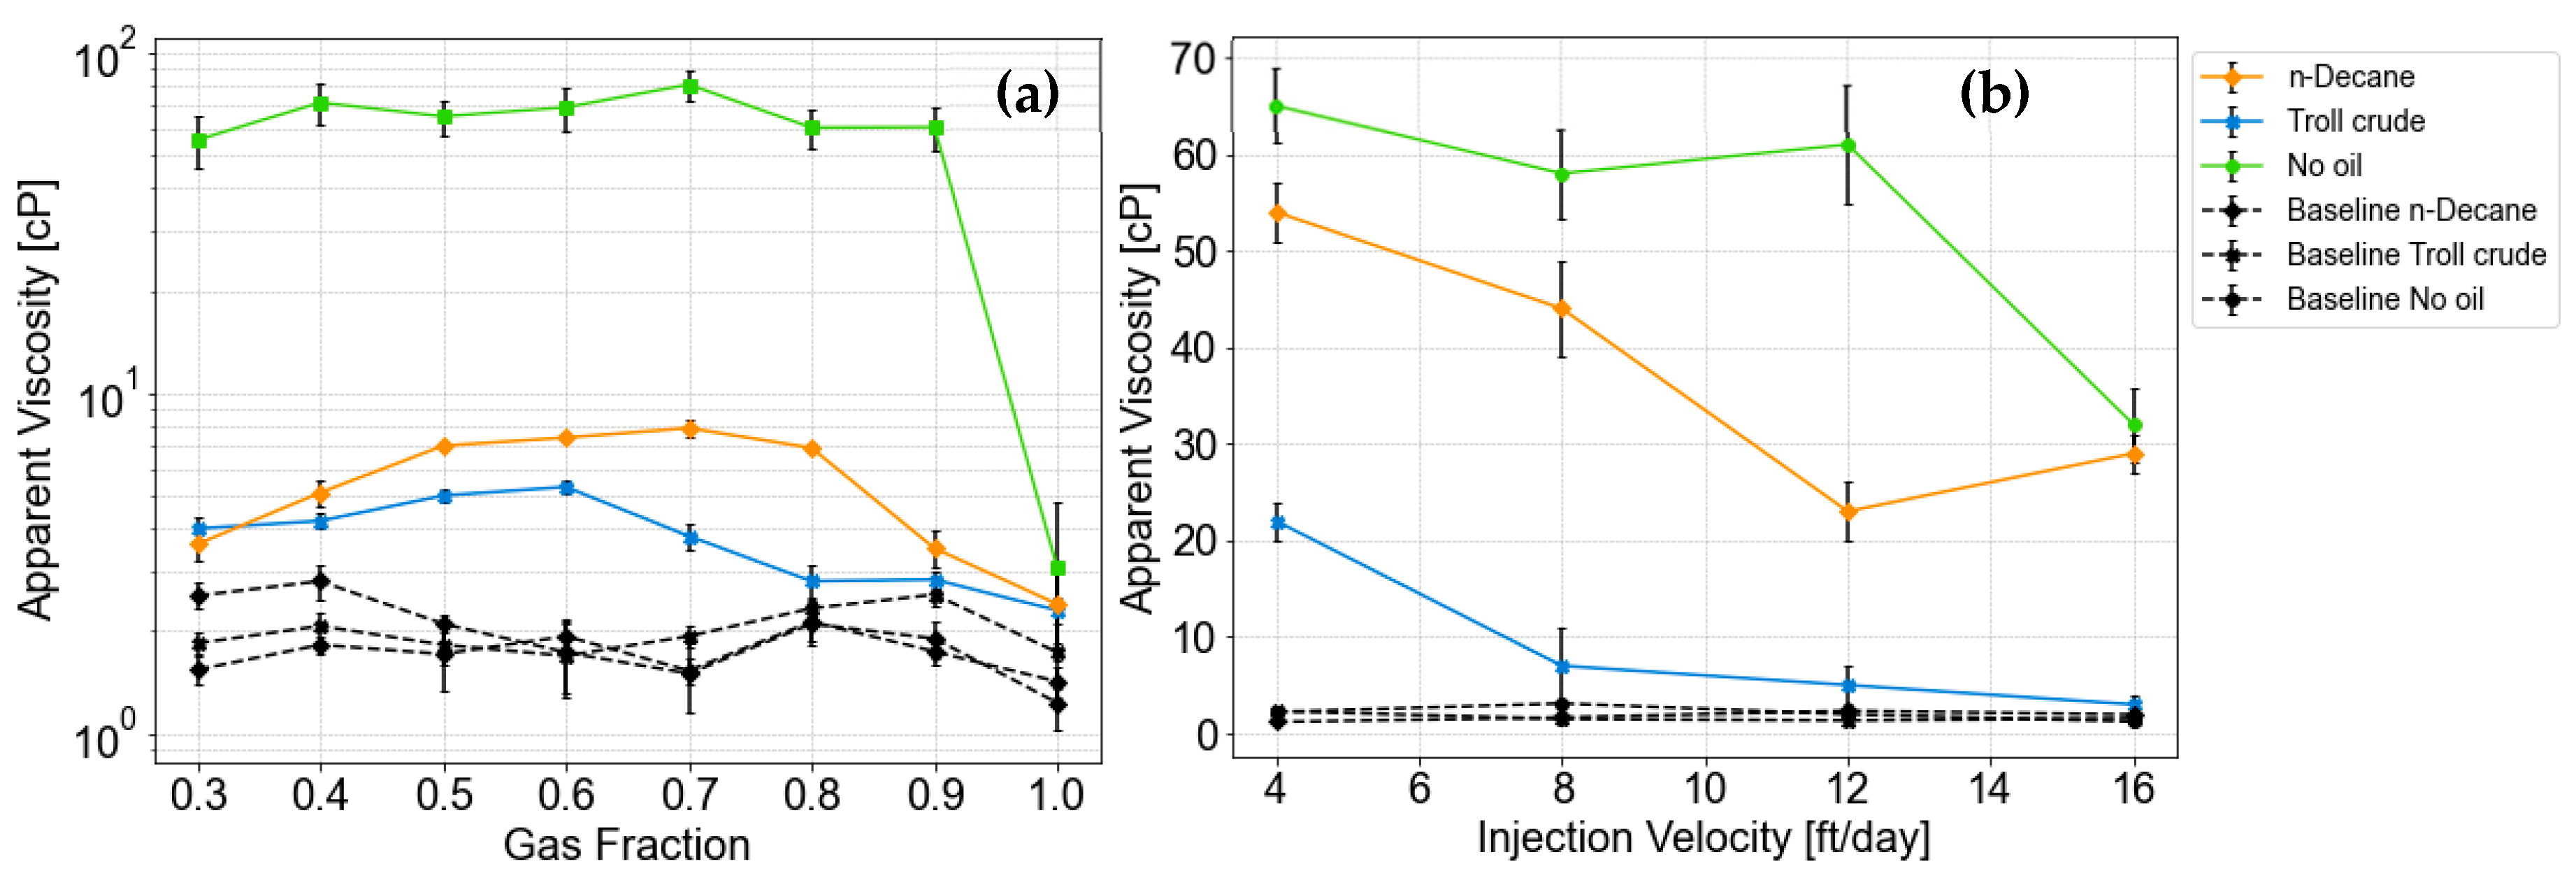
Figure 4a shows apparent viscosity versus gas fraction with 0.10 wt.% foaming solution at 60 °C and 180 bar without residual oil (green curve) and with residual oil saturation (n-decane: orange curve; Troll crude: blue curve). Foam quality scans without foaming solution (baseline), in the presence and absence of residual oil, are also shown (black curves). In the experiment without residual oil (green curve, Figure 4a), strong foam was generated across a wide range of foam qualities (fg = 0.30 to 0.90). The apparent viscosity remained high (~60 to 80 cP) and relatively stable as fg increased, until very high foam quality. The maximum apparent viscosity was 81 ± 8 cP at fg = 0.70, the optimal foam quality. Even at fg = 0.90, foam maintained an apparent viscosity of ~60 cP indicating the robustness of the surfactant to stabilize dry foams. At foam quality fg = 1.0 (100% CO2, no liquid injected) only weak foam existed (~3 cP), slightly above the baseline of 3 ± 0.4 cP. This indicated foam dry-out at very high foam quality (90 to 100% gas), where the foam collapses due to insufficient liquid [20,22]. The baseline measurements show that apparent viscosities above ~3 cP are due to foam generation. Without oil, the foam was very stable and achieved an order of magnitude of I increase in apparent viscosity over the baseline, with an optimal foam quality at fg ≈ 0.70. The high-quality tolerance, thermal and pressure stability and the consistent performance over a range of foam qualities, confirm that the surfactant is resilient, which is ideal for mobility control. Mobility reduction was calculated and is included in Figure A1.
In the presence of residual oil, foam generation was initially suppressed until oil saturation decreased below a critical threshold, consistent with previous studies [25,30]. During injection at fg = 0.30, mobile oil was displaced within the first ~8 pore volumes, after foam formation became evident and APPV increased above baseline. This threshold behavior reflects the requirement that oil saturation fall below the critical oil saturation before stable lamellae can form and propagate through pore space. In these experiments, over 20 PV were injected per foam quality to reach steady state. Thus, during injection of the first foam quality (fg = 0.30), all of the mobile oil was displaced during the initial fg = 0.30 injection; mobile oil was displaced early, followed by foam generation. A detailed analysis on residual oil and uncertainties is included in Appendix A.
Residual oil significantly reduces foam generation and propagation, a trend widely reported in previous studies [7,25,26,27,30]. The reduction in foam strength compromises mobility control, but it does not fully suppress foam performance in the presence of oil [49]. The exact destabilizing mechanisms responsible for foam destabilization are difficult to resolve, due to the opaque nature of core flooding. One is lamellae rupture, driven by local variations in film thickness that lead to rupture [50]. Another mechanism is emulsification of oil into lamellae which can accelerate thinning and ultimately rupture [34]. The specific destabilization mechanism on Surfonic L24-22 at 0.10 wt.% in a Bentheimer core remains uncertain. However, pore-scale experiments testing the same surfactant in the presence of n-decane and North Sea crude oil demonstrated that oil has adverse effects on CO2 foam stability. With n-decane, lamellae rupture through coalescence was the dominant destabilization process. In contrast, crude oil destabilized foam by entering and spreading across the lamellae, ultimately leading to rupture [51]. These findings suggest that the lamella rupture is the most likely destabilization mechanism in our experiments as well.
The limited variation in apparent viscosity may also be a result of foam destabilization effects at high temperatures [24,26]. At elevated temperatures (60 °C) liquid film drainage is increased, due to decreasing viscosity of the aqueous phase. The CO2 phase itself also becomes less dense and viscous at higher temperature, resulting in faster gravity drainage. In addition, elevated temperatures can destabilize foam as the thermal motion of molecules increases, resulting in a lower surface density of surfactants. In the presence of n-decane, apparent viscosity increased with foam quality up to fg = 0.70, reaching a maximum of 7.9 ± 0.52 cP (orange curve). With Troll crude oil, apparent viscosity increased from fg = 0.30 to 0.60, peaking at 5.3 ± 0.23 cP (blue curve).
This indicates an optimal foam quality of fg = 0.60 in the presence of residual Troll crude oil. Overall, foam was stronger in the presence of residual n-decane than with Troll crude, suggesting that crude oil had a more detrimental effect than the mineral oil on foam strength. The chemical structure and composition of n-decane and Troll crude oil is significantly different: n-decane is a straight chain alkane, whereas Troll crude consists of several polar components such as asphaltenes or resin fractions. It is expected that the complex composition contributes to the pronounced effect on foam strength, which may result in interactions with crude oils that are not seen with mineral oils [52,53].
Jensen and Friedmann [54] demonstrated in sandstone core experiments that foam propagation rates were largely unaffected by oil type, and the results indicated that the type of oil had little effect on the propagation, but the propagation of foam with residual oil was strongly surfactant-specific. They observed two distinct behaviors across the surfactants, “oil-insensitive” and “oil-sensitive” surfactants regardless of the type of oil. Schramm and Novosad [55] later reported that these surfactant-specific behaviors arise from molecular architecture rather than head-group charge. They found that alpha-olefin sulfonates preserve foam structure in oil-wetted pores, whereas aromatic sulfonates and short-chain alkyl ethoxylates rapidly lose stability upon oil contact. In this study, a single nonionic surfactant was evaluated, producing slightly stronger foam in the presence of n-decane than with Troll crude oil. Nonetheless, foam strength was significantly reduced compared to oil-free conditions. Schramm and Novosad [55] reported decreasing foam stability with lighter crude oils compared to heavier ones. However, this trend did not hold for single-component oils, such as n-decane. Studies on bulk foam have shown that short-chain alkanes destabilize foam more effectively than long-chain alkanes [56]. Specifically, lower molecular weight alkanes like n-decane exert a stronger destabilizing effect on foam than their heavier counterparts [57].
Polar components in crude oil, such as asphaltenes and naphthenic acids, can adsorb onto rock surfaces and shift wettability toward oil-wet conditions. Even slight wettability alteration has been shown to reduce foam strength, as reported by Schramm and Mannhardt [58], while Prud’homme and Khan [59] noted that foam detaches and collapses when surfaces are not water-wet. Although Bentheimer sandstone is inherently water-wet and contains ~3 wt.% clay, electrostatically charged clays may enhance adsorption [60]. Fredriksen, Alcorn [61] observed minor rock-wetting by Surfonic L24-22, a surfactant not typically associated with rock affinity changes. The short duration of the experiments, absence of measurable contact angle shifts and low clay content suggests that wettability alteration alone cannot explain the observed reduction. This work does not capture the effects of mixed wettability, clay rich reservoir rocks or high salinities, which may limit the direct application of this work.
Figure 4b shows apparent viscosity versus injection velocity with 0.1 wt.% foaming solution at 60 °C and 180 bar without residual oil (green curve) and with residual oil saturation (n-decane, orange curve; Troll crude, blue curve). Baseline scans without foaming solution (black curves) are also shown. Shear-thinning behavior was observed for all injection velocities tested, as the apparent viscosity decreased with increasing injection velocity. From 16f to 4 ft/day the apparent viscosity decreased by 51% in the absence of oil, 46% in the presence of n-decane and 86% in the presence of Troll crude. Shear-thinning behavior is beneficial for field applications because it helps to maintain injectivity [62]. The apparent viscosities at 4 ft/day (fg = 0.70) during the rate scan (Figure 4b) were higher than those at the same conditions during the quality scan (Figure 4a). This could be due to hysteresis, that is, foam remaining trapped in the core from prior high-rate stages, thereby sustaining a higher apparent viscosity when the rate is reduced. The hysteresis effect has been observed in some experiments [63] and not observed in others [64]. Surfactant type has been suggested as one of the dominant factors contributing to hysteresis [65]. These findings show that both flow rate history and surfactant chemistry must be accounted for when interpreting laboratory foam data and translating them.

4.2. Foam Quality Scans and Surfactant Concentration

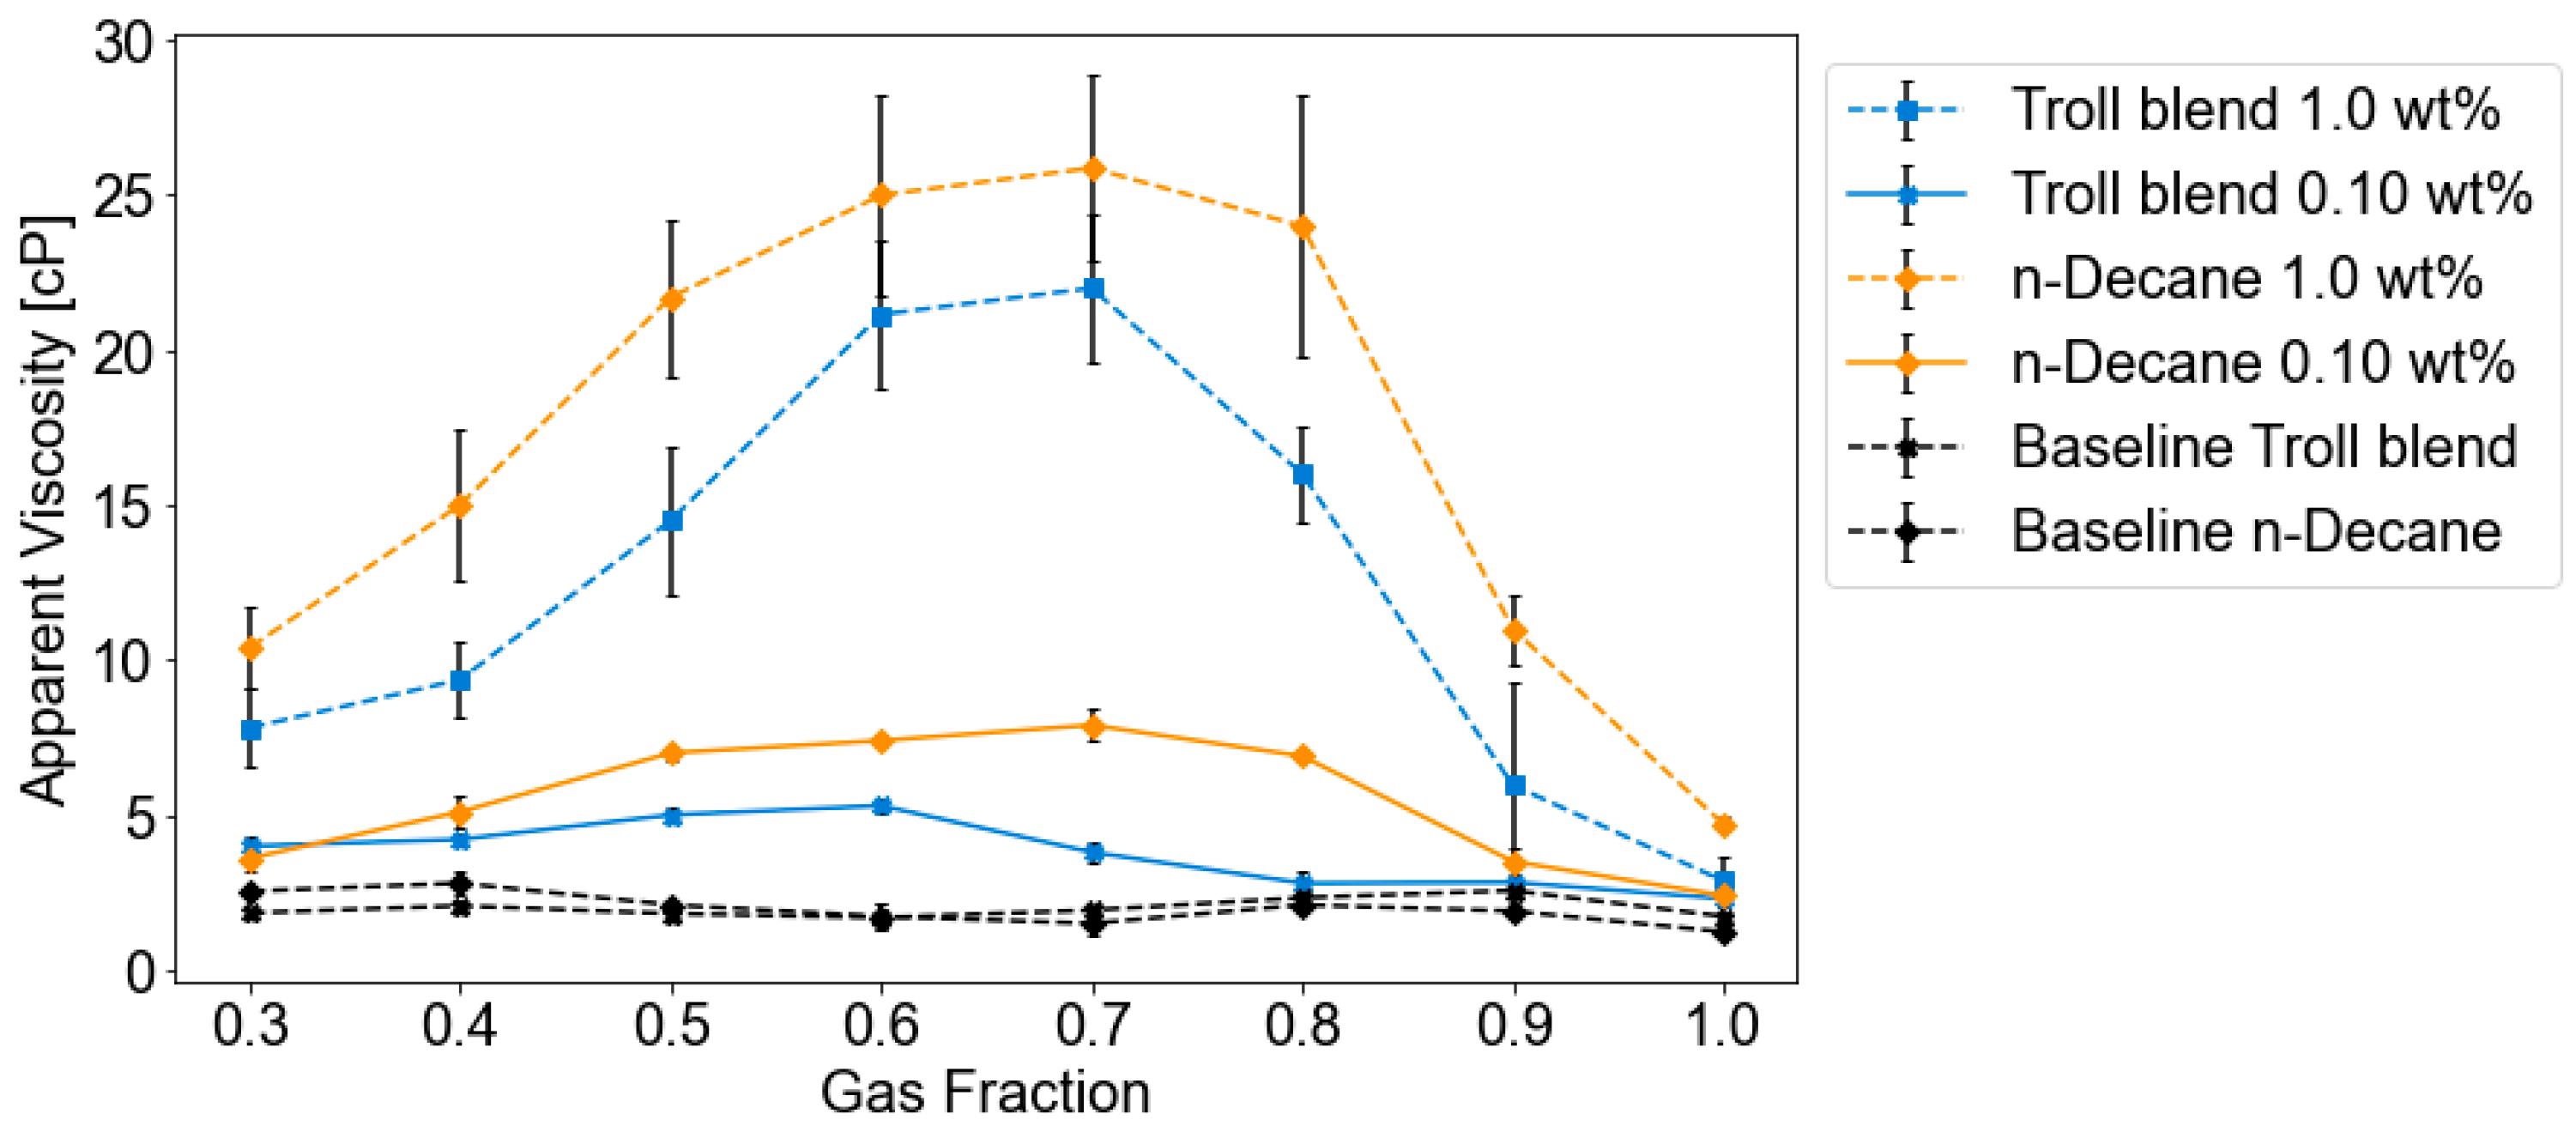
Figure 5 shows apparent viscosity versus gas fraction for foaming solutions at 0.10 wt.% (solid lines) and 1.0 wt.% (stippled lines) in the presence of oil (n-decane: orange curve; Troll-crude: blue curve) and without foaming solution (baseline: black curves). Strong foam was generated from fg = 0.30 to 0.90 at both surfactant concentrations (0.10 and 1.0 wt.%.) as indicated by apparent viscosities above ~3 cP (baseline: black curves). All foams indicated optimal foam quality between fg = 0.60 and 0.70 before collapsing in the high-quality regime, regardless of surfactant concentration or oil type. With n-decane, foam formed in the first foam quality (fg = 0.30) with an apparent viscosity of 10.4 ± 1.3 cP (1.0 wt.%) and 3.6 ± 0.40 cP (0.10 wt.%). Viscosity continued to increase through the low-quality regime (fg = 0.30 to 0.70) to the maximum apparent viscosity of 25.9 ± 2.97 cP (at 1.0 wt.%) and 7.9 ± 0.5 cP (0.10 wt.%). In Troll crude, initial viscosities at fg = 0.30 were 7.81 ± 0.9 cP (1.0 wt.%) and 4.02 ± 0.2 cP (0.10 wt.%). The apparent viscosity continued to increase through the low-quality regime (fg = 0.30 to 0.70) with optimal foam qualities at fg = 0.70 (1.0 wt.%) and fg = 0.6 (0.10 wt.%). The transition from low-quality to high-quality lies in the range of fg = 0.60 to 0.70 and corresponds to apparent viscosity values of 21.8 ± 2.3 cP (1.0 wt.%) and 3.8 ± 0.4 cP (0.10 wt.%).
Across a range of experimental conditions in the presence of oil, the maximum apparent viscosity was obtained in foam qualities fg = 0.60 to 0.70, before collapsing in the high-quality regime. The limited variation in optimal foam qualities suggests a balance between strong mobility reduction, while maintaining moderate pressure gradients. Optimal foam qualities will be dependent on reservoir-specific conditions, but these results indicate that intermediate foam qualities are robust in the presence of n-decane and Troll crude oil.
The transition from low- to high-quality reflects a decline in apparent viscosity as a function of gas fraction. This marks the boundary between stable foam and gas-dominated flow, where surfactant concentration becomes increasingly important. At low surfactant concentrations, the variation in apparent viscosity was limited, which is likely attributed to reduced surfactant availability at gas–liquid interfaces. Surfactant molecules preferentially adsorb at the oil–water interface, diminishing heir stabilizing role in the lamellae [66]. Essentially, the low surfactant concentration cannot stabilize lamellae sufficiently in the presence of oil. Additionally, oil solubilization into micelles and the presence of dispersed oil droplets contributes to lamellae thinning [25,34]. Simjoo, Rezaei [65] demonstrated that foam longevity is sensitive to surfactant concentration, with lower concentrations yielding shorter half-lives in the presence of oil. These findings align with our results with reduced surfactant concentration in oil-containing systems.

4.3. The Impact of Foam Quality on Oil Recovery

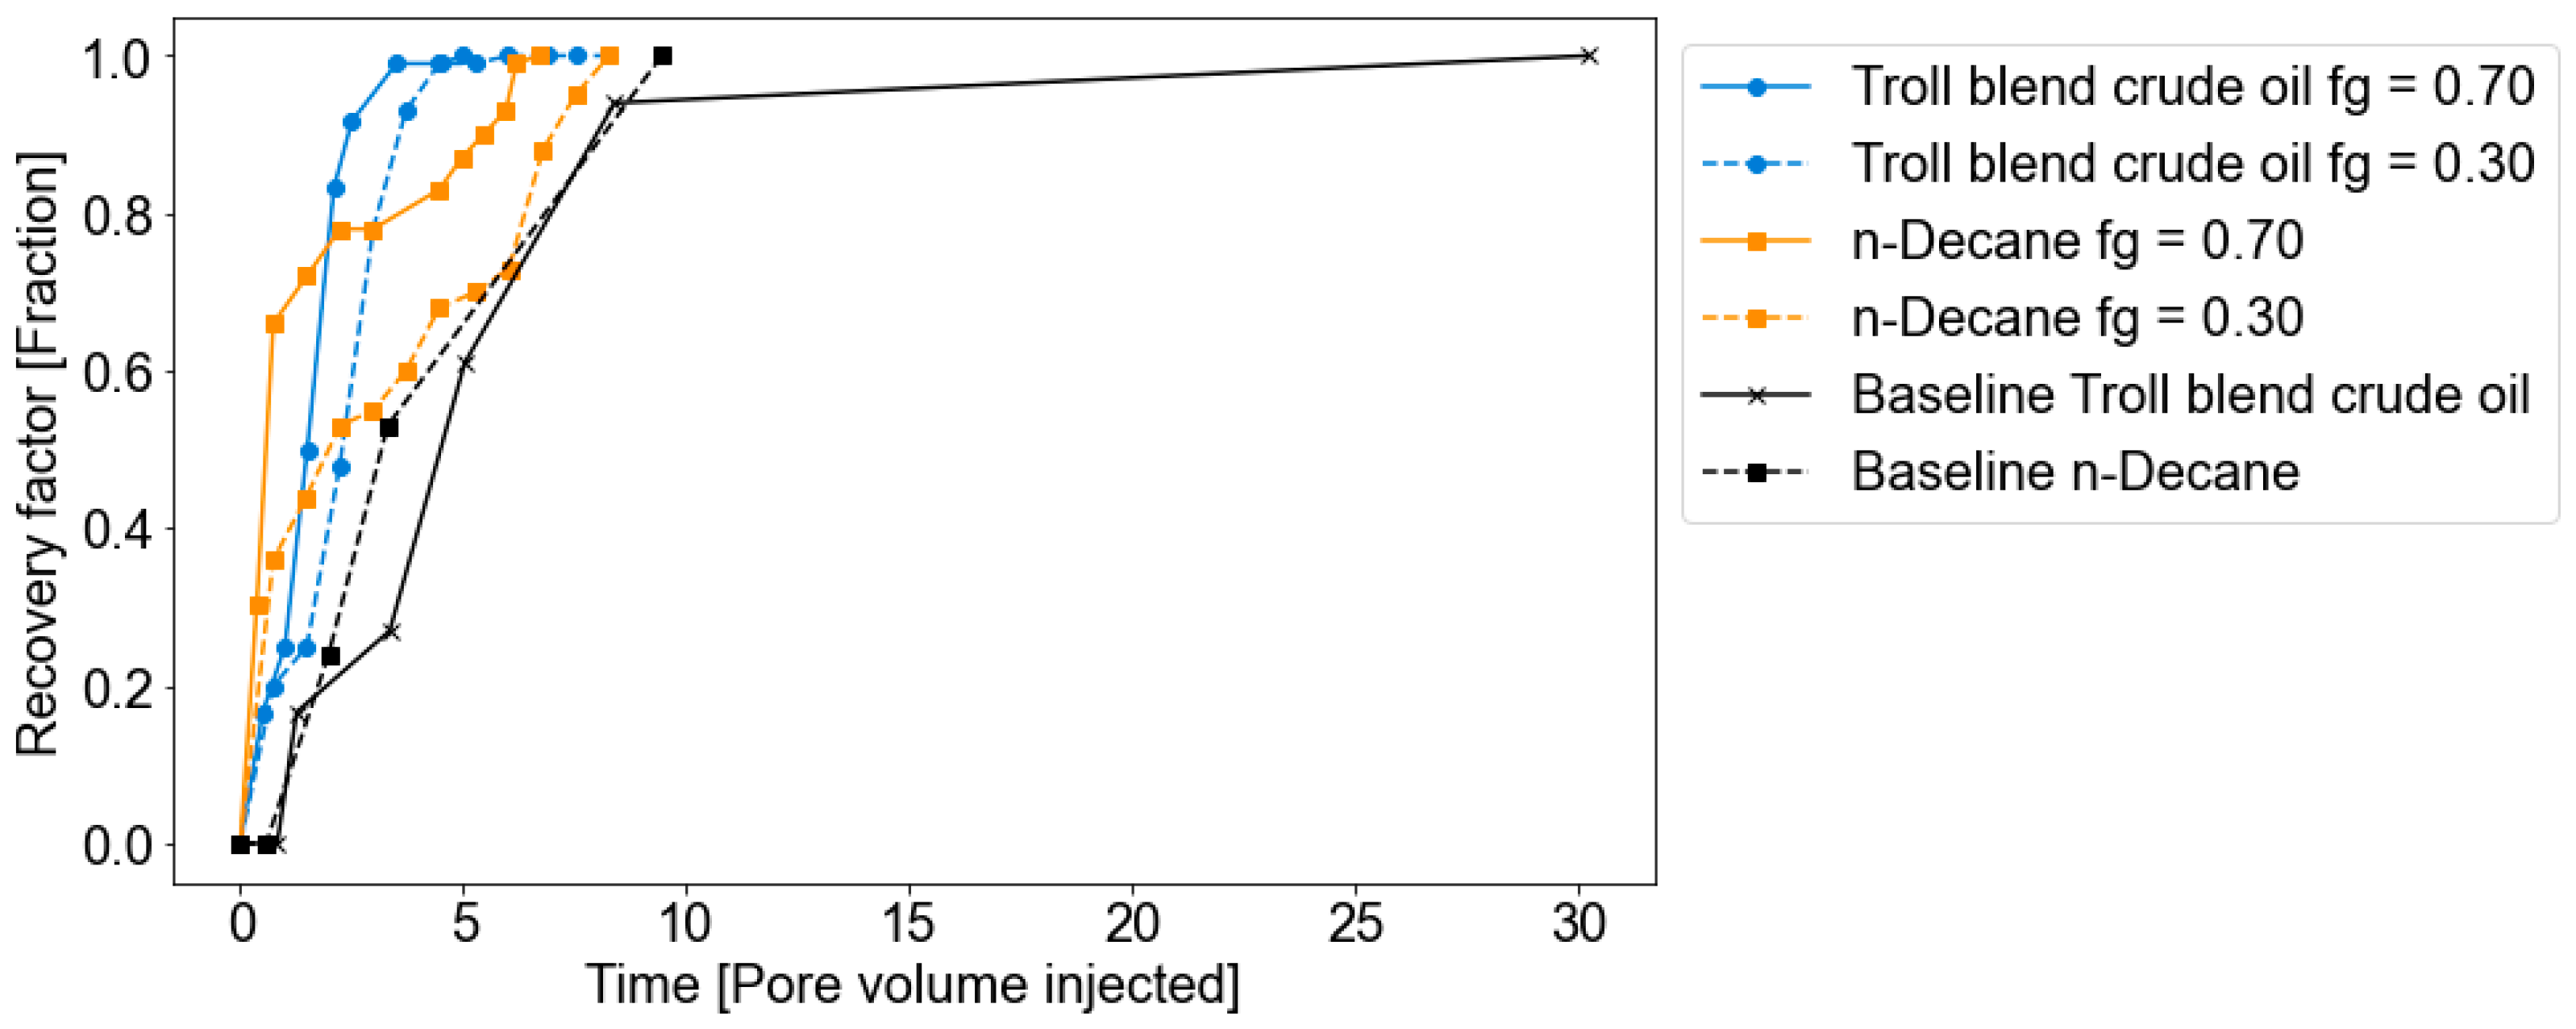
Figure 6 shows the oil recovery factor (fraction) versus pore volume injected for foam quality scans in the presence of Troll crude oil (blue curves) and n-decane (orange curves) at 60 °C with 0.10 wt.% foaming solution for foam qualities fg = 0.30 (dashed curves) and fg = 0.70 (solid curves). Higher foam quality fg = 0.70 had a higher recovery factor with less pore volumes injected and yielded a higher recovery factor with fewer pore volumes injected compared to the lower foam quality (fg = 0.30). The improvement at fg = 0.70 is likely due to the greater volume of CO2 injected. A baseline test (no surfactant) at each foam quality was also run for comparison (Figure 6, black curve). Based upon calculated recovery factors for all experiments, all residual oil was produced at both foam qualities, fg = 0.30 and 0.70, regardless of surfactant concentration and oil type. However, in the presence of foaming solutions, a higher recovery factor was achieved with fewer pore volumes injected. Compared to baseline, both fg = 0.30 and 0.70 produced oil more efficiently, and with foaming solution, the oil was produced with approximately 25 PV less injected. The 25 PV reduction reflects the mobility control of the CO2 foam slugs and enables the same oil recovery with less injected fluid. Compared to baseline, production was only slightly more efficient in the presence of a foaming solution, 0.10 wt.% compared to no foaming solution.
For foam quality fg = 0.30 in the presence of Troll crude, 100% of the oil was produced after 6.0 pore volumes, compared to average 8.3 pore volumes in the presence of n-decane. For foam quality fg = 0.70, 100% of the oil was produced after ~5 pore volumes injected, compared to 6.7 pore volumes injected for n-decane. Strong oil/water emulsions were produced for both n-decane and Troll crude in the presence of 0.10 wt.% foaming solution at 60 °C. The physical changes included change in color and cloudiness for both oils. From Figure 6, all the n-decane and Troll crude was produced in the first foam quality fg = 0.30, possibly by the end of the fg = 0.30 injection. However, emulsions were observed for n-decane in foam qualities fg = 0.30–0.40, where color change and cloudiness were observed. For the Troll crude, color change and a distinct oil layer on top was observed for fg = 0.30 and gradually decreasing cloudiness for fg = 0.40–0.60. Both effluents with residual n-decane and Troll crude were clear for foam qualities fg = 0.70–0.90, and a simple bottle test revealed that the effluent still foamed. Despite producing all the oil during the first foam quality, small amounts of trapped oil appeared to have a destabilizing effect on foam (Figure 4).
Emulsion formation can occur when water-soluble surfactants interact with oil, as they reduce interfacial tension and may solubilize oil into the aqueous phase. This can lead to formation of oil-in-water emulsions, which can be stabilized depending on surfactant properties and system conditions. The emulsions produced with n-decane, and Troll crude oil were observed for 36 days at ambient temperature (20 °C) with no visible separation. The emulsion showed no signs of gravity-induced separation, consistent with long-term gravity tests by Zhang, Bai [66]. While the persistence and stability of these emulsions may contribute to uncertainty in oil production measurements, they do not undermine the observed impact of oil on foam performance. Emulsions and material-balance calculations for oil recovery are further described in the Appendix A.
Although our injection conditions exceeded the CO2-oil MMP, foam alters the flow paths and phase distribution in the porous media. In the low-quality regime, the aqueous phase dominates and can influence how CO2 contacts the oil. In the high-quality regime, CO2 mobility increases, and foam diverts flow into less-swept regions. These effects can effectively increase sweep efficiency and promote recovery. Overall, foam improves access to residual oil and supports efficient miscible or near-miscible recovery.

5. Conclusions

Foam was generated in the presence of surfactant concentration, both in the presence and absence of oil. Residual oil (n-decane and Troll crude) significantly reduced foam apparent viscosity compared to oil-free conditions, with reductions in the order of ~90% at 1.0 wt.% surfactant concentration. Troll crude had a more detrimental effect on foam apparent viscosity, compared to the presence of n-decane, consistent with its polar components and more complex interfacial behavior.
Despite the presence of oil and changes in surfactant concentration, the optimal foam quality remained in range fg = 0.60 and 0.70. The limited variation in optimal foam quality suggests a robustness at the intermediate gas fractions and a limited effect of oil on optimal foam quality.
Increasing surfactant concentration from 0.10 wt.% to 1.0 wt.% enhanced foam strength in the presence of oil and increased the apparent viscosity from ~8 cP to ~26 cP (n-decane) at optimal foam quality. This highlights the importance of surfactant concentration on oil-induced foam destabilization.
Foam exhibited shear-thinning behavior both in the presence and absence of oil, which is favorable for maintaining injectivity near the wellbore. Foam injection at both low and high foam qualities (0.30 and 0.70) recovered all residual oil, with fewer pore volumes than baseline experiments (no surfactant solution), demonstrating more efficient utilization of CO2 and surfactant.
These findings provide guidance for field applications of CO2 foam in EOR and CO2 storage, including surfactant design and operational considerations, while also providing key input parameters for numerical foam models when upscaling from laboratory to field scale.

6. Future Work

Future studies should systematically investigate the effects of brine composition, salinity, surfactant type and concentration and oil presence on foam behavior. Testing reservoir-specific fluid on representative core materials, quantifying the influence of rock texture and wettability. Integrating core-flooding and in situ imaging techniques can improve residual oil assessments, addressing uncertainties introduced by stable oil–water emulsions. Expanding surfactant screening across salinities, concentrations, types and oil types will enhance field relevance. Interfacial tension measurements under reservoir conditions can evaluate entering, spreading and bridging coefficients, contributing to interpretation of impact of oil on foam. Reservoir-specific materials should be implemented in future studies in the presence of oil. Future work should include assessment of optimal foam quality robustness across a range of reservoir-specific conditions.

Author Contributions

Conceptualization, H.H.; methodology, H.H. and Z.P.A., investigation, H.H.; writing—original draft preparation, H.H.; writing—review and editing, H.H. and Z.P.A.; supervision, Z.P.A. and A.G.; funding acquisition, Z.P.A. and A.G. All authors have read and agreed to the published version of the manuscript.

Funding

This research was funded by the Norwegian Research Council project number 331644.

Data Availability Statement

The raw data supporting the conclusions of this article will be made available by the authors on request.

Acknowledgments

The authors acknowledge The Research Council of Norway, Centre for Sustainable Utilization of Energy Resources on the Norwegian Shelf and the industry partners.

Conflicts of Interest

The authors declare no conflicts of interest.

Abbreviations

The following abbreviations are used in this manuscript:
BPRBack Pressure Regulator
LELocal Equilibrium model
EOREnhanced Oil Recovery
MRFMobility Reduction Factor
PVPore Volume
BSBentheimer Sandstone
APPVApparent Viscosity
CCUSCarbon capture, Utilization and Storage
CCSCarbon capture and Storage
MMPMinimum Miscibility Pressure
fgFoam Quality (Gas fraction)

Appendix A

Appendix A.1

As noted in the Section 4, the foam quality and rate scan experiments produced all oil in the core in the first foam quality (fg = 0.30). Here we provide additional details on this production and discuss the uncertainty in determining the exact remaining oil saturation during subsequent stages. Following the waterflood, the Bentheimer cores retained an average residual oil saturation Sor of approximately 0.25 (averaged, varying 0.20 to 0.30 in different tests). Upon injecting the first slug of foam (fg = 0.30), we observed almost immediate production of oil. In the case of Troll crude, an oil bank was produced and oil-cut in the effluent spiked to nearly 100% briefly, indicating a mass of oil being mobilized. By the time 0.5 to 1.0 PV of foam solution had been injected, oil production tapered off to near-zero. We calculate that 100% of the initial oil (which was residual to waterflood) was recovered in this period. Similar behavior was seen with n-decane.

Appendix A.2

Measuring exactly how much oil remains in the core during foam flow is challenging. In our experiments, the effluent oil appeared as an emulsion (particularly in the presence of Troll crude oil). The effluent was a milky mixture of oil and water that did not fully separate, even after sitting in sample tubes. This suggests that a small portion of the oil was being produced in an emulsified form stabilized by surfactant. It also implies that some amount of oil can have been temporarily retained in the porous media as well as small droplets or as solubilized oil in the surfactant solution. Thus, while our material balance shows 100% recovery, there is an uncertainty range, as some oil may be effectively left in the core in a form that was not easily measured as free oil, or a small fraction might have remained trapped but was not distinguishable.

Appendix A.3

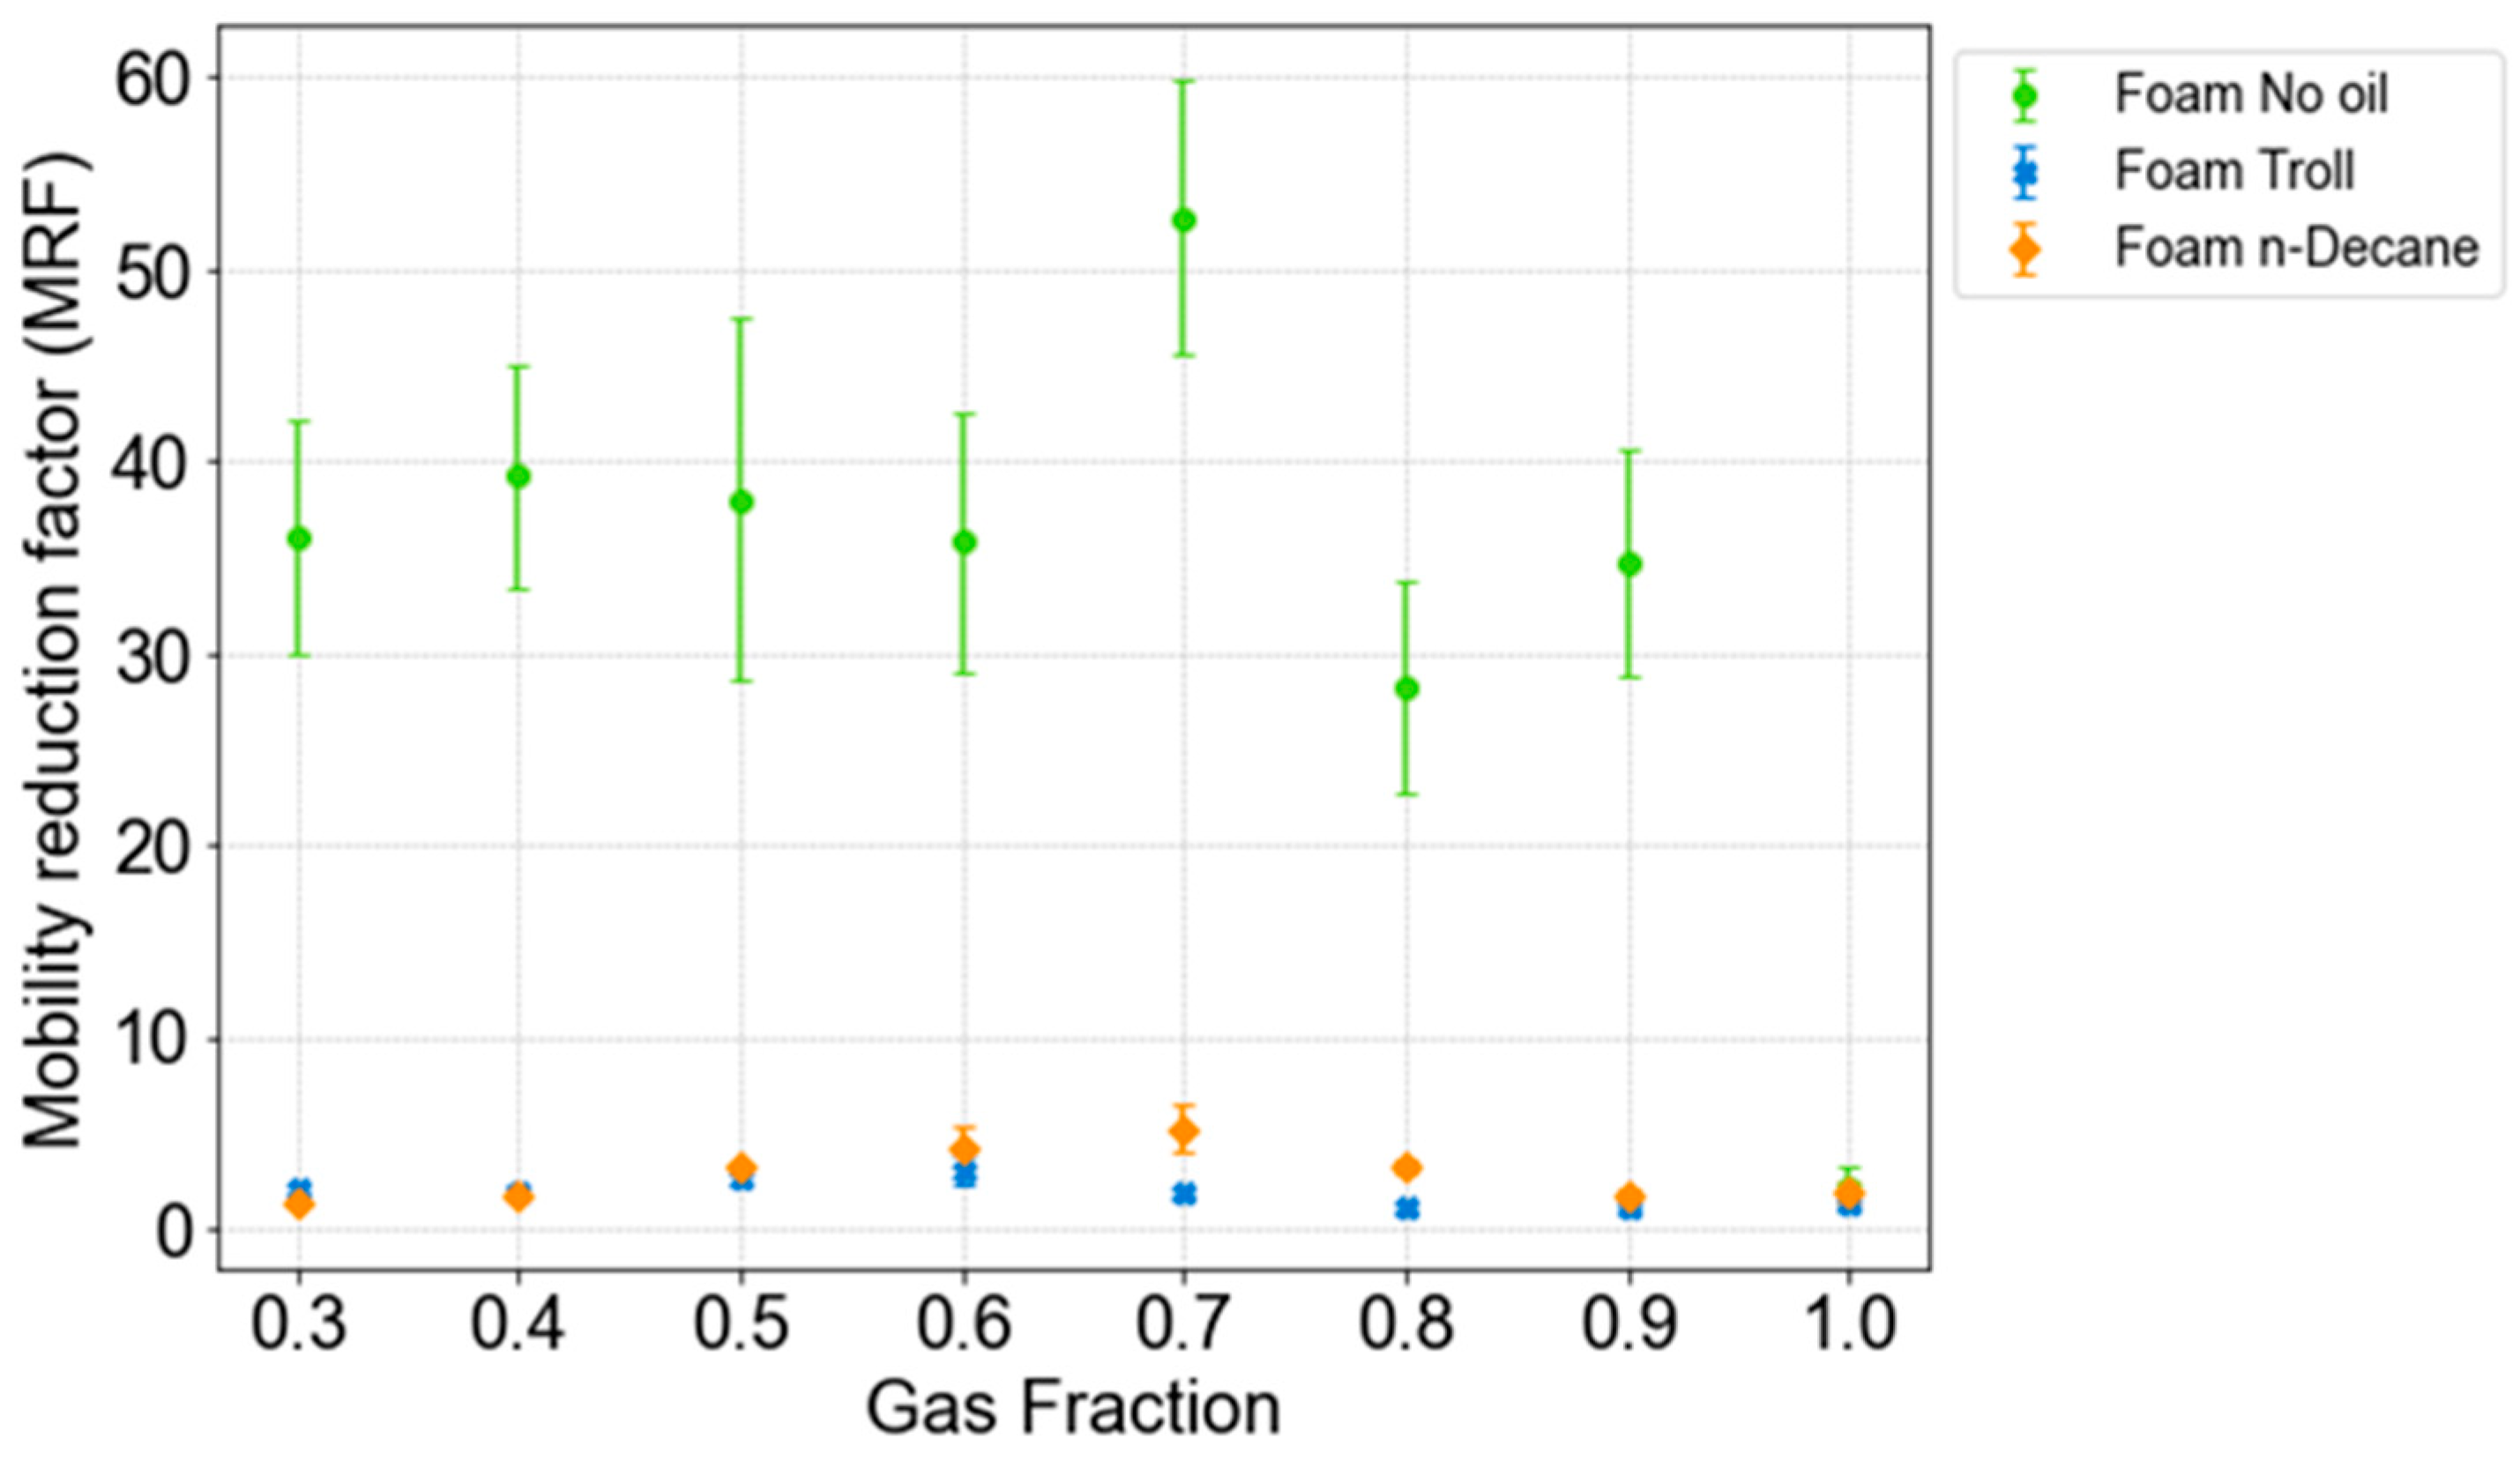
In Bentheimer sandstone core experiments, the apparent viscosity (APPV) is derived from measured pressure drop (∆P) at fixed injection rate and gas–liquid composition, using Darcy’s law. For each foam quality (fg = 0.30 to 1.0) we conducted foam tests (surfactant + CO2) under three conditions: with oil (Troll crude or n-decane) and without oil (no oil). Three baseline experiments (CO2 + brine) with no surfactant solution were also completed. Baseline apparent viscosity was calculated in the same core under identical flow conditions. We define mobility reduction factor (MRF) for each case and foam quality as: MRF = μ_foam/μ_baseline which quantifies how much foam increases flow resistance relative to the no-foam baseline.
Figure A1 shows MRF versus gas fraction for quality scans with oil (Troll crude: blue curve; n-decane: orange curve) and without oil (no oil: green curve). Foam without oil has a very high MRF (~30 to 50), indicating strong mobility reduction in Bentheimer sandstone. Foam with Troll crude has a moderate MRF (~2–4) at optimal foam quality (fg = 0.5 to 0.7), lower than pure foam due to oil destabilization. In the presence of n-decane the MRF is generally higher than Troll crude (MRF = 1.5 to 5), but much lower than without residual oil.
Figure A1. Mobility reduction factor versus foam quality with 0.10 wt.% foaming solution at 60 °C and 180 bar without residual oil (green curve) and with residual oil (n-decane: orange curve; Troll crude: blue curve). The results demonstrate higher mobility reduction factors in the absence of oil, which is expected due to the detrimental effect of oil on CO2 foams.
Energies 18 06227 g0a1

References

  1. Hanson, E.; Nwakile, C.; Hammed, V.O. Carbon capture, utilization, and storage (CCUS) technologies: Evaluating the effectiveness of advanced CCUS solutions for reducing CO2 emissions. Results Surf. Interfaces 2025, 18, 100381. [Google Scholar] [CrossRef] [Scilit]
  2. Dubey, A.; Arora, A. Advancements in carbon capture technologies: A review. J. Clean. Prod. 2022, 373, 133932. [Google Scholar] [CrossRef] [Scilit]
  3. Wang, F.; Kobina, F. The Influence of Geological Factors and Transmission Fluids on the Exploitation of Reservoir Geothermal Resources: Factor Discussion and Mechanism Analysis. Reserv. Sci. 2025, 1, 3–18. [Google Scholar] [CrossRef] [Scilit]
  4. Wu, J.; Ansari, U. From CO2 Sequestration to Hydrogen Storage: Further Utilization of Depleted Gas Reservoirs. Reserv. Sci. 2025, 1, 19–35. [Google Scholar] [CrossRef] [Scilit]
  5. Hanssen, J.E.; Holt, T.; Surguchev, L.M. Foam Processes: An Assessment of Their Potential in North Sea Reservoirs Based on a Critical Evaluation of Current Field Experience. In Proceedings of the SPE/DOE Improved Oil Recovery Symposium, Tulsa, OK, USA, 17–20 April 1994. [Google Scholar] [CrossRef]
  6. Chen, Z.; Chen, J.; Zhang, X. A comprehensive review of minimum miscibility pressure determination and reduction strategies between CO2 and crude oil in CCUS processes. Fuel 2025, 384, 134053. [Google Scholar] [CrossRef] [Scilit]
  7. Schramm, L.L.; Wassmuth, F. Foams: Basic Principles. In Foams: Fundamentals and Applications in the Petroleum Industry; American Chemical Society: Washington, DC, USA, 1994; pp. 3–45. [Google Scholar] [CrossRef] [Scilit]
  8. Hassanzadeh, A.; Katiyar, A.; Kalaei, H.; Pecore, D.; Schofield, E.; Nguyen, Q.P. A novel foam process with CO2 dissolved surfactant for improved sweep efficiency in EVGSAU field. Geoenergy Sci. Eng. 2023, 231, 212310. [Google Scholar] [CrossRef] [Scilit]
  9. Alcorn, Z.P.; Fredriksen, S.B.; Sharma, M.; Rognmo, A.U.; Føyen, T.L.; Fernø, M.A.; Graue, A. An Integrated Carbon-Dioxide-Foam Enhanced-Oil-Recovery Pilot Program With Combined Carbon Capture, Utilization, and Storage in an Onshore Texas Heterogeneous Carbonate Field. SPE Reserv. Eval. Eng. 2019, 22, 1449–1466. [Google Scholar] [CrossRef] [Scilit]
  10. Hoefner, M.L.; Evans, E.M.; Buckles, J.J.; Jones, T.A. CO2 Foam: Results from Four Developmental Field Trials. SPE Reserv. Eng. 1995, 10, 278–281. [Google Scholar] [CrossRef] [Scilit]
  11. Rossen, W.R.; Farajzadeh, R.; Hirasaki, G.J.; Amirmoshiri, M. Potential and Challenges of Foam-Assisted CO2 Sequestration. In Proceedings of the SPE Improved Oil Recovery Conference, Tulsa, OK, USA, 25–29 April 2022. [Google Scholar] [CrossRef] [Scilit]
  12. Kovscek, A.R.; Bertin, H.J. Foam Mobility in Heterogeneous Porous Media. Transp. Porous Media 2003, 52, 37–49. [Google Scholar] [CrossRef] [Scilit]
  13. Nguyen, Q.P.; Currie, P.K.; Zitha, P.L.J. Effect of Crossflow on Foam-Induced Diversion in Layered Formations. SPE J. 2005, 10, 54–65. [Google Scholar] [CrossRef] [Scilit]
  14. Kovscek, A.R.; Radke, C.J. Fundamentals of Foam Transport in Porous Media; Lawrence Berkeley National Lab.(LBNL): Berkley, CA, USA, 1993. [Google Scholar] [CrossRef] [Scilit]
  15. Kontogeorgis, G.M.; Kiil, S. Introduction to Applied Colloid and Surface Chemistry; John Wiley & Sons, Ltd.: Hoboken, NJ, USA, 2016. [Google Scholar]
  16. Schramm, L.L. Surfactants: Fundamentals and Applications in the Petroleum Industry; Cambridge University Press: Cambridge, UK, 2000. [Google Scholar]
  17. Hirasaki, G.; Zhang, D.L. Surface Chemistry of Oil Recovery From Fractured, Oil-Wet, Carbonate Formations. SPE J. 2004, 9, 151–162. [Google Scholar] [CrossRef] [Scilit]
  18. Morrow, N.R. Wettability and Its Effect on Oil Recovery. J. Pet. Technol. 1990, 42, 1476–1484. [Google Scholar] [CrossRef] [Scilit]
  19. Salathiel, R.A. Oil Recovery by Surface Film Drainage In Mixed-Wettability Rocks. J. Pet. Technol. 1973, 25, 1216–1224. [Google Scholar] [CrossRef] [Scilit]
  20. Schramm, L.L.; Mannhardt, K. The effect of wettability on foam sensitivity to crude oil in porous media. J. Pet. Sci. Eng. 1996, 15, 101–113. [Google Scholar] [CrossRef] [Scilit]
  21. Osterloh, W.T.; Jante, M.J., Jr. Effects of Gas and Liquid Velocity on Steady-State Foam Flow at High Temperature. In Proceedings of the SPE/DOE Enhanced Oil Recovery Symposium, Tulsa, OK, USA, 22–24 April 1992. [Google Scholar] [CrossRef]
  22. Ettinger, R.A.; Radke, C.J. Influence of Texture on Steady Foam Flow in Berea Sandstone. SPE Reserv. Eng. 1992, 7, 83–90. [Google Scholar] [CrossRef] [Scilit]
  23. Khatib, Z.I.; Hirasaki, G.J.; Falls, A.H. Effects of Capillary Pressure on Coalescence and Phase Mobilities in Foams Flowing Through Porous Media. SPE Reserv. Eng. 1988, 3, 919–926. [Google Scholar] [CrossRef] [Scilit]
  24. Lee, H.O.; Heller, J.P. Laboratory Measurements of CO2-Foam Mobility. SPE Reserv. Eng. 1990, 5, 193–197. [Google Scholar] [CrossRef] [Scilit]
  25. Farajzadeh, R.; Andrianov, A.; Bruining, H.; Zitha, P.L.J. Comparative Study of CO2 and N2 Foams in Porous Media at Low and High Pressure−Temperatures. Ind. Eng. Chem. Res. 2009, 48, 4542–4552. [Google Scholar] [CrossRef] [Scilit]
  26. Farajzadeh, R.; Andrianov, A.; Krastev, R.; Hirasaki, G.J.; Rossen, W.R. Foam–oil interaction in porous media: Implications for foam assisted enhanced oil recovery. Adv. Colloid Interface Sci. 2012, 183–184, 1–13. [Google Scholar] [CrossRef] [Scilit]
  27. Sheng, J.J. Chapter 11—Foams and Their Applications in Enhancing Oil Recovery. In Enhanced Oil Recovery Field Case Studies; Sheng, J.J., Ed.; Gulf Professional Publishing: Boston, IL, USA, 2013; pp. 251–280. [Google Scholar] [CrossRef] [Scilit]
  28. Rossen, W.R. Foam in Porous Media. In Foams and Emulsions; Sadoc, J.F., Rivier, N., Eds.; Springer: Dordrecht, The Netherlands, 1999; pp. 335–348. [Google Scholar] [CrossRef] [Scilit]
  29. Nikolov, A.D.; Wasan, D.T.; Huang, D.W.; Edwards, D.A. The Effect of Oil on Foam Stability: Mechanisms and Implications for Oil Displacement by Foam in Porous Media. In Proceedings of the SPE Annual Technical Conference and Exhibition, New Orleans, LA, USA, 5–8 October 1986; p. SPE-15443-MS. [Google Scholar] [CrossRef]
  30. Dalland, M.; Hanssen, J.E.; Kristiansen, T.S. Oil interaction with foams under static and flowing conditions in porous media. Colloids Surf. A Physicochem. Eng. Asp. 1994, 82, 129–140. [Google Scholar] [CrossRef] [Scilit]
  31. Hirasaki, G.J. The Steam-Foam Process. J. Pet. Technol. 1989, 41, 449–456. [Google Scholar] [CrossRef] [Scilit]
  32. Duerksen, J.H. Laboratory Study of Foaming Surfactants as Steam-Diverting Additives. SPE Reserv. Eng. 1986, 1, 44–52. [Google Scholar] [CrossRef] [Scilit]
  33. Lau, H.C.; O’Brien, S.M. Effects of Spreading and Nonspreading Oils on Foam Propagation Through Porous Media. SPE Reserv. Eng. 1988, 3, 893–896. [Google Scholar] [CrossRef] [Scilit]
  34. AlYousef, Z.; Gizzatov, A.; AlMatouq, H.; Jian, G. Effect of Crude Oil on CO2–Foam Stability. In Proceedings of the Offshore Technology Conference Asia, Kuala Lumpur, MA, USA, 2–6 November 2020; p. D031S029R004. [Google Scholar] [CrossRef] [Scilit]
  35. Schramm, L.L.; Novosad, J.J. Micro-visualization of foam interactions with a crude oil. Colloids Surf. 1990, 46, 21–43. [Google Scholar] [CrossRef] [Scilit]
  36. Arnaudov, L.; Denkov, N.D.; Surcheva, I.; Durbut, P.; Broze, G.; Mehreteab, A. Effect of Oily Additives on Foamability and Foam Stability. 1. Role of Interfacial Properties. Langmuir 2001, 17, 6999–7010. [Google Scholar] [CrossRef] [Scilit]
  37. Aveyard, R.; Binks, B.P.; Fletcher, P.D.I.; Peck, T.G.; Rutherford, C.E. Aspects of aqueous foam stability in the presence of hydrocarbon oils and solid particles. Adv. Colloid Interface Sci. 1994, 48, 93–120. [Google Scholar] [CrossRef] [Scilit]
  38. Denekas, M.O.; Mattax, C.C.; Davis, G.T. Effects of Crude Oil Components on Rock Wettability. Trans. AIME 1959, 216, 330–333. [Google Scholar] [CrossRef] [Scilit]
  39. Sharma, M. CO2 Mobility Control with Foam for Enhanced Oil Recovery and Associated Storage; Faculty of Science and Technology Institue of Energy Resources, University of Stavanger: Stavanger, Norway, 2019. [Google Scholar]
  40. Ma, K.; Lopez-Salinas, J.L.; Puerto, M.C.; Miller, C.A.; Biswal, S.L.; Hirasaki, G.J. Estimation of Parameters for the Simulation of Foam Flow through Porous Media. Part 1: The Dry-Out Effect. Energy Fuels 2013, 27, 2363–2375. [Google Scholar] [CrossRef] [Scilit]
  41. Nguyen, Q.; Hirasaki, G.; Johnston, K. Novel CO2 Foam Concepts and Injection Schemes for Improving CO2 Sweep Efficiency in Sandstone and Carbonate Hydrocarbon Formations; The University of Texas: Austin, Texas, USA, 2015. [Google Scholar] [CrossRef] [Scilit]
  42. Jian, G.; Puerto, M.C.; Wehowsky, A.; Dong, P.; Johnston, K.P.; Hirasaki, G.J.; Biswal, S.L. Static Adsorption of an Ethoxylated Nonionic Surfactant on Carbonate Minerals. Langmuir 2016, 32, 10244–10252. [Google Scholar] [CrossRef] [Scilit]
  43. Alcorn; Graue, A.; Karakas, M. CO2 Foam Pilot in a Heterogeneous Carbonate Reservoir: Analysis and Results. In Proceedings of the SPE Improved Oil Recovery Conference, Tulsa, OK, USA, 25–29 April 2022. [Google Scholar] [CrossRef] [Scilit]
  44. Lemmon, E.W.; Bell, I.H.; Huber, M.L.; McLinden, M.O. Thermophysical Properties of Fluid Systems; National Instritute of Standards and Technology: Gaithersburg, MD, USA, 2024. [Google Scholar] [CrossRef] [Scilit]
  45. Song, Y.-C.; Zhu, N.-J.; Liu, Y.; Zhao, J.-F.; Liu, W.-G.; Zhang, Y.; Zhao, Y.-C.; Jiang, L.-L. Magnetic Resonance Imaging Study on the Miscibility of a CO2/n-Decane System. Chin. Phys. Lett. 2011, 28, 096401. [Google Scholar] [CrossRef] [Scilit]
  46. Peksa, A.E.; Wolf, K.-H.A.A.; Zitha, P.L.J. Bentheimer sandstone revisited for experimental purposes. Mar. Pet. Geol. 2015, 67, 701–719. [Google Scholar] [CrossRef] [Scilit]
  47. Sæle, A.M.; Graue, A.; Alcorn, Z.P. The Effect of Rock Type on CO2 Foam for CO2 EOR and CO2 Storage. In Proceedings of the International Petroleum Technology Conference, Bangkok, Thailand, 28 February–2 March 2023. [Google Scholar] [CrossRef] [Scilit]
  48. Du, D.; Zitha, P.L.J.; Uijttenhout, M.G.H. Carbon Dioxide Foam Rheology in Porous Media: A CT Scan Study. SPE J. 2007, 12, 245–252. [Google Scholar] [CrossRef] [Scilit]
  49. Føyen, T.; Brattekås, B.; Fernø, M.A.; Barrabino, A.; Holt, T. Increased CO2 storage capacity using CO2-foam. Int. J. Greenh. Gas Control 2020, 96, 103016. [Google Scholar] [CrossRef] [Scilit]
  50. Almajid, M.M.; Kovscek, A.R. Pore-level mechanics of foam generation and coalescence in the presence of oil. Adv. Colloid Interface Sci. 2016, 233, 65–82. [Google Scholar] [CrossRef] [Scilit]
  51. Bergeron, V.; Fagan, M.E.; Radke, C.J. Generalized entering coefficients: A criterion for foam stability against oil in porous media. Langmuir 1993, 9, 1704–1713. [Google Scholar] [CrossRef] [Scilit]
  52. Benali, B.; Fernø, M.; Halsøy, H.; Alcorn, Z. A Pore-Level Study of Dense-Phase CO2 Foam Stability in the Presence of Oil. Transp. Porous Media 2024, 151, 2491–2509. [Google Scholar] [CrossRef] [Scilit]
  53. Pagán Pagán, N.M.; Zhang, Z.; Nguyen, T.V.; Marciel, A.B.; Biswal, S.L. Physicochemical Characterization of Asphaltenes Using Microfluidic Analysis. Chem. Rev. 2022, 122, 7205–7235. [Google Scholar] [CrossRef] [Scilit]
  54. Xiao, S.; Zeng, Y.; Vavra, E.D.; He, P.; Puerto, M.; Hirasaki, G.J.; Biswal, S.L. Destabilization, Propagation, and Generation of Surfactant-Stabilized Foam during Crude Oil Displacement in Heterogeneous Model Porous Media. Langmuir 2018, 34, 739–749. [Google Scholar] [CrossRef] [Scilit]
  55. Jensen, J.A.; Friedmann, F. Physical and Chemical Effects of an Oil Phase on the Propagation of Foam in Porous Media. In Proceedings of the SPE California Regional Meeting, Ventura, CA, USA, 8–10 April 1987; p. SPE-16375-MS. [Google Scholar] [CrossRef]
  56. Schramm, L.L.; Novosad, J.J. The destabilization of foams for improved oil recovery by crude oils: Effect of the nature of the oil. J. Pet. Sci. Eng. 1992, 7, 77–90. [Google Scholar] [CrossRef] [Scilit]
  57. Ceglie, A.; Das, K.P.; Lindman, B. Effect of oil on the microscopic structure in four-component cosurfactant microemulsions. J. Colloid Interface Sci. 1987, 115, 115–120. [Google Scholar] [CrossRef] [Scilit]
  58. Vikingstad, A.K.; Aarra, M.G.; Skauge, A. Effect of surfactant structure on foam–oil interactions: Comparing fluorinated surfactant and alpha olefin sulfonate in static foam tests. Colloids Surf. A Physicochem. Eng. Asp. 2006, 279, 105–112. [Google Scholar] [CrossRef] [Scilit]
  59. Prud’homme, R.K.; Khan, S.A. Foams, Theory: Measurments: Applications, 1st ed.; Routledge: New York, NY, USA, 1996. [Google Scholar] [CrossRef] [Scilit]
  60. Mohammed, I.; Al Shehri, D.; Mahmoud, M.; Kamal, M.S.; Alade, O.S. A Surface Charge Approach to Investigating the Influence of Oil Contacting Clay Minerals on Wettability Alteration. ACS Omega 2021, 6, 12841–12852. [Google Scholar] [CrossRef] [Scilit] [PubMed]
  61. Fredriksen, S.B.; Alcorn, Z.P.; Frøland, A.; Viken, A.; Rognmo, A.U.; Seland, J.G.; Ersland, G.; Fernø, M.A.; Graue, A. Surfactant Prefloods During Carbon Dioxide Foam Injection for Integrated Enhanced Oil Recovery in Fractured Oil-Wet Carbonates. SPE J. 2019, 24, 1139–1153. [Google Scholar] [CrossRef] [Scilit]
  62. Sanchez, J.M.; Schlechter, R.S.; Monsalve, A. The Effect of Trace Quantities of Surfactant on Nitrogen/Water Relative Permeabilities. In Proceedings of the SPE Annual Technical Conference and Exhibition, New Orleans, LA, USA, 5–8 October 1986; p. SPE-15446-MS. [Google Scholar] [CrossRef]
  63. Persoff, P.; Radke, C.J.; Pruess, K.; Benson, S.M.; Witherspoon, P.A. A Laboratory Investigation of Foam Flow in Sandstone at Elevated Pressure. In Proceedings of the SPE California Regional Meeting, Bakersfield, CA, USA, 5–7 April 1989; p. SPE-18781-MS. [Google Scholar] [CrossRef] [Scilit]
  64. Yaghoobi, H.; Heller, J.P. Laboratory Investigation of Parameters Affecting CO2-Foam Mobility in Sandstone at Reservoir Conditions. In Proceedings of the SPE Eastern Regional Meeting, Charleston, WV, USA, 8–10 November 1994. [Google Scholar] [CrossRef]
  65. Simjoo, M.; Rezaei, T.; Andrianov, A.; Zitha, P.L.J. Foam stability in the presence of oil: Effect of surfactant concentration and oil type. Colloids Surf. A Physicochem. Eng. Asp. 2013, 438, 148–158. [Google Scholar] [CrossRef] [Scilit]
  66. Zhang, L.; Bai, C.; Zhang, Z.; Wang, X.; Nguyen, T.V.; Vavra, E.; Puerto, M.; Hirasaki, G.J.; Biswal, S.L. Application of magnetic nanoparticles as demulsifiers for surfactant-enhanced oil recovery. J. Surfactants Deterg. 2023, 26, 401–408. [Google Scholar] [CrossRef] [Scilit]
Figure 1. Process lines are color-coded in the schematic: oil (green), CO2 (orange), aqueous solution (blue), confinement oil (gray) and main process lines (purple). The heating cabinet is located inside the skid.
Energies 18 06227 g001
Figure 2. Experimental procedure for foam quality and rate scans in the presence of residual oil. First, a primary drainage (in a 100% brine-saturated core) was performed followed by a waterflood, then, shown in green (a) foam quality scan starting at fg = 0.30 at 4 ft/day until steady state before increasing fg incrementally (blue); (b) rate scans starting at 16 ft/day with the optimal foam quality from the quality scan until steady state, then reduced to 12, 8, and 4 ft/day (red).
Energies 18 06227 g002
Figure 3. Experimental procedure for foam quality scan in the presence of residual oil. First, a primary drainage (in a 100% brine-saturated core) was performed followed by a waterflood (green) and co-injection of foaming solution and CO2 (blue) at 4 ft/day at either fg = 0.30 or fg = 0.70.
Energies 18 06227 g003
Figure 4. (a). Apparent viscosity versus gas fraction with 0.1 wt.% foaming solution at 60 °C and 180 bar without residual oil (green curve) and with residual oil saturation (n-decane: orange curve; Troll crude: blue curve). Baseline scans without foaming solution (black curves) illustrate the extent of mobility reduction. The data highlights the negative impact of oil on foam generation and the role of the oil phase in foam performance. (b). shows apparent viscosity versus injection velocity (4 to 16 ft/day). All foams exhibited shear-thinning behavior, while baseline cases were insensitive to injection velocity. Note: logarithmic scale is used for y-axis for foam quality scans.
Energies 18 06227 g004
Figure 5. Apparent viscosity versus gas fraction in the presence of Troll crude oil for foaming solution 1.0 wt.% (blue curve, stippled) and 0.10 wt.% (blue curve, solid), and in the presence of n-decane for foaming solution 1.0 wt.% (orange curve, stippled) and 0.10 wt.% (orange curve, solid) at 60 °C at 180 bar. Baseline for n-decane and Troll crude (black curves).
Energies 18 06227 g005
Figure 6. Recovery factor versus pore volume injected at foaming solution 0.10 wt.% for Troll crude (blue curves), n-decane (orange curves) and no foaming solution, baseline (black curves) at gas fractions 0.30 and 0.70.
Energies 18 06227 g006
Table 1. Fluid Properties.
FluidsCompositionDensityViscosityAPI Gravity
BrineNo foamNo foam
(n-decane)
No foam
Troll crude 1
No foam
Troll crude 2
CO2 (60 °C)22 ± 0.1025 ± 0.1024 ± 0.1018 ± 0.10
n-decaneC10H220.70.662.4
Troll crude0.10 wt.% Asphaltenes0.81.935.1
1.83 wt.% Paraffins
3.34 wt.% Napthenes
0.43 wt.% Benzene
1.03 wt.% Toluene
Table 2. Rock properties.
Core IDBS1BS2BS3BS4
ExperimentNo foamNo foam
(n-decane)
No foam
Troll crude 1
No foam
Troll crude 2
ϕ [%]22 ± 0.1025 ± 0.1024 ± 0.1018 ± 0.10
K [mD]2166 ± 0.202209 ± 0.202112 ± 0.202324 ± 0.20
L [cm]17 ± 0.1017 ± 0.1017 ± 0.1016 ± 0.10
PV [mL]44 ± 0.1046 ± 0.1042 ± 0.1033 ± 0.10
D [cm]3.8 ± 0.103.7 ± 0.103.7 ± 0.103.8 ± 0.10
Disclaimer/Publisher’s Note: The statements, opinions and data contained in all publications are solely those of the individual author(s) and contributor(s) and not of MDPI and/or the editor(s). MDPI and/or the editor(s) disclaim responsibility for any injury to people or property resulting from any ideas, methods, instructions or products referred to in the content.