Article

A GIS-Based Framework for Evaluating Technical and Economic Prospects of Onshore Wind Energy: Case Study of Poland

Division of Energy Economics, Mineral and Energy Economy Research Institute of the Polish Academy of Sciences, Wybickiego 7A, 31-261 Kraków, Poland
*
Authors to whom correspondence should be addressed.
Energies 2025, 18(23), 6230; https://doi.org/10.3390/en18236230
Submission received: 27 October 2025 / Revised: 20 November 2025 / Accepted: 25 November 2025 / Published: 27 November 2025
(This article belongs to the Special Issue Recent Advances in Renewable Energy Economics and Policy)

Abstract

The rapid global expansion of wind energy underscores the need for robust methods to assess its potential under diverse legal, spatial, and technical conditions. This study presents a Geographic Information System (GIS)-based framework designed to analyze land eligibility and evaluate the techno-economic potential of onshore wind energy. The developed approach combines regulatory, spatial, and technological factors to examine how turbine class and setback distances from residential buildings influence both technical feasibility and economic performance. The framework consists of two modules: (1) a land eligibility and turbine allocation module that accounts for spatial, legal, and technological restrictions and (2) a techno-economic assessment module estimating the Levelized Cost of Electricity (LCOE) using a standardized formulation consistent with methodologies adopted by international energy agencies. The method’s applicability is demonstrated through a comprehensive national case study of Poland, highlighting its potential for application in other regions and planning contexts. Results for Poland indicate that 3.11–3.72% of the country’s territory is suitable for turbine installation depending on the scenario. Relaxing setback restrictions (e.g., to 500 m) and deploying Class III (IEC) turbines significantly increase both technical and economic potential, reducing average generation costs by approximately €6/MWh compared to Class II turbines. Across all scenarios, the LCOE remains below €46/MWh. The developed GIS-based framework offers a versatile and transferable tool to support evidence-based national and regional strategies for the sustainable expansion of onshore wind energy.

1. Introduction

Achieving climate neutrality remains one of the most pressing global challenges of the twenty-first century. Regardless of the scale at which climate policies are implemented—whether international, national, or regional—a substantial and steadily increasing share of renewable energy constitutes an essential component of all decarbonization strategies. According to the International Energy Agency (IEA), achieving the Net Zero by 2050 targets requires renewables to account for 61% of total electricity generation by 2030 and 88% by 2050 [1]. Similarly, recent projections for the European Union (EU) by ENTSO-E (European Network of Transmission System Operators for Electricity) and ENTSOG (European Network of Transmission System Operators for Gas) Ten-Year Network Development Plans (TYNDP) indicate that a renewable energy share of approximately 80–90% in total electricity consumption is necessary to reach carbon neutrality by 2050, depending on the scenario considered [2]. These targets are especially challenging for countries such as China, India, and Poland and Germany in the EU, where energy systems have historically relied on fossil fuels [3,4,5].
In this context, wind energy plays a crucial role, not only due to its low levelized cost of electricity (LCOE), but also because of its potential for local generation, which enhances energy security and decreases reliance on fossil fuels [6,7]. Recent studies emphasize that onshore wind remains one of the most technically mature and cost-effective renewable technologies capable of delivering substantial capacity additions when spatial and regulatory conditions are favourable [6,8]. Consequently, despite the rapid expansion of onshore wind power both globally and across Europe, there is an increasing need to evaluate whether the share of wind energy required to fully transition away from fossil fuels can realistically be achieved under current policy and land-use constraints.
A key step in assessing wind power potential involves performing a land eligibility analysis using Geographic Information Systems (GIS) [9,10,11]. Identifying suitable areas for new wind turbines serves as the cornerstone for estimating both installable capacity and potential energy output [12,13], which subsequently provides the foundation for assessing the economic viability of onshore wind farms. Previous research has demonstrated that even at the early stage of excluding certain land categories, it is essential to consider the multidimensional aspects that govern wind energy development [14,15].
In this regard, land eligibility assessments must capture the interplay between spatial, legal, and technological constraints that collectively define the feasible scope for onshore wind expansion. Spatial factors include topography, proximity to existing infrastructure, and grid accessibility [16,17]; legal factors establish minimum allowable distances from protected areas and residential zones [18,19]; and technological factors concern the expected specifications and performance parameters of modern turbines—such as hub height, rotor diameter, and efficiency [13,20]. Integrating these dimensions enables a realistic estimation of the geographical, technical, and economic potential of wind energy under specific national conditions [15,16].
In this context, this article proposes a two-module GIS-based framework that enables an integrated assessment of the future potential of onshore wind energy. The approach combines land availability analysis with estimates of installable capacity, expected energy production, and generation costs, while considering spatial, legal, and technological restrictions. The framework is applied to the case of Poland to demonstrate its applicability and to verify its potential use in national-level planning processes. The selection of Poland as the case study is motivated by its substantial yet underexploited onshore wind potential, together with national energy policy targets and regulatory conditions that critically shape the country’s actual capacity for infrastructure development. A detailed discussion of previous works and the methodological gaps that motivate this study is provided in Section 1.1.

1.1. Related Research

The growing importance of assessing wind energy potential has driven research efforts to develop comprehensive methods for analyzing the factors influencing wind energy development. Recent studies have highlighted the use of GIS tools and data-driven approaches to evaluate spatial and regulatory conditions affecting wind energy potential.
Among recent studies, ref. [21] analyzed the spatial distribution of onshore wind farms in Cameroon by integrating the Analytic Hierarchy Process (AHP) with GIS tools. The authors adopted a comprehensive approach by considering technical factors (wind speed, terrain morphology), economic factors (proximity to the grid and roads), and social factors (distance from settlements, population density). In addition, they introduced five weighted criteria and performed a sensitivity analysis of these weights, facilitating the calibration of assumptions depending on the study’s objective. However, the study did not include an evaluation of energy generation potential or economic viability, and the weighting process was characterized by a considerable degree of subjectivity.
Similarly, ref. [22] proposed a method that accounts for the diversity of land exclusion criteria in a non-standard manner. The authors developed multiple scenarios based on various configurations of land eligibility restrictions, distinguishing between static and flexible parameters. The proposed model, combined with ERA5 data and 28 wind turbine power curves, enabled the calculation of the LCOE for wind energy in Indonesia. Although the approach provided valuable insights into the most favorable turbine siting locations, the authors did not address regulatory constraints relevant to turbine placement, and the employed LCOE formulation was specific to the case study considered.
In a related study, ref. [23] estimated the potential of onshore wind energy while incorporating climate impacts. The authors applied a Multi-Criteria Decision-Making (MCDM) approach combined with AHP, accounting for multiple categories of constraints, including technical, economic, social, and environmental factors. Historical and climate scenario data were used to evaluate land availability and calculate the LCOE, while also considering regional variations in wind speed across China and assigning weights to the criteria. The methodology therefore combined several analytical tools; however, it did not explicitly address the process of turbine placement or spatial allocation.
In recent years, several studies have focused on evaluating wind energy potential in Europe, as shown by [24]. This research examined both the technical and economic potential of onshore wind energy using a GIS-based method and cost–potential curves. After identifying suitable areas and applying land suitability factors (to account for areas partially appropriate for development), as well as selecting turbines from 60 possible configurations, the authors calculated the LCOE for wind energy. Their findings indicated an annual European potential of approximately 20 PWh, with costs ranging from 0.06 to 0.50 €/kWh. The countries with the highest potential and lowest LCOE were the United Kingdom, Poland, and Sweden. For Poland, the generation potential was estimated at nearly 1.5 PWh per year, with the entire output achievable at costs below 0.20 €/kWh. However, it should be noted that the wind speed extrapolation between different hub heights may have influenced the accuracy of the results. Additionally, the comprehensive scope of the analysis was achieved at the expense of omitting national regulatory constraints governing turbine siting.
The development prospects of onshore wind energy in Europe, considering the evolution of turbine technology, were examined by [20]. The authors proposed a methodology to determine the economic potential of wind energy, which included land eligibility analysis, turbine placement and characterization, simulation of turbine performance, and cost assessment of wind power plants. Turbine locations were selected based on land availability and the minimum required distance between turbines. By analyzing technological and meteorological trends, it was assumed that future turbines would be taller and have larger rotor diameters than those currently in use. Although the study mainly focused on Europe, it also reported data for individual European countries. For Poland, approximately 183,000 potential turbine locations were identified, with a total technical potential of nearly 2 PWh and 750 GW. The study also highlighted the projected decrease in the LCOE of wind energy by 2050—estimated not to exceed €0.06/kWh for most of Europe. However, it did not account for local factors such as legal or social barriers, focusing solely on cost-related and technological aspects.
In a later study, the authors of [9] used a similar land eligibility assessment method but supplemented their research with an estimation of the share of agricultural and forested areas within the total available land—calculated for Europe as 49% and 37% (for Poland 68% and 30%), respectively. It is worth noting that forest areas were often excluded in studies conducted by other authors [24,25,26]. The article also showed that the geographical potential of onshore wind energy is especially sensitive to factors such as minimum wind speed, maximum terrain slope, and distances from transmission lines and settlements. In both aforementioned studies, land availability constraints related to existing wind power plants were not considered. At the same time, these studies did not estimate the potential in terms of installable capacity, expected energy generation, or associated generation costs.
In a more recent work focused exclusively on Poland, ref. [25] demonstrated the high sensitivity of theoretical wind potential to variations in the permitted distance between wind turbines and residential buildings, based on analyses of eligible land area, maximum installable capacity, and expected electricity generation for different setback distances from dwellings (500 m, 700 m, 1000 m, 1200 m, 1500 m, and 2000 m). For the technical analysis, a single wind turbine model was adopted, with its spatial distribution defined similarly to the approach in [20]. Land availability decreased by approximately 45%, 80%, 90%, 97%, and over 99% compared to the 500 m scenario as the minimum setback distance increased. Despite these declines, the study concluded that wind energy in Poland still has very high potential—implementing a 1000 m buffer zone could theoretically meet about 91% of the country’s electricity demand. However, the author limited the analysis to land availability, installable capacity, and energy generation potential, without conducting an LCOE assessment.
A similar analysis was conducted by the authors of [27], whose primary objective was to assess the feasibility of meeting the EU’s climate policy goals by 2030. The study examined several potential setback distances between turbines and residential areas and considered two scenarios: one permitting turbine installation on forested land and another excluding it. Energy production simulations were performed using the technical parameters of existing turbines and approximately 600 turbine models to determine optimal configurations. Ultimately, areas with the lowest energy generation costs were selected, and turbines were geographically distributed to meet the EU’s renewable energy targets for future years. The study showed that Poland could reach its projected goals with a relatively low LCOE. However, expanding wind energy would require relaxing spatial restrictions to secure sufficient available land and gain greater social acceptance. It is important to note that the study used a simplified method for LCOE calculation and relied on low-resolution wind data (20 × 20 km), which may have impacted the accuracy of the results.
The study by the authors of [26] presented a methodology for identifying suitable wind farm locations in Poland by integrating theoretical wind potential with terrain-related factors (surface structure) and socio-spatial constraints (setback distances from residential areas). The authors used the multi-criteria decision-making tools AHP and TOPSIS, considering wind speed, distance to the transmission network, topography, and proximity to protected and populated areas. This approach allowed them to identify the most suitable turbine locations while accounting for existing installations, revealing that the available land constitutes 2.34% of Poland’s total territory and could potentially add 103.55 GW to the national power system. However, the results did not provide estimates of potential energy generation or generation costs. Additionally, the process lacked automation and did not incorporate turbine technical specifications into spatial allocation.
Building upon these spatial and technical assessments, ref. [19] offered a qualitative analysis of the multidimensional context of onshore wind energy development in Poland, focusing on legal and regulatory aspects related to new wind farm construction. The author pointed out that although Polish law lacks coherent and practical landscape protection instruments in the context of wind energy development, the absence of local spatial plans and lengthy, complicated planning procedures further hinder investment efforts.
Despite the diversity and advancement of methods employed in the aforementioned studies, several important research gaps remain. First, most studies rely on generalized assumptions that provide a strong basis for cross-country comparisons but fail to account for country-specific legal, spatial, and social factors influencing wind energy development. This limitation reduces their practical applicability for national planning and decision-making, despite their methodological value. Second, only a few approaches integrate the multidimensional aspects of wind energy within a single coherent model, often treating technical, economic, and regulatory factors separately. Third, many studies either omit LCOE calculations or apply formulations that are difficult to replicate or adapt to different contexts. Finally, although recent works have improved the understanding of spatial and regulatory constraints in Poland, they still lack a comprehensive, data-driven method that jointly evaluates spatial eligibility, turbine technology, and techno-economic feasibility. These shortcomings highlight the need for a reproducible and integrated GIS-based framework that simultaneously considers land eligibility, technical parameters, and LCOE evaluation. The present study addresses these gaps by developing and applying such a framework to the case of Poland, demonstrating its capacity to combine spatial, regulatory, and techno-economic analyses within a unified methodological approach.

1.2. Research Aim, Questions, and Contributions

Based on the reviewed literature, the observed disparity in estimated onshore wind energy potential can be attributed to methodological inconsistencies, limited integration of spatial, legal, and technological constraints, and the absence of standardized procedures linking land eligibility with economic assessments. Existing approaches often rely on oversimplified spatial exclusion criteria or neglect regulatory provisions that determine where turbines can legally be installed. Moreover, several studies assess either the technical or the economic potential of onshore wind energy in isolation, without accounting for the interdependence between legal constraints, technological parameters, and cost structures. As a result, their estimates frequently diverge and offer limited support for policy design, grid planning, or investment decisions.
Accurately quantifying the technical potential for onshore wind energy requires a comprehensive framework capable of representing these interconnections within a consistent methodological structure. This need is particularly relevant for countries where regulatory frameworks lag behind the pace required to achieve energy transition and decarbonization goals. In such contexts, spatial restrictions—such as minimum setback distances from residential areas, land-use exclusions, or environmental factors—can significantly reduce the available land for wind development and alter the economics of potential projects.
The novelty of this study lies in the development of an integrated GIS-based framework that unifies national regulatory constraints, high-resolution land eligibility analysis, and future turbine parameters, including larger rotor diameters, updated IEC classes, and wind-direction-based spacing rules, within a single techno-economic assessment. By embedding forward-looking turbine characteristics directly in the spatial allocation and LCOE evaluation, and by demonstrating the approach for the evolving regulatory context of Poland, the study delivers a robust and policy-relevant method for assessing national onshore wind potential.
The overarching aim of this study is to bridge the methodological gap between land eligibility analysis and economic feasibility evaluation by developing and demonstrating a comprehensive, data-driven assessment framework that integrates spatial, legal, and techno-economic dimensions of onshore wind energy assessment.
In line with this aim, this study explores the following key questions:
  • In countries where regulatory frameworks lag behind the pace required for decarbonization, how do distance restrictions between wind turbines and residential areas affect the development potential of onshore wind energy?
  • How does the selection of turbine technology influence the technical potential of wind energy?
  • How does the cost of energy production evolve with technological advancements and under varying regulatory conditions?
Unlike previous studies that examined these aspects independently or through generalized assumptions, the proposed framework explicitly incorporates regulatory constraints, site-specific turbine configurations, and economic feasibility criteria. It therefore provides a reproducible and policy-relevant methodology for evaluating national wind energy potential.
The contributions of this study are as follows:
  • It develops a GIS-based framework that supports land-use planning and infrastructure development through the assessment of land eligibility and the identification of suitable wind turbine locations. The framework estimates installable capacity and energy output while accounting for future turbine specifications (rotor size) and wind conditions (prevailing wind direction).
  • It integrates an economic feasibility component based on a Levelized Cost of Energy (LCOE) formulation that is methodologically robust, scalable across regions, and suitable for evaluating the financial performance of onshore wind energy within spatially eligible areas.
  • It demonstrates the proposed framework through a national-scale case study of Poland, analyzing multiple scenarios to quantify the share of eligible land, potential turbine numbers, total installable capacity, annual energy generation, and corresponding LCOE values.
The research activities in this study involve the development and implementation of a full GIS-based computational workflow, including data preprocessing, spatial exclusion modeling, turbine allocation procedures, and techno-economic evaluation. These activities also encompass scenario design, spatial analysis, turbine placement, and LCOE outputs for the Polish case study.
The remainder of this paper is structured as follows. Section 2 introduces the GIS-based analytical framework developed to evaluate land eligibility and conduct a techno-economic assessment of onshore wind energy. Furthermore, this section describes the datasets used in the study, along with the case study area and scenario assumptions. Section 3 presents the results of the spatial and techno-economic analyses, including estimates of the technically installable capacity and the corresponding levelized cost of electricity. Section 4 summarizes the main findings and discusses the methodological implications as well as the prospects for onshore wind energy deployment in Poland.

2. Materials and Methods

This section presents a spatio-temporal framework for identifying suitable areas for onshore wind farm deployment. The workflow comprises two stages: (i) a GIS-based land eligibility and turbine allocation stage, which identifies suitable land, assigns turbine locations, and determines installable capacity, and (ii) a techno-economic assessment stage, which estimates annual energy production and the LCOE for the chosen sites. It is important to note that the framework integrates high-resolution spatial data and techno-economic assumptions consistent with contemporary wind energy research. Additionally, this section introduces the study area, the datasets used, and the scenario assumptions applied in the analysis.

2.1. Computational Framework

With recent advancements in cloud computing and the surge in geospatial data availability, the development and use of GIS and big data platforms have become essential for assessing renewable resources and planning large-scale renewable infrastructure. As discussed in Section 1, the urgent need to decarbonize energy systems in recent years has driven the development of innovative approaches to de-risking renewable energy siting. In this context, this study develops a computational approach adaptable to diverse regional settings. The approach builds on the model previously developed by Benalcazar et al. for utility-scale PV installations [28] and on the works of [9,20], by incorporating turbine placement procedures, high-resolution spatial data related to wind power technologies, regulatory constraints, and techno-economic assumptions tailored to the current Polish context. The framework also follows an LCOE breakdown consistent with those commonly adopted by international and national energy agencies [29,30].
Furthermore, using Poland as a case study, this research addresses two key aspects of the current public discourse on wind energy development. First, the computational model includes a module that evaluates land suitability by applying exclusion constraints based on local technical, economic, and regulatory conditions, allowing for the estimation of the total area suitable for potential onshore wind turbine deployment. Second, the approach includes a module that estimates the technical potential for onshore wind turbine capacity across the country, taking into account the trend toward larger turbines with higher power ratings and/or optimized for low-to-moderate wind speeds—particularly evident in Europe and China. Figure 1 provides an overview of the method used in this study.
A key factor in deploying onshore wind power is identifying suitable sites where land use and environmental conditions support development while complying with legislation. To achieve this, this study employs a computational method that conducts two separate procedures—one for raster datasets and another for vector datasets—that convert exclusion constraints, buffer zones, and land specifications into binary values. This process produces a Boolean map in raster format with a spatial resolution of 100 m.
Although the framework is designed to generate the Boolean map in a single computational step, avoiding repeated processing for each data layer, it also enables the analysis of how land availability changes at each successive exclusion stage. It is important to note that eligibility constraints are a major source of variation across studies. As a result, several international research efforts emphasize the need to establish common frameworks for land eligibility constraints [31,32]. Consequently, even locally developed frameworks—as opposed to those established at the European level—can facilitate meaningful comparisons between studies and make replication more straightforward.
This paper aligns the exclusion constraints with established literature and prevailing practices while also accounting for relevant national regulatory requirements. Beyond identifying suitable sites for wind power, the computational method enables the evaluation of potential technical capacity scenarios using representative reference turbines that could be deployed in the future. As power ratings for land-based wind turbines increase—for example, from Poland’s current average of around 2–3 MW to 6 MW turbines, in line with global trends [29,33]—there is a growing need to assess the available power potential within administrative units. In this regard, the method also supports a geospatial assessment of both the number and distribution of turbines that can be installed within eligible areas, taking into account their geometric dimensions.
The spacing between adjacent turbines is determined based on the predominant wind direction across the analyzed region (in this case, at the national level) and is expressed as a multiple of the rotor diameter, which characterizes each turbine model. The framework assumes uniform power and geometric characteristics for turbines within a single International Electrotechnical Commission (IEC) class. After positioning the turbines within the study area while maintaining the minimum spacing along both the dominant and crosswind axes, an eligibility check is performed. Ultimately, only turbines located in areas classified as available are included in the estimation of onshore wind power potential.
The implementation of the GIS-based procedure described above serves as the basis for calculating annual electricity production (AEP)—both at individual turbine sites and across the entire country. Spatial variation in wind conditions across the study area is captured by assigning each turbine site to a 250 m resolution raster cell containing data on that cell’s average annual capacity factor. The equation used to calculate the annual energy output of a single wind turbine is given in Equation (1).
AEP   =   C   ·   CF   ·   8760
The value of AEP, determined from the rated power of an individual turbine (C) installed within the eligible land area and the capacity factor (CF), is used to assess both the technical and economic potential. The main economic indicator used to evaluate the cost performance of the analyzed wind installations is the LCOE. Its estimation is performed using Equation (2), following the method described in [29], where CAPEX represents investment costs (including grid connection and overnight capital expenditures), and OPEX denotes operational expenses. In the present study, grid-connection costs are treated as spatially uniform due to the lack of publicly available, high-resolution datasets describing their spatial distribution.
LCOE   =   C   ·   ( CAPEX   ·   FCR   +   OPEX ) AEP
Aligned with this study’s contributions, the formulated LCOE provides a clear and consistent representation of the key cost components, reflecting the overall economic performance of the analyzed installations. Its generalized formulation allows the equation to be easily adapted to different spatial and regulatory contexts, enabling comparative and large-scale techno-economic evaluations of onshore wind energy.
The Fixed Charge Rate (FCR), which converts total capital investment into an equivalent annualized cost—ensuring consistency with the AEP in Equation (2)—represents the portion of annual revenues needed to cover all carrying costs associated with the investment (including financing, taxes, and depreciation), as defined in Equation (3).
FCR   =   CRF   ·   ProFinFactor
The Capital Recovery Factor (CRF) is a common economic measure used to determine the recovery of an initial investment through equal annual payments over the project’s lifetime. The CRF, shown in Equation (4), converts capital expenditure into an equivalent series of annualized costs, where i represents the discount rate and A denotes the project lifetime [34]. The Project Finance Factor (ProFinFactor) reflects the ratio of the LCOE for a project financed under typical project finance assumptions to that of an equivalent project financed through corporate finance assumptions.
CRF   =   i   ·   ( 1 + i ) A ( 1 + i ) A     1
This framework, when paired with suitable input data, serves as a flexible tool for analyzing any geographical region. This study demonstrates its application using the case of Poland, whose regulatory, economic, and meteorological characteristics are described in the next section. A pseudocode summarizing the full workflow is included in Appendix A.

2.2. Study Area

The applicability of the developed framework is demonstrated through a case study of Poland, a Central European country with diverse wind conditions ranging from high wind energy potential in the northern and coastal areas to moderate conditions in the central and southern regions. Currently, the country has over 5000 onshore wind turbines [35] with a total installed capacity of 10.39 GW [36]. Although the share of renewable energy sources in Poland’s energy mix continues to grow, the country still faces regulatory challenges related to onshore wind development. Since 2023, a revised version of the Wind Farm Investment Act has been in effect, setting the minimum distance between wind turbines and residential buildings at 700 m, compared to the previous rule requiring a distance equal to ten times the turbine’s total height. Additionally, discussions are ongoing about a further reduction to a 500 m rule [37]. Poland’s ambitious energy transition targets are reflected in the National Energy and Climate Plan (NECP), which projects a total installed wind capacity of approximately 20–35 GW by 2040, depending on the scenario [38].
Despite the already significant installed capacity, Poland’s onshore wind sector still exhibits considerable technical and economic potential, as reflected in the national energy policy targets. The purpose of this study is therefore to identify additional areas suitable for future wind energy development without modifying or relocating the sites of existing wind farms. The combination of favorable climatic conditions, a relatively large land area, the availability of high-resolution spatial data, and ongoing regulatory changes makes Poland a representative and timely case study for demonstrating the functionality of the GIS-based framework developed to assess the technical and economic potential of onshore wind energy.

2.3. Datasets

The calculations were based on GIS data concerning topographic features, land cover types, wind conditions, and the capacity factors of wind turbines across Poland. For clarity, the datasets (listed in Table 1, together with information on their sources) corresponding to individual categories are hereinafter referred to as layers. For the layers representing excluded areas, a buffer zone was defined to approximate the actual spatial limitations for the siting of new wind power plants.
The capacity factor (CF) data were obtained from the Global Wind Atlas v3 (DTU Wind Energy/World Bank), which provides long-term mean wind conditions derived from ERA5 reanalysis data for the 2008–2017 period, with full national coverage. To maintain spatial consistency with the turbine layout, each turbine location was overlaid on the 250 m resolution CF raster, and its corresponding value was extracted using nearest-neighbor point sampling [16]. Consequently, all subsequent calculations performed according to Equations (1)–(4) were conducted at the native 250 m resolution. However, the graphical presentation in the Section 3 shows spatially aggregated indicators to emphasize regional patterns and ensure clarity at the national scale; hence, visually uniform regions reflect intentional averaging for presentation purposes rather than the granularity of the underlying computational workflow.
The buffer distances applied for national parks, nature reserves, extra-high-voltage transmission lines, and residential buildings (in the baseline scenario) were determined in accordance with current national legislation [43]. The geometric parameters of wind turbines (hub height and rotor diameter) were based on data used in [42] to determine power coefficients for individual turbine classes, defined according to the IEC 61400-1 standard [44,45]. The classification of turbines was also applied to define their reference rated power—assumed as 2 MW for class II and 3 MW for class III—corresponding to the average values characterizing existing wind farms described in [46]. Additionally, parameters required for LCOE calculations were adopted from the Wind Energy Cost Review (2024) [29]. A summary of the techno-economic parameters used in this study is presented in Table 2.

2.4. Scenarios

The set of scenarios considered in the analysis was designed to evaluate the impact of selected technical and regulatory parameters on wind energy potential in Poland. All possible configurations of the parameters listed in Table 3 were included. The minimum distance between turbines was defined as five or eight times the rotor diameter in the prevailing wind direction across the country, and three or four times the rotor diameter in the perpendicular direction, following the approaches implemented in similar studies [20,25,42]. The prevailing wind direction was assumed to be west, in accordance with the literature [25,47].
To assess the impact of the Wind Farm Investment Act, three minimum setback distance values from residential buildings were examined: a baseline setback (the currently mandated distance of 700 m) and two additional variants representing potential future regulatory relaxations (intermediate setback (600 m) and low-distance setback (500 m)). Additionally, the analysis of onshore wind energy prospects, accounting for advancements in wind turbine technology, is based on two IEC turbine classes (II and III), which are most likely to be deployed in the near future due to their suitability for the moderate wind conditions typical of Central Europe.

3. Results

This section provides an overview of the results obtained from applying the developed framework to the case study of Poland, aimed at conducting a geospatial assessment of the conditions and prospects for onshore wind energy development. The outputs generated by the framework enable a comprehensive evaluation of both the geographical distribution of suitable areas and the magnitude of the national wind energy potential. Specifically, the results include indicators describing the available land, the number and capacity of potentially installable turbines, the corresponding annual energy yield, and the resulting LCOE. Together, these outcomes illustrate the spatial extent and economic feasibility of onshore wind deployment under varying regulatory and technological assumptions, enabling the identification of regions with the highest development potential.
Furthermore, these outputs directly support the study’s objective of integrating spatial, regulatory, and techno-economic parameters within a unified GIS-based assessment. They provide a quantitative basis for addressing the research questions introduced in Section 1, allowing the interactions between planning regulations, turbine technology, and economic performance to be examined consistently across Poland. A summary of the main quantitative results is presented in Table 4. The following sections present a detailed analysis of land eligibility (Section 3.1), technical potential (Section 3.2), and energy production costs (Section 3.3).

3.1. Land Eligibility

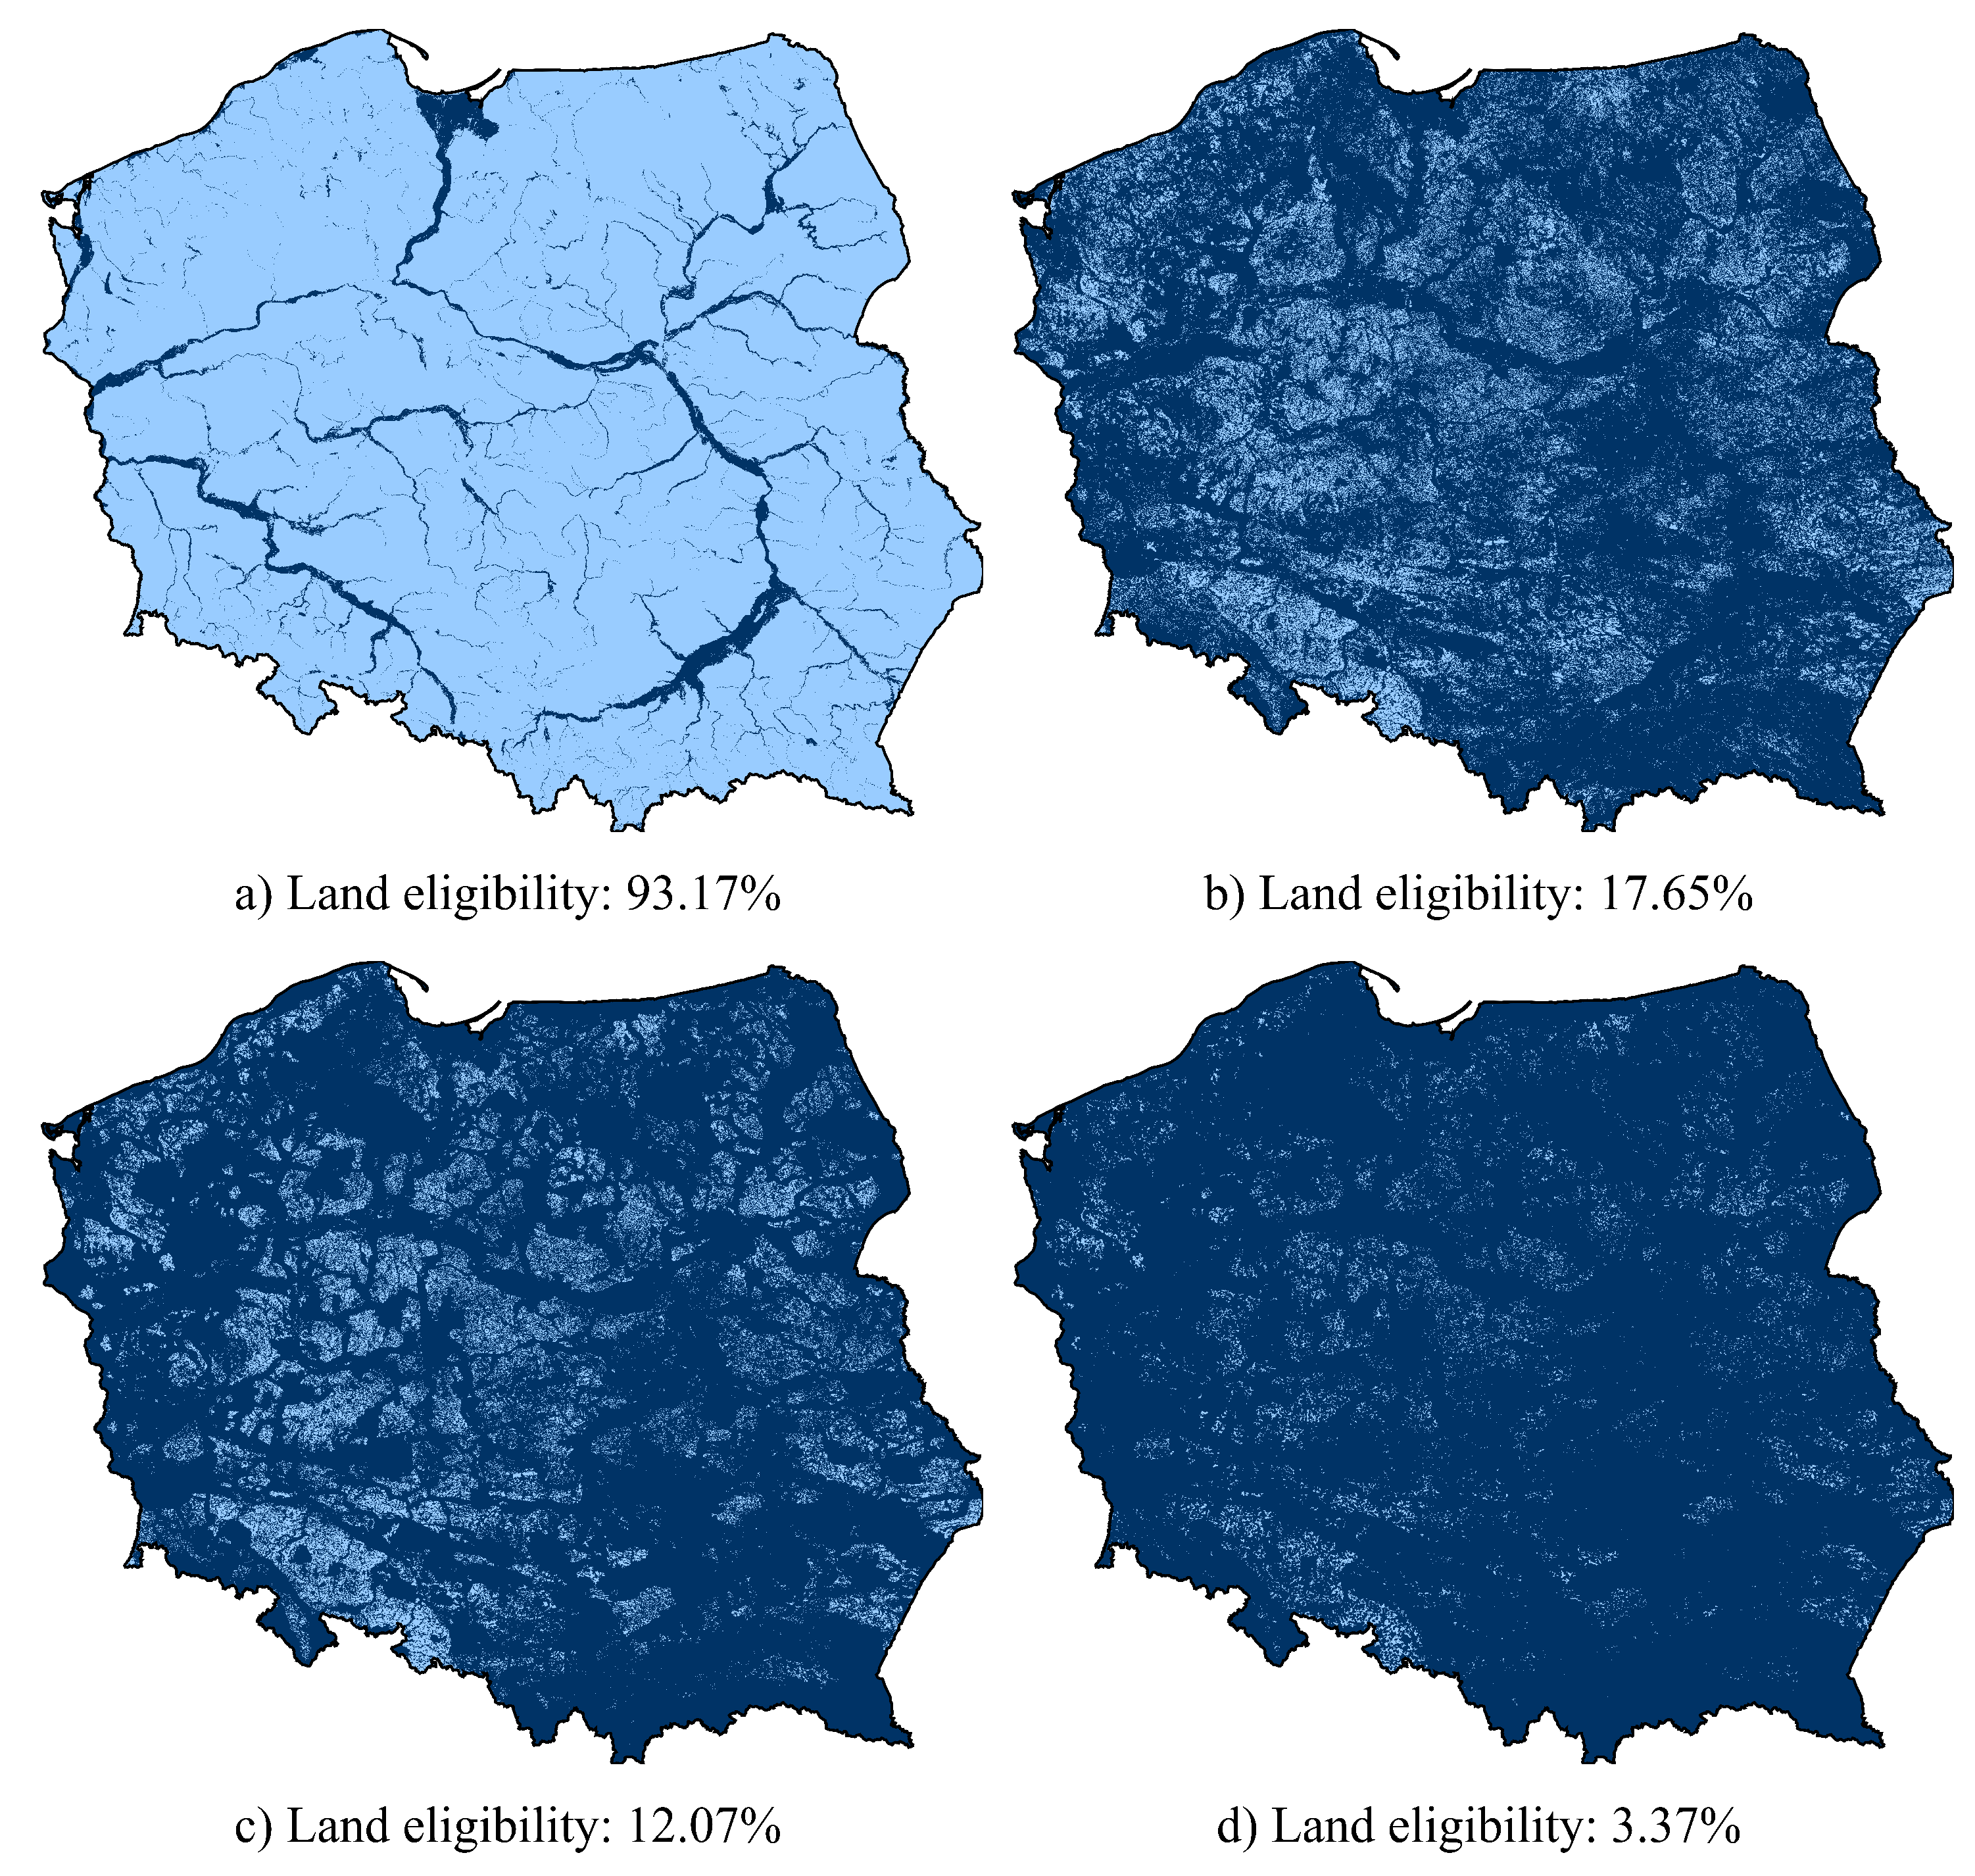
The land eligibility assessment is the first quantitative result derived from applying the framework, showing the outcome of excluding all considered GIS layers. The iterative process allows for tracking intermediate stages of terrain suitability. Selected stages of excluding individual GIS layers for the scenario with a minimum distance of 700 m from residential buildings and turbine Class III are presented in Figure 2. Figure 2a illustrates land availability (in light blue) after the first round of exclusions, which accounts for flood hazard areas as well as regions of high elevation and slope (in dark blue). The combined share of these excluded areas in Poland’s total surface amounts to 6.83%. Figure 2b presents the result of combining the previously mentioned exclusions with areas covered by forests, inland waters, wetlands, reeds, rivers, water streams, channels, drainage ditches, and permanent crops. It is worth highlighting that at this stage—following the order of the listed land cover types—the most significant decrease in land eligibility occurs after processing the forest layer, amounting to 174,812 km2, which corresponds to approximately 56% of the country’s total area. The difference between the land availability shown in Figure 2b,c results from the application of formal environmental constraints (i.e., the exclusion of all areas identified in the GDEP database). The effect of the exclusion constraints considered in this study—while disregarding minor areas smaller than 4 ha—is shown in Figure 2d. It should be noted that the criterion of minimum mean annual wind speed does not affect land eligibility, as the lowest value within the identified available area of Poland exceeds 4 m/s [42].
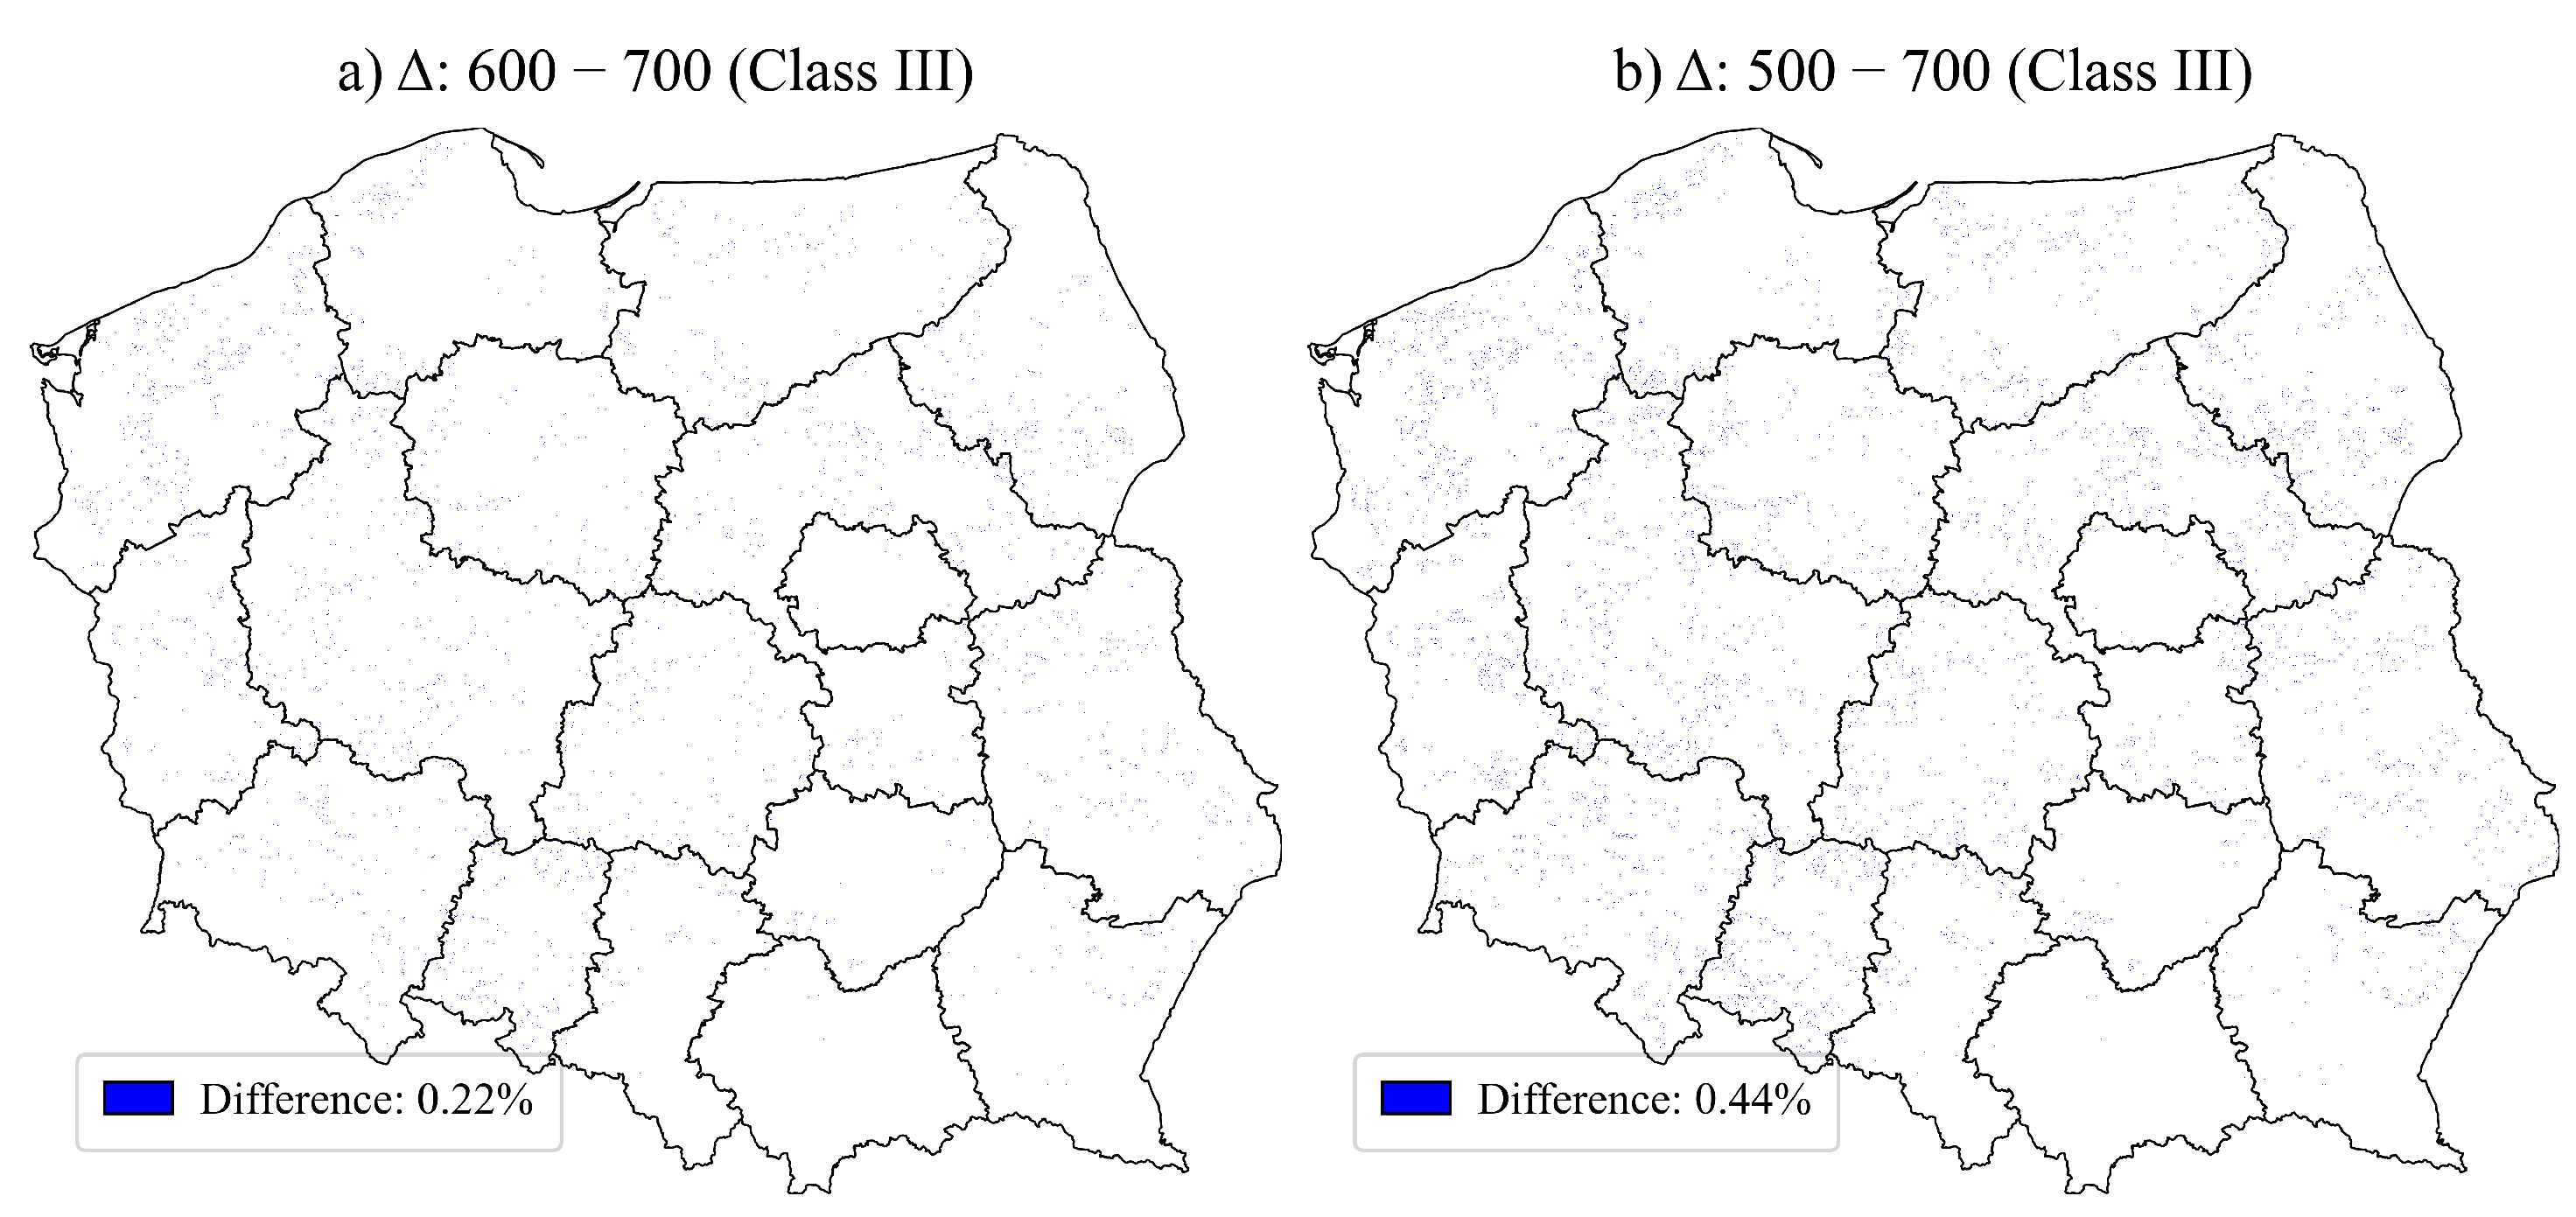
Furthermore, the results show that between 3.11 and 3.72 % of Poland’s total area—equivalent to 9700–11,600 km2—is suitable for wind turbine installations depending on the scenario considered. The available land decreases as the minimum legal distance between turbines and residential buildings increases. For instance, reducing the current setback by 100 m increases the suitable area by 7.1% for both Class II and Class III turbines, while a 200 m reduction leads to increases of 14.5% and 14.1%, respectively. Differences are also observed between turbine classes: Class III turbines have a smaller potential area due to the buffer zones defined for certain spatial layers (Table 1). The geographical distribution of suitable land under the 700 m setback–Class III scenario, representing the outcome of the multi-stage exclusion process shown in Figure 2, is presented in Figure 3. The highest concentration of suitable cells is found in the west-central regions of Poland. These results reflect the completion of the spatial eligibility analysis, which included the full implementation of all exclusion layers and buffer constraints defined in Section 2.3. The findings address the first research question, confirming that regulatory constraints—particularly the minimum setback distance from residential buildings—play a crucial role in determining both the amount and the spatial distribution of land suitable for wind development. This outcome illustrates how spatial and legal conditions jointly shape the technical potential of onshore wind energy, validating the framework’s capability to represent regulatory impacts at the national scale.
Differences in land availability resulting from the reduction of the minimum distance between wind turbines and residential buildings are presented in Figure 4. Although the figure and the proportion of affected areas may suggest a minor impact, the results for installed capacity potential and annual energy production indicate that the differences between the 700 m, 600 m, and 500 m scenarios are substantial, as shown in Table 4.

3.2. Number of Placements, Capacity and Energy Generation Potential

An additional feature of the developed framework is the estimation of the number of turbines that can be installed on the designated eligible land. The potential wind turbine locations are determined by several factors—such as the distance criteria from residential buildings, the turbine class considered, and the method used to define the minimum spacing between turbines.
The use of two different spacing definitions from the literature (8×/4× and 5×/3×) shows a significant effect of turbine-to-turbine distance on the overall energy potential of installations. Increasing the spacing between turbines by three rotor diameters in the prevailing wind direction and by one rotor diameter in the perpendicular direction results in more than a twofold reduction in the number of possible turbine locations. This change directly leads to a decrease in achievable installed capacity and technical potential. The turbine siting outcomes confirm that the turbine-allocation procedure, including spacing rules and class-specific geometric parameters, was carried out as specified in Section 2.1. As a result, the highest technical potential—both in total installed capacity and annual energy production—and the largest number of placements within scenarios including only Class III turbines were found in the 5×/3×–500–III scenario. This confirms that increasing turbine density, reducing the setback distance from residential buildings to 500 m, and using Class III turbines have a positive impact on onshore wind energy potential in Poland. Furthermore, the estimates of annual energy production demonstrate that capacity-factor assignment and raster-based production calculations were fully executed for all eligible turbine locations.
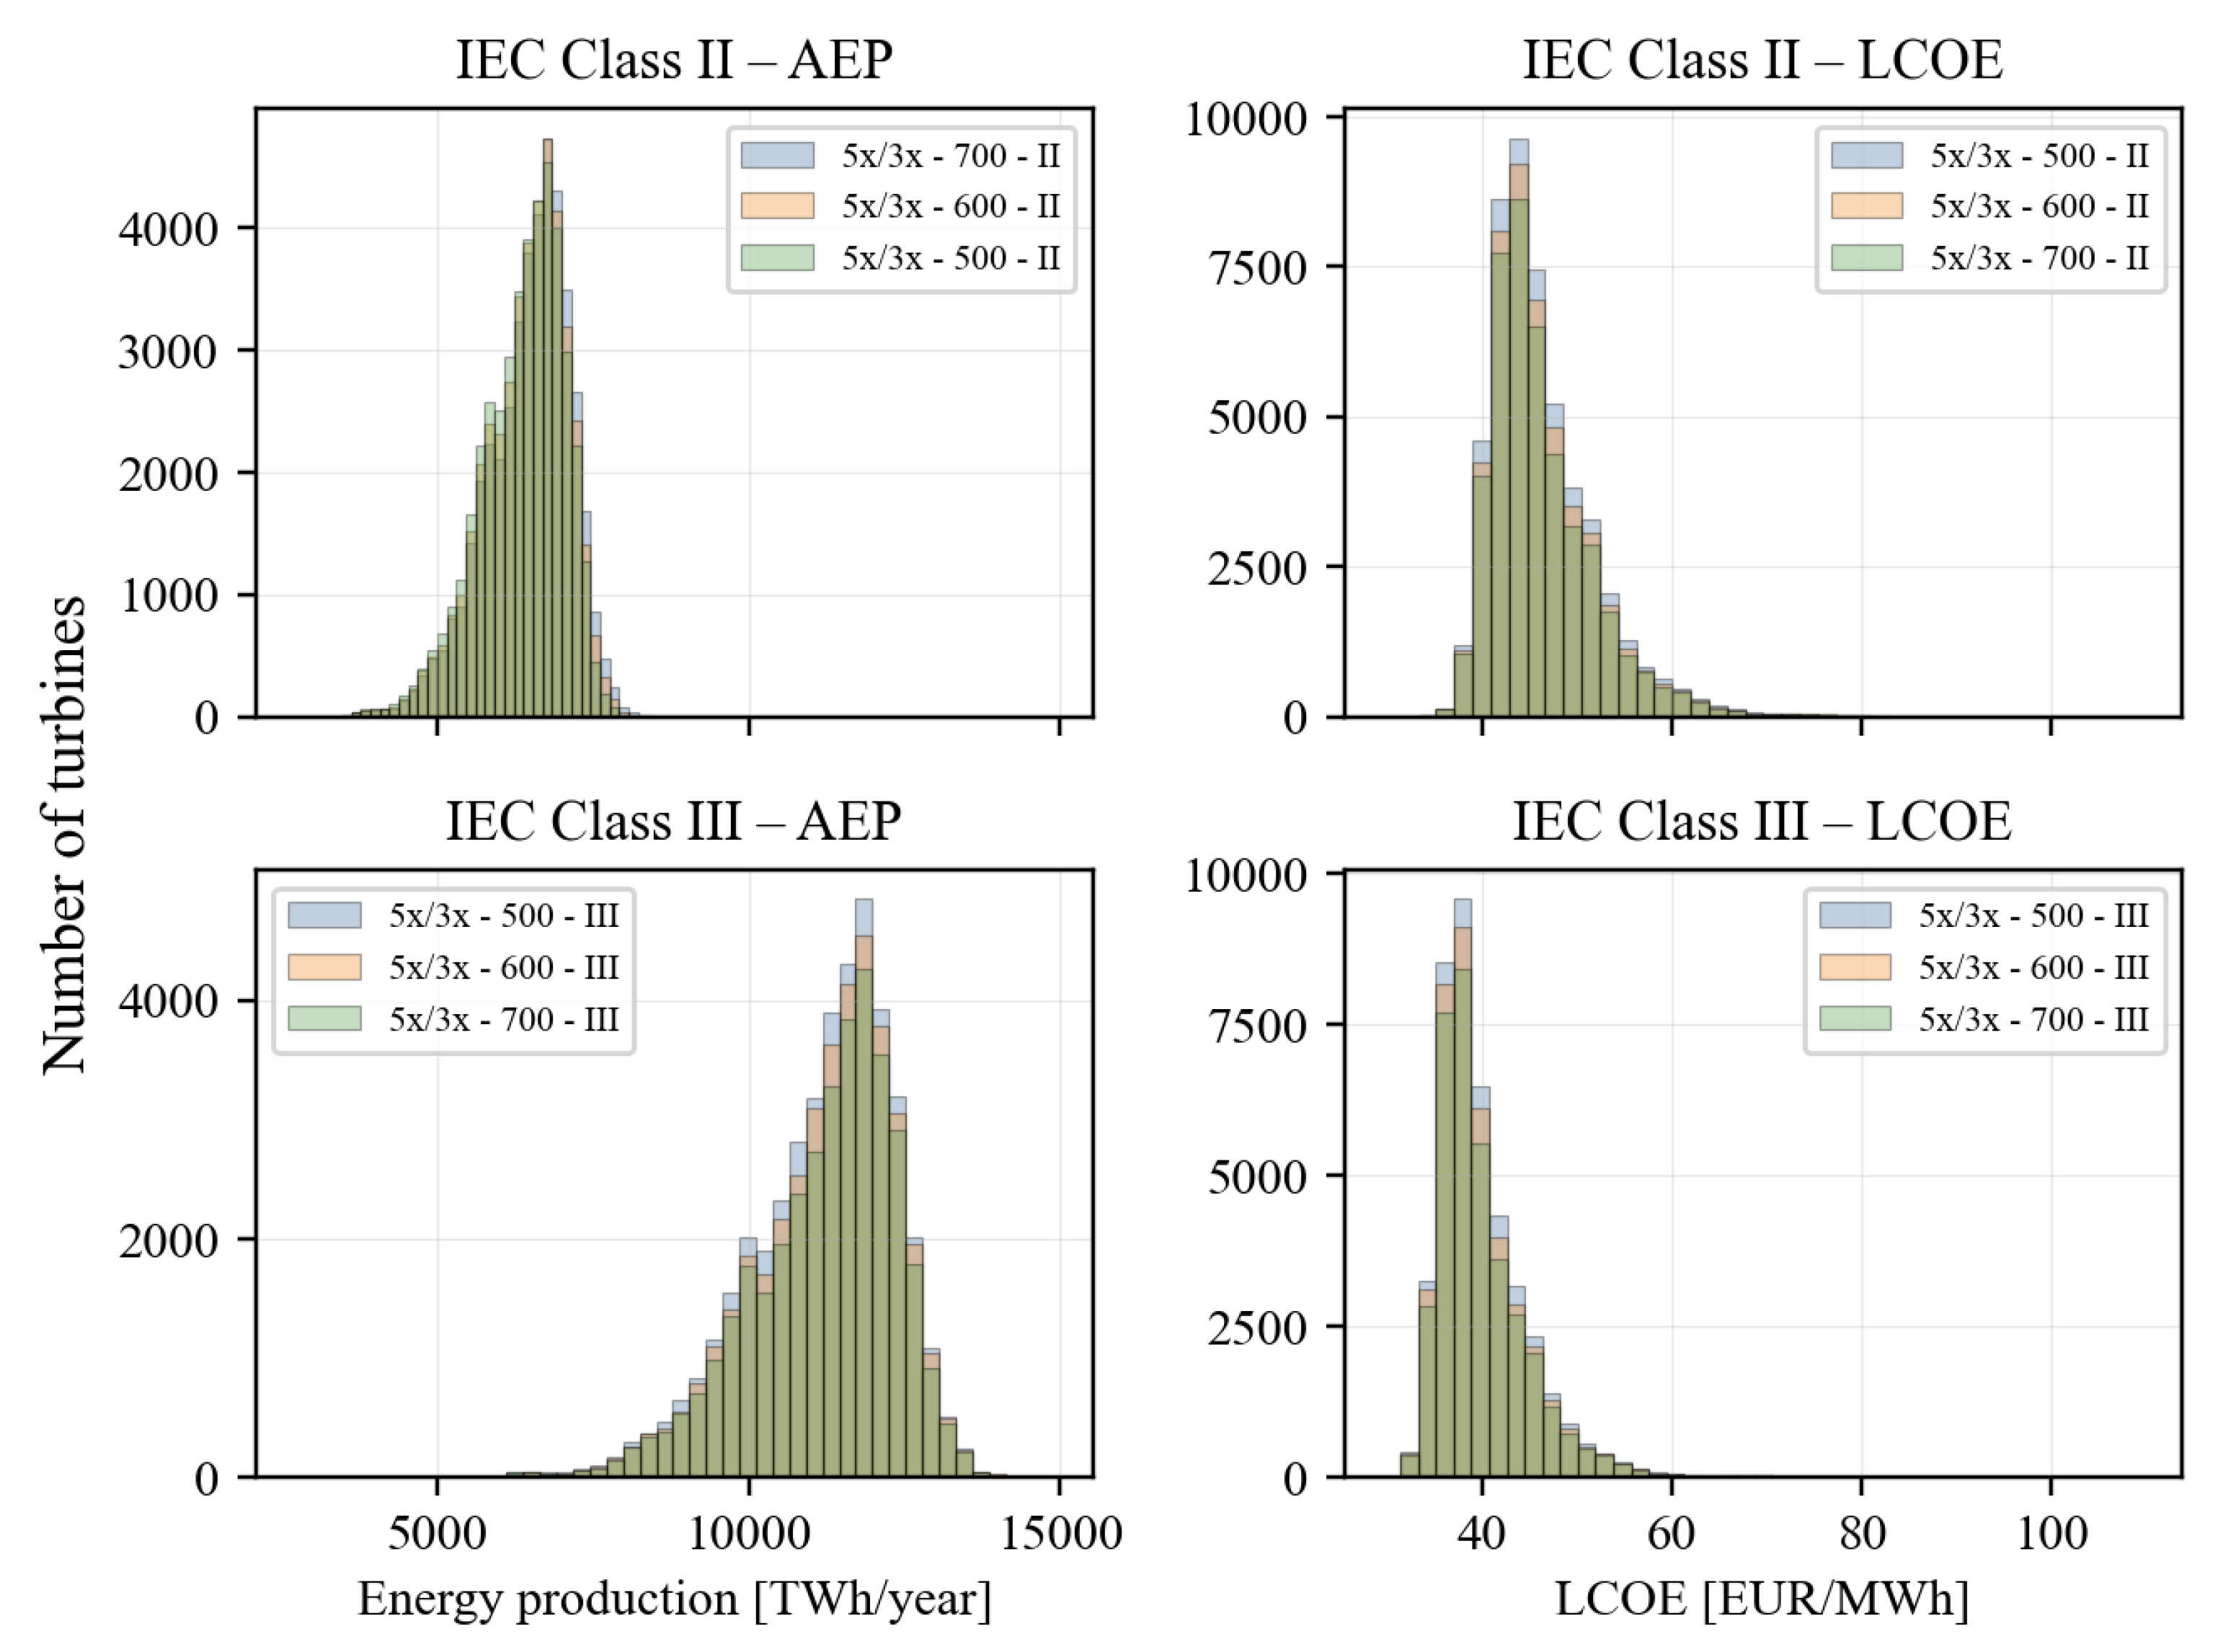
The distribution of annual energy production for different setback distances from residential buildings and turbine classes is shown by the histograms in Figure 5. For Class II turbines (top left panel), the spread of values is noticeably narrower, and the most frequent capacity factor is approximately 0.39, while for Class III turbines (bottom left panel), it is around 0.45. This suggests that Poland has the potential to achieve significantly higher energy yields when using Class III turbines. The left-skewed shape of the histograms indicates more locations with lower energy production compared to the most frequent value, leading to a difference between the average and the mode. Another key observation is that as the distance from residential buildings decreases, the frequency of lower energy production values increases—especially for Class II turbines, as shown by the left tail of the top left panel.
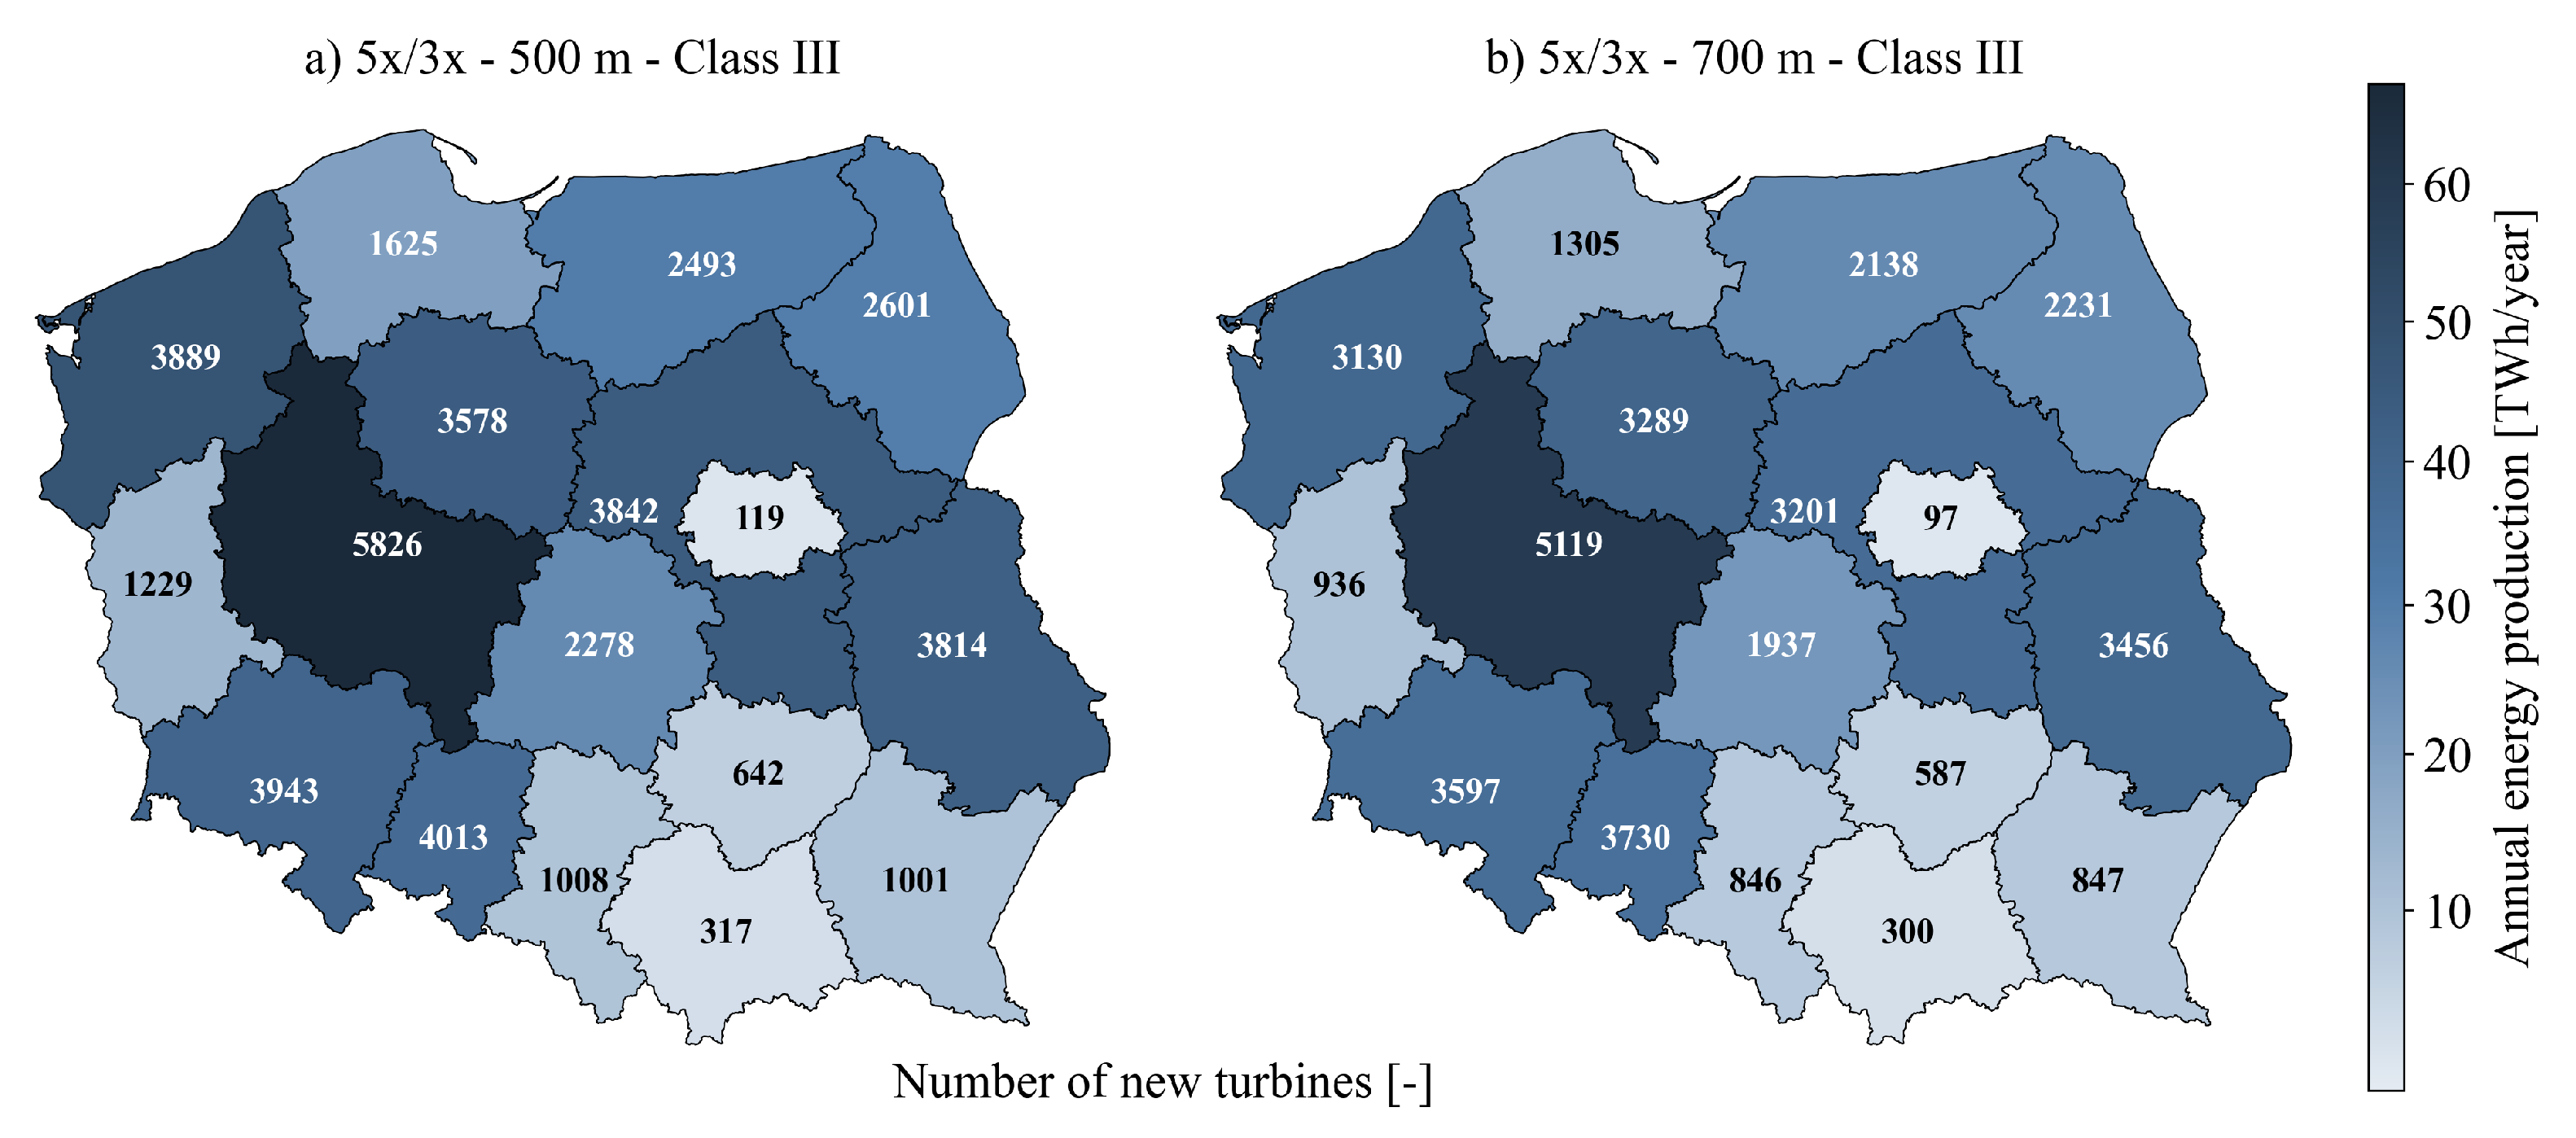
The impact of regulations defining the minimum distance between wind farms and residential buildings on the assessed potential also varies across different regions of Poland. The spatial distribution of the calculated annual energy production volume, along with the corresponding number of turbines installed within individual NUTS 2 regions, is illustrated in Figure 6a,b for the 5×/3×–700–III and 5×/3×–500–III scenarios, respectively.
Comparing the 5×/3×–700–III and 5×/3×–500–III scenarios shows an increase in both the annual energy production potential and the number of turbine installations with smaller setback distances from residential buildings. When the setback distance is maintained at 700 m, the national average annual energy production is 411.5 TWh, representing 87% of the value for the 500 m distance. The influence of setback distance reduction is particularly evident in regions characterized by favorable wind conditions and lower residential building density. In contrast, for the voivodeships of Małopolskie, Świętokrzyskie, Podkarpackie, and Śląskie, as well as the areas surrounding Poland’s capital, the impact of reducing the distance from residential buildings is minimal, likely due to high population density and moderate wind conditions. The most suitable region for wind turbine installations is the Greater Poland (Wielkopolskie) Voivodeship, where the share of turbines relative to the national total amounts to 13.8% and 12.1% for the 5×/3×–500–III and 5×/3×–700–III scenarios, respectively.
The largest increase in potential annual energy production, due to the extensive available area and favorable wind conditions, occurs in the West Pomeranian, Greater Poland, and Masovian voivodeships (excluding the vicinity of Warsaw). In terms of the number of turbines, the greatest absolute difference was identified for the Lubusz Voivodeship (31%), while the highest relative difference was observed for the West Pomeranian Voivodeship (759 turbines). This indicates that these regions are particularly sensitive to the analyzed regulatory conditions.
These results address the second research question concerning the influence of turbine technology and spacing assumptions on achievable capacity and generation potential. The observed differences between Class II and Class III turbines demonstrate that technological advancement substantially increases energy yield and reduces generation costs. This confirms that the developed framework successfully captures technology-driven improvements in technical potential and their interaction with spatial planning constraints.

3.3. LCOE

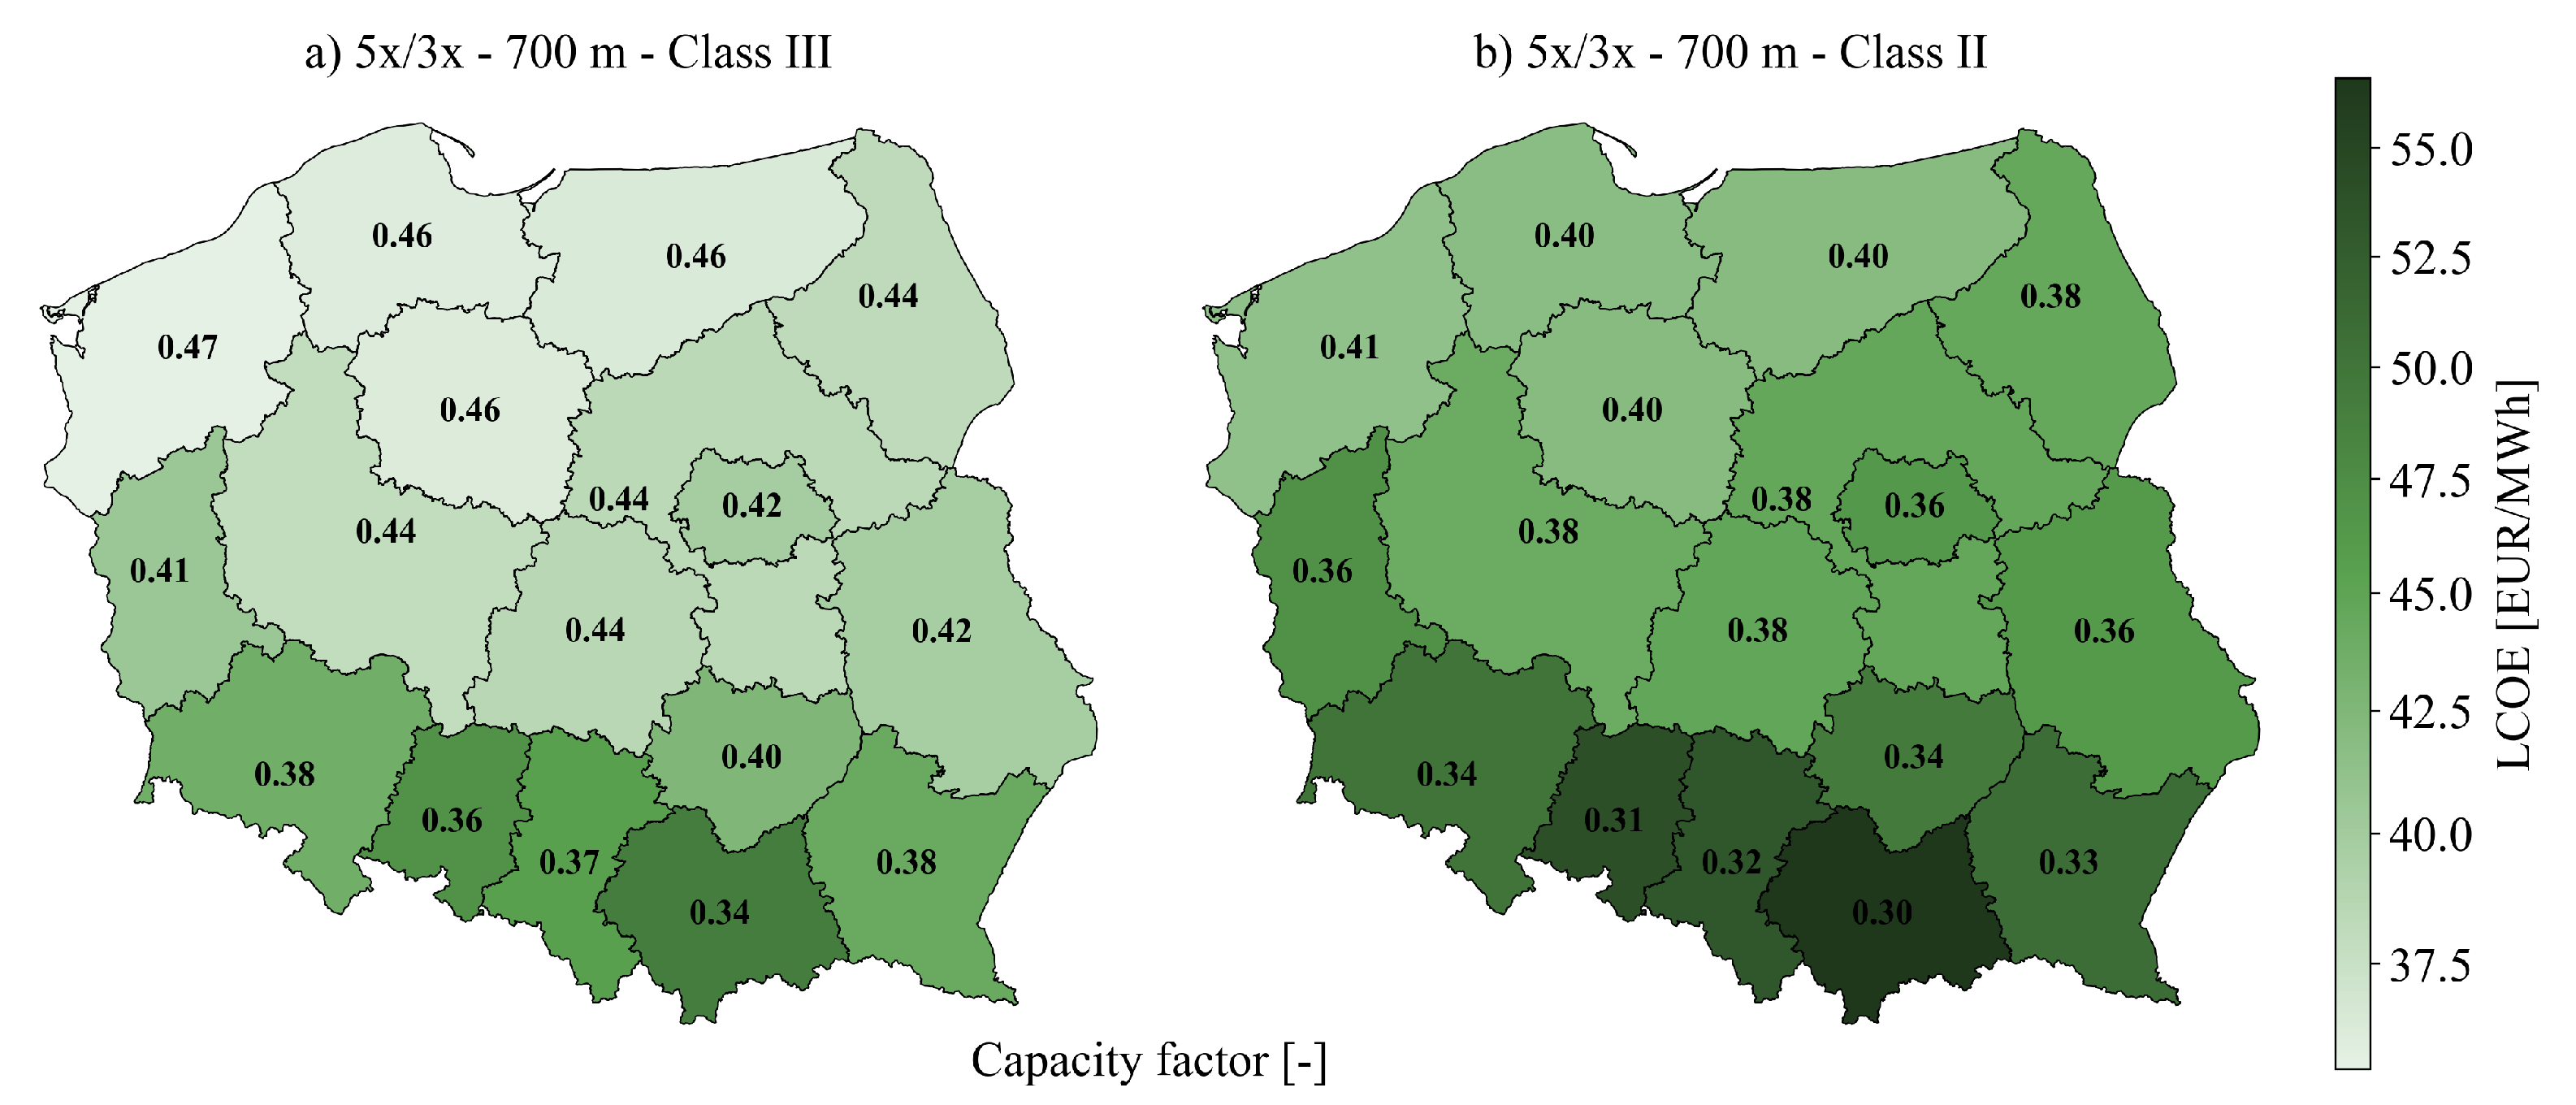
The values established in the previous stages form the basis for assessing the economic efficiency of the allocated turbines. This part of the analysis addresses the third research question, which examines how energy production costs evolve under different technological and regulatory conditions. Significant differences in the obtained LCOE values are evident when comparing various IEC turbine classes. The ability of Class III turbines to harness higher wind energy potential under Poland’s meteorological conditions results in better economic performance—the average generation cost for this turbine technology is roughly 6 EUR/MWh lower. These findings align with the data published by IRENA [6].
The distribution of LCOE values (Figure 5, right panel) contrasts with that of energy production, showing a larger number of relatively high-cost occurrences compared to the dominant generation cost level. Tightening the setback distances between turbines and residential buildings leads to a slight decrease in LCOE, likely due to the selection of areas with more favorable wind conditions. However, the observed differences in annual energy production and installed capacity clearly indicate a reduction in technical potential when greater setback distances are applied. The resulting LCOE patterns indicate that the complete techno-economic evaluation, including CAPEX, OPEX, and FCR integration, was implemented in accordance with the framework assumptions.
The LCOE assumptions used in the calculations make its value inversely proportional to annual energy production and the capacity factor. Consequently, the color intensity on the map in Figure 7a represents the inverse of the color scale shown in Figure 6b. Regardless of turbine class (comparing scenarios 5×/3×–700 m–III in Figure 7a and 5×/3×–700 m–II in Figure 7b), the southern and southwestern regions of Poland exhibit significantly less favorable wind conditions—both technically and economically—than the rest of the country. The LCOE results provide an economic perspective on the spatial and technological variability of wind potential. Class III turbines consistently achieve higher capacity factors and lower generation costs, confirming that technological progress enhances economic efficiency under identical regulatory settings. In contrast, the Małopolskie, Opolskie, Silesian, and Podkarpackie voivodeships exhibit the lowest capacity factors and the highest LCOE values, reflecting their comparatively modest wind resources. These regional patterns reinforce the main findings of the analysis, demonstrating that the integration of regulatory, spatial, and techno-economic dimensions provides a realistic and policy-relevant representation of national wind development potential. They also reflect the full execution of the high-resolution spatial aggregation and regional summarization steps of the framework.

4. Conclusions

This paper develops a method for determining key parameters relevant to the development of onshore wind energy while accounting for spatial, regulatory, and technological factors. The analysis is based on a two-module computational framework designed to evaluate land eligibility and to estimate both the technical and economic potential of onshore wind power. The effectiveness of the proposed framework was demonstrated through its application to a case study of Poland, where the energy sector faces an urgent need for new investments in renewable energy due to its heavy reliance on fossil fuels.
The results indicate a high sensitivity of land eligibility for new onshore wind installations in Poland to both regulatory and technological aspects. Scenarios assuming a reduced setback distance from residential buildings and turbine characteristics corresponding to Class II (IEC) show a positive impact on the availability of land and the number of turbines that can be installed. Conversely, increasing these parameters leads to an overall rise in both total installable capacity and annual energy production potential. Consequently, the highest technical potential was obtained for the 5×/3×–500–III scenario. Furthermore, the spatial distribution analysis of potential across the country demonstrates that the most favorable regions for onshore wind development are the Greater Poland (Wielkopolskie) and Kuyavian-Pomeranian (Kujawsko-Pomorskie) voivodeships.
From an economic perspective, the estimated LCOE varies across scenarios, with the largest differences observed between the two turbine classes. The use of Class III turbines—designed for moderate wind conditions—reduces energy generation costs by approximately 6 EUR/MWh compared to Class II turbines. This finding highlights the potential to compensate for less favorable wind conditions through appropriate technological selection. Regardless of the scenario considered, the results show that onshore wind energy production costs in Poland remain below 46 EUR/MWh.
The developed framework enables not only the assessment of the specific case of Poland but also provides a reproducible and versatile tool capable of integrating geographic, technical, and economic aspects in evaluating the feasibility of onshore wind energy projects at different scales. The integration of geospatial analysis with legal constraints and the technological characteristics of future wind energy investments allows for a realistic representation of actual development conditions. Moreover, the framework supports the use of alternative datasets and parameter configurations, thereby enabling comparative studies and analyses of potential development pathways within the examined sector.
The findings of this study provide a solid basis for practical recommendations to policymakers, grid operators, and private investors in the wind energy sector. The analysis shows that moderate relaxation of setback regulations can significantly increase both the installable capacity and the annual energy production potential of onshore wind in Poland, without compromising spatial planning consistency. Therefore, policymakers are encouraged to review existing distance regulations and integrate evidence-based spatial criteria when defining zoning and permitting procedures. The developed GIS-based framework can support authorities and developers as a decision-support tool for preliminary site screening, cost-effectiveness evaluation, and strategic grid expansion planning. From an industry perspective, the deployment of turbine technologies optimized for moderate wind conditions should be prioritized to improve generation efficiency in inland regions. Implementing these recommendations could accelerate investment processes, enhance the cost competitiveness of onshore wind energy, and contribute to achieving Poland’s national and EU decarbonization targets.
Nevertheless, certain limitations of the proposed approach should be acknowledged. The framework does not account for social factors or the risk that a particular area, although identified as suitable, may ultimately prove unfeasible due to unique local conditions—an outcome stemming from limited data availability. Such factors may affect the practical feasibility of project implementation. Future research should therefore incorporate additional socio-spatial layers, including population movements, public acceptance indicators, and municipal spatial development plans, to better capture the evolving demographic and planning context influencing onshore wind deployment. Another simplification concerns the consideration of only two representative turbine types, whereas real-world investment processes typically involve a broader range of technological options. Finally, the omission of areas characterized by exceptionally low economic viability could be addressed in future enhancements of the framework. A further limitation concerns grid-connection costs, which—although included in CAPEX—are assumed to be spatially uniform. In reality, these costs vary across regions; therefore, future work should incorporate spatially distributed connection cost estimates to capture their influence on LCOE more accurately.

Author Contributions

Conceptualization, P.B., M.T. and J.K.; data curation, P.B. and M.T.; methodology, P.B., M.T. and J.K.; software, P.B. and M.T.; validation, P.B. and J.K.; writing—original draft preparation, P.B. and M.T.; writing—review and editing, P.B. and J.K.; visualization, P.B. and M.T.; supervision, J.K. All authors have read and agreed to the published version of the manuscript.

Funding

This research received no external funding.

Data Availability Statement

The raw data supporting the conclusions of this article will be made available by the authors on request.

Acknowledgments

This study was conducted within the statutory research of the Mineral and Energy Economy Research Institute of the Polish Academy of Sciences. During the preparation of this study, the authors used Grammarly and ChatGPT 5.0 in order to improve the English quality of the manuscript. The authors have reviewed and edited the output and take full responsibility for the content of this publication.

Conflicts of Interest

The authors declare no conflicts of interest.

Abbreviations

    The following abbreviations are used in this manuscript:
AEPAnnual Energy Production
AHPAnalytic Hierarchy Process
BDOT10kTopographic Object Database
CAPEXCapital Expenditures
CFCapacity Factor
CRFCapital Recovery Factor
EUEuropean Union
ENTSO-EEuropean Network of Transmission System Operators for Electricity
ENTSOGEuropean Network of Transmission System Operators for Gas
FCRFixed Charge Rate
GDEPGeneral Directorate for Environmental Protection
GISGeographic Information System
GLAESGeospatial Land Availability for Energy Systems
IEAInternational Energy Agency
IECInternational Electrotechnical Commission
LCOELevelized Cost of Energy
MPZPLocal Development Plan
NECPNational Energy and Climate Plan
OPEXOperational Expenditures
PVPhotovoltaic
ProFinFactorProject Finance Factor
RESRenewable Energy Source
TOPSISTechnique for Order Preference by Similarity to an Ideal Solution
TYNDPTen-Year Network Development Plan
UEEuropean Union

Appendix A

Table A1. Notation used in the pseudocode.
SymbolDescription
DRotor diameter of the selected turbine class (m)
HHub height of the selected turbine class (m)
CRated electrical capacity of the selected turbine class (MW)
k 1 , k 2 Multipliers defining turbine spacing along prevailing and crosswind directions
S p w Turbine spacing in prevailing-wind direction: S p w = k 1 D
S c w Turbine spacing in crosswind direction: S c w = k 2 D
D B Dataset being pre-processed in QGIS (vector or raster)
LExclusion layer (vector) after QGIS harmonization
B ( L ) Scenario-dependent buffer distance applied to exclusion layer L
BUF L Buffered version of exclusion layer L using GLAES
R L Rasterized exclusion mask corresponding to BUF L (100 m resolution)
E Land-eligibility mask (binary raster), 1 = eligible, 0 = excluded
WWind-speed raster used for minimum wind constraint (4 m/s)
G Regular point grid generated from spacing rules
pCandidate turbine point in the grid G
T Final turbine layout (set of feasible turbine positions)
CF ( t ) Capacity factor sampled at turbine location t
CF t Capacity factor value for turbine t
C t Rated capacity of turbine t (MW), equals C for all turbines in a scenario
AEP t Annual energy production of turbine t (MWh/yr)
LCOE t Levelized cost of energy for individual turbine t (EUR/MWh)
L List of all turbine-level LCOE values
C tot Total installed capacity for a scenario (MW)
E tot Total annual energy production for a scenario (MWh)
LCOE ¯ Average LCOE over all turbines in scenario (EUR/MWh)
Algorithm A1 Pre-processing and Land Eligibility
 1:
QGIS Pre-processing
 2:
Load all raw GIS datasets (vector and raster)
 3:
for each dataset D B  do
 4:
      Reproject D B to EPSG 3035
 5:
      Clip D B to Poland’s national boundary
 6:
end for
 7:
Export harmonized datasets to GLAES environment
 
 
 8:
GLAES Land Eligibility Assessment
 9:
Create 100 m resolution raster grid over Poland
10:
Initialize eligibility mask: E 1
11:
for each exclusion layer L do
12:
     Determine buffer distance B ( L ) (scenario-dependent)
13:
      BUF L G L A E S . B U F F E R ( L , B )
14:
      R L G L A E S . R A S T E R I Z E ( BUF L )
15:
      E E ( ¬ R L )
16:
end for
17:
Load wind-speed raster W
18:
E E ( W 4 m / s )
19:
return land-eligibility mask E
Algorithm A2 Turbine Allocation Using Spacing Rules
 1:
Inputs: eligibility mask E , scenario parameters
 2:
Retrieve turbine class parameters (D, H, C)
 3:
Define spacing rules:
                                                                                                                              S p w = k 1 D , S c w = k 2 D
 4:
G G L A E S . C R E A T E P O I N T G R I D ( S p w , S c w )
 5:
Rotate G to prevailing west-to-east wind direction
 6:
Initialize turbine set: T
 7:
for each point p G  do
 8:
      if  E ( p ) = 1  then
 9:
          if p satisfies residential setback constraint then
10:
              T T { p }
11:
          end if
12:
      end if
13:
end for
14:
return turbine layout T
Algorithm A3 Techno-Economic Assessment
 1:
Inputs: turbine layout T , CF raster, CAPEX, OPEX, FCR
 2:
Initialize:
                                                                                                                C tot 0 , E tot 0 , L [ ]
 3:
for each turbine t T  do
 4:
       CF t CF ( t )
 5:
       C t C
 6:
       AEP t = 8760 · C t · CF t
 7:
       LCOE t = C t ( CAPEX · FCR + OPEX ) AEP t
 8:
       C tot C tot + C t
 9:
       E tot E tot + AEP t
10:
      Append LCOE t to L
11:
end for
12:
LCOE ¯ mean ( L )
13:
return ( C tot , E tot , LCOE ¯ )

References

  1. International Energy Agency (IEA). Net Zero by 2050: A Roadmap for the Global Energy Sector; Technical Report; International Energy Agency: Paris, France, 2021. [Google Scholar]
  2. ENTSO-E; ENTSOG. TYNDP 2024: Scenario Results; Technical Report; European Network of Transmission System Operators for Electricity (ENTSO-E) and European Network of Transmission System Operators for Gas (ENTSOG): Brussels, Belgium, 2024; Available online: https://2024.entsos-tyndp-scenarios.eu/scenario-results/ (accessed on 24 November 2025).
  3. Weisenfeld, U.; Rollert, K.E. Explaining energy transition: A systemic social mechanisms approach illustrated with the examples of Germany and Poland. Energy Res. Soc. Sci. 2024, 112, 103512. [Google Scholar] [CrossRef]
  4. Malec, M. The prospects for decarbonisation in the context of reported resources and energy policy goals: The case of Poland. Energy Policy 2022, 161, 112763. [Google Scholar] [CrossRef]
  5. An, K.; Zheng, X.; Shen, J.; Xie, C.; Wang, C.; Cai, W.; Bu, C. Repositioning coal power to accelerate net-zero transition of China’s power system. Nat. Commun. 2025, 16, 2311. [Google Scholar] [CrossRef]
  6. International Renewable Energy Agency (IRENA). Renewable Power Generation Costs in 2024; Technical Report; International Renewable Energy Agency: Masdar City, United Arab Emirates, 2025. [Google Scholar]
  7. Kim, J.; Jaumotte, F.; Panton, A.J.; Schwerhoff, G. Energy security and the green transition. Energy Policy 2025, 198, 114409. [Google Scholar] [CrossRef]
  8. Zupok, S.; Chomać-Pierzecka, E.; Dmowski, A.; Dyrka, S.; Hordyj, A. A Review of Key Factors Shaping the Development of the U.S. Wind Energy Market in the Context of Contemporary Challenges. Energies 2025, 18, 4224. [Google Scholar] [CrossRef]
  9. Ryberg, D.S.; Tulemat, Z.; Stolten, D.; Robinius, M. Uniformly constrained land eligibility for onshore European wind power. Renew. Energy 2020, 146, 921–931. [Google Scholar] [CrossRef]
  10. Jung, C.; Schindler, D. Distance to power grids and consideration criteria reduce global wind energy potential the most. J. Clean. Prod. 2021, 317, 128472. [Google Scholar] [CrossRef]
  11. Demir, A.; Dincer, A.; Ciftci, C.; Gulcimen, S.; Uzal, N.; Yilmaz, K. Wind farm site selection using GIS-based multicriteria analysis with Life cycle assessment integration. Earth Sci. Inform. 2024, 17, 1591–1608. [Google Scholar] [CrossRef]
  12. Liu, T.; Zhang, T.; Zou, Y.; Wang, G.; Dai, H.; Zhang, W. Suitability analysis for implementing wind and solar farms based AHP method: Case study in Inner Mongolia, China. Int. Arch. Photogramm. Remote Sens. Spat. Inf. Sci. 2024, XLVIII-1-2024, 417–423. [Google Scholar] [CrossRef]
  13. Sun, Y.; Li, Y.; Wang, R.; Ma, R. Modelling potential land suitability of large-scale wind energy development using explainable machine learning techniques: Applications for China, USA and EU. Energy Convers. Manag. 2024, 302, 118131. [Google Scholar] [CrossRef]
  14. Rediske, G.; Burin, H.; Rigo, P.; Rosa, C.; Michels, L.; Siluk, J. Wind power plant site selection: A systematic review. Renew. Sustain. Energy Rev. 2021, 148, 111293. [Google Scholar] [CrossRef]
  15. Benti, N.E.; Alemu, Y.B.; Balta, M.M.; Gunta, S.; Chaka, M.D.; Semie, A.G.; Mekonnen, Y.S.; Yohannes, H. Site suitability assessment for the development of wind power plant in Wolaita area, Southern Ethiopia: An AHP-GIS model. Sci. Rep. 2023, 13, 19811. [Google Scholar] [CrossRef] [PubMed]
  16. McKenna, R.; Pfenninger, S.; Heinrichs, H.; Schmidt, J.; Staffell, I.; Bauer, C.; Gruber, K.; Hahmann, A.N.; Jansen, M.; Klingler, M.; et al. High-resolution large-scale onshore wind energy assessments: A review of potential definitions, methodologies and future research needs. Renew. Energy 2022, 182, 659–684. [Google Scholar] [CrossRef]
  17. Sliz-Szkliniarz, B.; Vogt, J. GIS-based approach for the evaluation of wind energy potential: A case study for the Kujawsko–Pomorskie Voivodeship. Renew. Sustain. Energy Rev. 2011, 15, 1696–1707. [Google Scholar] [CrossRef]
  18. Świdyńska, N.; Witkowska-Dąbrowska, M.; Jakubowska, D. Influence of Wind Turbines as Dominants in the Landscape on the Acceptance of the Development of Renewable Energy Sources in Poland. Energies 2024, 17, 3268. [Google Scholar] [CrossRef]
  19. Woźniak, M. Landscape Protection vs. Onshore Wind Energy Investments in Poland—A Legal Perspective. Int. J. Semiot. Law 2025, 38, 1199–1218. [Google Scholar] [CrossRef]
  20. Ryberg, D.S.; Caglayan, D.G.; Schmitt, S.; Linßen, J.; Stolten, D.; Robinius, M. The future of European onshore wind energy potential: Detailed distribution and simulation of advanced turbine designs. Energy 2019, 182, 1222–1238. [Google Scholar] [CrossRef]
  21. Fotsing Metegam, I.F.; Bomeni, I.Y.; Chara-Dackou, V.S.; Njomo, D.; Tchinda, R. Technical and geographic potential analysis for large-scale wind energy production using a GIS-AHP multi-criteria in Cameroon. Results Eng. 2024, 24, 102765. [Google Scholar] [CrossRef]
  22. Langer, J.; Zaaijer, M.; Quist, J.; Blok, K. Introducing site selection flexibility to technical and economic onshore wind potential assessments: New method with application to Indonesia. Renew. Energy 2023, 202, 320–335. [Google Scholar] [CrossRef]
  23. Ji, L.; Li, J.; Sun, L.; Wang, S.; Guo, J.; Xie, Y.; Wang, X. China’s onshore wind energy potential in the context of climate change. Renew. Sustain. Energy Rev. 2024, 203, 114778. [Google Scholar] [CrossRef]
  24. McKenna, R.; Hollnaicher, S.; Ostman v. d. Leye, P.; Fichtner, W. Cost-potentials for large onshore wind turbines in Europe. Energy 2015, 83, 217–229. [Google Scholar] [CrossRef]
  25. Pelczar, S. Assessment of the theoretical potential of onshore wind power plants in Poland in the context of the required distance from residential buildings. Sustain. Energy Technol. Assess. 2025, 75, 104250. [Google Scholar] [CrossRef]
  26. Amsharuk, A.; Łaska, G. Site Selection of Wind Farms in Poland: Combining Theory with Reality. Energies 2024, 17, 2635. [Google Scholar] [CrossRef]
  27. Sliz-Szkliniarz, B.; Eberbach, J.; Hoffmann, B.; Fortin, M. Assessing the cost of onshore wind development scenarios: Modelling of spatial and temporal distribution of wind power for the case of Poland. Renew. Sustain. Energy Rev. 2019, 109, 514–531. [Google Scholar] [CrossRef]
  28. Benalcazar, P.; Komorowska, A.; Kamiński, J. A GIS-based method for assessing the economics of utility-scale photovoltaic systems. Appl. Energy 2024, 353, 122044. [Google Scholar] [CrossRef]
  29. Stehly, T.; Duffy, P.; Mulas Hernando, D. Cost of Wind Energy Review, 2024 ed; Technical Report; National Renewable Energy Laboratory (NREL): Golden, CO, USA, 2024. [Google Scholar] [CrossRef]
  30. National Renewable Energy Laboratory (NREL). Equations & Variables—Annual Technology Baseline (ATB) 2024. 2022. Available online: https://atb.nrel.gov/electricity/2024/equations_%26_variables (accessed on 23 October 2025).
  31. McKenna, R.; Ryberg, D.; Staffell, I.; Hahmann, A.; Schmidt, J.; Heinrichs, H.; Höltinger, S.; Lilliestam, J.; Pfenninger, S.; Robinius, M.; et al. On the socio-technical potential for onshore wind in Europe: A response to Enevoldsen et al. (2019), Energy Policy, 132, 1092-1100. Energy Policy 2020, 145, 111693. [Google Scholar] [CrossRef]
  32. Enevoldsen, P.; Permien, F.H.; Bakhtaoui, I.; von Krauland, A.K.; Jacobson, M.Z.; Xydis, G.; Sovacool, B.K.; Valentine, S.V.; Luecht, D.; Oxley, G. On the socio-technical potential for onshore wind in Europe: A response to critics. Energy Policy 2021, 151, 112147. [Google Scholar] [CrossRef]
  33. Watson, S.; Moro, A.; Reis, V.; Baniotopoulos, C.; Barth, S.; Bartoli, G.; Bauer, F.; Boelman, E.; Bosse, D.; Cherubini, A.; et al. Future emerging technologies in the wind power sector: A European perspective. Renew. Sustain. Energy Rev. 2019, 113, 109270. [Google Scholar] [CrossRef]
  34. Benalcazar, P. Optimal sizing of thermal energy storage systems for CHP plants considering specific investment costs: A case study. Energy 2021, 234, 121323. [Google Scholar] [CrossRef]
  35. Head Office of Geodesy and Cartography (GUGiK). Baza Danych Obiektów Topograficznych—BDOT10k. 2025. Available online: https://www.geoportal.gov.pl/pl/dane/baza-danych-obiektow-topograficznych-bdot10k/ (accessed on 23 October 2025).
  36. Fundacja Instrat. Zainstalowana Moc Źródeł Energii Elektrycznej w Polsce—Dane ARE. 2025. Available online: https://energy.instrat.pl/system-elektroenergetyczny/zainstalowana-moc-are/ (accessed on 23 October 2025).
  37. Sejm Rzeczypospolitej Polskiej. Druk nr 1130—Sejm X kadencji: Projekt Ustawy o Zmianie Ustawy o Środkach Wspierania… [Złagodzenie Minimalnej Odległości Elektrowni Wiatrowych]. 2025. Available online: https://www.sejm.gov.pl/sejm10.nsf/PrzebiegProc.xsp?nr=1130 (accessed on 23 October 2025).
  38. Rzeczpospolita Polska—Ministerstwo Klimatu i Środowiska. Projekt Krajowego Planu w Dziedzinie Energii i Klimatu do 2030 r. z Perspektywa˛ do 2040 r. (Wersja Przekazana do Dalszego Procedowania na Poziomie Rady Ministrów). 2024. Available online: https://www.gov.pl/web/klimat/projekt-krajowego-planu-w-dziedzinie-energii-i-klimatu-do-2030-r-z-perspektywa-do-2040-r-wersja-przekazana-do-dalszego-procedowania-na-poziomie-rady-ministrow (accessed on 23 October 2025).
  39. Informatyczny System Osłony Kraju. Usługa Pobierania INSPIRE. 2025. Available online: https://isok.gov.pl/inspire.html (accessed on 23 October 2025).
  40. Eurostat. EU-DEM Digital Elevation Model. 2025. Available online: https://ec.europa.eu/eurostat/web/gisco/geodata/digital-elevation-model/eu-dem, (accessed on 23 October 2025).
  41. Generalna Dyrekcja Ochrony Środowiska. Dostęp do Danych Geoprzestrzennych. 2025. Available online: https://www.gov.pl/web/gdos/dostep-do-danych-geoprzestrzennych, (accessed on 23 October 2025).
  42. DTUWind Energy; World Bank Group. Global Wind Atlas 3.0; Technical University of Denmark, DTUWind Energy: Roskilde, Denmark; World Bank Group: Washington, DC, USA, 2021; Available online: https://globalwindatlas.info (accessed on 23 October 2025).
  43. Rzeczpospolita Polska. Dziennik Ustaw 2024, poz. 317. 2024. Available online: https://isap.sejm.gov.pl/isap.nsf/DocDetails.xsp?id=WDU20240000317 (accessed on 23 October 2025).
  44. Zhang, M. Appendix II: IEC Classification of Wind Turbines. Wind. Resour. Assess. Micro-Siting Sci. Eng. 2015, 1, 269–270. [Google Scholar] [CrossRef]
  45. International Electrotechnical Commission International Standard-IEC 61400-1. 2019. Available online: https://webstore.iec.ch/en/publication/5426 (accessed on 23 October 2025).
  46. Politechnika Warszawska. Lista Obiektów EMP—Politechnika Warszawska. 2025. Available online: https://emp.pw.edu.pl/lista-obiektow (accessed on 23 October 2025).
  47. Dygulska, A.; Perlańska, E. Mapa wietrzności Polski, Projekt Czysta Energia. 2015. Available online: https://kierunkizamawiane.upsl.edu.pl/pliki/czystaenergia/raport2_II.pdf (accessed on 23 October 2025).
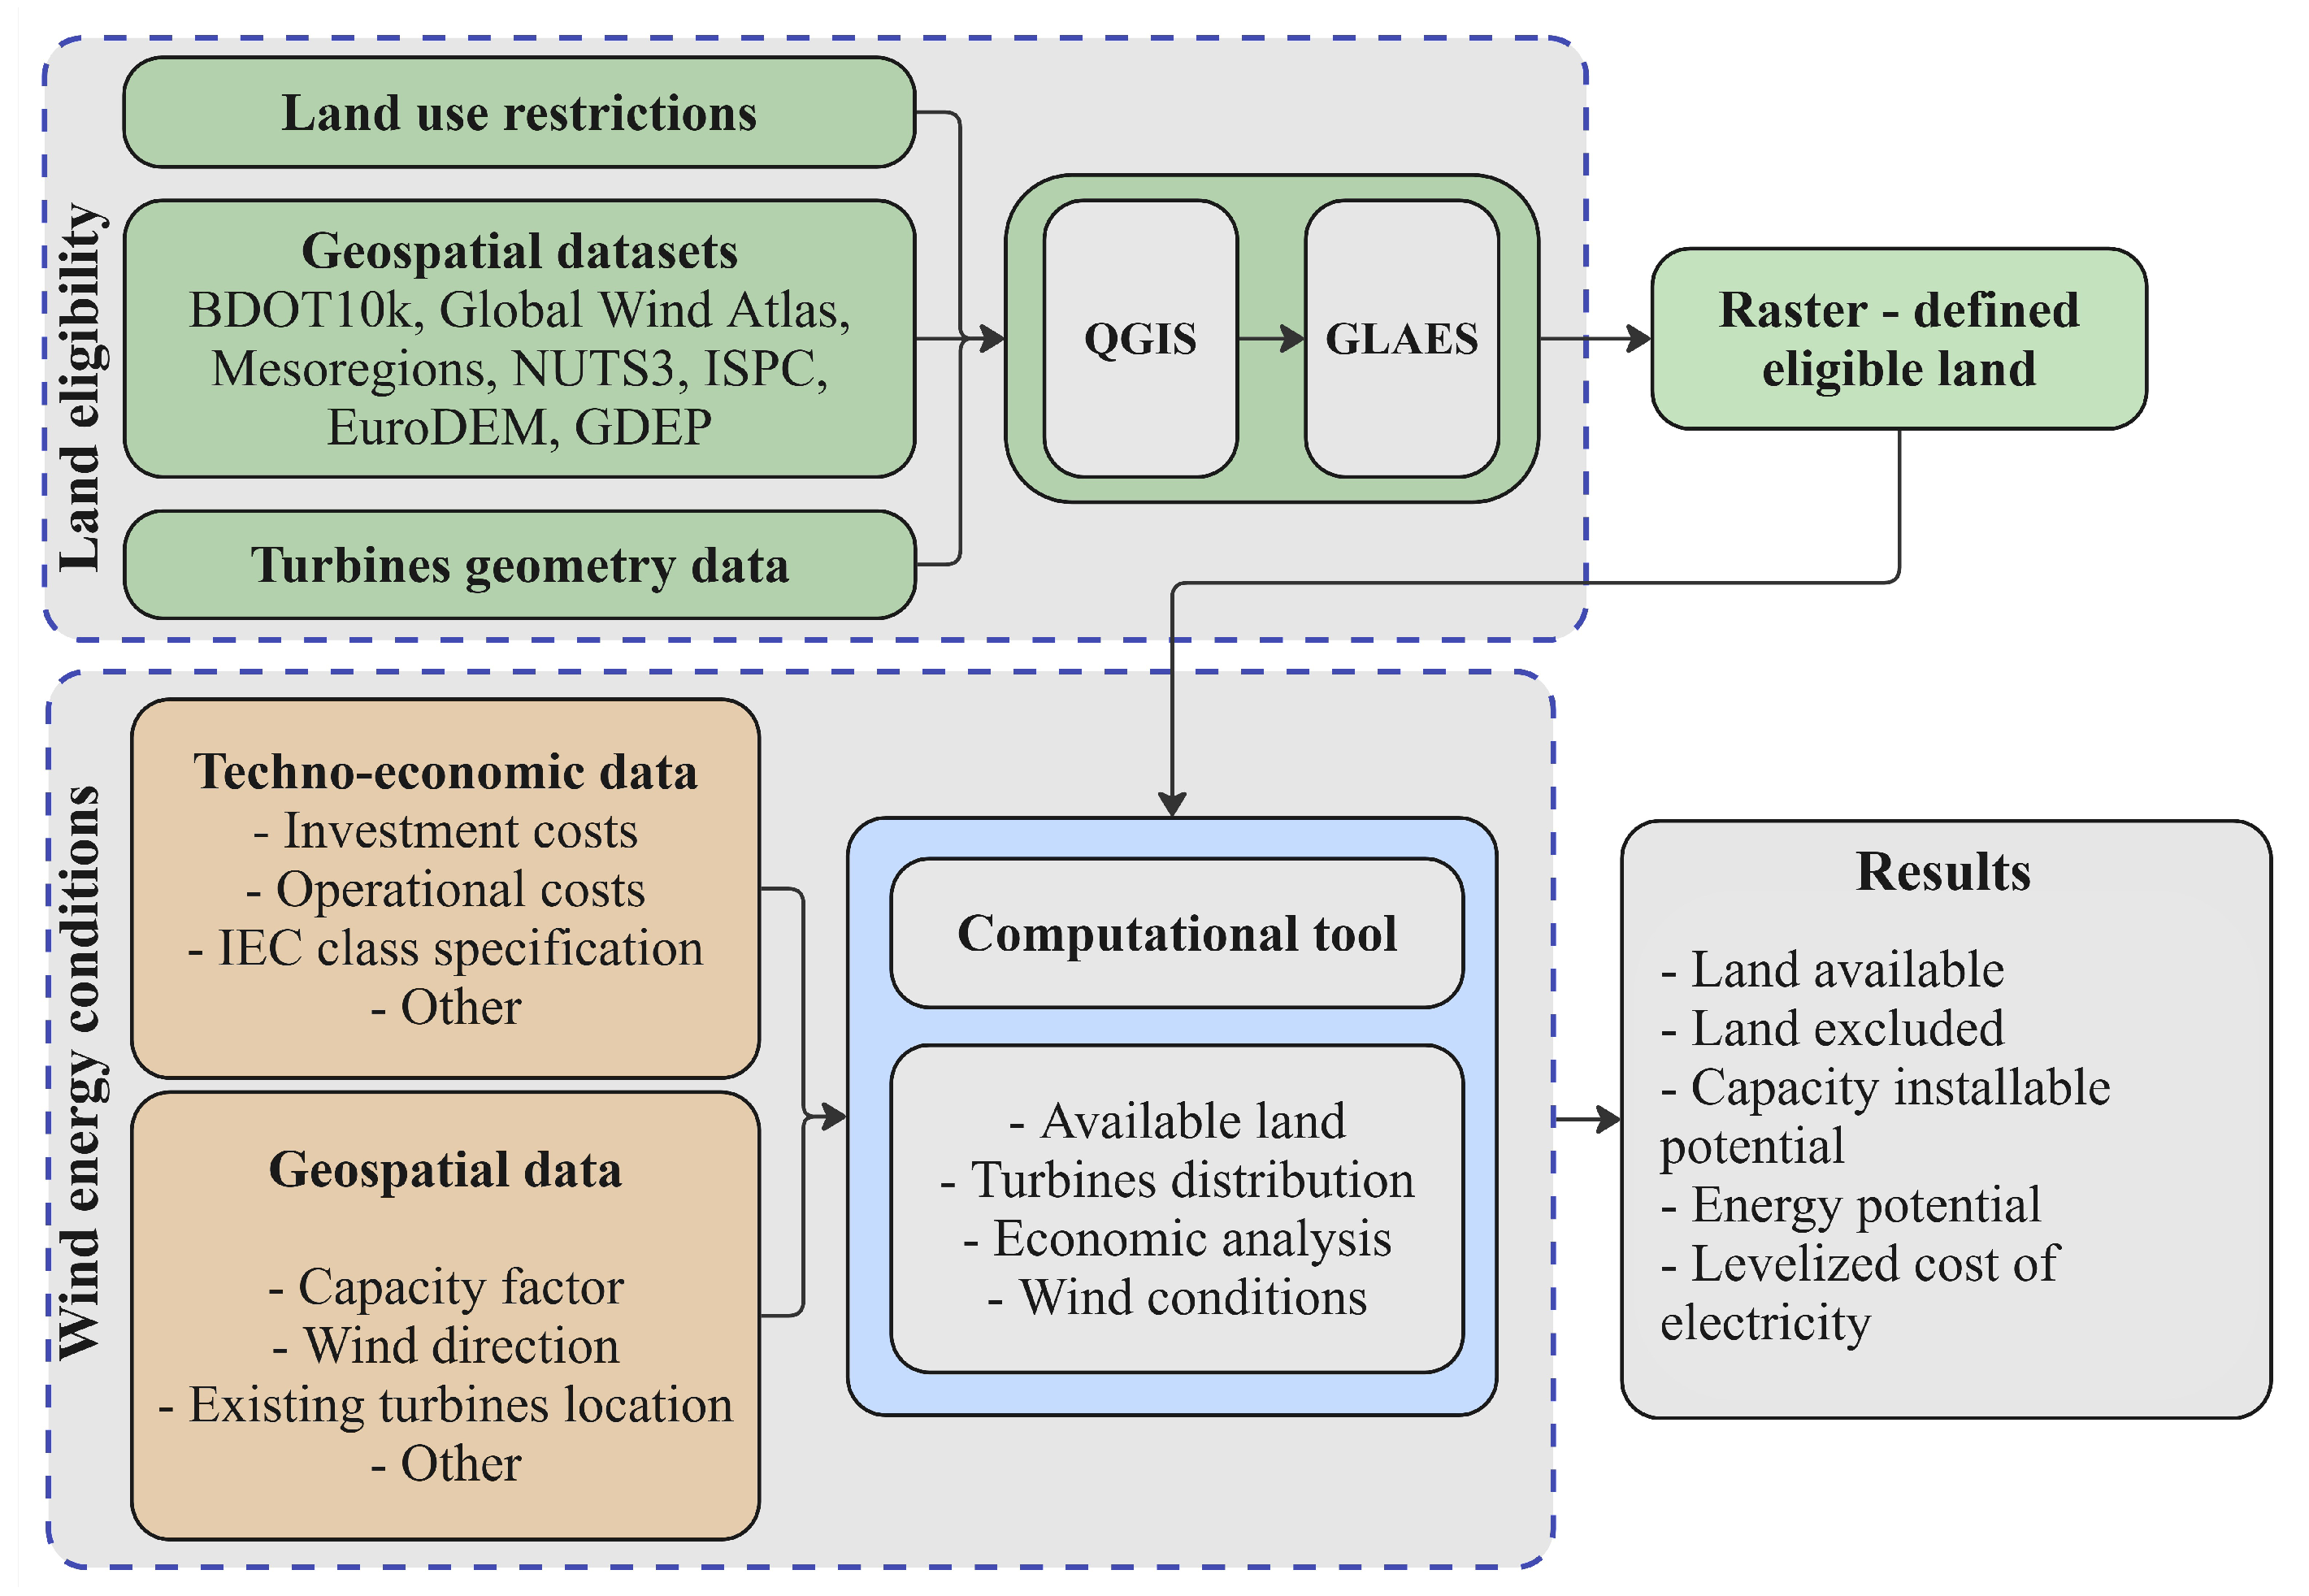
Figure 1. General schematic of the methodology applied in this study.
Energies 18 06230 g001
Figure 2. Stepwise exclusion of unsuitable areas to assess land eligibility for onshore wind development (700 m distance scenario, Class III turbines).
Energies 18 06230 g002
Figure 3. Land eligibility for scenario 700 m and turbine Class III.
Energies 18 06230 g003
Figure 4. Differences in land eligibility for turbine Class III.
Energies 18 06230 g004
Figure 5. Distribution of annual energy production (left) and LCOE distribution (right) for the 5×/3× scenario group.
Energies 18 06230 g005
Figure 6. Wind energy potential in Poland for scenarios (a) 5×/3×–500–III and (b) 5×/3×–700–III (annual energy production—color scale; number of turbines—values shown on the map).
Energies 18 06230 g006
Figure 7. Wind energy LCOE in Poland for scenarios (a) 5×/3×–700–III and (b) 5×/3×–700–II (LCOE—color scale; capacity factor—values shown on the map).
Energies 18 06230 g007
Table 1. Geospatial data used in the analysis.
GIS LayerReferenceBuffer Distance [m]
Existing wind turbines[35]5× rotor diameter
Flood hazard areas[39]0
Terrain slope (>17°)[40]0
Elevation (>2000 m)[40]0
Forests (woodlands, groves)[35]Rotor diameter
Inland waters[35]100
Wetlands[35]100
Reeds[35]0
Rivers[35]100
Streams, brooks, or creeks[35]0
Canals and drainage ditches[35]0
Permanent crops[35]Rotor diameter
Roads (motorways, expressways,
main roads, local roads)
[35]50
Airports, airfields[35]3000
Excavation and dumping sites[35]200
Tall technical structures (excluding
power poles and wind turbines)
[35]Rotor diameter
Military training areas[35]500
Extra-high-voltage power lines[35]Max (3× rotor diameter,
2× total turbine height)
High-voltage power lines[35]Rotor diameter
Residential buildings[35]Scenario-based
Non-residential buildings[35]700
Natural monuments[41]Rotor diameter
National parks[41]10× total turbine height
Landscape parks[41]Rotor diameter
Nature reserves[41]500
Protected landscape areas[41]Rotor diameter
Natura 2000 sites (habitats
and bird areas)
[41]Rotor diameter
Natural-landscape complexes[41]Rotor diameter
Documentary sites[41]Rotor diameter
Ecological sites[41]Rotor diameter
Ecological corridors[41]Rotor diameter
Other small areas (<4 ha)-0
Wind speed (<4 m/s)[42]0
Capacity factors
for turbine classes
[42]-
Table 2. Techno-economic assumptions adopted in the study.
ParameterValueReferences
CAPEX [EUR/kW]1695[29]
FCR [%]6.5[29]
OPEX [EUR/kW/year]37[29]
Turbine rotor diameter (for turbine IEC class II/III) [m]126/136[42]
Turbine hub height (for turbine IEC class II/III) [m]100/100[42]
Reference turbine capacity (for turbine IEC class II/III) [MW]2/3[46]
Prevailing wind direction [-]West[25,47]
Table 3. Scenarios’ assumptions.
Distance Between TurbinesDistance
from Residential
Buildings [m]
Turbine
Class
5× rotor diameter (for the prevailing
wind direction), 3× rotor diameter
(for the perpendicular direction)
500II
600
8× rotor diameter (for the prevailing
wind direction), 4× rotor diameter
(for the perpendicular direction)
700III
Table 4. Estimated energy potential in Poland.
Scenario (Turbine
Spacing Rule
-Distance from
Residential
Buildings
-Turbine Class)
Share of
Eligible Land
in the Total
Area of
Poland
[%]
Number
of
Installed
Turbines
[-]
Total
Installed
Capacity of
New
Turbines
[GW]
Total
Annual
Energy
Production
[TWh]
LCOE
[EUR/
MWh]
5×/3×-700-II3.2543,71287.4282.245.61
8×/4×-700-II20,16040.3130.145.63
5×/3×-600-II3.4846,80593.6301.845.65
8×/4×-600-II21,83643.7140.745.68
5×/3×-500-II3.7250,205100.4323.445.70
8×/4×-500-II23,37746.8150.445.75
5×/3×-700-III3.1136,751110.3411.539.44
8×/4×-700-III16,72250.2187.439.40
5×/3×-600-III3.3339,702119.1444.639.44
8×/4×-600-III17,97653.9201.439.42
5×/3×-500-III3.5542,228126.7472.039.51
8×/4×-500-III18,93456.8211.639.50
Disclaimer/Publisher’s Note: The statements, opinions and data contained in all publications are solely those of the individual author(s) and contributor(s) and not of MDPI and/or the editor(s). MDPI and/or the editor(s) disclaim responsibility for any injury to people or property resulting from any ideas, methods, instructions or products referred to in the content.