Abstract
As the importance of energy efficiency and smart readiness in the building sector has been on the rise, the financial evaluation of smart-ready technologies (SRTs) remains a gap in this field. This study introduces a methodology that comparatively evaluates the cost–benefit relationship between 11 different SRTs across three European countries—Cyprus, Italy and The Netherlands. Key performance indicators (KPIs) for energy-focused aspects such as Country-Specific Energy Savings Potential (CSESP) and Seasonal Smart Efficiency Coefficient (SSEC) and financial aspects such as Smart Readiness Cost Index (SRCI), Labor Cost Impact Factor (LCIF), Return on Smart Investment (RoSI), and Smart Investment Break-Even Period (SIBEP) were used to quantify the performance of the SRTs. The results indicate that regional labor rates, energy pricing, and climatic conditions—as well as relative technology cost–benefit tradeoffs—play a significant role in the economic viability of smart-ready devices. Having low labor costs and energy pricing, Cyprus exhibited the most cost-effective outcomes among the three countries. Italy showed strong returns although the initial investments were higher. The Netherlands was observed to benefit the most from heating-oriented technologies. The study comes to the conclusion that regionally specific methods are necessary for the adoption of SRTs and that techno-economic performance cannot be assessed separately from local market dynamics. The proposed framework supports stakeholders and policymakers in smart building investment and planning by offering a scalable method for device-level benchmarking. These indicators are developed specifically for this study and are not part of the official EU SRI (Smart Readiness Indicator) methodology. Their inclusion supports device-level evaluation and complements ongoing efforts toward SRI standardization. This research directly addresses Sustainable Development Goal (SDG) 7 on Affordable and Clean Energy, as well as SDG 11 on Sustainable Development, by evaluating how smart-ready technologies can contribute to energy efficiency and decarbonization in buildings. Based on the results, further research is needed to expand the indicator framework to additional technologies, include building typology effects, and integrate dynamic factors such as CO2 pricing and real-time tariffs.
1. Introduction
The need for decarbonization and increased energy efficiency within the building sector has been on the rise for the last decades [1], where the concept of “smartness” in buildings emerged as a critical point for the sustainability of constructed buildings. The concept of smartness within a building refers to its ability to automate control, monitoring, and optimizing performance in domains such as energy use, occupant comfort and indoor environment using intelligent and responsive systems [2,3]. Legislative tools such as the Smart Readiness Indicator (SRI) have been employed by the European Union to facilitate this shift towards smarter buildings. The SRI measures the building’s ability to show adaptation to occupant needs, energy grid signals, and environmental conditions [4].
Although there is a high demand for increased technological readiness in buildings, the financial implications for potential upgrades to building systems remain underexplored in 2025 [5]. Potential investments in these smart-ready automation systems are usually driven by the enforcement of the European Union through regulation/innovation agendas [2], but lack detailed economic analysis. For stakeholders, both public and private, who seek cost-effectiveness, this presents a challenge to achieve decarbonization and sustainability goals. Furthermore, comparing across regions rather than within a single country provides a more robust understanding of how local labor, climate, and energy pricing structures affect performance. This supports broader EU goals of SRI harmonization and policy scalability across diverse member states.
Smart-ready upgrades indeed offer substantial benefits such as reduced energy bills, lower maintenance costs and extended lifespan of assets due to optimized control options [6]. However, there is limited standardized and quantified comparison between buildings in different geographical regions [7,8]. There is also limited availability of evaluations of smart-ready devices within the context of indicators such as lifecycle cost, return on investment, and payback period [5,9,10].
The aim of this study is to bridge this gap by calculating key performance indicators such as the Smart Readiness Cost Index (SRCI), Country-Specific Energy Savings Potential (CSESP) and Labor Cost Impact Factor (LCIF) for 11 different smart-ready technologies. The performance indicators introduced in this study are novel economic and energy indicators that are tailored for evaluating smart-ready technologies at the device level, which are not currently included in existing SRI frameworks. The evaluation of these devices was carried out across three EU member states: Cyprus, Italy, and The Netherlands. The cost-based indicators and energy-saving metrics were applied to estimate the viability and economic feasibility of these devices across these countries. In this study, Cyprus was taken as the reference case for benchmarking. The present study introduces a device-level methodology to address this gap. The findings are presented in Section 4.
2. Theoretical Background
This section establishes the theoretical foundation for evaluating the energy savings and financial viability of smart-ready technologies at the device level. It outlines a standardized methodology based on BAC (Building Automation Control) classification and introduces scalable indicators to assess feasibility across diverse EU regions. Although many studies address the technological benefits of smart-ready technologies, only a few examine the financial side at the device or system level. The following studies in the literature have acknowledged the limitations of smart system evaluation only through technological and operational aspects. Vimpari and Junnila 2020 [11] showed that Return on Investment (ROI) and Life Cycle Cost (LCC) values are sensitive to local labor costs and labor markets. A review study by Cheng and Lee 2018 [10] assessed the performance of building energy management systems and showed that financial returns calculated were inconsistent. Although there are new approaches, such as those by McNeil-Ayuk and Jrade 2024 [9], that employ Building Information Modelling (BIM) and Lifecycle Cost Assessment (LCCA) to simulate financial feasibility during early-stage design, they lack device-level retrofit comparisons across different countries.
To compare device-level energy and financial performance across Cyprus, Italy, and The Netherlands, scalable metrics are introduced in this study. These three countries were selected due to their representation of Southern, Central, and Northern Europe, respectively, thus, reflecting variation in energy needs, climatic zones, and wage structures.
The smart-ready functionalities are categorized by using the framework established by EN ISO 52120-1:2022 [12]. EN ISO 52120-1 is used to provide a performance-based framework based on testing protocols and expected operational behaviors. Manufacturers use it to categorize the efficiency of building automation functionalities. Building Automation and Control (BAC) efficiency classes (A to D) for services such as heating, cooling, lighting, and ventilation are defined by this ISO file. Classes ranging from A to D represent a level of automation or control, where D is the basic time control and A is the fully adaptive and self-learning systems. Each class has a specific numerical coefficient assigned to it, which reflects the relative energy efficiency of that class based on tests run by the manufacturer [13,14].
Domain-specific formulas are applied when calculating energy savings from a BAC upgrade. For single-function upgrades, where only one upgrade takes place within the domain, the total energy demand after implementation is expressed as:
Single Service Upgrade:
where:
- QH, tot, BAC: Total heating energy demand post-upgrade;
- QH, tot: Baseline heating energy demand;
- fBAC, H: Efficiency factor of the upgraded BAC class;
- fBAC, H, ref: Efficiency factor of the reference BAC class.
When smart devices are considered, many of them are responsible for upgrading functionalities in multiple areas. An example could be adding both a smart thermostat and a variable speed pump. Accounting for these combined effects ensures the total energy savings are not over- or underestimated due to interactive effects between systems. Therefore, for systems where multiple automation upgrades across control points are present (e.g., generation, distribution, emission), the combined energy savings are derived using:
Multiple Combined Upgrades:
Each ratio represents the improvement of a specific automation component. Thus, enabling normalized comparison across domains and countries, especially when country-specific energy consumption data are available [15]. To prevent overestimation, each BAC upgrade factor is applied only once per domain. In cases where devices influence multiple services, interactions were modeled conservatively, and potential overlaps were acknowledged as a limitation in the results. The energy savings derived from Equations (1) and (2) serve as the basis for calculating performance indicators such as CSESP and SSEC.
Country-Specific Energy Savings Potential (CSESP) is used to estimate national-level energy savings from full deployment of each smart-ready technology. This indicator reflects energy profiles that are specific to the domains, such as heating and cooling, for each country. This acts as an indicator to reveal how climate and infrastructure influence the potential benefits of smart technologies.
The Seasonal Smart Efficiency Coefficient (SSEC) reflects seasonal demand variation, especially for heating and cooling. Devices with high SSEC values show stronger performance in countries with high seasonal heating/cooling loads. The climate zone that the country resides in plays a significant role in potential performance of smart-ready devices.
CSESP gives a broader view of energy savings potential in the national context while the SSEC is more useful for assessing and evaluating devices that operate on a seasonal basis, such as cooling systems in Mediterranean climates or heating controls in Nordic regions. Comparing these indicators across countries allows identification of region-specific strengths and weaknesses. These insights are critical for informing EU-level SRI benchmarks and ensuring future scalability and policy alignment of the smart readiness evaluation methodology.
The varying economic conditions, energy consumption intensities, and labor rates were the key factors when choosing the 3 European countries, as energy savings alone are not enough to assess economic viability [16]. So, this study introduces several performance indicators to assess the financial feasibility of the smart-ready technologies used.
Thus, benchmarking is achieved on a wide range of economic and climatic conditions. For quantifying the energy and cost performance of smart technologies and the savings estimation and financial metrics LCIF and SRCI can be used. The Smart Readiness Cost Index (SRCI) evaluates the cost of implementing smart-ready technologies in a building. A lower SRCI reflects more cost-effective upgrades. The Labor Cost Impact Factor (LCIF) takes into account only the labor proportion of total cost, which is related to installation, reflecting regional variations in workforce costs [10,17]. The formula for SRCI and LCIF are as follows.
To assess the financial performance beyond energy metrics, the Return on Smart Investment (RoSI) is calculated based on the Net Present Value (NPV) of projected energy savings over a 10-year system lifetime. This approach accounts for the time value of money using a fixed discount rate, and compares the NPV of cumulative savings against the total investment cost. Devices that have positive RoSI values are deemed financially sustainable without incentives. Whenever RoSI value is found to be negative, it suggests the need for policy incentives to support market adoption [3].
The Smart Investment Break-Even Period (SIBEP) is calculated as a simple payback period, dividing the upfront and operational costs by the average annual energy cost savings. Unlike the RoSI, this metric does not account for the time value of money. While widely used in practice due to its simplicity, this approach may underestimate break-even timeframes in dynamic market conditions. Future studies may incorporate discounted payback models for more accurate investment projections. When a device with a calculated SIBEP value below the assumed lifetime of the smart-ready device is encountered, it is considered a financially justifiable investment [18].
It should be noted that this study does not differentiate between building typologies (e.g., residential, office, mixed-use), which can significantly influence energy consumption patterns and upgrade feasibility. For the purposes of this study, the building is assumed to be 120 m2 residential building. Future work should incorporate typology effects to improve generalizability.
3. Methodology
This methodology is aimed to assess and compare the energy savings potential, labor intensity, financial viability, and cost efficiency of the dedicated smart ready technologies across three countries: Cyprus, Italy, and The Netherlands. The analysis compares the cost indicators to enable cross-country benchmarking while still considering the local energy profiles and economic conditions. This study focuses on device-level analysis and does not include building typology (residential, office, mixed-use) or envelope characteristics such as insulation, glazing, or HVAC system configuration. These factors significantly affect energy performance and should be considered in future domain-level or whole-building studies.
3.1. Scope and Reference Framework
The study is conducted entirely at the device level, using technical and cost data specific to smart-ready technologies. This granularity allows for precise comparison but limits direct extrapolation to full-building scenarios. While the results inform domain-level insights, whole-building interpretations would require aggregation models that account for system interactions and occupancy factors. The focus is on the analysis of 11 representative smart-ready devices, covering a broad range of building automation and control functionalities. Three factors were taken into consideration while choosing the 11 devices: (i) availability in all three national markets; (ii) representation of the fundamental building automation functions (communication, control, and sensing); and (iii) coverage of applications linked to both heating and cooling. This guarantees representativeness and comparability within the parameters of the research. The smart ready devices include sensors, thermostats, communication gateways and controllers.
Cyprus was chosen to be the reference country where all cost-based indicators benchmarked against its values. Relative assessments for Italy and The Netherlands were derived from normalization against the reference values in Cyprus. The effects of installing the selected 11 devices were analyzed through calculation of key performance indicators. Although the Smart Readiness Indicator (SRI) is formally structured at the domain level (e.g., energy, comfort, grid), this study employed device-level analysis. This approach was chosen to enable replicable benchmarking based on concrete market data (prices, installation costs, and technical specifications). While domain-level assessment remains essential for policy alignment, device-level benchmarking provides granular evidence that can later be aggregated to domain scales. We acknowledge this methodological choice as a limitation but also as a necessary first step toward scaling the indicators. This normalization approach draws conceptually from the ISO 52120-1 framework but extends it by adapting device-level factors to allow comparative benchmarking across national conditions.
3.2. Data Sources and Processing
The values of cost, labor, and energy-related parameters were collected using a structured data gathering process designed to reflect realistic conditions in Cyprus, Italy, and The Netherlands.
Device costs: Market-available smart-ready technologies (thermostats, sensors, controllers, communication modules) were surveyed using manufacturers’ technical catalogues and publicly available online databases [19]. Only prices verified by at least two sources were retained to ensure accuracy and consistency.
Labor costs: Average hourly rates for building and installation professionals were derived from Eurostat’s sector-specific labor statistics (NACE Rev. 2, Section F—Construction) [20], supplemented with data from national statistical offices and wage benchmarking reports. Device-specific installation costs were calculated by multiplying the average hourly wage by the estimated installation time.
Energy profiles: National databases and EU-level energy balance sheets [21] provided country-specific energy consumption baselines. These data were used to contextualize device-level energy savings under different climatic and infrastructure conditions.
BAC efficiency mapping: Each device was assigned a baseline functionality level and an upgraded control level, mapped to standardized BAC (Building Automation and Control) efficiency classes (A to D) according to EN ISO 52120-1 [12]. Efficiency factors were applied to country-specific domain energy consumption to derive projected energy savings. For devices that influenced multiple services (e.g., heating and cooling), combined savings were calculated using multiplicative ratios to avoid overestimation.
Calculation of financial metrics: Labor costs and device prices were combined into the Smart Readiness Cost Index (SRCI) and Labor Cost Impact Factor (LCIF). Financial performance was further assessed using the Return on Smart Investment (RoSI) and the Smart Investment Break-Even Period (SIBEP).
To summarize, Figure 1 outlines the methodological steps.
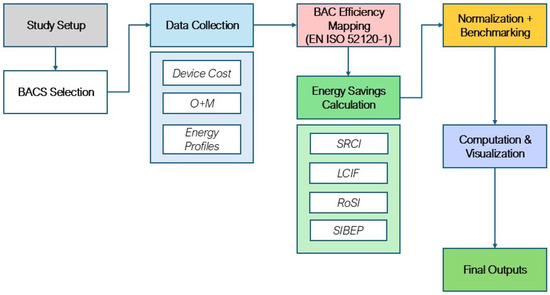
Figure 1.
Methodological steps included during the calculations.
Energy savings were determined by comparing the ratio of these coefficients for upgraded and baseline scenarios. The formula used to determine total domain energy (e.g., heating) after an upgrade for:
- A.
- Single Upgrade Scenario:
- Qh, tot, BAC = Total heating energy demand after BAC upgrade
- Qh, tot = Initial total heating energy demand
- fBAC, H = BAC efficiency factor of the upgraded control level
- fBAC, H, ref = BAC efficiency factor of the reference (baseline) control level
- B.
- Multiple Upgrade Scenario:
The single upgrade scenario is where only one upgrade was performed within a domain. The multiple upgrade scenario was where multiple upgrades were present in a single domain [22].
Labor costs were calculated as:
Labor Cost (€) = Average Hourly Rate × Estimated Installation Time (device-specific)
These were then incorporated into the total cost figures for SRCI and LCIF calculation.
3.3. Country Selection
Cyprus, Italy, and The Netherlands were chosen to represent climatic and economic variety in the EU. Cyprus was taken as the baseline to provide a reference point for cost normalization due to its relatively lower labor rates and moderate device prices. Italy was chosen to represent an average-case scenario, while The Netherlands was chosen to provide a Northern European contrast with higher labor costs and energy consumption for heating.
This selection enabled a comparative analysis that reflects both climate-related device performance and cost-related economic feasibility.
3.4. Tools and Computation
All calculations were performed using Excel and verified with Python 3.12-based scripts for batch processing. Visualization of indicator values was performed using histograms and comparative bar charts for each device and country, also created using Python scripts. To ensure comparability, all monetary values were expressed in euros (€) and standardized to 2023 market conditions. The lifetime of all devices was assumed to be 10 years. Energy prices were fixed over the analysis horizon to maintain methodological simplicity and avoid speculative inflation. The study assumes constant energy prices and a fixed 3% discount rate to ensure methodological transparency. However, these simplifications may not reflect market volatility. Future iterations of this analysis should include sensitivity assessments (e.g., ±20% variation) to quantify the impact of fluctuating energy prices and financial assumptions on economic KPIs. No incentive schemes, tax deductions, or subsidies were included in the financial calculations. CO2 emission costs were also disregarded in this study. To enhance reproducibility, an anonymized version of the calculation spreadsheets will be made available in a Supplementary Materials Repository.
4. Results
This section provides the results of numerical calculations that have been performed for different KPIs. The energy savings calculations are based on BAC efficiency ratios, and while they follow ISO guidelines, they remain dependent on assumed baseline conditions. We acknowledge that any deviation in real-world baseline values could affect the calculated savings and derived KPIs.
4.1. Smart Readiness Cost Index (SRCI)
The Smart Readiness Cost Index (SRCI) values for eleven smart-ready devices from Cyprus, Italy, and The Netherlands are shown in Figure 2. Cyprus continuously exhibits the lowest SRCI for the majority of devices, 9 out of 11, according to the data, suggesting a more economical setting for the implementation of smart technologies. This result is a result of both competitive device price in the Cypriot market and reduced labor rates. The Netherlands typically has the highest SRCI, whereas Italy typically has moderate SRCI levels. Broader macroeconomic disparities, including the higher labor and construction-related costs in the Dutch market, are consistent with this tendency. The observed SRCI values demonstrate that economic indicators such as labor costs and device pricing have a significant effect on feasibility and therefore should be considered alongside technological performance in smart-readiness evaluations.
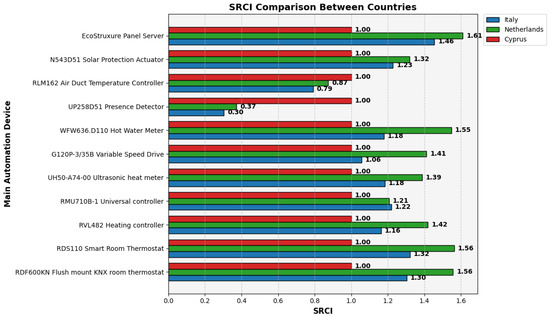
Figure 2.
SRCI calculated for 11 dedicated devices in Cyprus, Italy, and The Netherlands.
4.2. Labor Cost Impact Factor (LCIF)
The Labor Cost Impact Factor (LCIF) for the same 11 devices is shown in Figure 3. This index shows how much of the overall installation expenses are attributable to labor alone, as opposed to the cost of supplies or equipment. Interestingly, for eight of the devices, The Netherlands had the highest LCIF, indicating a substantial financial barrier to SRT adoption in high-wage economies. Despite being the standard case, Cyprus exhibits the greatest LCIF for just three devices, whereas Italy continuously has the lowest overall labor cost burden. These variations show how labor market factors might impact national preparedness for smart technology scaling and distort financial attractiveness. To encourage increased market penetration, policymakers in nations with high LCIF levels may take into account labor-specific incentives or subsidy programs.
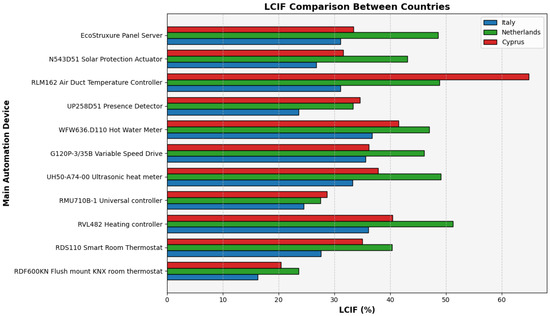
Figure 3.
LCIF given for 11 dedicated devices in Cyprus, Italy, and The Netherlands.
4.3. Country-Specific Energy Savings Potential (CSESP)
The Country-Specific Energy Savings Potential (CSESP) of each smart-ready device when fully adopted throughout the three target nations is contrasted in Figure 4. Cyprus consistently has the highest CSESP values for the majority of devices, indicating a significant opportunity to reduce energy demand, especially in areas like electricity management and cooling. For heating-focused equipment, on the other hand, this pattern reverses, with The Netherlands showing superior savings potential because of its colder environment and higher heating demand. In contrast to Cyprus, The Netherlands and Italy exhibit a substantially higher CSESP for the Heating Controller. These findings support the need for climate-sensitive benchmarking in technology evaluations by confirming that climatic and infrastructure conditions significantly impact the anticipated advantages of SRT adoption.
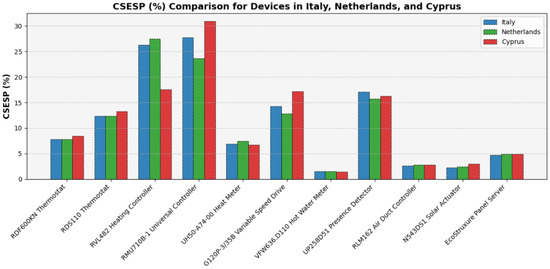
Figure 4.
CSESP given for 11 dedicated devices in Cyprus, Italy, and The Netherlands.
4.4. Seasonal Smart Efficiency Coefficient (SSEC)
Figure 5 shows the Seasonal Smart Efficiency Coefficient (SSEC), which separates savings for six of the eleven devices that are directly associated with seasonal loads, such as heating and cooling. Cyprus recorded the highest SSEC values for five of the six devices, reflecting low baseline automation levels combined with large seasonal cooling demand. For most devices, however, national differences remained within ±2%, suggesting broadly similar proportional energy use across seasonal loads. The biggest difference is in the RMU710 B-1 Universal Controller, where Cyprus is ahead of The Netherlands by 6%. The structural reality that heating and cooling loads account for 65–70% of total energy demand in all three nations is reflected in these narrow margins, which causes the relative seasonal efficiency potential to converge. The relatively high SSEC value of the RMU710 B-1 Universal Controller in Cyprus can be explained by its advanced multi-domain control functions, which interact strongly with the baseline of low automation levels in the Cypriot market. This device’s adaptability to both cooling and heating modes amplifies seasonal efficiency gains where automation penetration is limited. Such device-specific characteristics explain why results are not solely a reflection of climatic variation.
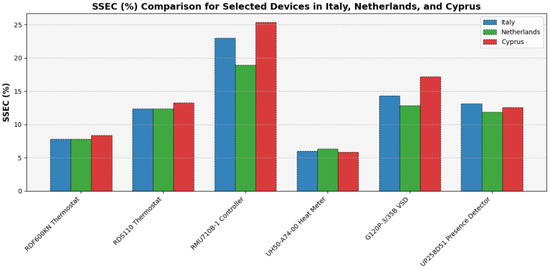
Figure 5.
SSEC given for 6 dedicated devices in Cyprus, Italy, and The Netherlands.
4.5. Return on Smart Investment (RoSI)
The Return on Smart Investment (RoSI) for 11 devices in Italy, Cyprus, and The Netherlands is shown in Figure 6, which shows a diverse range of financial feasibility. With five devices—most notably the UP258D51 Presence Detector (94.1%), RVL482 Heating Controller (60.3%), and VFW636.D110 Hot Water Meter (50.1%)—achieving exceptionally high returns, Italy exhibits the greatest RoSI values overall. This suggests advantageous investment circumstances, probably brought about by high operational savings and balanced installation costs. Additionally, Cyprus displays favorable RoSI values for eight devices, with the G120P Speed Drive (48.9%) and the RDS110 Smart Room Thermostat (40.6%) demonstrating consistently good performance. Despite having fewer high-value findings, The Netherlands produces respectable RoSI for three devices, namely the Smart Thermostat (15.5%) and the RVL482 Heating Controller (52.8%). The UH50 Ultrasonic Heat Meter and the G120P Drive in The Netherlands are two examples of devices that show negative RoSI in at least one country, underscoring the significance of regional cost structures and energy pricing in assessing viability. These results imply that although certain SRTs show strong economic returns in a variety of settings, others continue to be extremely susceptible to local conditions.
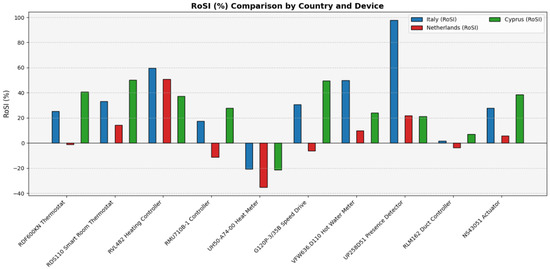
Figure 6.
RoSI given for 11 dedicated devices in Cyprus, Italy, and The Netherlands.
The outcomes shown in Figure 6 were computed without taking into consideration any incentives that government agencies might offer. Analysis of Figure 6 shows inconsistent patterns in device-level financial sustainability. Cyprus recorded positive RoSI values for six devices, while The Netherlands and Italy displayed negative returns for the majority of devices. This indicates that, under current cost structures and without incentives, large-scale deployment of most devices is not financially viable.
4.6. Smart Investment Break-Even Period (SIBEP)
The Smart Investment Break-Even Period (SIBEP), which shows how long it will take for total investment to equal cumulative savings, is depicted in Figure 7. SIBEP stays within the 10-year device lifespan for the majority of devices, suggesting that these technologies can fully return their capital within the anticipated time frame. Despite higher intermediate labor costs, Italy performs better than the other nations in this parameter for five of the eleven gadgets, indicating good circumstances for a quick return on investment. The Netherlands, on the other hand, trails behind in SIBEP for high-labor devices, which supports SRCI and LCIF trends. Crucially, a moderate SIBEP in some situations suggests that cumulative energy savings eventually balance upfront expenses even when RoSI is negative. This is especially true when running for extended periods of time or when using policy support mechanisms.
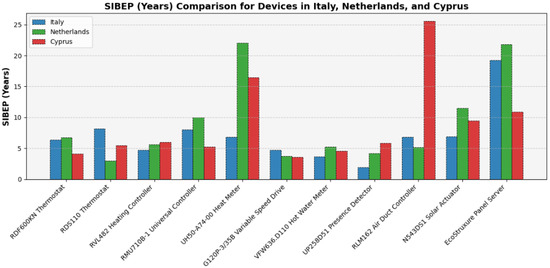
Figure 7.
SIBEP is given for 11 dedicated devices in Cyprus, Italy, and The Netherlands.
5. Discussion
This study was motivated by the limited availability of financial evaluations of smart-ready devices, particularly across diverse European regions and shows the importance of assessing SRTs with multiple economic, climatic, and technical Key Performance Indicators. The observed variability in the Labor Cost Impact Factor (LCIF) and the Smart Readiness Cost Index (SRCI) across the three countries shows that the deployment of the SRTs is influenced by the local economic conditions and structures. These results align with the study of Vimpari and Junnila (2020) where it is pointed out that the lifecycle cost is very sensitive to regional labor dynamics and the regulatory environments [23]. It is important to emphasize that lifecycle considerations underpin the financial evaluation of smart-ready technologies. Installation costs, operational savings, maintenance requirements, and replacement intervals all interact over a 10-year assumed device lifetime. Indicators such as RoSI and SIBEP are therefore not static values but reflect cumulative interactions across the lifecycle. This highlights the need for future studies to explicitly integrate lifecycle stages, from procurement to end-of-life, into techno-economic assessments of SRTs.
Due to low labor rates and smaller hardware costs, Cyprus displayed the highest SRCI values across the countries, where it was leading for 9 out of 11 devices in SRCI values. These findings support the previous work performed by Li and Wen (2018) [24], which shows that the barriers related to the cost of SRTs can be mitigated by precisely targeted investment strategies and efficiencies in the local markets. On the other hand, The Netherlands was seen to be exhibiting high LCIF values, which indicates that the labor-intensive installations might prevent SRTs from being widely implemented in high-income nations unless they are offset by robust financial incentives or labor reduction techniques based on technology [10].
When the energy aspect was considered, the CSESP values showed that the performance of the devices was closely related to the climatic conditions in which they were placed. Devices with higher cooling efficiency in Cyprus were shown to be more efficient, while the heating devices showed relatively higher performance in The Netherlands. These findings were supported by Zhou et al. (2016), where it is stated that climate-sensitive demand plays a pivotal role when optimizing the performance of smart HVAC systems [25].
When SSEC values were considered, there was relatively low difference between the three countries, which reinforces the idea that seasonal loads were the dominating factor for the energy use across Europe (Böhm and Danig 2004) [26]. Nonetheless, higher SSEC values that were observed for RMU710 B-1 Universal Controller in Cyprus indicate that the baseline automation levels are equally influential at the local level. During the assessment of potential benefits of SRTs, the importance of including baseline technological maturity was highlighted, especially for comparative evaluations [27].
When financial performance was taken into consideration, RoSI and SIBEP values provided useful insights. For profitability, Italy was the leading country among the three despite the fact that it had higher labor costs compared to Cyprus. This suggests that the expenses faced during the installation process can be negated by the operational costs and benefits. These results are also supported by Deb et al. (2021) [28], where it was shown that long-term returns can be maximized when the devices are chosen carefully according to climatic needs and design requirements with respect to data-driven deployment strategies, so the performance is optimized locally.
However, it should be noted that some devices exhibited negative RoSI values, which suggests that the need for supportive policies such as tax deductions and subsidies is critical, especially in high-cost markets. Papadopoulos and Kontokosta (2020) [29] also support this claim while discussing the importance of dynamic financial models for retrofit investment strategies.
When different financial and energy-based KPIs were compared, it is clear that a one-size-fits-all solution is not realistic when it comes to smart building upgrades. On the contrary, the results indicate that a geographically localized and tailored approach is a necessity where economic state, energy pricing, and seasonal demand patterns are all taken into consideration. The methodology of this study can be employed as the base layer for the calculation of similar energy performance and economic KPIs for an extended list of SRTs. Other European countries can begin utilizing it for national and EU-level policy development and investment strategies.
It should also be noted that the analysis in this study was limited to device- and country-level parameters. Building typology, envelope properties, window-to-wall ratio, and baseline automation levels also exert strong influence on energy savings and cost-effectiveness. These factors were outside the scope of the present device-level comparison but should be considered in future work.
While this study quantified results at the device scale, its broader contribution lies in showing how key barriers—labor cost, energy price, climatic conditions, and baseline automation—shape financial feasibility. Future research should extend this framework to domain-level analyses, where these barriers can be explicitly mapped and mitigation strategies such as incentives, training, or technology standardization can be systematically evaluated. Furthermore, future studies should also investigate how cost-effectiveness evaluations might incorporate externalities like social co-benefits and CO2 emission reductions. Finally, more accurate estimates of long-term financial sustainability might be obtained by including dynamic energy price models and new financing techniques like on-bill financing or ESCO (Energy Service Company) models.
6. Conclusions
A comprehensive evaluation framework is proposed by this study for the assessment of energy and financial performance of 11 SRTs, where three European countries were targeted: Cyprus, Italy, and The Netherlands. The analysis offered an in-depth assessment of the techno-economic feasibility of device-level smart upgrades by combining energy-focused metrics like Country-Specific Energy Savings Potential (CSESP) and the Seasonal Smart Efficiency Coefficient (SSEC) with cost-based indicators like the Smart Readiness Cost Index (SRCI), Labor Cost Impact Factor (LCIF), Return on Smart Investment (RoSI), and Smart Investment Break-Even Period (SIBEP).
As a result, it was seen that the climatic conditions, national labor rate differences, and the baseline automation levels of the three countries notably changed the cost-effectiveness of the 11 SRTs that were compared. For viability, Cyprus was the leading country for most of the devices with reduced labor costs and increased favorability for market conditions. On the other hand, Italy displayed robust RoSI values even though the initial installation costs were higher. Thus, a good balance between the benefits and the costs was displayed. Although The Netherlands had higher upfront and labor costs, it demonstrated higher profitability from seasonal heating-based applications.
It is also important to note that the results indicate that financial viability is a function of economic and environmental contexts rather than a fixed technological attribute. Thus, this study supports an approach where SRT deployment is backed by local economic and environmental contexts.
This research paper contributes to SRT development and design by offering a scalable and standardized evaluation methodology paired with country-sensitive evaluation to stakeholders. This allows for greater information-based decision-making for smart technology adoption strategies and the built environment.
In order to improve the accuracy of investment models in the quickly changing field of smart and sustainable buildings, future research could expand this strategy by including dynamic factors like CO2 pricing, real-time energy tariffs, and behavioral adaptation.
Supplementary Materials
The following supporting information can be downloaded at: https://data.mendeley.com/datasets/cyyghnw9vm/1 (accessed on 17 July 2025).
Author Contributions
T.E.: Formal Analysis, Visualization, Writing—Original Draft; P.K.: Data Curation, Software, Validation, Visualization, Writing—Review and Editing; D.I.: Software, Validation, Writing—Review and Editing; B.I.: Writing—Review and Editing, Supervision; C.T.: Writing—Review and Editing; P.F.: Conceptualization, Methodology, Supervision, Funding Acquisition, Writing—Review and Editing. All authors have read and agreed to the published version of the manuscript.
Funding
This study is part of the dissemination activities of the research project Improving and demonstrating the potential of SRI (easySRI) (Grant Agreement No. 101077169), funded under LIFE-2021-CET-SMARTREADY.
Data Availability Statement
The original contributions presented in this study are included in the article. Further inquiries can be directed to the corresponding author.
Acknowledgments
The authors would like to acknowledge Pavlos Papadopoulos for his valuable contributions as Project Manager of the easySRI project and for his support in the preliminary analysis underlying this study.
Conflicts of Interest
The authors declare no conflicts of interest.
Abbreviations
The following abbreviations are used in this manuscript:
| SRI | Smart-Readiness-Indicator |
| SRT | Smart-Ready Technology |
| SRCI | Smart Readiness Cost Index |
| LCIF | Labor Cost Impact Factor |
| RoSI | Return on Smart Investment |
| SIBEP | Smart Investment Break-Even Period |
| CSESP | County-Specific Energy Savings Potential |
| SSEC | Seasonal Smart Efficiency Coefficient |
| BACS | Building Automation Control Systems |
| HVAC | Heating, Ventilation, and Air Conditioning |
| ISO | International Organization for Standardization |
| BIM | Building Information Modelling |
References
- Zhou, D.; Obobisa, E.S.; Ayamba, E.C. Achieving carbon neutrality goal in European countries: The role of green technology innovation, renewable energy, and financial development. Environ. Dev. Sustain. 2024, 1–31. [Google Scholar] [CrossRef]
- energy.ec.europa.eu. Smart Readiness Indicator. 2025. Available online: https://energy.ec.europa.eu/topics/energy-efficiency/energy-efficient-buildings/smart-readiness-indicator_en (accessed on 17 July 2025).
- Laidi, R.; Djenouri, D.; Ringel, M. Commercial technologies for advanced light control in smart building energy management systems: A comparative study. arXiv 2019, arXiv:1907.10429. [Google Scholar] [CrossRef]
- Energy. Energy Performance of Buildings Directive. 2023. Available online: https://energy.ec.europa.eu/topics/energy-efficiency/energy-efficient-buildings/energy-performance-buildings-directive_en#legislative-timeline (accessed on 19 July 2025).
- Janhunen, E.; Leskinen, N.; Junnila, S. The Economic Viability of a Progressive Smart Building System with Power Storage. Sustainability 2020, 12, 5998. [Google Scholar] [CrossRef]
- Harmathy, N. Analysis of smart building solutions for optimizing the energy performance in a new commercial building. Therm. Sci. 2022, 26, 3119–3132. [Google Scholar] [CrossRef]
- Heralova, R.S. Life cycle costing as an important contribution to feasibility study in construction projects. Procedia Eng. 2017, 196, 565–570. [Google Scholar] [CrossRef]
- Azouz, M.; Elariane, S. Towards energy efficiency: Retrofitting existing office buildings using smart technologies. J. Eng. Appl. Sci. 2023, 70, 147. [Google Scholar] [CrossRef]
- McNeil-Ayuk, N.; Jrade, A. A Building Information Modeling-Life Cycle Cost Analysis Integrated Model to Enhance Decisions Related to the Selection of Construction Methods at the Conceptual Design Stage of Buildings. Open J. Civ. Eng. 2024, 14, 277–304. [Google Scholar] [CrossRef]
- Cheng, C.C.; Lee, D. Return on investment of building energy management system: A review. Int. J. Energy Res. 2018, 42, 4034–4053. [Google Scholar] [CrossRef]
- Leskinen, N.; Vimpari, J.; Junnila, S. Using real estate market fundamentals to determine the correct discount rate for decentralised energy investments. Sustain. Cities Soc. 2020, 53, 101953. [Google Scholar] [CrossRef]
- EN ISO 52120-1:2022; Energy Performance of Buildings—Contribution of Building Automation, Controls and Building Management—Part 1: General Framework and Procedures. ISO: Geneva, Switzerland. Available online: https://www.iso.org/cms/render/live/en/sites/isoorg/contents/data/standard/06/58/65883.html (accessed on 9 July 2025).
- Walczyk, G.; Ożadowicz, A. Moving Forward in Effective Deployment of the Smart Readiness Indicator and the ISO 52120 Standard to Improve Energy Performance with Building Automation and Control Systems. Energies 2025, 18, 1241. [Google Scholar] [CrossRef]
- Bottero, M.; Cavana, G.; Dell’Anna, F. Feasibility analysis of the application of building automation and control system and their interaction with occupant behavior. Energy Effic. 2023, 16, 83. [Google Scholar] [CrossRef]
- Morkunaite, L.; Pupeikis, D.; Jurelionis, A.; Fokaides, P.A.; Papadopoulos, A. An analytical model for the impact of building control and automation upgrade on space heating energy efficiency. Buildings 2022, 12, 1074. [Google Scholar] [CrossRef]
- Delavar, T.; Borgentorp, E.; Junnila, S. The Smart Buildings Revolution: A Comprehensive Review of the Smart Readiness Indicator Literature. Appl. Sci. 2025, 15, 1808. [Google Scholar] [CrossRef]
- Gobinath, P.; Crawford, R.H.; Traverso, M.; Rismanchi, B. Comparing the life cycle costs of a traditional and a smart HVAC control system for Australian office buildings. J. Build. Eng. 2024, 91, 109686. [Google Scholar] [CrossRef]
- Karda, S.; Nagy-György, T.; Boros, I. Evolution of the Payback Period for Energy-Efficient Residential Buildings in Romania in the Last Decade. Sustainability 2023, 15, 8986. [Google Scholar] [CrossRef]
- Se.com. PAS600—EcoStruxure Panel Server—Universal Wireless, Concentrator Modbus Gateway 110-277 VAC/DC. Schneider Electric USA. 2025. Available online: https://www.se.com/us/en/product/PAS600/ecostruxure-panel-server-universal-wireless-concentrator-modbus-gateway-110277-vac-dc/?%3Frange=40739468-ecostruxure-panel-server&parent-subcategory-id=4160&selectedNodeId=58174382282 (accessed on 5 June 2025).
- Europa.eu. 2020. Available online: https://ec.europa.eu/eurostat/databrowser/view/tps00173/default/table?lang=en (accessed on 25 June 2025).
- Europa.eu. 2025. Available online: https://ec.europa.eu/eurostat/databrowser/view/nrg_bal_c__custom_16988676/default/table?lang=en (accessed on 5 June 2025).
- Martinez, L.; Klitou, T.; Olschewski, D.; Melero, P.C.; Fokaides, P.A. Advancing building intelligence: Developing and implementing standardized Smart Readiness Indicator (SRI) on-site audit procedure. Energy 2025, 316, 134538. [Google Scholar] [CrossRef]
- Vimpari, J.; Kajander, J.K.; Junnila, S. Valuing flexibility in a retrofit investment. J. Corp. Real Estate 2014, 16, 3–21. [Google Scholar] [CrossRef]
- Li, X.; Wen, J. Review of building energy modeling for control and operation. Renew. Sustain. Energy Rev. 2014, 37, 517–537. [Google Scholar] [CrossRef]
- Zhou, D.; Zhao, J.; Li, Z.; Wang, S. Climate-responsive building design and control strategies for smart energy use. Appl. Energy 2016, 168, 451–463. [Google Scholar]
- Bøhm, B.; Danig, P.O. Monitoring the energy consumption in a district-heated apartment building in Copenhagen with specific interest in the thermodynamic performance. Energy Build. 2004, 36, 229–236. [Google Scholar] [CrossRef]
- Dahmen, M.; Sauer, M.; Wesseling, M. Smart building automation: A comparative framework and methodology. Build. Environ. 2019, 162, 106261. [Google Scholar]
- Deb, C.; Dai, Z.; Schlüeter, A. A machine learning-based framework for cost-optimal building retrofit. Appl. Energy 2021, 298, 117–940. [Google Scholar] [CrossRef]
- Papadopoulos, S.; Kontokosta, C.E. Energy disclosure, market behavior, and the building data ecosystem. Energy Policy 2020, 147, 111836. [Google Scholar]
Disclaimer/Publisher’s Note: The statements, opinions and data contained in all publications are solely those of the individual author(s) and contributor(s) and not of MDPI and/or the editor(s). MDPI and/or the editor(s) disclaim responsibility for any injury to people or property resulting from any ideas, methods, instructions or products referred to in the content. |
© 2025 by the authors. Licensee MDPI, Basel, Switzerland. This article is an open access article distributed under the terms and conditions of the Creative Commons Attribution (CC BY) license (https://creativecommons.org/licenses/by/4.0/).