Abstract
This study evaluates the impact of a Closed Crankcase Ventilation (CCV) system on Caterpillar G3516J NG engine performance and emissions, focusing on engine performance, methane (CH4) emissions, oil consumption, and oil particle size distribution. Three configurations were analyzed: Indirect Open Crankcase Ventilation (OCV), OCV-Direct, and CCV. The results show that the CCV system significantly reduced CH4 slip, with reductions ranging from 12% to 23% compared to the Indirect OCV configuration, and 10% to 17% compared to the OCV-Direct configuration. The CCV system also lowered oil concentration in the crankcase ventilation gas and demonstrated high filtration efficiency, achieving values between 99.22% and 99.89%. The oil particle size distribution revealed a substantial reduction in the concentration of smaller particles, with filtration efficiencies ranging from 88.77% for the smallest particles (0.032 µm–0.018 µm) to 99.89% for particles between 1 µm and 0.560 µm. These results suggest that the CCV system not only enhances engine thermal efficiency by reducing CH4 slip but also contributes to lower oil consumption and reduced particulate matter (PM) emissions. Additionally, the study demonstrates the effects of the CCV system on engine operational parameters like crankcase pressure and performance metrics like Brake Specific Fuel Consumption (BSFC).
1. Introduction
Natural gas (NG) has played a key role in meeting global energy demand. In 2022, NG accounted for 23.1% of the total energy supplied worldwide [1]. In the United States, it is the second most widely used energy source after oil, comprising 35.3% of the total energy supply in 2023 [2]. NG is a popular alternative fuel due to its relatively low emissions, high heating value, widespread availability, and competitive cost. Its primary constituent, methane (CH4), has a lower carbon-to-hydrogen ratio than conventional fuels such as fuel oil, coal, and gasoline, resulting in lower CO2 emissions per unit of energy produced. Despite of producing less CO2 when combusted, NG combustion systems are susceptible to “methane slip,” wherein a fraction of the CH4 entering the combustion chamber remains unburned. Although CH4 has a shorter atmospheric lifetime than CO2, it is significantly more potent as a greenhouse gas (GHG), with a global warming potential 28 times greater than that of CO2 over a 100-year period [3]. In 2022, methane emissions represented 12% of all U.S. greenhouse gas emissions from anthropogenic sources [4]. In response, legislation such as the Inflation Reduction Act (IRA) was enacted to mitigate CH4 emissions. The IRA imposes penalties on petroleum and natural gas facilities emitting more than 25,000 metric tons of CO2-equivalent per year. The waste emission charge begins at $900 per metric ton of CH4 in 2024, increasing to $1500 per metric ton by 2026 and beyond [4].
The Department of Energy (DOE) has set a target for CH4 conversion efficiency of ≥99.5% to reduce CH4 slip emissions [5]. Achieving this goal requires the integration of multiple technologies into NG systems. For industrial NG engines, which approximately account for 25% of CH4 emissions of the U.S NG gathering and boosting sector [6], there are multiple promising technologies to reduce CH4 emissions. These include Closed Crankcase Ventilation (CCV), CH4 oxidation aftertreatment catalysts, and low crevice volume pistons. This paper focuses on evaluating the performance and effects of the CCV system and its effectiveness in reducing CH4 emissions originating from crankcase gas (CCG), also referred to as engine blow-by, in a lean-burn natural gas stationary engine.
The function of the CCV system is to filter and recirculate CCG while maintaining acceptable engine operational stability. CCG consists of a mixture of unburned fuel–air, exhaust gases, and oil mist, that flows into and out of the engine crankcase. During the compression and expansion strokes, both unburned and burned gases in the combustion chamber are forced into the piston crevice volumes [7]. These crevices volumes are narrow regions between the piston crown, piston rings, and cylinder wall, where the combustion flame is quenched by heat transfer to the cooler crevice surfaces contributing to hydrocarbons leftover. During the expansion stroke, some of the gas in the crevice volume flows back into the combustion chamber, while the remainder escapes into the crankcase as CCG or blow-by [7]. If not properly managed, CCG can accumulate in the engine crankcase and cause engine crankcase over-pressurization, potentially damaging oil seals and degrading engine performance. In most industrial engines, the conventional Open Crankcase Ventilation (OCV) system vents CCG directly to the atmosphere to prevent engine crankcase over-pressurization (Figure 1 Left). While effective at pressure control, this result in the loss of fuel and hydrocarbon (HC) emission, mainly CH4. The CCV system addresses this inefficiency by recirculating CCG to the intake manifold, giving the unburned CH4 and other HCs another opportunity for combustion. This recirculation can enhance thermal efficiency by reducing fuel loss.
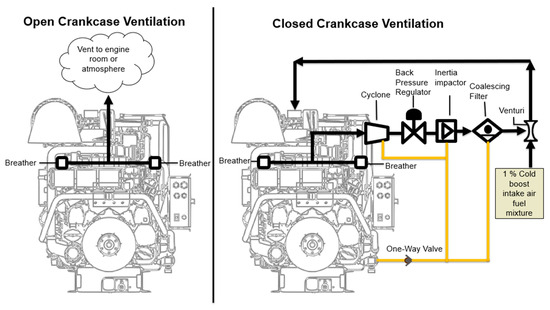
Figure 1.
(Left)—Open Crankcase Ventilation (OCV). (Right)—Closed Crankcase Ventilation (CCV).
In this study, the CCV system was installed on one of the engine cam covers and connected upstream of the turbocharger compressor. The system included oil separation components, a backpressure regulator, a venturi, and a one-way valve to enable effective oil recirculation without compromising engine performance (Figure 1 Right). A major challenge in CCG recirculation is the presence of oil particles, which must be thoroughly removed to prevent fouling of critical components such as turbochargers, valves, aftercoolers, and after-treatment systems. Such fouling can significantly impair engine efficiency and performance [8]. Subsequent work will study the CCV system durability and reliability tested in a one-year field test performance, as well as piston ring pack geometry and fluid dynamics that produce CCG emissions.
2. Materials and Methods
The engine used in this study was a Caterpillar G3516J four-stroke, lean-burn, spark-ignition (SI) engine (Table 1), commonly employed in gas compression applications. This engine was donated to Colorado State University by a midstream company, Western Midstream, and was rebuilt by Wagner Caterpillar. It was in new condition at the beginning of the laboratory testing.

Table 1.
G3516J Engine Specifications.
2.1. The CCV Unit
The CCV unit used in these experiments was also newly deployed. The CCV system consisted of multiple components, as shown in Figure 2. The first stage of the CCV unit was a screen filter, which removed larger oil droplets from the CCG. The second component consisted of heater elements located on the top and front surfaces of the CCV housing. These heaters were intended to prevent vapor condensation and to aid drainage by reducing oil viscosity under freezing conditions; however, they were not used during any of the tests. Following the heater elements, a cyclone separator targeted larger oil particles. The cyclone introduced a swirling motion to the gas stream, creating a centrifugal force that pushed entrained oil particles toward the walls of the chamber, where they were drain back to the engine crankcase by gravity.
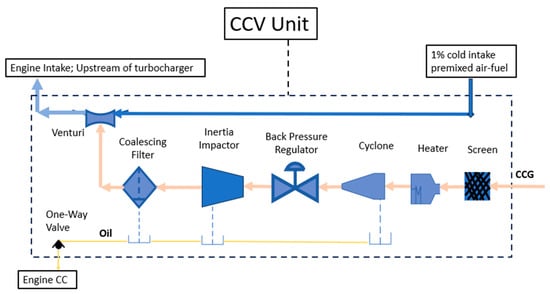
Figure 2.
CCV system schematic.
Downstream of the cyclone was a backpressure regulator that controlled the vacuum applied to the crankcase by the engine turbocharger compressor and the venturi system. This regulator, referenced to atmospheric pressure, maintained the crankcase pressure slightly below atmospheric levels. The regulator operated by dithering—modulating its position to maintain the desired crankcase pressure. At high engine loads, when the turbocharger and venturi generated a high vacuum, the regulator reduced the flow area to limit vacuum levels in the crankcase. At idle or low-load conditions, when vacuum decreased, the regulator increased the flow area to maintain adequate evacuation.
Following the pressure regulator was an inertial impactor designed to remove coarse aerosol particles (10 µm > d > 2.5 µm). This device functioned by forcing the gas to abruptly change direction around an impaction plate. Particles with sufficient inertia deviated from the gas stream and impacted on the plate surface, thereby separating from the flow [9]. The final filtration stage was a coalescing filter, which trapped fine oil aerosol particles (d < 2.5 µm) through an inside-out flow configuration. Within the filter media, smaller particles coalesced to form larger droplets, which then drained by gravity back to the crankcase oil reservoir.
The CCV unit also featured a venturi, which prevented crankcase over-pressurization and facilitated CCG flow from the crankcase to the engine intake. This venturi effect was enabled by diverting approximately 0.7% to 1% of the intake cold premixed air–fuel flow—referred to as the “venturi flow.” The final component of the CCV system was a one-way check valve installed in the oil drain line. This valve permitted the return of filtered oil to the crankcase while preventing reverse flow of oil from the crankcase into the engine intake.
2.2. CCG Measurement Probe
CCG characterization, measurement probes were assembled by the CSU research team. In the Open Crankcase Ventilation (OCV) configuration, the probe enabled measurement of temperature, pressure, oil concentration, oil distribution, gas flow rate, and gas composition of the CCG (Figure 3 Top). In the Closed Crankcase Ventilation (CCV) configuration, the probe was used to characterize the gas flow rate, oil concentration, oil distribution, gas composition, temperature, and pressure of the CCG and venturi flow mixture downstream of the CCV unit (Figure 3 Bottom).
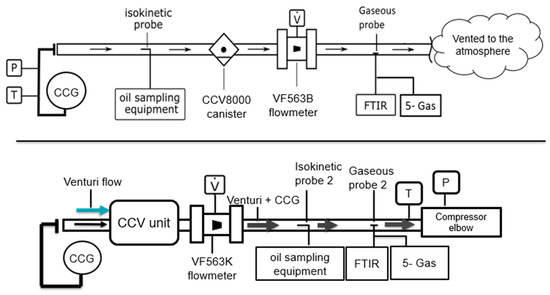
Figure 3.
(Top)—OCV Measurement Probe. (Bottom)—CCV Measurement Probe.
In the OCV configuration (Figure 3 Top), a CCV8000 canister acted as an oil dropout drum upstream of the flow meter to prevent excessive oil contamination and to dampen pressure fluctuations for more stable flow measurements. JTEC flowmeters based on vortex shedding were used, with a repeatability of ±0.5% and an accuracy of ±2% of full scale. The VF563B model, with a measurement range of 1 to 27 m3/h was employed. To ensure reliable measurements, the flow meter required 20 pipe diameters of undisturbed flow upstream and 10 diameters downstream [10]. In the CCV configuration (Figure 3 Bottom), measurement instruments were placed downstream of the CCV unit. A higher capacity VF563K flow meter was used, covering a range of 1.6 to 79 m3/h, to accommodate the added venturi flow. A modified isokinetic probe was fabricated and used due to the presence of the venturi flow. The major constraint in this setup was limited space, which prevented full adherence to the required sampling lengths for the isokinetic probe, gaseous probe, and flow meter. Additionally, temperature and pressure were measured downstream of the CCV unit.
The oil sampling system consisted of a near-isokinetic sampling probe, a controller, a vacuum pump, a filter cartridge device, and a Nano-Moudi cascade impactor. The isokinetic probe was designed to match the velocity of the gas in the pipe to that at the probe entrance. For accurate particulate matter (PM) sampling, the probe location followed US EPA guidelines for gas sampling which required eight pipe diameters of undisturbed flow upstream and two pipe diameters downstream [11]. This setup was achieved in the OCV configuration but could not be met in the CCV configuration due to spatial limitations.
In both configurations, oil concentration samples were collected using a filter cartridge containing a Teflon filter followed by a Quartz filter. The Teflon filter captured PM, while the Quartz filter trapped both PM and organic vapors. The Quartz filters primarily served to prevent oil mist from contaminating downstream equipment and were not analyzed. The analysis focused on PM, which can be divided into organic carbon (OC) and elemental carbon (EC). Based on Olsen et al., PM in natural gas engines is predominantly OC, primarily derived from lubricating oil [12]; therefore, EC was considered negligible for this study. The Teflon filters were subjected to gravimetric analysis to determine gas oil concentration and, ultimately, oil carryover for both configurations.
The Nano-Moudi cascade impactor featured thirteen impaction stages with aluminum filters and one stage with a Teflon filter. It collected oil droplets across a range of aerodynamic diameters. In each stage, the gas sample passed through a nozzle and impinged on a downstream plate with a filter. Particles with sufficient inertia deviated from the streamlines and impacted the filter, while smaller particles followed the flow to the next stage. As the nozzle size decreased through the stages, the particle cut-off diameter also decreased, enabling sequential removal of larger particles first.
The final components of the measurement system included gas sampling hardware: a gaseous probe, an emission-heated sample line, an MKS Model 230 Fourier Transform Infrared (FTIR) spectrometer, and a 5-gas analyzer. The CCG was sample following EPA sampling location [11] and transported through the emission heated sample line to both the FTIR and the 5-gas analyzer for compositional analysis.
2.3. Data Collection
Data collection was conducted over multiple testing days. Key performance metrics such as total CH4 slip, CCG CH4 slip, CH4 reduction achieved by the CCV system, and CCV oil filtration efficiency were determined by comparing results between OCV and CCV configurations. The OCV configuration was further divided into two sub-configurations for quantifying emissions, referred to as the “Direct OCV” and “Indirect OCV” configurations. Both were used as baselines for comparison with the “CCV” configuration.
2.3.1. Direct OCV Configuration
The “Direct OCV” configuration involved directly measuring the exhaust CH4 slip and the CCG CH4 slip, then summing them to calculate the total engine CH4 slip. The total CH4 slip and corresponding CH4 reduction in this method were calculated using Equations (1)–(9). In this configuration, the CCG sample was extracted from cam cover 11 (Figure 4 Top-Left), as this was the location where the CCV system was installed. Maintaining this sampling location ensured consistency across configurations. The CCG was routed through the OCV measurement probe and vented outside the engine lab (Figure 4 Top-Right).
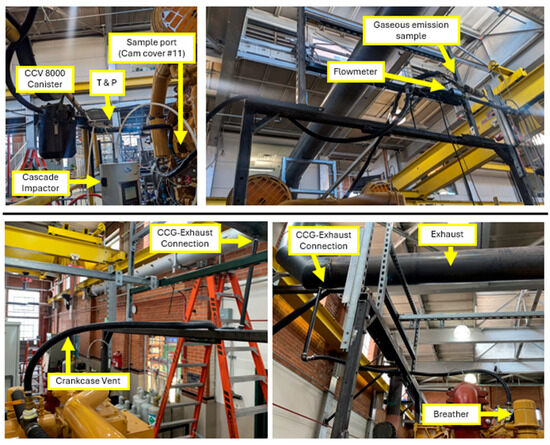
Figure 4.
(Top) Direct OCV configuration. (Bottom) Indirect OCV configuration.
Figure 5 presents a schematic of the Direct OCV configuration, detailing the CCG flow path and instrumentation used to measure CCG pressure, temperature, flow rate, and chemical composition. All measurements were conducted at three engine speeds: 1400 RPM, 1200 RPM, and 1050 RPM, and three engine loads: 50%, 75%, and 100%. Each gas sample point was a five-minute average.
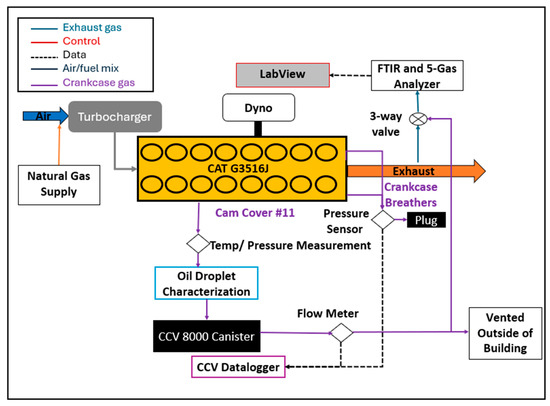
Figure 5.
Direct OCV Configuration Schematic.
Oil concentration measurements were conducted under the same engine operating conditions. Each oil sample was collected over a duration of three minutes. For each load condition (50%, 75%, 100%) at 1400 RPM, three replicate samples were taken. At 1200 RPM and 1050 RPM, two samples were collected for each load. Oil droplet size distribution measurements using the cascade impactor were performed only at 1400 RPM and 100% load, with each sampling period lasting seven and a half minutes.
Equations (1)–(6) for Direct OCV:
where,
= CCG flow rate.
= CCG CH4 flow rate.
= intake fuel flow rate.
= intake air flow rate.
= CCG CH4 mole fraction.
= Exhaust CH4 mole fraction.
= CCG Molecular Weight.
= Exhaust Molecular Weight.
= CH4 flow rate in the exhaust (Direct OCV).
= CH4 flow rate into the engine.
= Total CH4 slip (OCV configuration).
2.3.2. Indirect OCV Configuration
The second method, referred to as the “Indirect OCV” configuration, involved physically connecting the crankcase vent to the exhaust system and measuring the CH4 concentration downstream of the connection to determine the total CH4 emissions. This flow connection was designated as the “CCG-Exhaust Connection” (Figure 4 Bottom). In this configuration, no direct measurement of the CCG was performed. Instead, the method was only used to quantify the total CH4 emissions from the engine and assess the CH4 emission reduction achieved by the CCV system. For this setup, cam cover 11 was sealed, and the crankcase breathers were routed to the exhaust piping (Figure 4 Bottom). In addition to the laboratory data acquisition system, which collected engine operating data from the Engine Control Module (ECM), a heated sample line was used to analyze the exhaust gas composition downstream of the CCG-Exhaust Connection. The Indirect OCV configuration served to increase confidence in the results by providing a simpler measurement setup with reduced instrumentation and, consequently, lower uncertainty. Furthermore, this method enabled a direct comparison of the total engine CH4 emissions with and without the CCV system.
Equations (7) and (8) for Indirect OCV configuration:
where,
= Exhaust CH4 flow rate (Indirect OCV).
= Total CH4 slip (Indirect OCV).
= Exhaust and CCG total Molecular Weight.
2.3.3. CCV Configuration
In this configuration, measurements were performed downstream of the CCV unit (Figure 6 Left). Crankcase ventilation gas temperature, pressure, volumetric flow rate, and gas chemical composition were monitored, with each gas sample collected over a five-minute duration, consistent with the OCV configurations. However, particulate matter (PM) sampling durations were doubled compared to the OCV setup to ensure sufficient oil mass accumulation on the filters, thereby reducing measurement uncertainty. This extended sampling duration was necessary to compensate for the lower oil mass expected downstream of the CCV unit due to its filtration efficiency and to minimize the effect of instrumentation error. Consequently, oil concentration samples were collected over a six-minute period, while oil distribution measurements lasted 15 min. The CCV schematic (Figure 6 Right) illustrates the flow path of this recirculated gas along with the instrumentation used to characterize it. The schematic also shows how the engine breathers were sealed, and a pressure sensor was installed to monitor crankcase pressure. In this configuration, exhaust gas was sampled to determine the engine total CH4 emissions and to calculate the CH4 reduction achieved by the CCV system relative to both OCV configurations. Equations (9)–(11) were used for this analysis.
where,
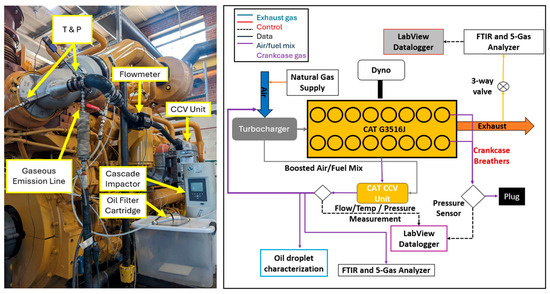
Figure 6.
(Left) CCV configuration. (Right) CCV configuration schematic.
= Exhaust CH4 flow rate (CCV configuration)
= Total CH4 slip (CCV configuration)
= CH4 reduction by CCV implementation
2.4. Uncertainty Analysis
Crankcase pressure, crankcase ventilation flow, BSFC, and the CCV CH4 reduction uncertainty was calculated to provide a more accurate assessment of the CCV system performance. Uncertainty analysis was performed using Equations (12)–(18) based on (Wheeler and Ganji 2009, 199) [13]. The total error of a variable was calculated by combining the instrumentation error and random error of that variable. The instrumentation error was calculated by searching the accuracy of every instrument used in the experiments and multiply by the instrument output scale or reading. Those errors were input it in the root of the sum of the squares (RSS) equation (Equation (13)) to account for the error propagation in the calculated variables. The random error was determined by selecting a specific engine operational load (100% load) at each speed for each configuration. The standard deviation of the measured variables was determined with a 95% confidence interval, and the standard deviation of the calculated variables was calculated by using Equation (16), which factors in the standard deviation of the measured variables. The final uncertainty of each variable was a combination of the instrumentation and random error, and it was calculated by Equation (18). This analysis revealed that the OCV-Direct method had a slightly higher uncertainty compared to the OCV-Indirect method due to the additional instrumentation used to characterize the CCG in the OCV-Direct method.
Uncertainty Equations (12)–(18)
Instrumentation Uncertainty
where,
_error = Measured or independent variable instrumentation error at Full Scale (FS)
= Change of the calculated or dependent variable relative to an independent variable.
= Dependent variable calculated instrumentation error.
Random Uncertainty
where,
= average value of measured or independent variable.
= number of data points.
= standard deviation of measured or independent variable.
= Change of the calculated or dependent variable relative to an independent variable.
= standard deviation for calculated dependent variable.
Student’s t statistic for 95% confidence interval.
= Random Uncertainty for dependent variable.
Total Uncertainty
where,
Total Uncertainty
3. Results and Discussion
3.1. Effects of Speed and Load on Crankcase Ventilation Flow, Crankcase Pressure, and BSFC for Both Engine Configuration
3.1.1. Crankcase Pressure
Crankcase pressure was measured with and without the CCV system (Figure 7 Left). During the OCV configuration, crankcase pressure increased with speed at constant torque, and with torque at constant speed. These results were consistent with past literature. According to P. Sutar et al., as engine load increases, combustion pressure rises, which forces the piston downward with greater force, thereby increasing crankcase pressure. Additionally, as engine speed increases, piston movement generates higher gas velocities within the crankcase, further raising the crankcase pressure [14]. For the OCV configuration, crankcase pressure varied between 2.41 kPa (9.68 in of H2O) and 0.41 kPa (1.65 in of H2O) across all tested loads and speeds. The implementation of the CCV system not only created a vacuum in the crankcase but also reduced pressure variation across all the tested loads and speeds, leading to more stable operation. The CCV system exerted a vacuum on the crankcase, maintaining pressure just below atmospheric levels for all conditions and loads tested. The crankcase pressure ranged from −0.402 kPa (−1.62 in of H2O) to −0.324 kPa (−1.30 in of H2O). The vacuum in the crankcase during the CCV configuration was primarily due to the CCV unit venturi component, which generated most of the vacuum. This helped draw gases through the filtration devices and avoided positive crankcase pressure. Moreover, the connection between the CCV unit outlet and the upstream compressor elbow contributed to the vacuum. This crankcase operation was supported by previous literature on crankcase pressure in the presence of the CCV system [14,15,16]. According to Racor’s technical information on CCV systems, crankcase pressure with the CCV system can range from −4 in of H2O to +4 in of H2O, with the crankcase operating under a vacuum during engine load and a pressure relief valve opening at +4 in of H2O to prevent over-pressurization [8]. Furthermore, the CCV system proved highly effective in regulating crankcase pressure variability. While the crankcase pressure showed a variability of 54% during OCV operation, it only varied by 7.1% during CCV operation across all conditions. This indicated the effectiveness of the back-pressure regulator within the CCV unit. At constant speed, as engine load increased, venturi flow rose, increasing the vacuum in the crankcase. However, the crankcase pressure varied only slightly. This reduction in pressure variability across different operating conditions indicated that the back-pressure regulator adjusted to protect the crankcase from excess vacuum, which could otherwise pull oil into the intake or allow unfiltered dust from the environment [7].
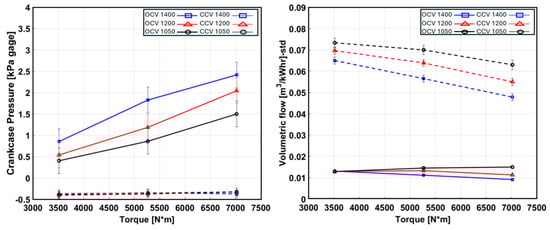
Figure 7.
(Left) crankcase pressure at all tested loads and speeds for OCV and CCV configurations. (Right) standard volumetric flow for the CCG and CCG + Venturi flow. Full lines represent the OCV configuration and dashed lines represent CCV configuration. Uncertainty bars were incorporated for accuracy.
3.1.2. Crankcase Ventilation Flow
Crankcase ventilation flow was measured and compared across multiple speeds and loads for both the OCV and CCV configurations (Figure 7 Right). In the OCV configuration, crankcase ventilation flow consisted solely of the CCG, which ranged from 0.19% to 0.33% relative to the intake mixture mass flow. When the venturi flow was added in the CCV configuration, crankcase ventilation flow increased to between 1.01% and 1.54% relative to the intake mixture mass flow. By adding the venturi flow, the crankcase ventilation flow increased by 319% to 467%. Normalized crankcase ventilation volumetric flow decreased as engine speed increased for both configurations. According to Sutar et al., the CCG flow is inversely proportional to engine speed due to reduced time for combustion chamber gases to escape past the piston rings and generate CCG [14]. This trend was evident for both configurations when the flow was normalized by power (Figure 7 Right). The CCG flow for the lab engine, a rebuilt engine with zero hours of operation, ranged from 0.0092 m3/bkW-h to 0.015 m3/bkW-h. These results were consistent with previous literature. The Caterpillar Application & Installation Guide for Crankcase Ventilation Systems states that for new engines, the CCG volumetric flow is approximately 0.02 m3/bkW-h, while for a worn engine, it is approximately 0.04 m3/bkW-h [17]. Wear is one of the most significant factors affecting CCG production, as it increases the volume available for gases to escape past the piston rings [17]. Excessive wear can significantly increase power losses, engine CCG, oil consumption, and pollutant emissions [18,19]. However, engine wear is difficult to quantify, and it was outside the scope of this study.
Furthermore, for load variation at a constant speed, the CCG volumetric flow showed a slight decline as load increased for both configurations. This was due to the normalization by power. Once this normalization was removed, a clear trend emerged, indicating that volumetric flow increased with load. This relationship has been shown in various studies [8,14,18,20].
3.1.3. Brake Specific Fuel Consumption (BSFC)
Brake specific fuel consumption (BSFC) is defined as the amount of fuel consumed per unit of power produced. A lower bsfc indicates higher engine efficiency. For both configurations, bsfc increased as engine speed increased for the same engine load (Figure 8). This was attributed to the rise in friction mean effective pressure (FMEP) as engine speed increased [20]. At a constant speed, increasing the load led to a decrease in bsfc. According to Heywood, as load increases at constant speed, temperatures during the expansion and exhaust strokes rise, and the HC in-cylinder oxidation rate increases, as long as oxygen is available. As a result, the engine-out HC concentration decreases with increasing load, indicating improved combustion efficiency and a higher indicated mean effective pressure (IMEP) compared to lower engine loads [20]. Additionally, as the engine is throttled, pumping losses increase, which leads to a decrease in IMEP and increase in pumping work, reducing mechanical efficiency and increasing bsfc [21].
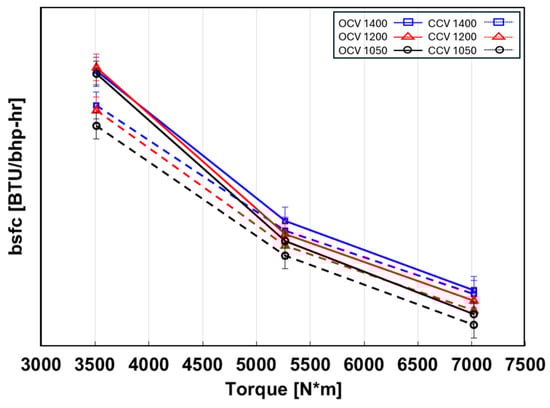
Figure 8.
bsfc at all tested loads and speeds for OCV and CCV configurations. The solid lines represent the OCV configuration, and the dash lines represent the CCV configuration.
The implementation of the CCV system resulted in a reduction in bsfc for the same speed and load relative to the OCV system. The greatest reductions of around 2.4–3.6% were observed at lower loads, suggesting a reduction of pumping losses and fuel savings with the CCV system. The CCV system created a slight vacuum in the crankcase as shown in Figure 7 Left. Previous literature has shown that this operation reduces pumping losses [18]. The useful work generated by the gases on the piston is a result of the pressure difference between the combustion chamber and crankcase pressure, multiplied by the swept volume. Therefore, by reducing crankcase pressure and maintaining it slightly under atmospheric pressure caused the indicated or useful work to increase. Additionally, as the CCV system maintains a slight vacuum in the crankcase, a lower gas density in the crankcase would reduce the aerodynamic drag of the crankshaft, connecting rods and other mechanical components in the engine crankcase. Therefore, by reducing the crankcase pressure the pumping work as well as parasitic losses decreases and higher BMEP and engine efficiency are achieved. Another cause of the reduction in BSFC was fuel savings, as fuel/energy that was previously vented during the OCV configuration was now provided a second opportunity to be used.
3.2. Gas Emissions
3.2.1. Gas Composition
The CAT G3516J engine operated lean, with a lambda range of 1.43 to 1.55. The impact of implementing the CCV system on air-fuel (A/F) ratio control was also monitored. It was found that the coefficient of variance (COV) for lambda was 24% lower under the CCV configuration, indicating a steadier operation. Figure 9 illustrates the crankcase ventilation gas composition for both the OCV and CCV configurations at 1400 RPM. There are six composition bars per molecule, divided into three sets of two bars, where each set represents an engine load. In the OCV configuration, the crankcase ventilation gas composition consisted of CCG composition, while in the CCV configuration, it included both CCG and venturi flow composition. Due to the addition of venturi flow, the oxygen (O2) concentration in the CCV configuration was 1% higher than in the OCV configuration. Other constituents, such as H2O, CO2, CO, and NOx, decreased concentrations in the CCV configuration because the venturi flow does not contain these molecules. Across both configurations, CH4 concentrations remained similar, ranging from 3.4% to 3.9%, as both the venturi flow and CCG contain CH4.
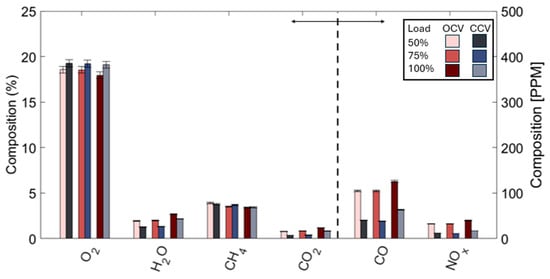
Figure 9.
Comparison of the CCG gas composition for the OCV configuration and the CCV configuration. There are 6 composition bars per molecule, and they are divided into three sets of two bars where each set of bars corresponds to a specific engine load. The bar on the left side of the set represented OCV configuration and the bar on the right side of the set represented CCV configuration. The dash line in the graph separates the molecules in PPM unit from the ones in percentage unit.
Figure 10 presents a comparison at 1400 RPM of the exhaust gas composition for the Indirect OCV configuration, which reflects the total engine emissions of the OCV configuration as the exhaust gas was combined with the CCG, and the exhaust gas of the CCV configuration, representing the total emissions for the CCV configuration. The CCV system clearly demonstrated a reduction in CH4, decreasing from 925–817 PPM in the OCV configuration to 765–720 PPM in the CCV configuration. This indicates that CCG CH4 was recirculated and effectively reduced. The H2O content in the exhaust gas showed a slight reduction in the CCV configuration, while other exhaust gas molecules, such as NOx, CO2, and CO, exhibited negligible differences between the configurations.
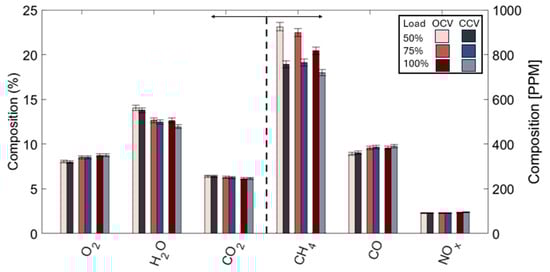
Figure 10.
Comparison of the exhaust gas composition for the OCV configuration and the CCV configuration. There are 6 composition bars per molecule, and they are divided into three sets of two bars where each set of bars corresponds to a specific engine load. The bar on the left side of the set represented OCV configuration and the bar on the right side of the set represented CCV configuration. The dash line in the graph separates the molecules in PPM unit from the ones in percentage unit.
3.2.2. CH4 Emissions
The CH4 slip and CCV CH4 reduction were calculated for the three configurations—Indirect OCV, OCV-Direct, and CCV—at three different loads and speeds. Figure 11 illustrates the CH4 slip and CCV CH4 reduction at 1400 RPM for three different engine loads. Each set of bars corresponds to a different engine load, with each bar within the set representing a different configuration (Figure 11 Left). The leftmost bar corresponds to the Indirect OCV CH4 slip measurement, the middle bar represents the OCV-Direct CH4 slip measurement, and the rightmost bar shows the CH4 emissions for the CCV configuration. The distinct top section of the middle bar, or OCV-Direct bar, indicates the CH4 slip contributed by the CCG. All three-load set show a declining trend in CH4 slip once the CCV system was integrated into the engine system. The OCV-Direct bar provides insight into the CH4 contribution specifically from the CCG, which ranged from 8.24% to 11.2%. The Indirect OCV configuration showed a slightly higher CH4 slip than the OCV-Direct configuration. Figure 11 Right shows the CCV CH4 reduction. The three sets of bars represent the three engine loads studied, and the two bars per set illustrate the CH4 reduction comparison between the OCV configurations and the CCV configuration. With the CCV system, CH4 was reduced by 12.6% to 18.0% relative to the Indirect OCV configuration and by 10.1% to 13.2% compared to the Direct OCV configuration. The results showed a significant reduction in CH4 output by the engine not only improving engine efficiency and possible money savings but also engine emission footprint.

Figure 11.
(Left) CH4 slip. There are three sets of three bars. Each set corresponds to a specific engine load at 1400 RPM. Each bar of a specific set represents a different crankcase ventilation configuration. The bar on the left side of the set represents the OCV-Indirect total CH4 slip, the bar on the middle represents the OCV Direct total CH4 slip, and the bar on the right represents the CCV configuration total CH4 slip. (Right) CCV Methane Reduction. Three sets of two bars, where each set represents different engine loads and each bar of a set represents the CCV CH4 reduction.
Table 2 summarizes the CCV CH4 reduction comparison with both OCV configurations for all loads and speeds tested, along with their respective uncertainty. In general, the results showed a greater CH4 reduction at lower loads. As mentioned previously, lower combustion efficiency at lower loads results in higher unburned hydrocarbon concentration in the combustion chamber and leakage towards the crankcase [20]. This phenomenon is supported by Figure 9, which shows higher CH4 concentrations in the CCG at lower loads. The CCV CH4 reduction for the same load at different speeds showed higher CCV CH4 reduction at lower speeds. This result was correlated with the higher CCG CH4 contribution at lower speeds. The CCV unit helped reduce the total CH4 emission variation across multiple loads and conditions.
Table 2.
CH4 reduction at different speeds and loads.
3.2.3. Compression Stroke and Expansion Stroke Contribution
Building on the premise that the CCG is formed from gas leakage during the compression and power strokes, an analysis was performed to determine how much mass and CH4 were leaked during these strokes (Equations (19) and (20)). The data collected for the OCV Direct Configuration was used for this analysis. The mass contribution from the compression and power strokes was determined by performing a mass balance. Additionally, the CH4 contribution was derived from the mass balance, considering the premixed air-fuel mixture CH4 concentration, the exhaust CH4 concentration, and the CCG CH4 concentration during each stroke and for the CCG. Several assumptions were made to perform this analysis. The first assumption was that the CCG mass equals the gas mass leaked during both the compression and expansion strokes, with no prior accumulation of CCG in the crankcase during the cycle. The second assumption was that the CH4 concentration of the gas leaked during the compression stroke was the same as the CH4 concentration of the premixed air-fuel mixture, and that the CH4 concentration of the gas leaked during the expansion stroke was the same as the exhaust CH4 concentration. This simplified analysis did not account for the residual fraction of gas in the cylinder after each cycle.
Equations (19) and (20) for stroke contribution to CCG analysis
where,
= CCG mass flow rate
= gas leaked during compression stroke flow rate
= gas leaked during expansion stroke flow rate
= CCG CH4 flow rate
= Intake mixture CH4 mass fraction
= Exhaust CH4 mass fraction.
The results of this analysis showed that 98.3% to 98.6% of the CH4 in the CCG originated from the compression stroke (Figure 12). However, 65% to 69% of the CCG mass came from the expansion stroke. This suggests that most of the mass was leaked at the beginning of the expansion stroke, when the combustion chamber pressure was higher than at any other point in the cycle. A computational fluid dynamics (CFD) model of the piston ring pack region could be a valuable follow-up to this work, providing more precise determination of the crank angle at which most of the leakage occurs and assessing the hydrocarbon contribution from each engine stroke to the CCG.
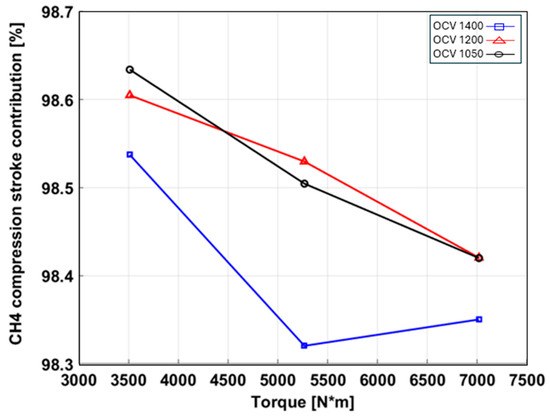
Figure 12.
Compression stroke CH4 contribution.
3.3. Oil Characterization
Venting CCG to the atmosphere increases both engine oil consumption and particulate matter (PM) emissions. According to Heywood, CCG contributes little to oil consumption at lighter loads; however, at higher loads, CCG is responsible for up to 20% of oil consumption [20]. Other laboratory and field tests have shown that, in extreme cases, venting CCG to the atmosphere can account for up to 50% of total engine oil consumption [14]. Several studies have indicated that crankcase emissions from automotive engines can contribute up to 120% of the total allowable PM emissions [22]. By implementing the CCV system, there is not only a reduction in CH4 emissions but also a decrease in oil consumption and PM emissions. However, effective oil filtration is essential for safely recirculating CCG without compromising engine performance. Removing oil from the CCG reduces the risk of contaminant buildup in intake components and prevents fouling of engine components like the turbocharger, intercooler, and inlet valves. In the case of the turbocharger, oil residue can cause coking, which alters the compressor surfaces and changes compressor efficiency. Similarly, an oil layer coating the intercooler can reduce its cooling capacity, which in turn deteriorates engine volumetric efficiency and leads to power loss [8,23]. Deposits on inlet valves can also negatively impact performance, causing a reduction in engine power, an increase in fuel consumption, and higher pollutant emissions due to imperfect sealing of the valve [18].
3.3.1. Oil Concentration & Oil Carryover
Aerosol generation is influenced by oil properties such as viscosity and volatility, as well as process parameters like oil temperature, brake mean effective pressure (BMEP), engine speed, and engine design aspects [23]. As viscosity increases, aerosol formation tends to decrease; conversely, as peak pressure increases, aerosol concentration tends to double [23]. While this study did not examine the effects of viscosity, it did assess the impact of different engine loads. Figure 13 compares the entrained oil concentration measurements for both configurations at 1400 RPM and three different engine loads. The oil concentration in the CCV configuration was significantly lower than in the OCV configuration. Figure 13 shows higher aerosol concentration at higher loads for the OCV configuration, which aligns with previous studies. Figure 14 compares oil carryover in the OCV and CCV configurations. This metric is crucial because it indicates whether the CCV unit meets the performance requirements for integration into the engine system. Gokten et al. found that an oil carryover of 3.06 mg/kW·h does not lead to excessive contaminant buildup or significant performance loss in the turbocharger for an Ecotorq 9 L turbodiesel engine with 60,000 km validation test [24]. However, the OEM oil carryover limit for this system is slightly less than half of 3.06 mg/kW·h. It is important to note that the CCV unit coalescing filter was used for under 100 h. According to Caterpillar literature for G3500 engines, the CCV unit coalescing filter should be replaced every 2000 h, coinciding with the oil filter change interval [25,26].
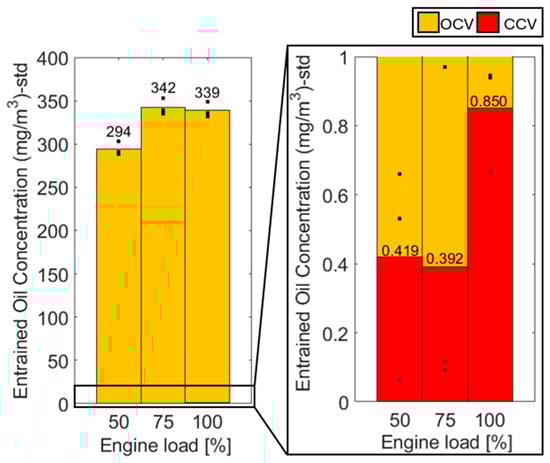
Figure 13.
CCG oil concentration-OCV configuration (Left). CCG oil concentration-CCV configuration (Right).
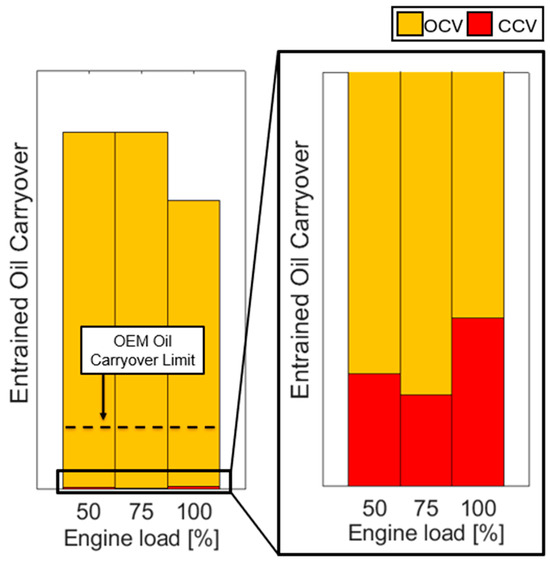
Figure 14.
Oil carryover comparison between the baseline configuration (OCV) and the CCV configuration.
The filtration efficiency of the CCV unit was calculated using Equation (21), which determines the percentage change in oil concentration between the two configurations. Table 3 summarizes the filtration efficiency at all tested speeds and loads. The CCV unit demonstrated high filtration efficiency, with values ranging from 99.23% to 99.91%.
Table 3.
Oil Filtration Efficiency at multiple speeds and loads.
3.3.2. Oil Distribution
Oil particle size concentration distribution measurements were taken at 1400 RPM and 100% load for both configurations (Figure 15). In the OCV configuration, the CCG particle distribution ranged from 0.1 µm to 10+ µm. These results were consistent with previous literature [8,22,27]. Figure 15 shows a higher particle concentration in sizes smaller than 3.2 µm. A study by Krause et al. found that most oil particles in the CCG were smaller than 3.5 µm, which aligns with the current findings [28]. The oil particle size concentration distribution for the CCV configuration showed a significant reduction in concentration across all particle sizes. Bins with concentrations under 0.09 mg/m3 were considered negligible, as the measurement noise begins to affect results at these concentration levels. The filtration efficiencies for various particle size intervals were as follows: 94.01% for particles between 10 µm and 5.60 µm, 97.81% for 5.60 µm to 3.20 µm particles, 99.70% for 3.20 µm to 1.8 µm, 99.78% for 1.80 µm to 1 µm particles, 99.89% for 1 µm to 0.560 µm, 99.86% for 0.560 µm to 0.320 µm, 99.85% for 0.320 µm to 0.180 µm, 99.35% for 0.180 µm to 0.100 µm, 96.31% for 0.100 µm to 0.056 µm, and 88.77% for 0.032 µm to 0.018 µm. Particle size intervals such as 0.018 µm to 0.010 µm and 0.010 µm to 0 µm were not considered due to negligible concentrations. Oil particle size distribution is critical for evaluating the performance of oil mist separators, understanding the predominant oil particle sizes, and designing effective filtration systems. This data also aids in ensuring that oil carryover remains within acceptable limits, thus reducing maintenance costs and extending engine life.
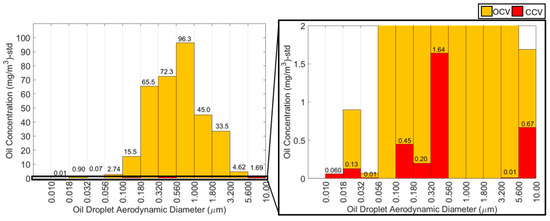
Figure 15.
Oil particle size distribution by concentration.
4. Conclusions
The integration of the Closed Crankcase Ventilation (CCV) system into engine operations resulted in significant improvements in engine performance, emissions control, and oil management. The study demonstrated that the CCV system effectively reduces pumping work and parasitic losses which leads to an increase in engine efficiency. Additionally, the CCV system reduced total engine CH4 emissions, with reductions ranging from 12% to 18% compared to the Indirect Open Crankcase Ventilation (OCV) configuration, and 10% to 13% compared to the OCV-Direct configuration. This reduction in engine CH4 emission is indicative of improved thermal efficiency, which leads to lower unburned hydrocarbons.
Additionally, the CCV system contributed to a marked decrease in oil consumption and particulate matter (PM) emissions. The oil concentration in crankcase gases (CCG) was significantly lower in the CCV configuration, and the system exhibited excellent filtration efficiency, achieving values between 99.23% and 99.91%. The analysis of oil particle size distribution showed that the CCV system significantly reduced the concentration of different oil particles sizes, thus preventing potential engine component fouling and reducing maintenance costs.
Overall, the results affirm the effectiveness of the CCV system in mitigating CCG CH4 emissions while preserving engine functionality and reducing long-term operational costs. Future research related to CCV system durability and reliability would give further insights into the maintenance that the system needs to keep performing effectively.
Author Contributions
A.Q.C.: Conceptualization; methodology; validation; formal analysis; investigation; data curation; writing—original draft preparation; writing—review and editing; visualization. J.F.R.: Conceptualization; methodology; software; validation. B.W.: resources; supervision; project administration; funding acquisition. D.B.O.: Conceptualization; methodology; formal analysis; investigation; resources; review and editing supervision; project administration; funding acquisition. All authors have read and agreed to the published version of the manuscript.
Funding
This research was funded by the Department of Energy award DE-AR0001536.
Data Availability Statement
The original contributions presented in this study are included in the article. Further inquiries can be directed to the corresponding author(s).
Acknowledgments
Thanks to the project sponsor and partner, CSU professors and advisors, researchers, colleagues, family and friends.
Conflicts of Interest
The authors declare no conflicts of interest.
Abbreviations
The following abbreviations are used in this manuscript:
| BMEP | Brake Mean Effective Pressure |
| BSFC | Brake Specific Fuel Consumption |
| CCV | Closed Crankcase Ventilation |
| CCG | Crankcase Gas |
| CFD | Computational Fluid Dynamic |
| CH4 | Methane |
| CO2 | Carbon Dioxide |
| DOE | Department of Energy |
| EPA | Environmental Protection Agency |
| FMEP | Friction Mean Effective Pressure |
| FTIR | Fourier Transform Infrared |
| IMEP | Indicated Mean Effective Pressure |
| IRA | Inflation Reduction Act |
| NG | Natural Gas |
| OCV | Open Crankcase Ventilation |
| PM | Particulate Matter |
References
- IEA. World. IEA. Available online: https://www.iea.org/world/energy-mix (accessed on 23 January 2025).
- IEA. United States–Countries & Regions. IEA. Available online: https://www.iea.org/countries/united-states (accessed on 23 January 2025).
- EPA. Methane Emissions. EPA. Available online: https://www.epa.gov/ghgemissions/methane-emissions (accessed on 23 January 2025).
- EPA. Waste Emissions Charge Under Inflation Reduction Act. EPA. Available online: https://www.epa.gov/inflation-reduction-act/waste-emissions-charge (accessed on 23 January 2025).
- ARPA E. Reducing Emissions of Methane Every Day of the Year, 4 August 2021. ARPA-E. Available online: https://arpa-e.energy.gov/technologies/programs/remedy (accessed on 23 January 2025).
- Vaughn, T.; Luck, B.; Williams, L.; Marchese, A.; Zimmerle, D. Methane Exhaust Measurements at Gathering Compressor Stations in the United States. Environ. Sci. Technol. 2021, 55, 1190–1196. [Google Scholar] [CrossRef] [PubMed]
- Namazian, N.B.; Heywood, J.B. Flow in the Piston Cylinder Ring Crevices of a Spark Ignition Engine: Effect on Hydrocarbon Emissions, Efficiency and Power; SAE Tech. Paper 82008; SAE: Warrendale, PA, USA, 1982. [Google Scholar] [CrossRef]
- Parker Hannifin Corporation. Closed Crankcase Ventilation Filtration Systems Technical Information; Parker Hannifin Corporation: Cleveland, OH, USA, 2015; Available online: https://www.parker.com/content/dam/Parker-com/Literature/Racor/Racor-Engine-Air-Filtration_-_Closed-Crankcase-Ventilation-Filtration_-_7678.pdf (accessed on 23 January 2025).
- Hinds, W.C. Aerosol Technology, 2nd ed.; John Wiley & Sons: Los Angeles, CA, USA, 1999. [Google Scholar]
- J-TEC Associates, Inc. VF563 Series Blow by Flow Meter User Manual; J-TEC Associates, Inc.: Cedar Rapids, IA, USA, 2023; Available online: https://j-tecassociates.com/wp-content/uploads/2023/07/J-TEC_UserManual_VF563_2023-1.pdf (accessed on 23 January 2025).
- Muktibodh, A.S. Effect of Fuel Additives on Performance and Emissions from Industrial Diesel Engines. M.A. Thesis, Department of Mechanical Engineering, Colorado State University, Fort Collins, CO, USA, 2009. [Google Scholar]
- Olsen, D.B. Oxidation Catalyst Performance Considerations: Catalyst Temperature, Space Velocity, and Fouling. In Proceedings of the Gas Machinery Conference, Nashville, TN, USA, 3–6 October 2011. [Google Scholar]
- Wheeler, A.J.; Ganji, A.R. Introduction to Engineering Experimentation, 3rd ed.; Pearson: Upper Saddle River, NJ, USA, 2009. [Google Scholar]
- Sutar, P.S.; Bandyopadhyay, D.; Sonawane, S.B.; Rairikar, S.D.; Kavathekar, K.; Thipse, S.S.; Kale, S.; Kshirsagar, C. Effect of CCV and OCV System in Heavy Duty CNG Engine on the Particulate Emissions. SAE Int. J. Adv. Curr. Pract. Mobil. 2021, 4, 813–819. [Google Scholar] [CrossRef]
- Gargate, S. Estimation of Blow by in Diesel Engine: Case Study of a Heavy Duty Diesel Engine. Emerg. Eng. Res. Technol. 2014, 2, 165–170. [Google Scholar]
- Pagnozzi, R.M.; Pereira, D.C.; Spielmann, L.; Bastías, P. Methodology Applied on the Validation of Air/Oil Separation Systems Integrated to the Crankcase Ventilation Valve; SAE Technical Paper 2007 01 2757; SAE: Warrendale, PA, USA, 2007. [Google Scholar] [CrossRef]
- Caterpillar. Application & Installation Guide Crankcase Ventilation Systems; Caterpillar: Irving, TX, USA, 2015; Available online: https://s7d2.scene7.com/is/content/Caterpillar/CM20160713-53120-62603 (accessed on 23 January 2025).
- Fogliarino, M. Crankcase Pressure Control in an Internal Combustion Engine: GT Power Simulation. M.S. Thesis, University of Windsor, Windsor, ON, Canada, 2014. [Google Scholar]
- Obara, R.B. Quantification of Wear in Cylinder Bores Based on Wear Volume Profile Assessment. J. Tribol. 2018, 140, 051608. [Google Scholar] [CrossRef]
- Heywood, J. Internal Combustion Engine Fundamentals, 2nd ed.; McGraw Hill Education: New York, NY, USA, 2019. [Google Scholar]
- Ferguson, C.; Kirkpatrick, A. Internal Combustion Engines, 3rd ed.; John Wiley & Sons: Fort Collins, CO, USA.
- Golkarfard, V.; Subramaniam, R.; Broughton, J.; King, A.; Mullins, B. Comparative Performance of 12 Crankcase Oil Mist Separators; SAE International Technical Paper; SAE: Warrendale, PA, USA, 2019. [Google Scholar] [CrossRef]
- Nowak, N.; Scheiber, K.; Stieler, C.; Heller, M.T.; Pfeil, J.; Koch, T.; Kasper, G. On Blow by Aerosol Sources in a Single Cylinder Crankcase Environment. In Proceedings of the ASME 2021 Internal Combustion Engine Division Fall Technical Conference, 13–15 October 2021. [Google Scholar] [CrossRef]
- Gokten, M.; Kurnaz, G.; Ergen, O.R.; Copley, D. The Development of High Efficiency Crankcase Ventilation and Oil Mist Separator for a Heavy Duty Diesel Application; SAE International Technical Paper 2008 01 2687; SAE: Warrendale, PA, US, 2008; 2008 01 2687; Available online: https://www.sae.org/publications/technical-papers/content/2008-01-2687/ (accessed on 23 January 2025).
- Gas Compression Engines G3516J. Caterpillar. Available online: https://www.cat.com/en_US/products/new/power-systems/oil-and-gas/gas-compression-engines/1000029388.html (accessed on 23 January 2025).
- Gas Compression Engines. Caterpillar. Available online: https://www.cat.com/en_US/products/new/power-systems/oil-and-gas/gas-compression-engines.html (accessed on 23 January 2025).
- Hilliard Corporation. Hilco Oil Mist Eliminators. Available online: https://www.hilliardcorp.com/cmsb/uploads/ome-1-oil-mist-eliminators.pdf (accessed on 15 January 2025).
- Krause, W.; Spies, K.H.; Bell, L.E.; Ebert, F. Oil Separation in Crankcase Ventilation–New Concepts through System Analysis and Measurements. J. Engines 1995, 104, 950939. [Google Scholar] [CrossRef]
Disclaimer/Publisher’s Note: The statements, opinions and data contained in all publications are solely those of the individual author(s) and contributor(s) and not of MDPI and/or the editor(s). MDPI and/or the editor(s) disclaim responsibility for any injury to people or property resulting from any ideas, methods, instructions or products referred to in the content. |
© 2025 by the authors. Licensee MDPI, Basel, Switzerland. This article is an open access article distributed under the terms and conditions of the Creative Commons Attribution (CC BY) license (https://creativecommons.org/licenses/by/4.0/).