Article

Green Hydrogen Production from Biogas or Landfill Gas by Steam Reforming or Dry Reforming: Specific Production and Energy Requirements

1
Engineering Department, Niccolò Cusano University, Via Don Carlo Gnocchi 3, 00166 Rome, Italy
2
Civil and Environmental Engineering Department, University of Florence, Via Santa Marta 3, 50139 Firenze, Italy
*
Author to whom correspondence should be addressed.
Energies 2025, 18(10), 2631; https://doi.org/10.3390/en18102631
Submission received: 18 March 2025 / Revised: 5 May 2025 / Accepted: 14 May 2025 / Published: 20 May 2025
(This article belongs to the Special Issue Biomass, Biofuels and Waste: 3rd Edition)

Abstract

:
Biogas is a crucial renewable energy source for green hydrogen (H2) production, reducing greenhouse gas emissions and serving as a carbon-free energy carrier with higher specific energy than traditional fuels. Currently, methane reforming dominates H2 production to meet growing global demand, with biogas/landfill gas (LFG) reform offering a promising alternative. This study provides a comprehensive simulation-based evaluation of Steam Methane Reforming (SMR) and Dry Methane Reforming (DMR) of biogas/LFG, using Aspen Plus. Simulations were conducted under varying operating conditions, including steam-to-carbon (S/C) for SMR and steam-to-carbon monoxide (S/CO) ratios for DMR, reforming temperatures, pressures, and LFG compositions, to optimize H2 yield and process efficiency. The comparative study showed that SMR attains higher specific H2 yields (0.14–0.19 kgH2/Nm3), with specific energy consumption between 0.048 and 0.075 MWh/kg of H2, especially at increased S/C ratios. DMR produces less H2 than SMR (0.104–0.136 kg H2/Nm3) and requires higher energy inputs (0.072–0.079 MWh/kg H2), making it less efficient. Both processes require an additional 1.4–2.1 Nm3 of biogas/LFG per Nm3 of feed for energy. These findings provide key insights for improving biogas-based H2 production for sustainable energy, with future work focusing on techno–economic and environmental assessments to evaluate its feasibility, scalability, and industrial application.

1. Introduction

Motivated by environmental concerns and the crucial need for change, renewable energy sources are expected to replace conventional fuels. Meanwhile, the European Union (EU) has set an ambitious goal of achieving carbon neutrality by 2050 [1]. To promote renewable energy and reduce greenhouse gas emissions, numerous initiatives have been launched, including “Horizon Europe”, the “Net-Zero Target”, the “Paris Agreement”, and the “Tokyo Protocols”. The goal of these programs is to drive the transition toward renewable, clean, and affordable energy sources, ultimately supporting the goal of carbon neutrality [2].
Although prevention is the most preferred strategy among those ranked by the waste hierarchy, more that 59 million tons of food waste are generated annually in European countries, of which 54% come from household [3], and, globally, more than 2 billion tons of municipal solid waste (MSW) are generated annually, of which 44% is food and green [4]. In Europe, about 19% of MSW is sent for recycling through composting and anaerobic digestion (AD), while 24% of MSW is still landfilled [5].
Worldwide, the majority of waste is still discarded or placed in landfills: about 36.6% in some form of landfill (of which only 7.7% is disposed of in sanitary landfills equipped with gas collection systems), with approximately 33% of waste ending up in open dumps. In landfills, the biodegradable fraction of waste undergoes anaerobic degradation, producing landfill gas (LFG), which is composed of carbon dioxide (CO2) and methane (CH4), contributing to the global warming effect [6].
Indeed, the European Landfill Directive (1999/31/EC) [7] obliged Member States to reduce the amount of biodegradable municipal waste that they landfill to 35% of 1995 levels; moreover, from 31 December 2023, all EU Member States are required to offer the service of separately collecting biowaste (food and garden waste) (Directive 2008/98/EC [8] as amended by Directive 2018/851 [9]. Thus, an increasing demand for the treatment of separately collected biowaste is expected, including AD for producing biogas, being an already well-established technology [10], whereas a decrease in LFG production is expected in the future decades in Europe. Nevertheless, waste landfilled to date in European countries and landfills continuing their operations throughout the world will keep on generating landfill gas for decades [11].
Both biogas, obtained from the industrial AD of biodegradable waste, and LFG, if properly collected at the landfill site, represent effective and sustainable options for renewable energy production [12], and can help in reducing the dependency on fossil fuels [13] and the contribution to climate crisis [14,15,16].
The typical composition of biogas and LFG, in comparison to natural gas, can be found in [17], showing that they may contain, in addition to CH4 and CO2, smaller quantities of other gases, such as hydrogen (H2), ammonia (NH3), hydrogen sulfide (H2S), nitrogen (N2), oxygen (O2), and water vapor (H2O). The composition of biogas varies from site to site, depending on the type of feedstock and also the type of anaerobic digesters used. The content of CH4 in biogas and LFG is similar, with the former showing a generally higher concentration. However, LFG composition changes over the landfill’s lifetime, as the biodegradable waste is consumed and the LFG flow rate and CH4 content decrease over time [18]. Initially, LFG contains higher methane (CH4, 55–60% vol.) and lower carbon dioxide (CO2, 40–55% vol.) [19] concentrations. Over the years, as the landfill matures, CO2 levels gradually increase (up to 50–60% vol.), while CH4 decreases (to 30–40% vol.) due to the depletion of degradable organic material. The unwanted component of biogas/LFG is hydrogen sulfide (H2S). It is a corrosive gas that may damage accessories and equipment during the process of producing energy [20,21].
Currently, biogas and LFG are mainly exploited as renewable sources through direct use in cogeneration engines [22] or by upgrading to biomethane [23]. Other possibilities have been proposed, including using the biomethane obtained from biogas upgrading to produce chemical products, such as Fischer–Tropsch liquids and methanol [24]; using LFG for reforming and dimethyl ether production [25]; and power and methanol coproduction through LFG reforming [26]. However, biogas/LFG is also a promising source for hydrogen (H2) production [27,28], offering a renewable alternative to traditional large-scale methods, which typically rely on thermal reforming of light hydrocarbons like natural gas [29]. By utilizing biogas as a renewable methane source, reliance on natural gas can be alleviated, while also reducing greenhouse gas emissions [12].
Indeed, hydrogen production primarily depends on natural gas (48%), while other sources, such as heavy oil and naphtha (30%), coal (18%), electrolysis (4%), and biomass (1%), provide the remaining contributions. Hydrogen is essential for fuel cells, combustion engines, and industries, such as petrochemicals, fertilizers (ammonia production), food processing, hydrogenation, and chemical manufacturing. By 2025, global hydrogen production is expected to grow by 8–10%, nearly doubling its 2005 levels [30]. As the reforming of natural gas is the most used process for hydrogen production, biogas/LFG reforming for H2 production is an appealing and promising technique for its potential substitution, at least partially, converting the CH4 contained in the biogas into H2. The process is very interesting, especially due to the reduced emission of greenhouse gases and its reliability [31] and the potential for negative CO2 emissions, when carbon capture and storage (CCS) or carbon capture and utilization (CCU) are further applied [32,33].
Another advantage of using biogas as a feedstock for H2 production is its availability (mostly local), which reduces transportation costs. In some cases, hydrogen production processes have been proposed to be fed by biomethane, obtained in turn from the upgrading of biogas [34]. Therefore, the use of biogas/LFG to produce H2 could at least partly replace its conventional uses, with the expectation of better environmental and economic advantages. Four major techniques used for converting natural gas to H2 are steam reforming, dry reforming [35,36], partial oxidation [36,37,38] and autothermal reforming [36,37,38,39] that can, in principle, also be used for the production of hydrogen from biogas/LFG [40,41].
H2 is widely regarded as a promising energy path for the 21st century, thanks to its extraordinary characteristics, most notably its cleanliness and versatility [15,42]. These unique qualities position hydrogen as a key solution across various sectors, including industry, energy, transportation, and the broader economy. Reflecting its growing importance, the global hydrogen market is projected to reach 120 million tons by 2024 [26]. Hydrogen can be produced from biogas or landfill gas (LFG) using reforming methods, such as steam reforming, dry reforming, and autothermal reforming.
SMR of natural gas has been extensively developed at an industrial level due to its technological maturity, reliable operation, and economical efficiency. Operating at high temperatures (750–920 °C) and pressures (30 bar) with a Ni/Al2O3 catalyst, it provides a proven pathway for large-scale hydrogen production despite challenges, such as significant equipment investment, catalyst deactivation, and large carbon dioxide emissions [43]. SMR also offers advantages, such as the lowest operating temperature among reforming technologies, an oxygen-free environment, and an optimal hydrogen-to-carbon monoxide ratio for liquid fuel production. However, these benefits come with higher operational costs and significant air emissions [44]. Biogas/LFG SMR was investigated at laboratory scale [45], focusing on catalyst use reduction [46].
In contrast, partial oxidation of methane (POX), which operates at even higher temperatures (1100–1500 °C) and often requires high-purity oxygen, is hindered by technical maturity limitations, increased operational costs due to the oxygen plant requirement and having a low H2/CO ratio compared to other reforming processes [35]. While POX offers advantages, such as feedstock desulfurization and high reaction speeds [46], its scalability is limited. Autothermal reforming (ATR), which integrates the self-heating benefits of SMR and POX, offers advantages, such as lower process temperatures, compared to POX and tailoring syngas methane content by adjusting reformer outlet temperatures. However, ATR faces challenges of limited commercial experience and the need for oxygen plants, alongside issues such as catalyst deactivation.
DMR, on the other hand, presents a greener approach by consuming greenhouse gas CO2 instead of releasing it into the atmosphere, achieving nearly 100% CO2 conversion. However, DMR faces significant challenges, such as coke formation on catalysts and the additional heat requirement as the reaction occurs at 600 °C, limiting its industrial viability [47,48]. Recently, biogas DMR was mainly investigated in relation to the activity and deactivation of catalysts [49,50,51].
Advancing these technologies requires overcoming barriers, such as catalyst durability, reaction condition optimization, and process efficiency improvements, to meet the demands of industrial-scale hydrogen production.
Among the above possibilities, this study focuses on SMR, due to its maturity [2,52,53,54], and, given that biogas/LFG is naturally rich in CO2, on DMR, which offers the possibility to convert both of them into useful outputs [55]. Both are energy-intensive processes; thus, it is essential to critically analyze these methods of hydrogen production from biogas to optimize the process, with the aim of highlighting which operating conditions and comparison criteria (specific yields, energy request, CO2 release, etc.) are preferable.
For this purpose, the complete simulation of the two processes, paying particular attention to the heat recovery integration within the process scheme, was carried out. The simulations of the processes are performed using a commercial software commonly used for studying natural gas reforming [56] or biogas reforming. Camacho et al. [57] explored biogas ATR considering standard biogas composition (60% CH4, 40% CO2), emphasizing its flexibility for applications such as fuel cell feed and pure hydrogen production. Tamilselvan et al. [58] simulated the entire process, encompassing anaerobic digestion, biogas upgrading via water scrubbing, and SMR of the resulting high-purity biomethane. Abd et al. [2] simulated SMR for low-grade biogas 40% methane, obtained as the waste stream of pressure swing adsorption (PSA) used for biogas upgrading. Di Marcoberardino et al. [59] simulated and compared SMR and ATR for H2 production from LFG and biogas. Similar to the aim of the present study, Phan et al. [60] simulated SMR, tri-reforming (TMR) and DMR for a given composition of biogas (CH4 59.7% vol. and CO2 40.06% vol.).
Unlike previous works that mostly focused on a single process or fixed biogas composition, this research explores a wide range of operating conditions, including the variable steam-to-carbon (S/C) ratio for SMR and variable steam-to-carbon monoxide (S/CO) ratio for DMR, across a range of biogas/LFG compositions to optimize hydrogen yield and energy efficiency, providing some novel results. Additionally, the model integrates CO2 separation for pure hydrogen production, which opens the possibility for further CCS or CCU (out of the scope of the present work) and incorporates heat recovery strategies to reduce external energy requirements. By combining these elements in a unified framework, this study offers a unique and holistic analysis that is rarely found in the existing literature, thus contributing valuable insights toward the sustainable production of hydrogen from renewable waste-derived resources. To the best of the authors’ knowledge, such a comparison of SMR and DMR for different operating conditions and different biogas/LFG compositions is not available in the literature.
Most importantly, this comprehensive and comparative modeling approach gives valuable insights into industrial applications, offering a data-driven foundation for selecting the most efficient and sustainable reforming route based on specific feedstock characteristics and operational priorities. The findings can guide industrial stakeholders in optimizing hydrogen yield with lower energy consumption and emissions, thereby facilitating more cost-effective and environmentally responsible application of biogas/LFG reforming technologies.
The objectives of the study are, thus, the following:
  • To identify the optimal operating conditions for SMR and DMR processes using biogas/LFG with varying compositions;
  • To evaluate and compare the hydrogen yield and energy consumption of each process under different process parameters (e.g., S/C and S/CO ratios, temperature, pressure);
  • To simulate and analyze the complete reforming processes under equilibrium conditions to assess overall energy requirements;
  • To incorporate CO2 separation and heat recovery integration into the process models for a more realistic and sustainable performance evaluation;
  • To ensure application of results for both biogas/LFG by using representative compositions in the simulations.
For the sake of brevity, LFG will be referred to as the process feed; however, the results apply to biogas from biowaste AD as well, as it is represented by one of the considered compositions.

2. Materials and Methods

In the analysis conducted, different LFG compositions, as CH4 and CO2 volumetric fractions, are simulated to assess their impact on hydrogen generation. LFG typically contains H2S, within a range of 22 to 1211 ppmv and an average value of 436 ppmv; H2S adversely affects the reforming process and even a small amount of it can significantly impact the process by reducing CH4 and CO2 conversion [61,62]. In the simulation, which has the aim of comparing SMR and DMR, it is assumed that all the eventually present H2S has been previously removed by applying the suitable removal process, thus not affecting the comparison (H2S removal will be added in the future for further environmental and economic assessment of the complete processes) [58].

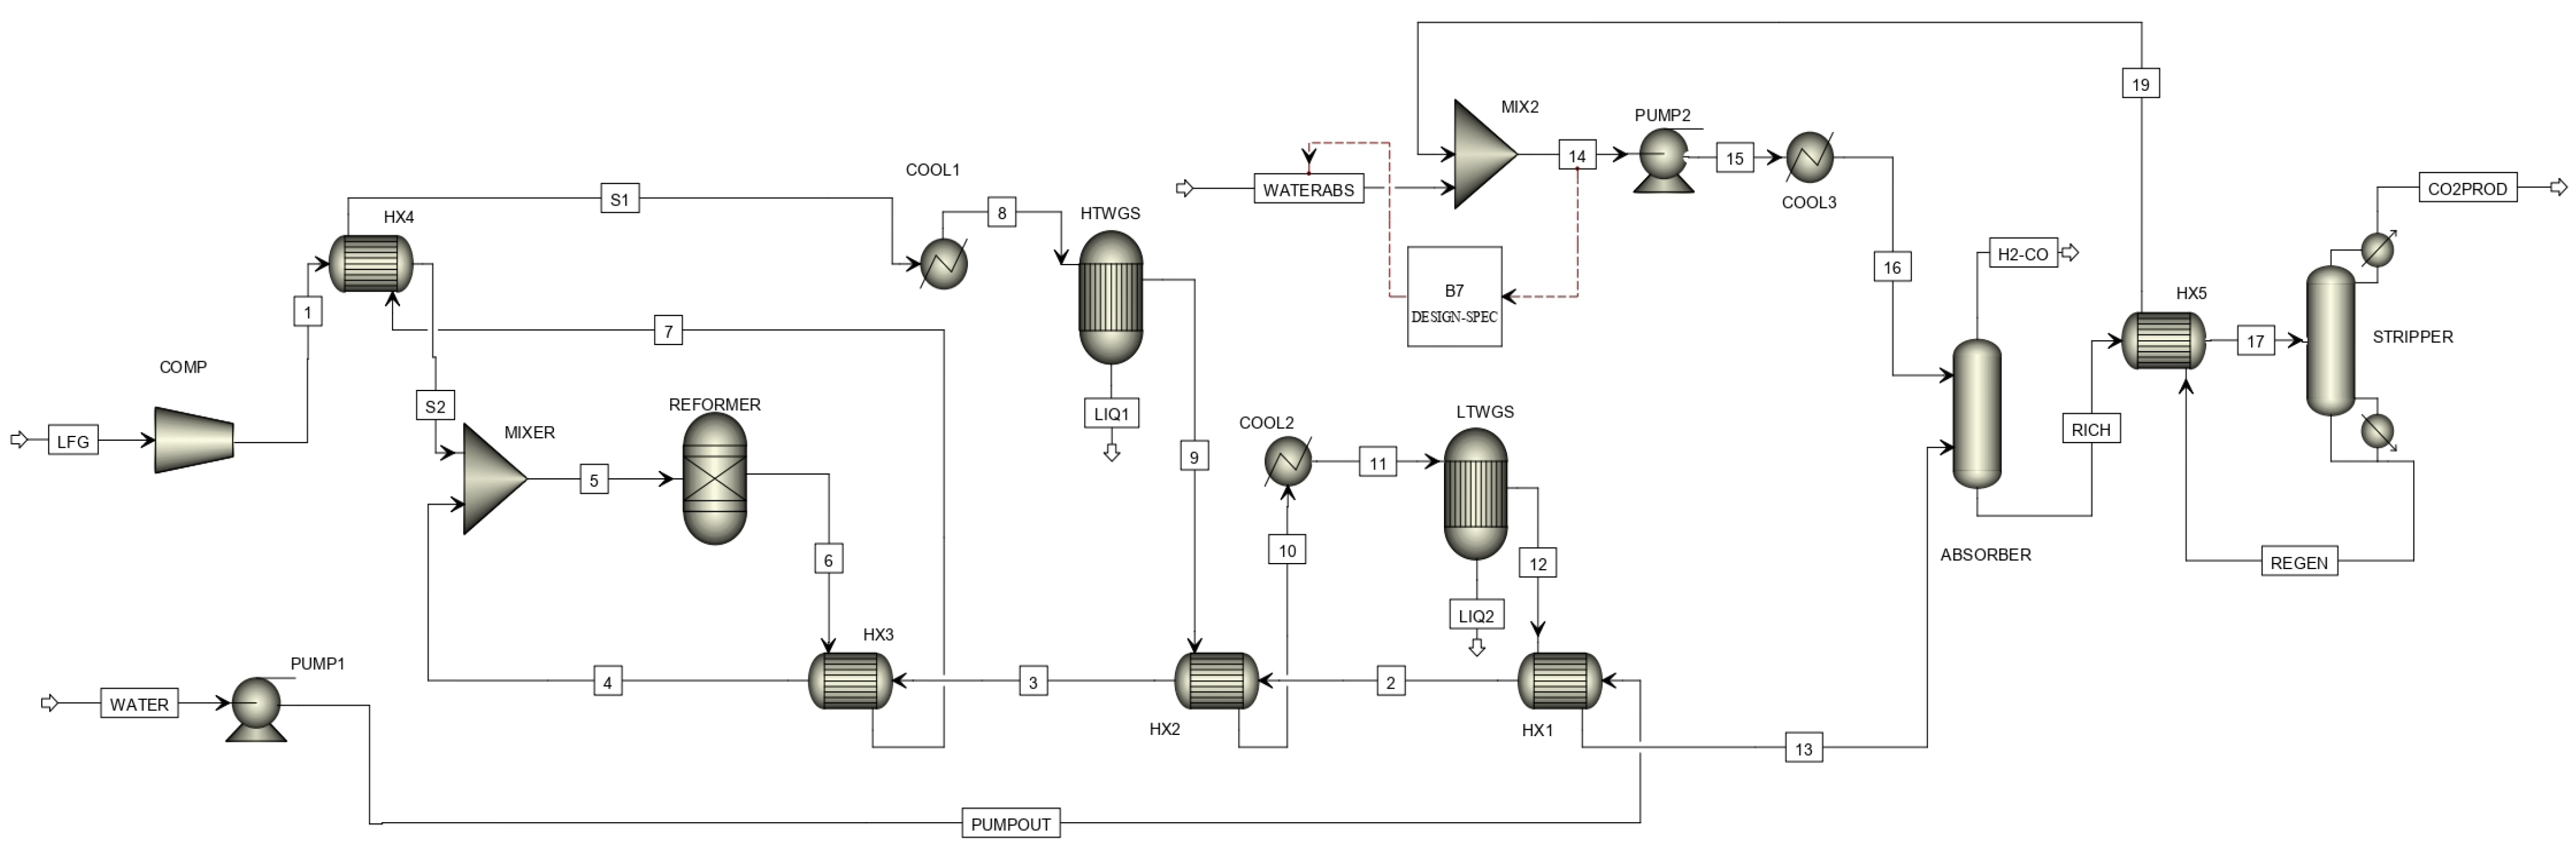
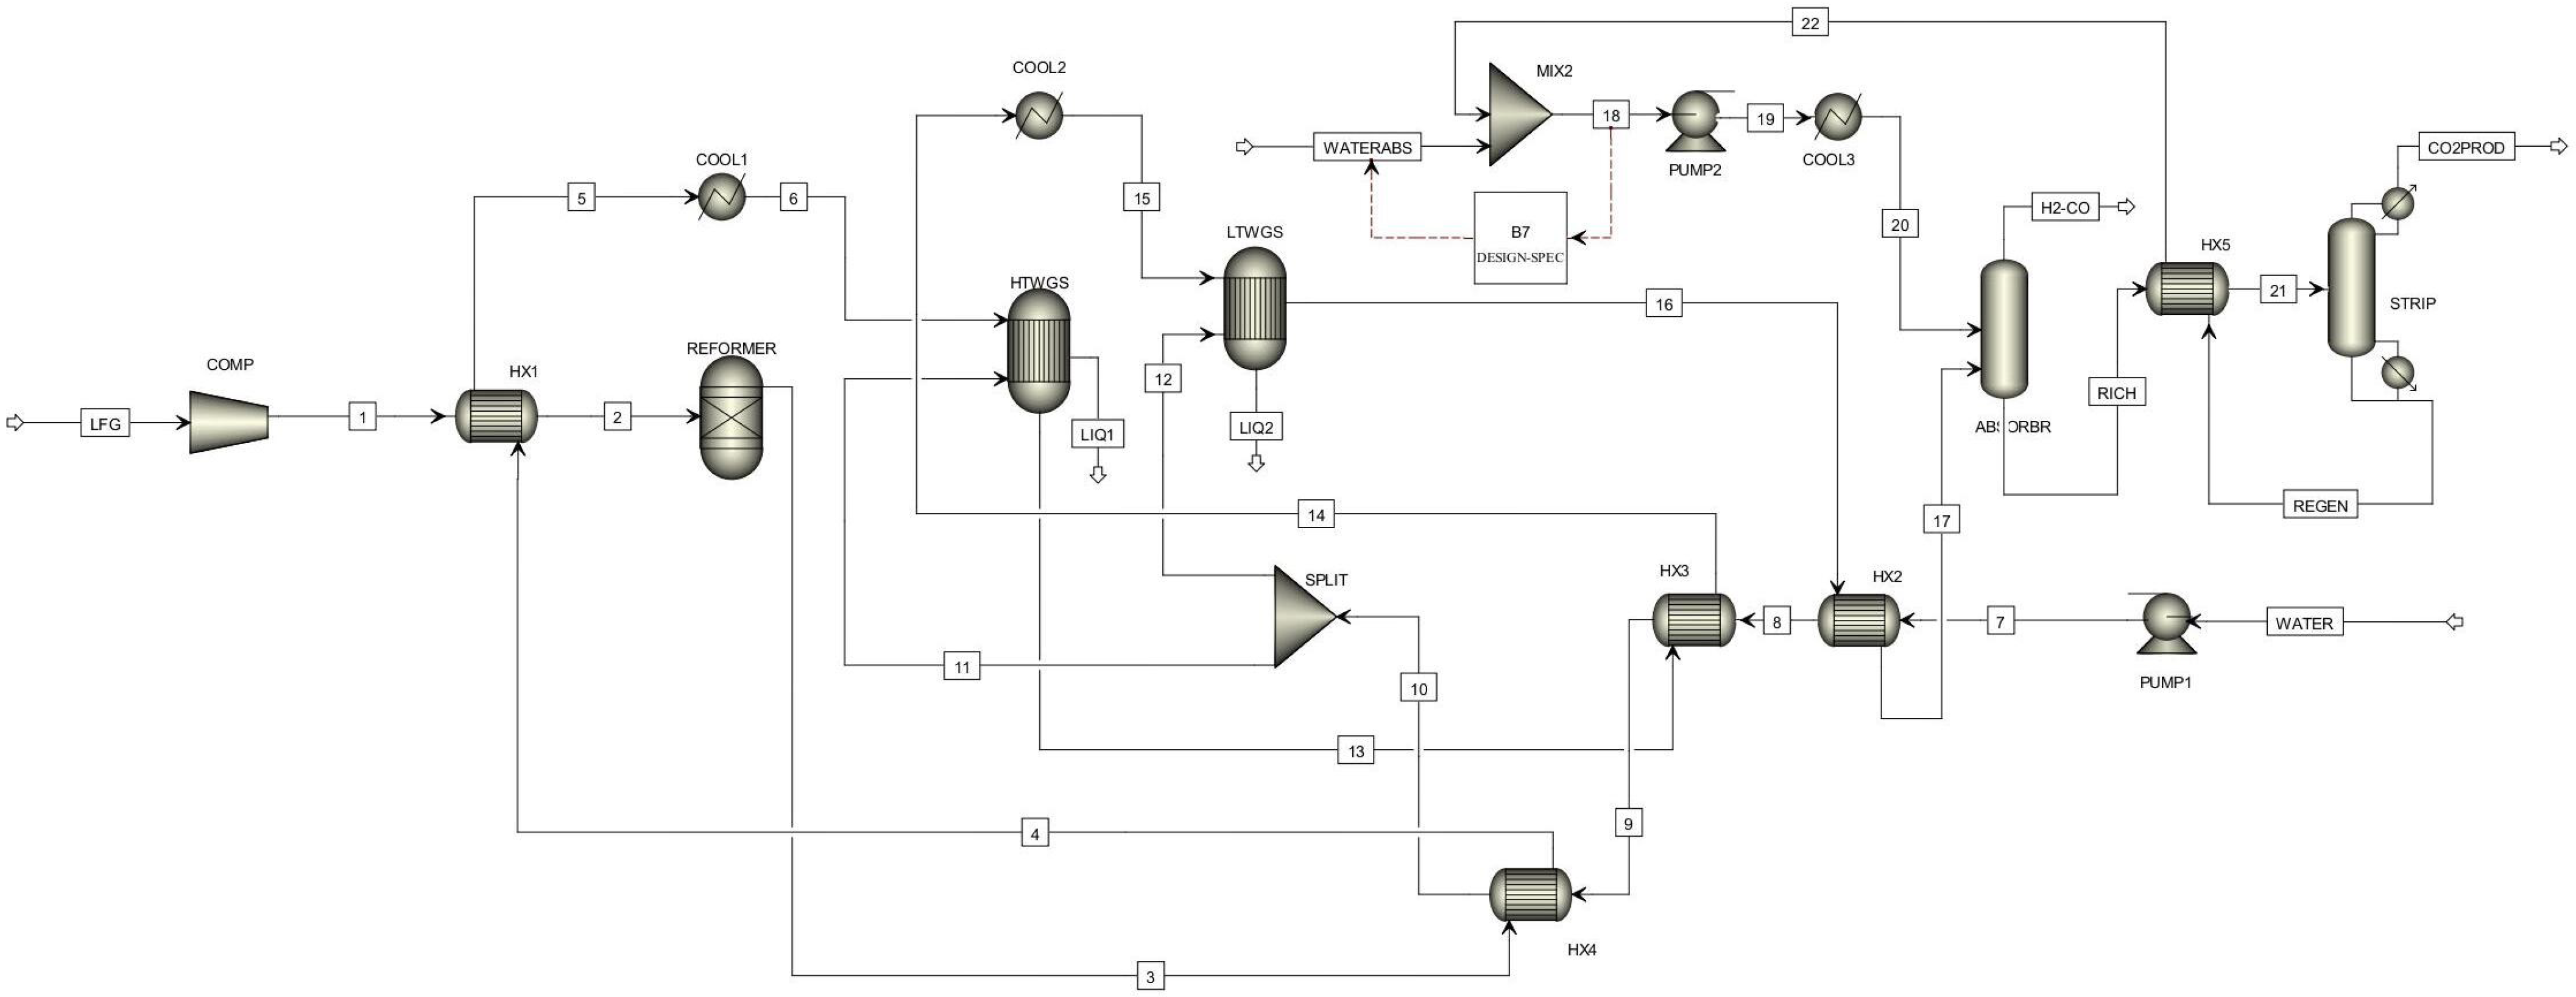
2.1. Simulation Model and Validation

The complete process of SMR and DMR of LFG is simulated by ASPEN Plus (version 12.2) [63]. The reforming reactors are simulated using the Gibbs free energy minimization approach, which facilitates the calculation of temperature, pressure, and composition at equilibrium under well-described thermodynamic conditions and includes typical, ideal unit operations. In this study, the component list is limited to CH4, H2O, CO, H2 and CO2. The Non-Random Two-Liquid (NRTL) property method is a thermodynamic model widely used for simulating phase equilibria, as it is particularly effective for non-ideal liquid mixtures commonly encountered in methane reforming processes involving multiple phases.
Before performing the complete simulation of the processes, a first validation step was carried out, considering a simple model consisting of the steam reforming [64,65] and dry reforming [62,66] reactor, reproducing the conditions used in experimental tests available in the literature and comparing the available results in terms of different indicators, such as hydrogen concentration, methane conversion, and the H2/CO molar ratio, especially at high temperatures.
H2 concentrations in the Aspen model closely followed the experimental values conducted by Cipitì et al. (2016) [64] across the examined temperature range. The percentage differences were 5.25% at 700 °C, 3.02% at 800 °C, and just 1.05% at 900 °C. These results show a high accuracy at higher temperatures, likely due to enhanced thermodynamic favorability of the reforming reaction at elevated temperatures. Methane conversion showed a similar trend. The Aspen model predicted conversion at 700 °C with 15.24% deviation, but the deviation dropped dramatically to 0.19% at 900 °C. The close agreement at 900 °C supports the accuracy of reaction kinetics and thermodynamic parameters used in the simulation. The higher deviation at lower temperatures could be attributed to the effect of the catalyst, heat transfer effects, or kinetic regime shifts not fully captured by the model.
The H2/CO molar ratio is a critical parameter for hydrogen production as well as for the separation unit downstream for pure hydrogen production. The simulation results showed good agreement with the experimental data, particularly at higher temperatures. Percentage differences were 13.11% at 700 °C and less than 2% at 900 °C. The decreasing percentage difference with temperature again suggests that the model performs more accurately under conditions where thermodynamic control dominates over kinetic limitations.
Cruz et al. (2018) [65], carried out an in-depth exergy analysis of a dry reforming-based hydrogen production system using biogas as the primary feedstock. Their simulation integrated DMR, WGS, PSA, and a combined-cycle power generation unit at 1 bar and 650 °C in the presence of a Ni/Al2O3 catalyst which suggest that aspen is a reliable tool also for energy and exergy analysis. The model demonstrated high predictive capability for all major outputs, especially at 900 °C, where percentage deviations were minimal. The trends of increasing hydrogen concentration and conversion with temperature were consistently reproduced in both simulation and experimental data. This indicates that the Aspen Plus model captures the behavior of the reforming process under the studied conditions.
The accuracy and reliability of the Aspen Plus model for simulating the DMR process were compared with experimental data reported by Rosha et al. (2021) in their study on catalytic reforming of synthetic biogas over a nickel-based catalyst [66]. The reforming process at 900 °C showed minor deviations between experimental and simulated results: 2.09% for CH4 conversion at 83.1% experimentally and 81.4% in the simulation, and 2.9% for CO2 conversion at 97% experimentally versus 99.95% in the model. Furthermore, the simulated hydrogen concentration in product gases was 44.3%, compared to 40.3% in the experimental data, showing a 9% increase in hydrogen production. The H2/CO molar ratio obtained from the simulation was 0.99, nearly identical to the experimental value of 1.04, with a difference of only 4.3%. Furthermore, experimental results reported by Chattanathan et al. (2016) at a similar temperature around 850 °C with a similar biogas concentration, showed a H2/CO molar ratio of 0.99, which also shows the close proximity to our simulated results in the high-temperature range [62].
These small deviations confirm strong agreement between the simulation and experimental results. Overall, these comparisons demonstrate the robustness and reliability of the Aspen Plus model in predicting DMR performance under high-temperature conditions in which thermodynamic properties dominate. A detailed comparison of simulation results and experimental results is reported in the Supplementary Materials, Tables S1 and S2.

2.2. Description of the Simulations

Figure 1 and Figure 2 represent the Aspen Plus flowsheet for the process modelling of the SMR and DMR processes, respectively, including CO2 removal.
In the SMR flowsheet (Figure 1), LFG is compressed and regeneratively pre-heated via a heat exchanger using recovered heat from the syngas arriving from the reformer. The LFG and the steam enter the reformer (modeled by a Rgibbs reactor) operating at fixed temperature, where the steam reforming process takes place, according to (Equation (1)), which is extremely endothermic and needs substantial heat, which is provided to the reactor from an external source, transforming CH4 and CO2 into a syngas mixture including H2, CO, and residual CO2 and H2O.
CH4 + H2O ⟶ CO + 3H2
The syngas passes through a heat exchanger (HX3), contributing to produce the steam required by the reformer, and then through the heat exchanger (HX4), regenertively pre-heating the LFG. The syngas is then processed in High Temperature Water Gas Shift (HTWGS) and Low Temperature Water Gas Shift (LTWGS) reactors at two distinct temperatures (350 °C and 250 °C) to further convert CO into H2, where (Equation (2)) takes place (without the addition of external steam, but using the residual amount left after the reformer).
CO + H2O⇌CO2 + H2
The equilibrium reactor is used for the two WGS reactors. After the HTWGS reactor and the LTWGS reactor, heat is recovered from the syngas, contributing to the production of the steam fed to the reformer. Then the syngas is sent to the CO2 removal section. The water scrubbing technique is used to remove CO2 in order to extract pure hydrogen after the reforming process. This technique uses water as an absorbent to selectively extract CO2 from the gas stream, using its solubility in water while permitting H2 to stay in the gaseous phase [67]. This purification step is essential for producing pure H2. The CO2 absorption column (modeled by a Radfrac reactor) is fed by the syngas and the high-presure water, recycled after the regeneration taking place in the stripper (Radfrac reactor as well), where pressure is reduced and heat is supplied for realizing the CO2 desorption. The target CO2 removal efficiency, on a mass basis, defined by Equation (3), is 95%.
C O 2   R e m o v a l   E f f i c i e n c y % = C O 2   i n l e t C O 2   o u t l e t C O 2   i n l e t 100
where:
CO2 inlet concentration is the initial mass flow of CO2 in the gas stream before the scrubbing process;
CO2 outlet is the mass flow of CO2 in the gas stream after it exits the scrubbing process.
The purified syngas, almost pure H2, exits from the absorber column, while the amost pure CO2 stream leaves from the stripper column. Three coolers are used to keep the syngas inlet temperature to the HTWGS, LTWGS and absorber to design values.
In the DMR flowsheet (Figure 2), LFG is compressed and pre-heated via a heat exchanger (HX1) using recovered heat from the syngas arriving from the reformer. The LFG enters the reformer (modeled by a Rgibbs reactor) operating at a fixed temperature, where the dry reforming process takes place (no steam is added in the dry reformer), according to (Equation (4)), which is extremely endothermic and requires that substantial heat is provided to the reactor form an external source.
CH4 + CO2 → 2CO + 2H2
The syngas passes through a heat exchanger (HX4), contributing to producing the steam required by the HTWGS and LTWGS reactors. Similar to the previous case, the syngas is then processed in the HTWGS and LTWGS, respectively, at temperatures of 350 °C and 250 °C, to further convert CO into H2, where (Equation (2)) takes place. The equliium reactor is used for the two WGS reactors. In this case, a given amount of steam is added in WGS reactors, according to a varying S/CO ratio. After the HTWGS reactor and the LTWGS reactor, heat is recovered from the syngas contributive to the production of the steam fed to the WGS reformers. Then the syngas is sent to the CO2 removal section, operating similarly to what previously described. Also in this case, three coolers are used to keep the syngas inlet temperature to the HTWGS, LTWGS and absorber to operate them at the desired temperature.
Preliminarily, simulations are carried out varying the reforming temperature and pressure, for the fixed LFG composition and keeping the steam and carbon ratio constant as a feed to the reformer (S/C), in the case of SMR; and the molar ratio between the steam fed to the WGS reactor and the entering carbon monoxide (S/CO) for DMR. Table 1 shows the conditions applied in the simulations to understand the effect of temperature and presure aimed at selecting the values for the second-step simulations.
For the temperature analysis, the composition of the feed gas was set to 60% CH4 and 40% CO2, with a constant pressure of 5 bar and an S/C ratio of 1. The temperature varied in the range of 500 °C to 1000 °C to evaluate its impact on key process parameters, such as methane conversion and product yield. For the pressure analysis, the same feed gas composition (60% CH4 and 40% CO2) was used, while the temperature was kept constant at 900 °C, and the S/C ratio was maintained at 1. The pressure varied from 0 bar to 50 bar to study its influence on the reforming process performance, particularly the methane coversion and the product yield. These simulations provide insights into the optimal operating conditions for temperature and pressure for the reforming process. Then, the second-step simulations are carried out, fixing temperature and pressure, and varying the S/C, S/CO, and LFG compositions.
SMR analysis is conducted, varying the S/C ratios of 1, 2, and 3 to assess their impact on process performance. For DMR, a different S/CO is considered at the WGS reactor. Table 1 reports the composition and different cases for which the analysis is conducted. For the simulations of the SMR and DMR processes, the LFG input flow rate of 1 m3/h is considered for all the different cases. The constant flow rate facilitates a uniform assessment of process performance across varying LFG compositions and S/C and S/CO ratios, and easily allows for results to be scaled up for different industrial-sized plants. Table 2 shows the specifications and operating conditions for different units used in the SMR and DMR simulations, with reference to the second-step simulations.

2.3. Calculated Parameters

To compare the results, a set of parameters is calculated: specific hydrogen production, CH4 conversion, CO2 conversion, specific heat duty, specific cooling duty, specific power consumption, and specific primary energy consumption, defined as follows. It is worth noting that the CO2 contained in the LFG is of biogenic origin; thus, it has net-zero impact on climate change [68]. Nevertheless, its specific emission is considered a parameter of interest in this study, for precautionary reasons, since advanced studies calculate the global warming potential also for biogenic CO2 [69], and for future quantification of possible storage (i.e., negative emissions).
Specific hydrogen production is calculated according to Equation (5):
S p e c i f i c   h y d r o g e n   p r o d u c t i o n   ( k g / m 3 ) = H y d r o g e n   p r o d u c t i o n   ( k g ) L F G   i n p u t   ( m 3 )
Specific CO2 production is calculated according to Equation (6):
S p e c i f i c   C O 2   p r o d u c t i o n   ( k g C O 2 / k g H 2 ) = H y d r o g e n   p r o d u c t i o n   ( k g ) L F G   i n p u t   ( m 3 )
CH4 conversion is calculated according to Equation (7):
C H 4   c o n v e r s i o n   e f f i c i e n c y % = m o l e s   o f   C H 4 i n i t i a l m o l e s   o f   C H 4 f i n a l m o l e s   o f   C H 4 i n i t i a l 100
CO2 conversion is calculated, before the final CO2 removal step, according to Equation (8):
C O 2   c o n v e r s i o n   e f f i c i e n c y % = m o l e s   o f   C O 2 i n i t i a l m o l e s   o f   C O 2 f i n a l m o l e s   o f   C O 2 i n i t i a l 100
Specific heat duty (SHD) is calculated according to Equation (9):
S H D M W h k g = Q 1 + Q 2   ( M W h ) p r o d u c e d   h y d r o g e n   ( k g )
where:
Q1 = Heat duty in reformer (MWh);
Q2 = Heat duty in the reboiler of the stripping column (MWh).
Specific cooling duty (SCD) is calculated according to Equation (10):
S C D   ( M W h / k g ) = C 1 + C 2 + C 3 + C 4   ( M W h ) p r o d u c e d   h y d r o g e n   ( k g ) / C O P
where:
C1 = Cooling duty of cooler cool1 (MWh);
C2 = Cooling duty of cooler cool2 (MWh);
C3 = Cooling duty of cooler cool3 (MWh);
C4 = Cooling duty of condenser in stripper (MWh);
COP = Coefficient of performance is assumed equal to 5.
Specific power consumption (SPC) is calculated according to Equation (11):
S P C   ( M W h / k g ) = E 1 + E 2 + E 3   ( M W h ) p r o d u c e d   h y d r o g e n   ( k g )
where:
E1 = Power for pump pump1 (MWh);
E2 = Power for pump pump2 (MWh);
E3 = Power for compressor comp (MWh).
Specific primary energy (SPE) consumption is calculated according to Equation (12):
S P E   ( M W h k g ) = S H D η   h e a t + S C D + S P C η   e l e c .
where:
ηheat = 0.98, is the typical efficiency for thermal energy production in industrial combustion devices.
ηelec. = 0.4, is the typical efficiency for electric energy production in thermal power plants.

3. Results and Discussion

Results for the performed simulations are reported in the following paragraphs, first showing the effect of varying the reforming temperature and pressure for fixed LFG composition and keeping the S/C and S/CO ratios constant for SMR and DMR, respectively (preliminary simulations), and then fixing temperature and pressure and varying the S/C and S/CO and LFG composition (second-step simulations).

3.1. Preliminary Simulations

3.1.1. Effect of Temperature

Figure S1 (Supplementary Materials) illustrates the impact of a temperature increase on the mole fraction of feed and product gases in the exit stream of the reformer, keeping the LFG composition at 60:40, S/C equal to 1 and pressure equal to 5 bar for SMR. As is well known, the temperature significantly influences methane conversion in reforming, with higher temperatures (800 to 1000 °C), resulting in enhanced methane conversion rates. The increase in temperature is obviously correlated with the increase of hydrogen and the decrease in CH4 and CO2 concentration in the reformer exit stream [70]. Increased temperatures are also essential for improving catalytic performance and inhibiting coke accumulation, which may impair the catalysts (Ni, Ni-MgO, Rh, Pt, NiZr, etc.). Commercial reaction conditions vary between 600 and 900 °C and 5 and 40 bar. A reactor exit temperature of 800–900 °C is essential to mitigate the detrimental impact of lower temperatures on equilibrium yields [71].
The RWGS reaction also occurs between 400 and 800 °C, producing less carbon deposition. However, at temperatures of 900 °C or above, carbon deposition is eliminated when the H2/CO ratio is close to unity. The maximum hydrogen production is observed between 850 and 900 °C; additionally, many studies in the literature and plants report similar condition for the commercial production of hydrogen. This indicates that the reforming process via SMR should be carried out at high temperatures to reduce carbon deposition on the catalyst while ensuring a high hydrogen yield. Similar considerations can be drawn for the DMR and the results are reported in Figure S2 in the Supplementary Materials. Therefore, we opted to run simulations for both SMR and DMR at 900 °C in the reforming reactor [63].

3.1.2. Preliminary Simulations—Effect of Pressure

Figure S3 (Supplementary Materials) illustrates the impact of pressure augmentation on the mole fraction of feed and product gases in the reformer exit stream, keeping LFG composition at (60:40), S/C equal to 1 and the temperature equal to 900 °C for SMR. As expected, the increase in pressure correlates with a notable decrease in H2 and CO concentrations in the reformer’s outflow stream. However, the effect of pressure is negligible at moderately low levels (below 5 bar), while for further increases in pressure, hydrogen production starts to rapidly decrease [72]. Increased pressure may help in the eventual downstream hydrogen purification process, as in our case, pressurized water scrubbing is used to remove CO2 to produce pure hydrogen.
Indeed, the limited solubility of CO2 in water necessitates an increase in operating pressure to maximize the absorption rate [67]. However, higher pressures also raise the risk of carbon deposition on catalysts, potentially diminishing their effectiveness over time [73]. Additionally, especially when feeding the reforming process with LFG, which, due to the CO2 content, has a larger volume than the natural gas, the higher pressure demands more energy for compression, which can reduce overall process efficiency. So, to make a balance between avoiding coke deposition and an increasing reaction rate and considering the water scrubbing process, a suitable pressure was chosen equal to 5 bar for the second-step simulations. Similar trends are reported for DMR in Figure S4 (Supplementary Materials), leading to the same conclusion of selecting 5 bar as reformer pressure.

3.2. Second-Step Simulations

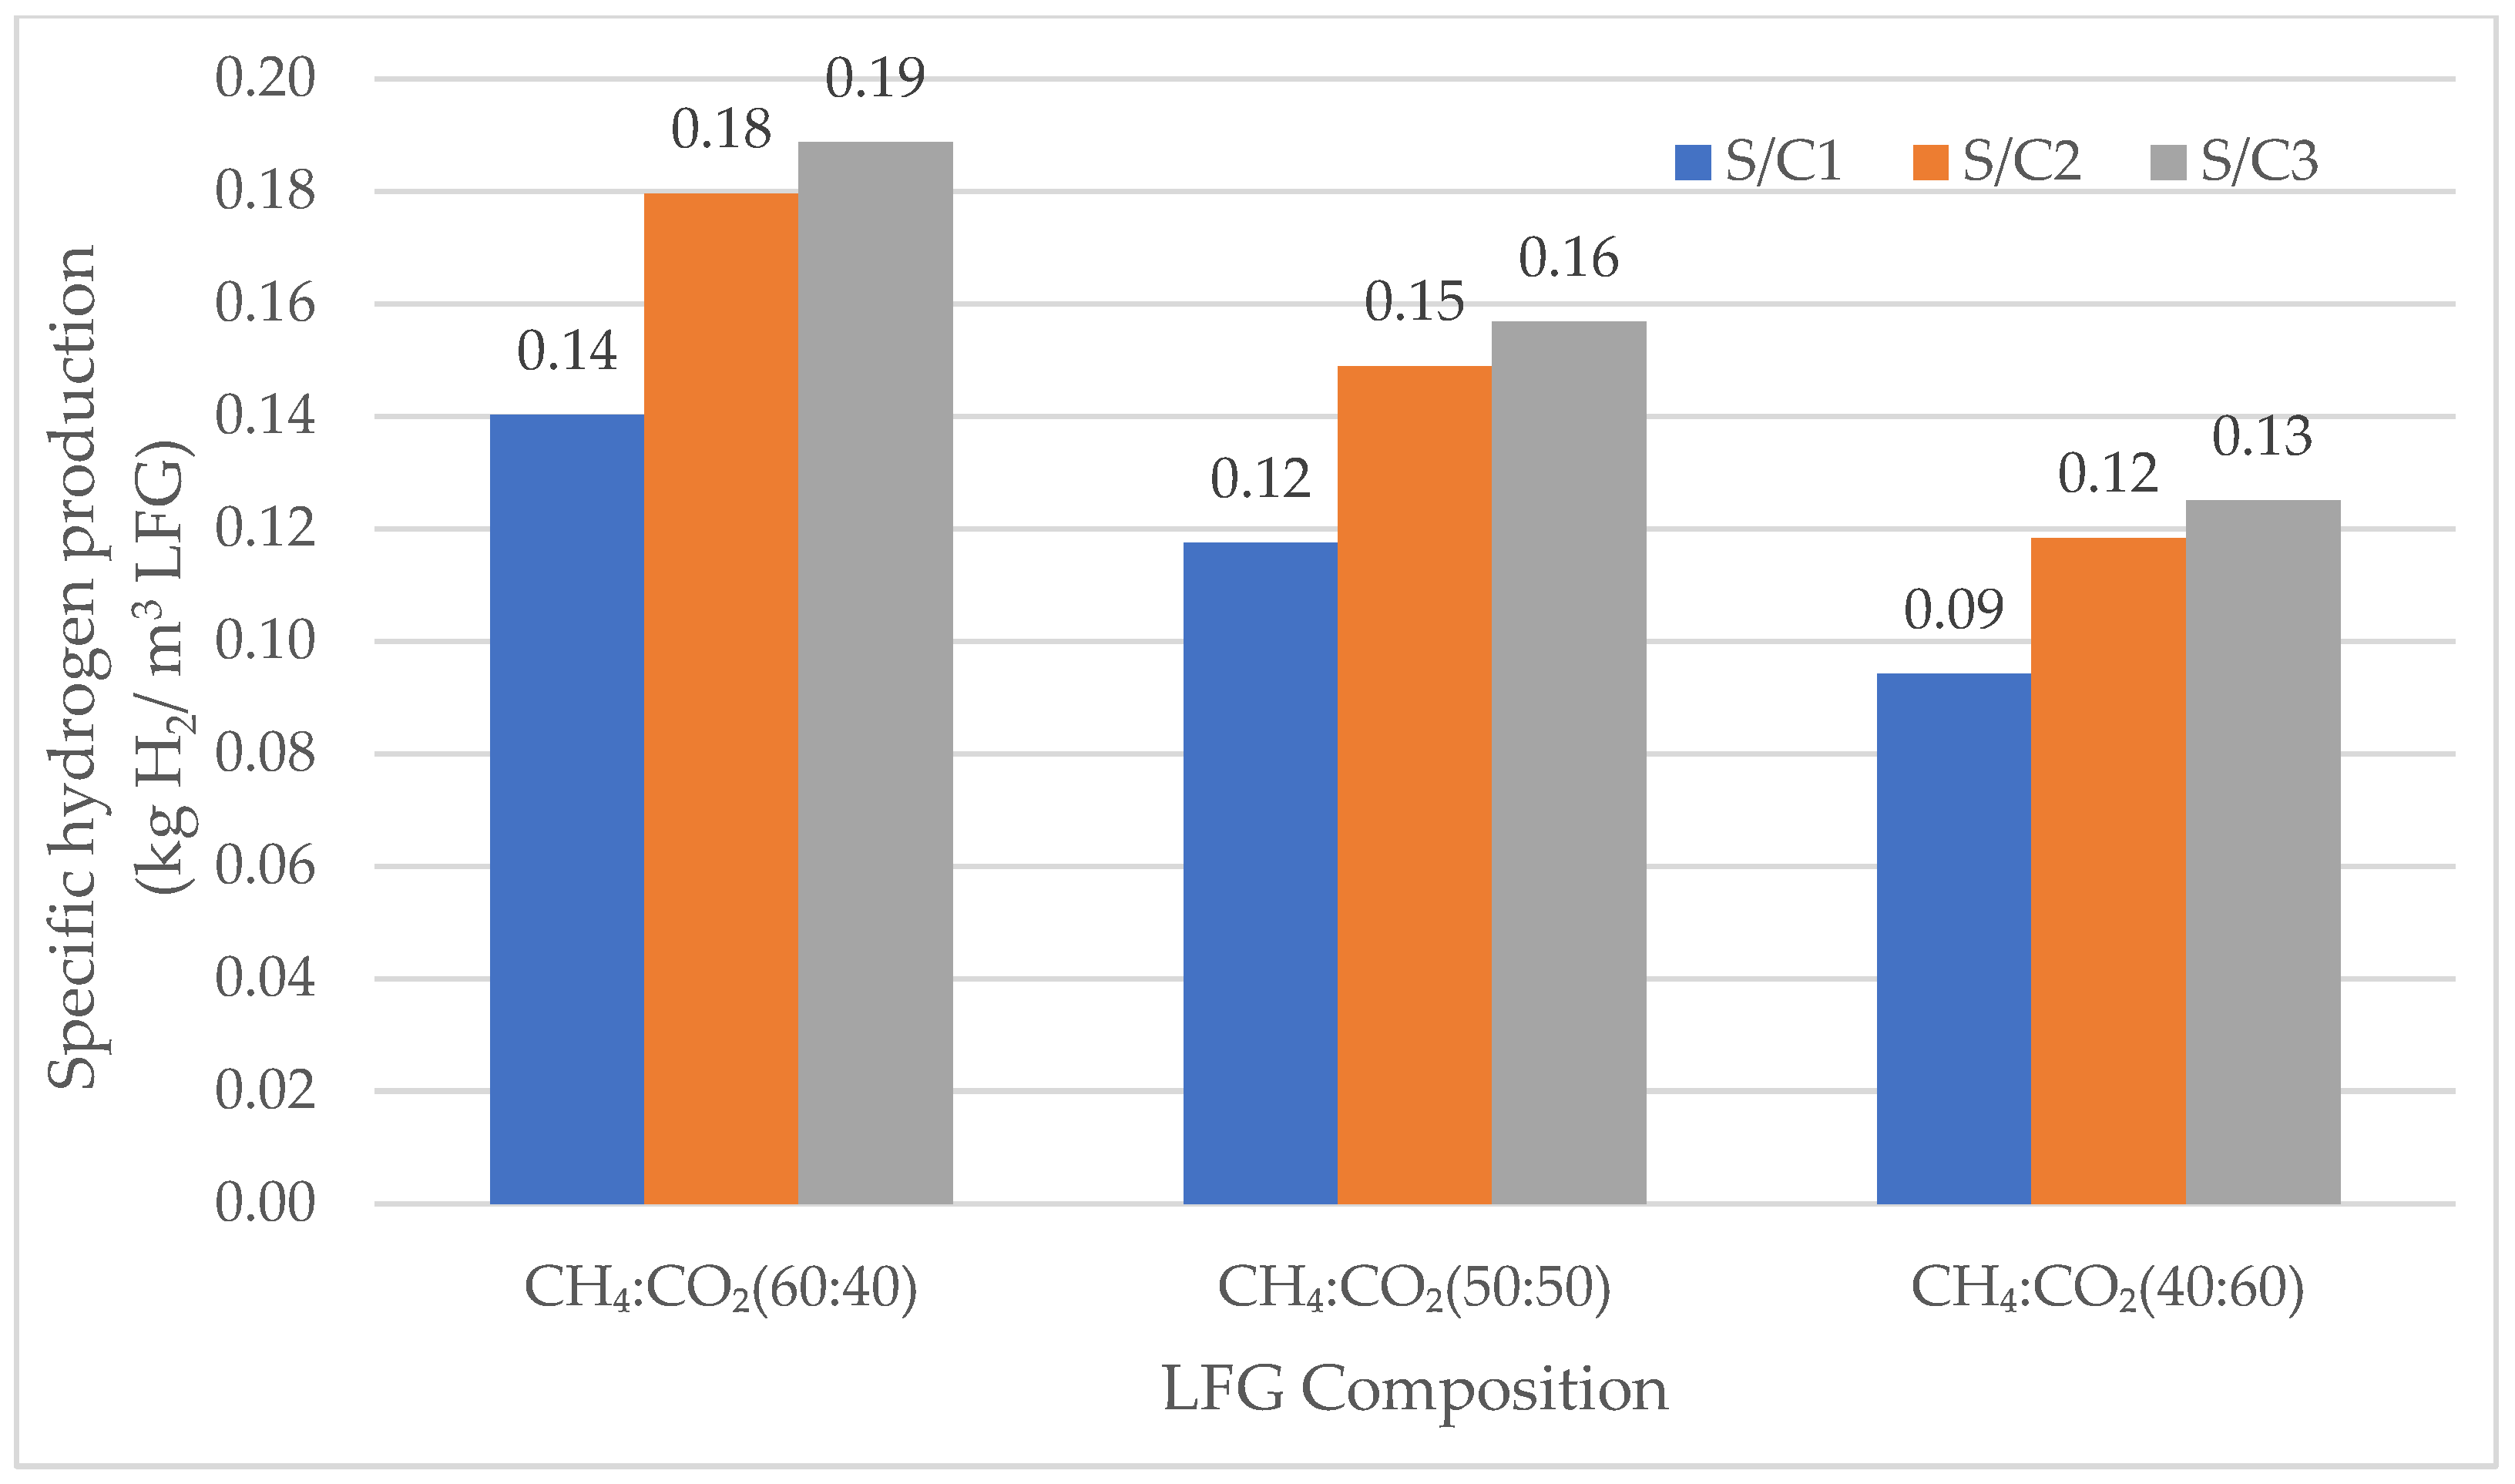
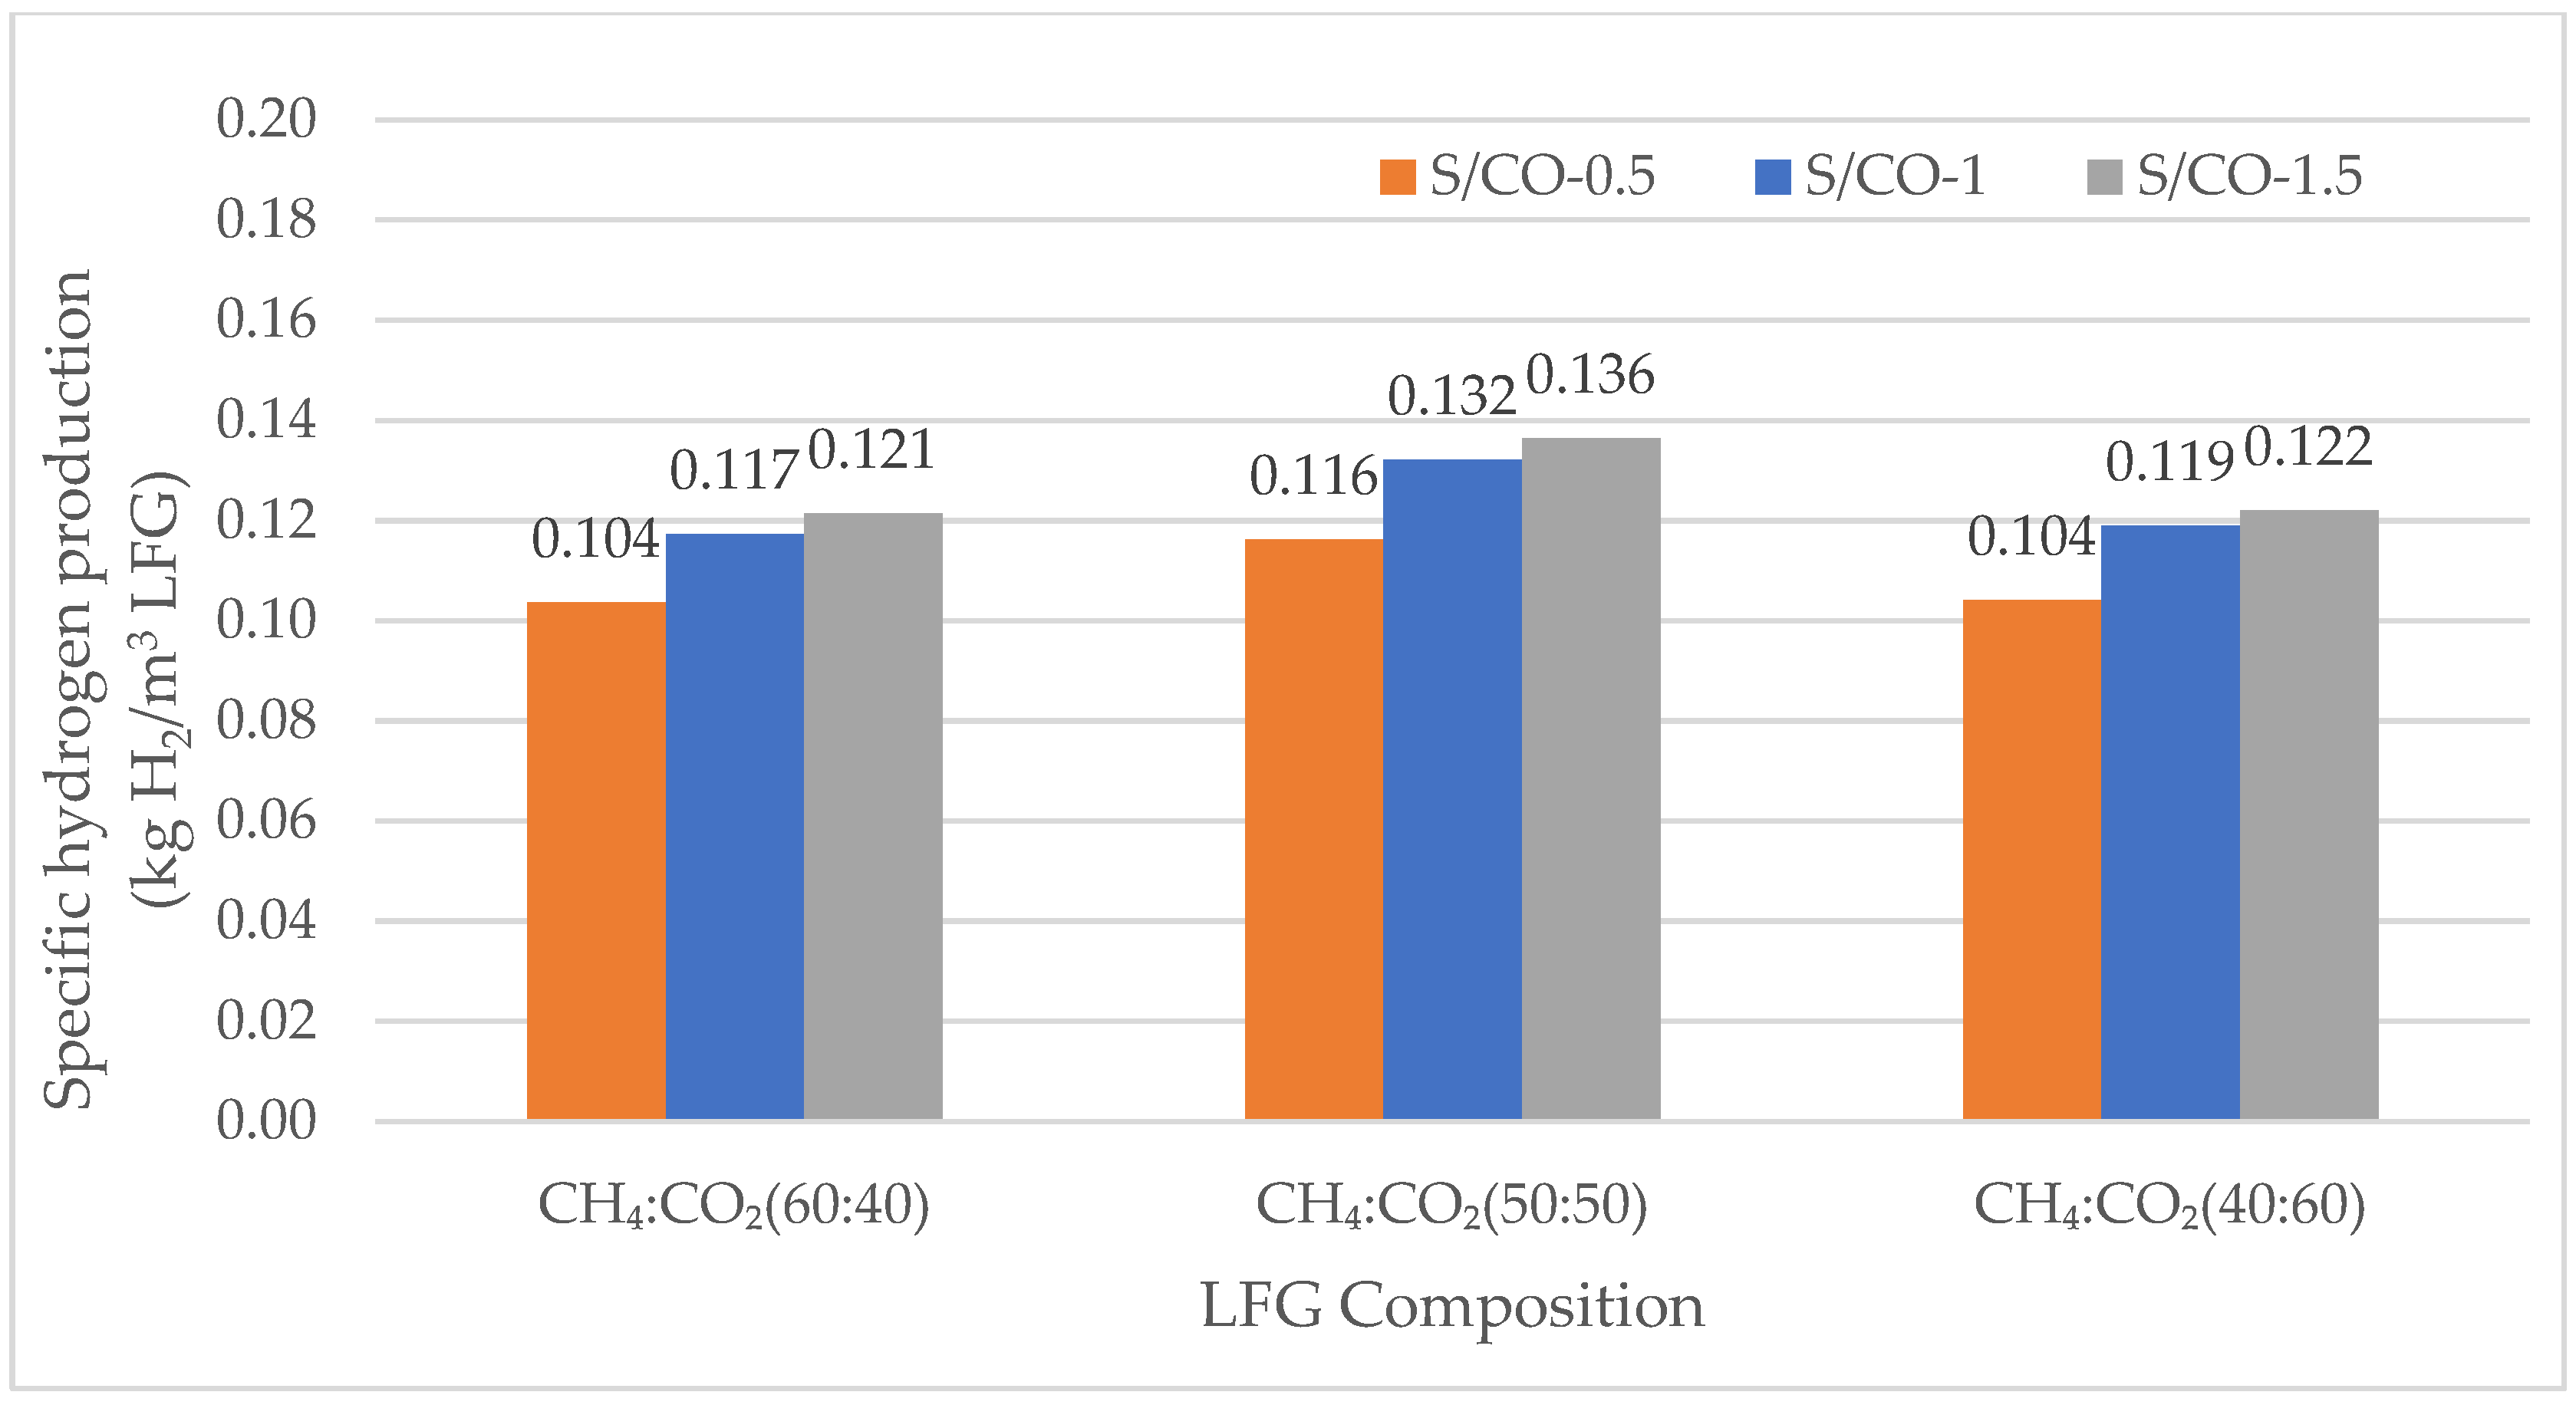
3.2.1. Specific Hydrogen Production

The full results for the main streams of interest obtained by the Aspen simulation for the SMR and DMR processes are reported in the Supplementary Materials for (60:40) LFG compositions and S/C and S/CO ratios, for SMR and DMR, at a temperature of 900 °C, pressure 5 bar. In the following, the observation of the calculated parameters (i.e., specific hydrogen production, CH4 conversion, CO2 conversion, specific heat duty, specific cooling duty, specific power consumption, specific primary energy consumption) are reported and discussed.

Specific Hydrogen Production for SMR

Figure 3 displays the specific hydrogen production, measured in kilograms per cubic meter of LFG, across three CH4 to CO2 ratios, 60:40, 50:50, and 40:60, under SMR conditions at a temperature of 900 °C, pressure 5 bar. Each gas composition is analyzed under three different conditions of a steam-to-carbon ratio of S/C1 equal to 1, S/C2 equal to 2, and S/C3 equal to 3. For a 60:40 ratio, specific hydrogen production starts at 0.14 kg under S/C1, increases by 28.6% to 0.18 kg in S/C2, and reaches 0.19 kg in S/C3, a further 5.6% rise from S/C2 and a total increase of 33.13.7% from S/C1. At the 50:50 ratio, specific hydrogen production begins at 0.12 kg for S/C1, climbs by 26.78% to 0.15 kg in S/C2, and reaches 0.16 kg in S/C3, marking a 5.32% increase from S/C2 and a 32.11% increase from S/C1. For the 40:60 ratio, the initial specific hydrogen production is 0.09 kg in S/C1, which then rises by 25.6% to 0.12 kg in S/C2, and reaches 0.13 kg in S/C3, showing a 5.6% increase from S/C2 and an overall increase of 31% from S/C1. The described trends are consistent with those available in the literature [74].
Across all ratios, there is a consistent rise in specific hydrogen production from S/C1 to S/C3, with the highest overall percentage increase observed at the 60:40 ratio (33.13%) and the smallest at the 40:60 ratio (31.35%). It can also be observed that when the methane concentration decreases, because the CH4:CO2 ratio decreases, there is less available methane for reforming; thus, hydrogen generation from the same quantity of feed gas obviously diminishes. Nevertheless, a rise in the S/C ratio results in increased hydrogen production across all considered compositions of LFG, since additional H2 production derives from H2O conversion through the WGS reaction, rather than the CH4 conversion through the reforming reaction. However, it must be noted that the addition of a larger steam amount increases, in principle, the requirement for energy input.

Specific Hydrogen Production for DMR

Figure 4 shows the specific hydrogen production (in kg) per cubic meter LFG for different CH4 to CO2 ratios: 60:40, 50:50, and 40:60, under DMR conditions, at a temperature of 900 °C, pressure 5 bar. It also examines the impact of various steam-to-carbon monoxide (S/CO) ratios (0.5, 1.0, and 1.5) within the WGS reactor on the specific hydrogen production. In particular, for a 60:40 ratio, specific hydrogen production is 0.104 kg at an S/CO ratio of 0.5, increasing to 0.117 kg at an S/CO ratio of 1.0, and further to 0.121 kg at an S/CO ratio of 1.5. This represents a 13.2% increase in specific hydrogen production when the S/CO ratio changes from 0.5 to 1.0, and an additional 3.5% increase from 1.0 to 1.5 and a total increase of 16.7% from the S/CO ratio of 0.5.
At a ratio of 50:50, specific hydrogen production starts at 0.116 kg for an S/CO ratio of 0.5. Increasing the S/CO ratio to 1.0 yields 0.132 kg, a 13.6% increase, while raising it to 1.5 results in 0.136 kg, representing a 3.3% increase from 1.0 and a total increase of 16.9% from the S/CO ratio of 0.5. For a ratio of 40:60, specific hydrogen production is 0.104 kg at an S/CO ratio of 0.5, increasing to 0.119 kg at an S/CO ratio of 1.0, and further to 0.122 kg at an S/CO ratio of 1.5. This shows a 14.2% increase from 0.5 to 1.0 and a 2.6% increase from 1.0 to 1.5 and a total increase of 16.89% from the S/CO ratio of 0.5.
In summary, an increase in the S/CO ratio at WGS generally leads to higher specific hydrogen production across all ratios, with the largest incremental gains observed when moving from an S/CO ratio of 0.5 to 1.0. It is also significant from the results that, for all different LFG compositions and S/CO ratios, the highest hydrogen production is observed for a 50:50 ratio of LFG. Thus, in DMR the hydrogen production is maximum till the CH4/CO2 ratio is one (due to the stoichiometry of the reaction in Equation (4)) and then starts to decrease for any fixed S/CO ratio. Indeed, hydrogen production is very similar for ratios 60:40 and 40:60.

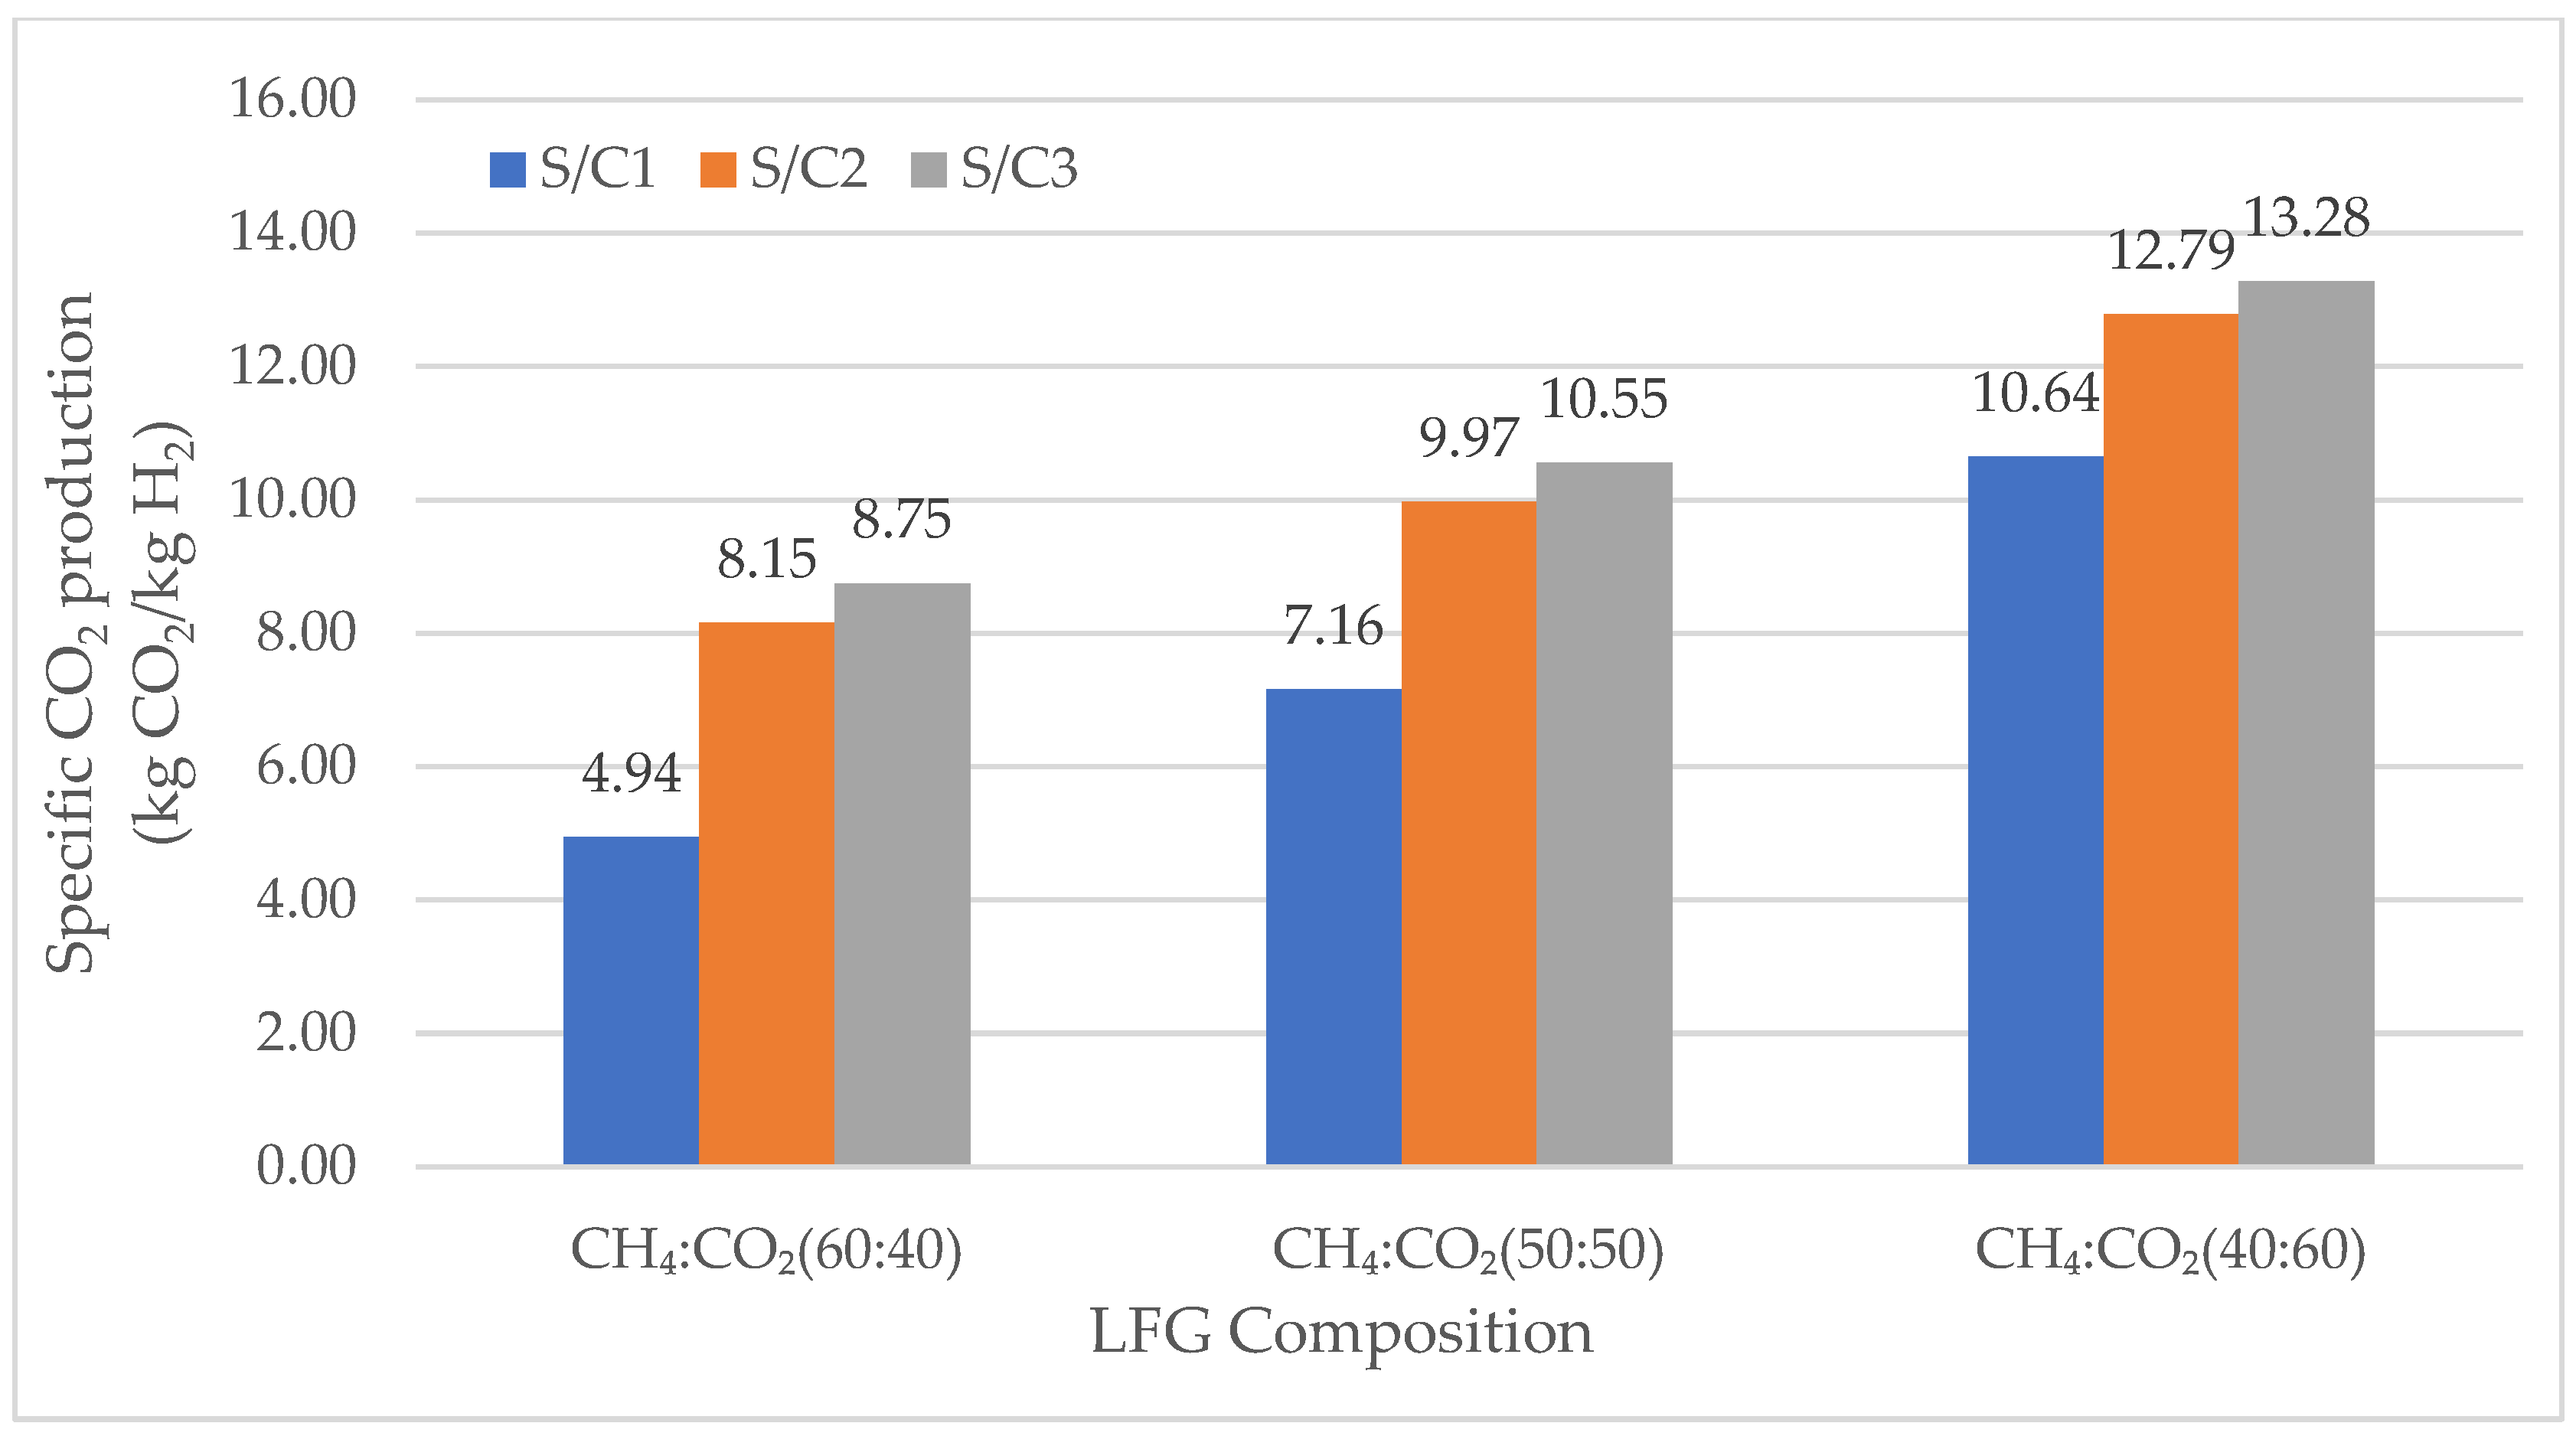
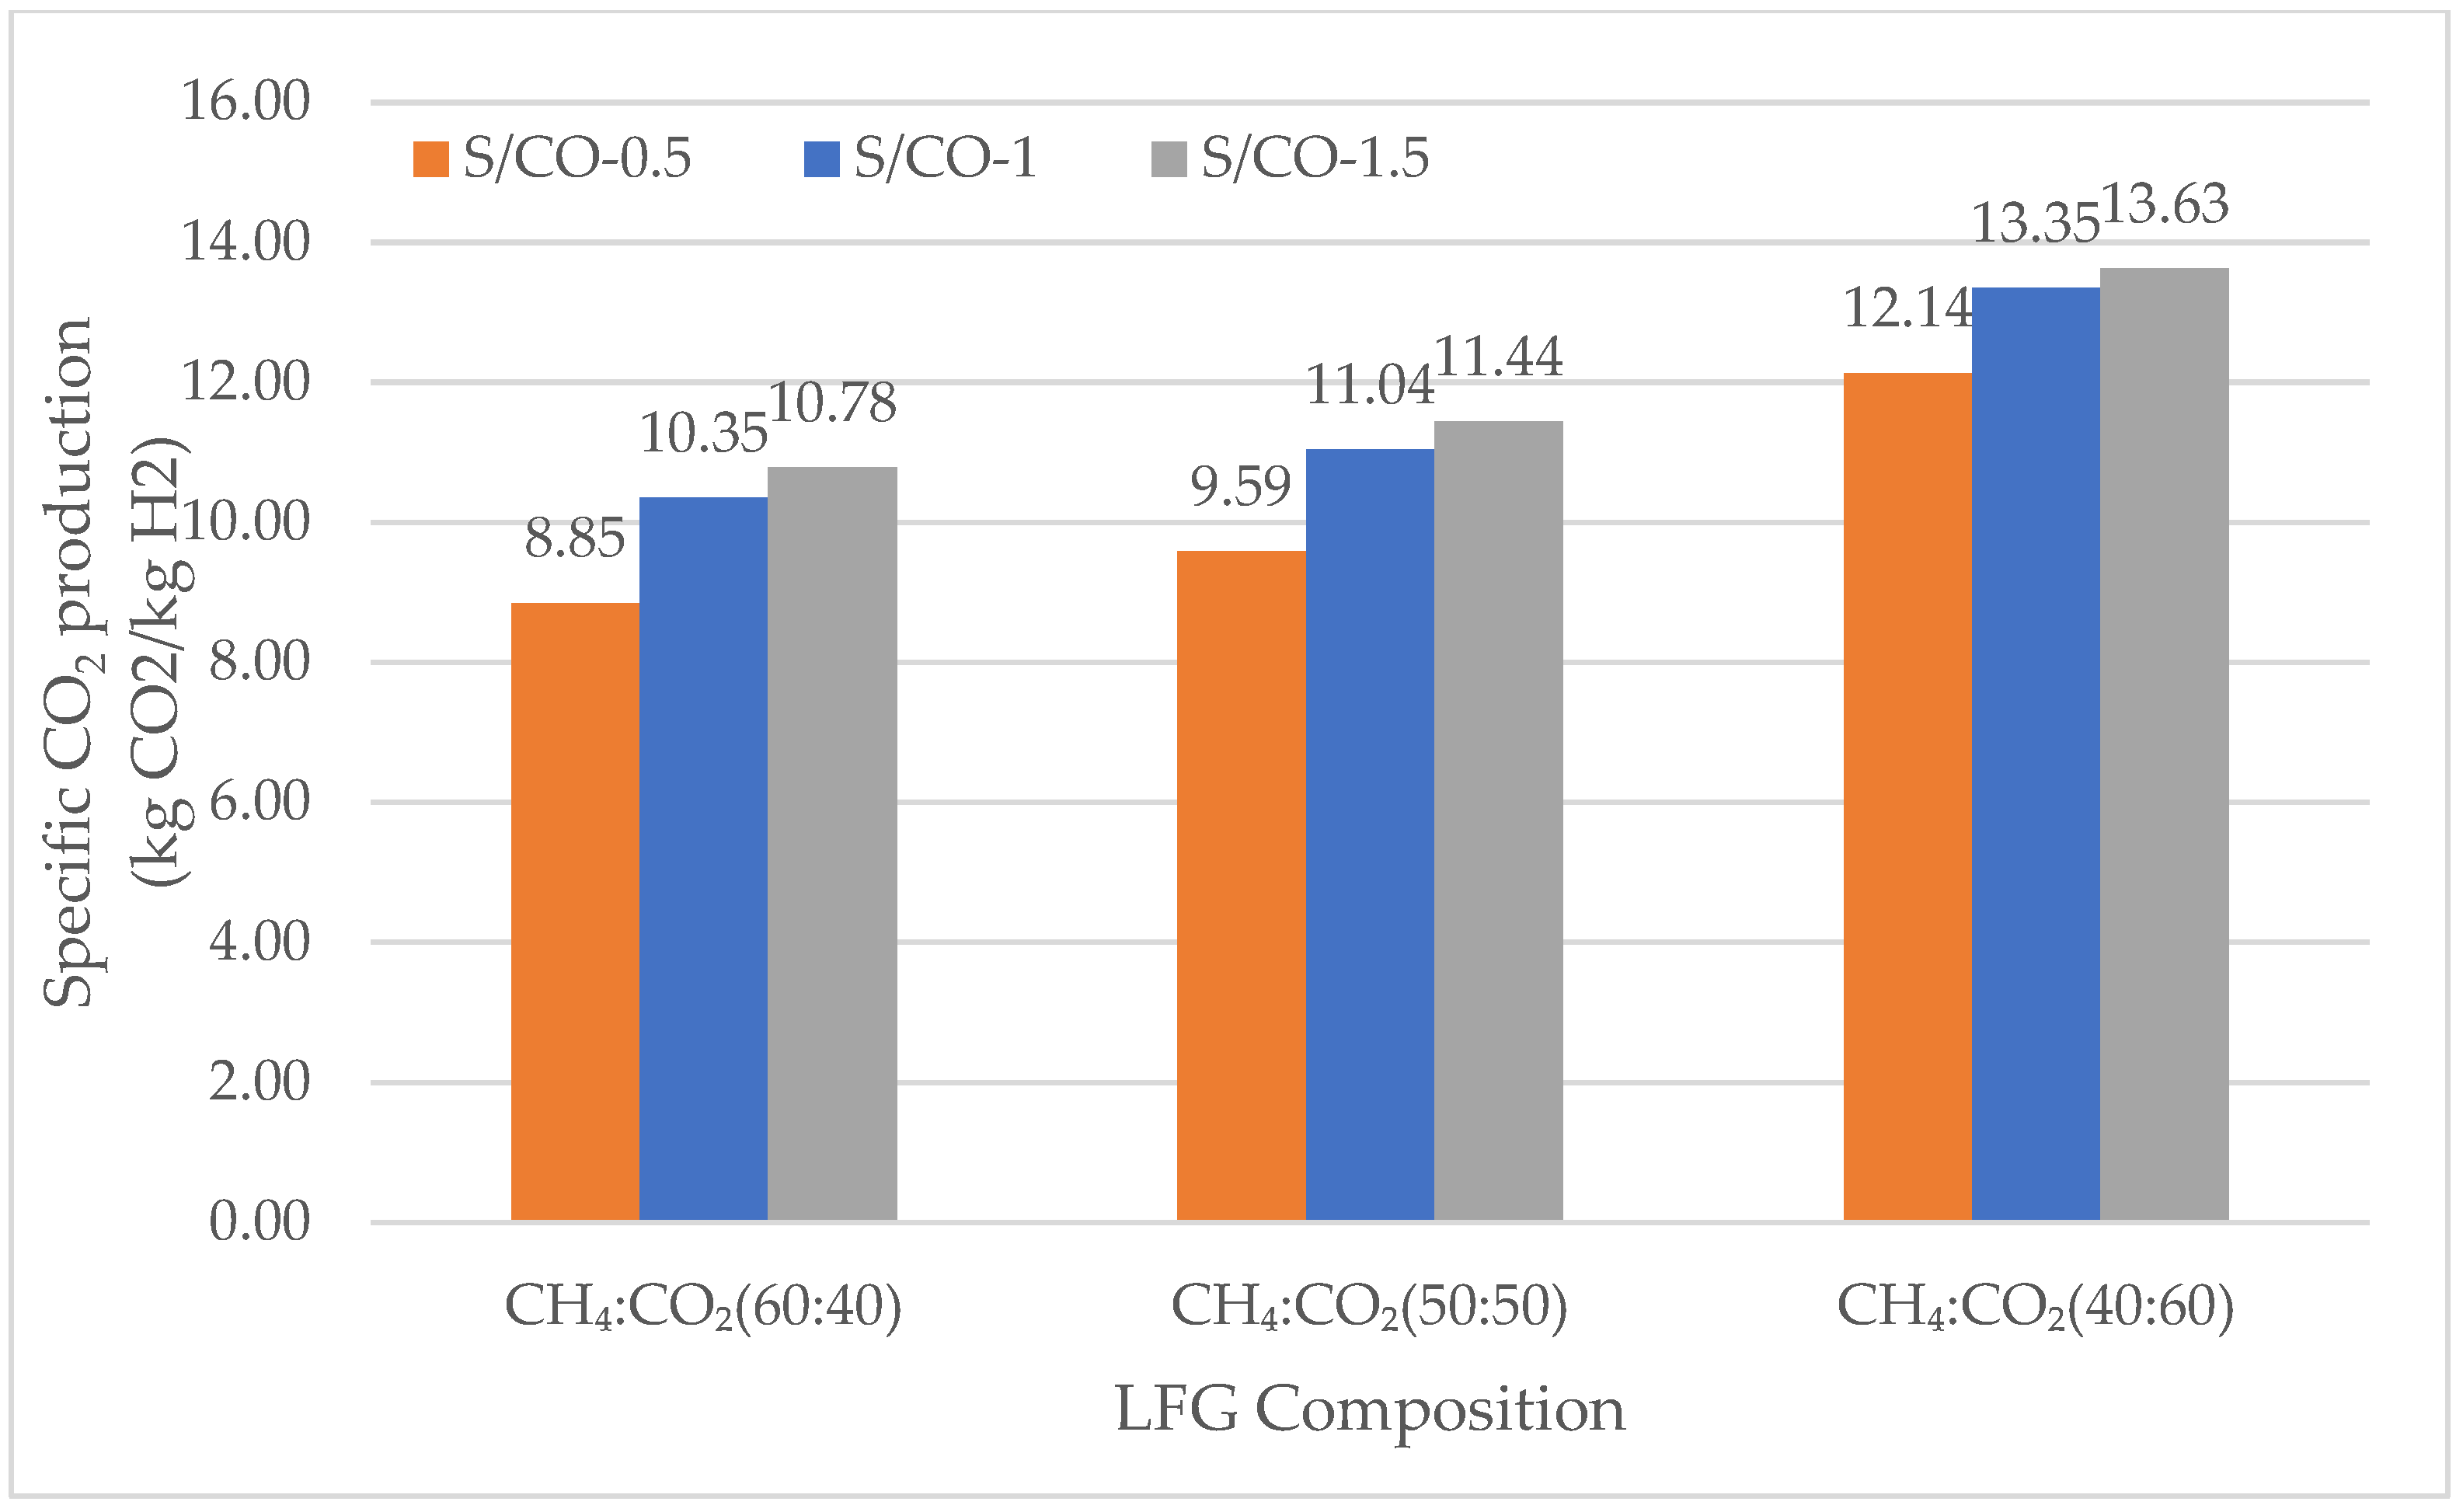
3.2.2. Specific Carbon Dioxide Production

Specific Carbon Dioxide Production in SMR

Figure 5 shows the specific CO2 production per unit of mass of produced hydrogen for three CH4 to CO2 ratios: 60:40, 50:50, and 40:60. Each ratio is analyzed under three conditions, S/C1, S/C2, and S/C3. Additionally, other studies indicate that the concentration of CO2 increases in process streams with an increasing S/C ratio, due to the enhanced conversion of LFG to hydrogen, thereby producing more CO2 [63]. For the (CH4:CO2) 60:40 ratio, the specific CO2 production starts at 4.94 kg in S/C1, increases by 65.1% to 8.15 kg in S/C2, and further rises by 7.3% to 8.75 kg in S/C3, totaling a 72.4% increase from S/C1 to S/C3. At the 50:50 ratio, the specific CO2 production is 7.16 kg in S/C1, rising by 39.2% to 9.97 kg in S/C2, and then increasing by 5.8% to 10.55 kg in S/C3, which is a total increase of 45.1% from S/C1 to S/C3. For the 40:60 ratio, the specific CO2 production starts at 10.64 kg in S/C1, increases by 20.13% to 12.79 kg in S/C2, and reaches 13.28 kg in S/C3, a further 3.8% rise from S/C2 and a total increase of 23.9% from S/C1 to S/C3.
Overall, as the specific CO2 concentration increases from the 60:40 to the 40:60 ratio, CO2 production also increases across all conditions, with the most substantial rises observed from S/C1 to S/C3 in each ratio. This indicates that both the CH4:CO2 ratio and the progression from S/C1 to S/C3 have a strong influence on the specific CO2 production, with higher CO2 ratios leading to higher CO2 production per kilogram of H2. Since steam is a reactant in both reforming and WGS reactions, varying the S/C ratio can substantially influence the equilibrium of these reactions. Increasing the S/C ratio drives the equilibrium of both processes in the same direction. By raising the steam excess, the equilibrium of the reforming and WGS reactions shifts toward the products, leading to higher methane conversion and an increased H2 yield. Simultaneously, shifting the equilibrium of the WGS reaction to the right also results in greater CO2 production [75].

Specific Carbon Dioxide Production in DMR

Figure 6 shows specific CO2 production (kg) per unit of mass of produced H2, for different CH4 to CO2 ratios, 60:40, 50:50, and 40:60, under DMR conditions. It also examines the impact of various S/CO ratios (0.5, 1.0, and 1.5) within the WGS reactor. For a 60:40 ratio, the specific CO2 production starts at 8.85 kg in the S/CO ratio of 0.5, increases by 16.9% to 10.35 kg in the S/CO ratio of 1, and further rises by 4.8% to 10.78 kg in the S/CO ratio of 1.5, totaling a 21.3% increase from the S/CO ratio of 0.5 to the S/C ratio of 1.
For a 50:50 ratio, the specific CO2 production starts at 9.59 kg in an S/CO ratio of 0.5, increases by 15.2% to 11.04 kg in an S/CO ratio of 1, and further rises by 3.6% to 11.44 kg in an S/CO ratio of 1.5, totaling a 18.8% increase from an S/CO ratio 0.5 to S/C ratio 1. For 40:60 ratio, the specific CO2 production starts at 12.14 kg in an S/CO ratio of 0.5, increases by 9.98% to 13.35 kg in an S/CO ratio of 1, and further rises by 2.09% to 13.65 kg in an S/CO ratio of 1.5, totaling a 12.07% increase from an S/CO ratio 0.5 to an S/C ratio 1. Here we can also observe similar results, such as SMR for the S/CO ratio increase, the hydrogen production increases, and the CO2 production also increases, due to more CO conversion, in this case in the WGS section. When CO2 in the feed is also increasing, an overall increase in CO2 production is observed. However, the CO2 specific production in the case of DMR (8.85–13.63 kgCO2/kgH2) is higher than in the case of SMR (4.94–13.28 kgCO2/kgH2).

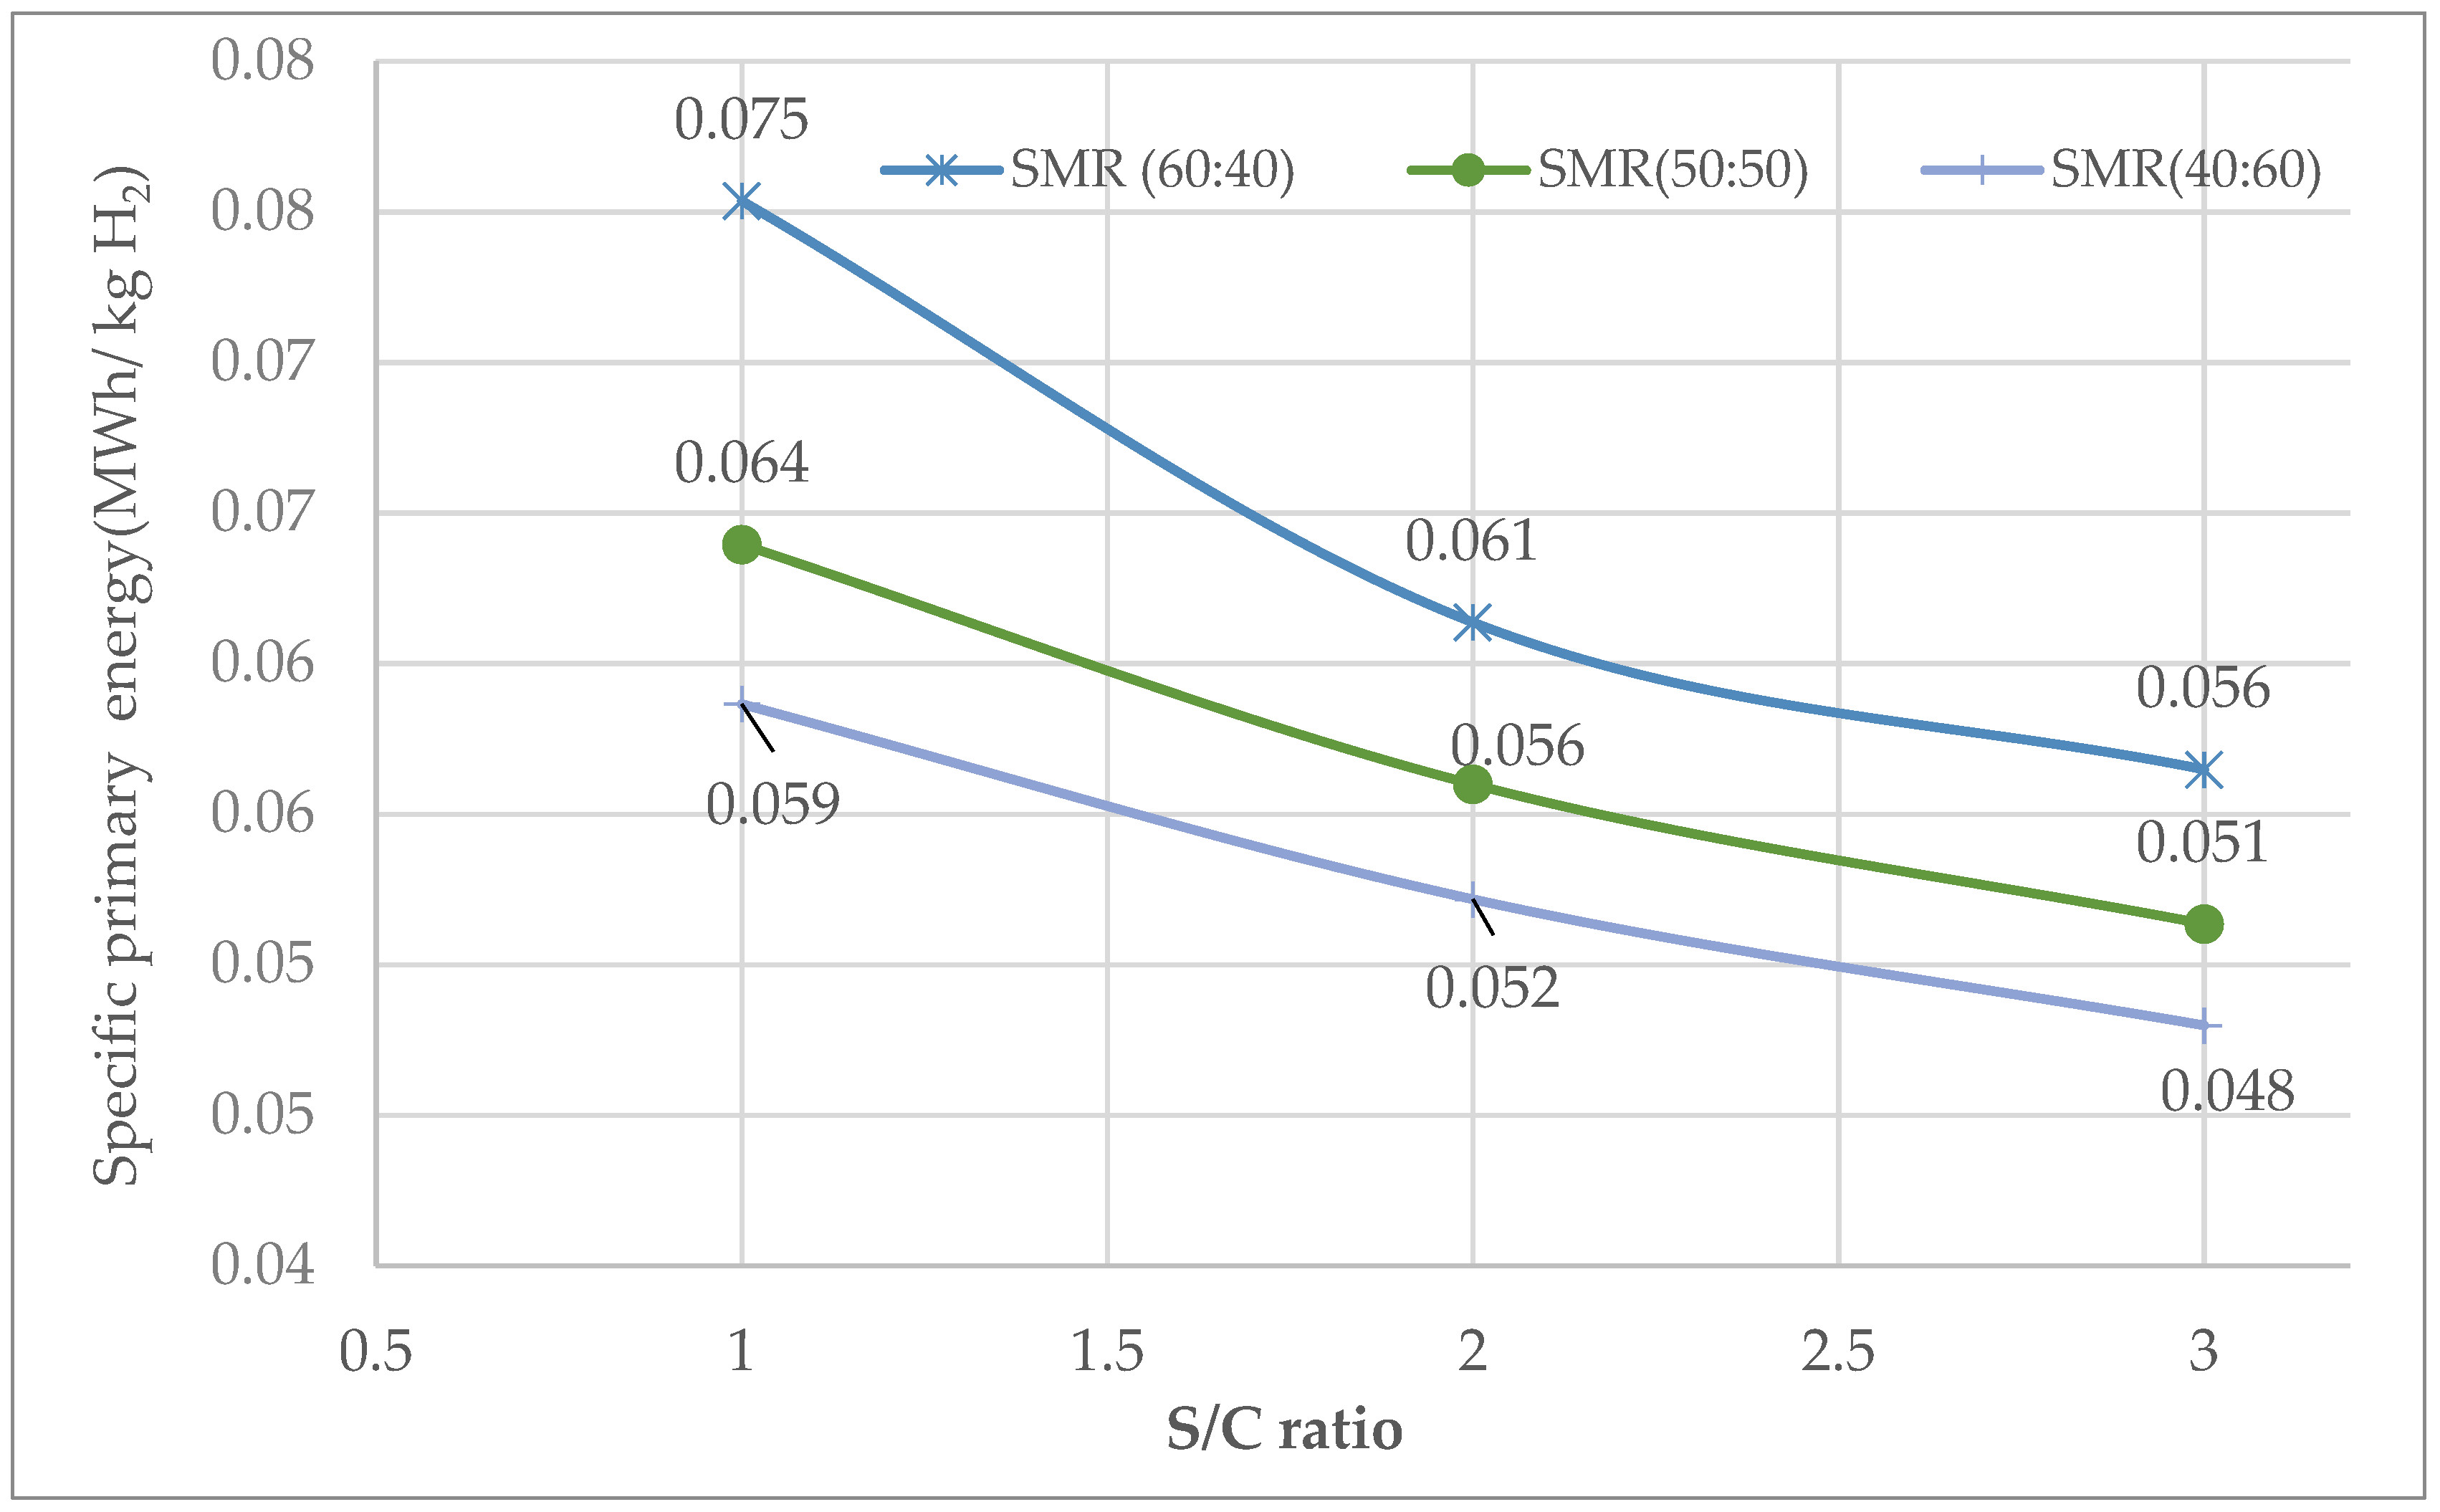
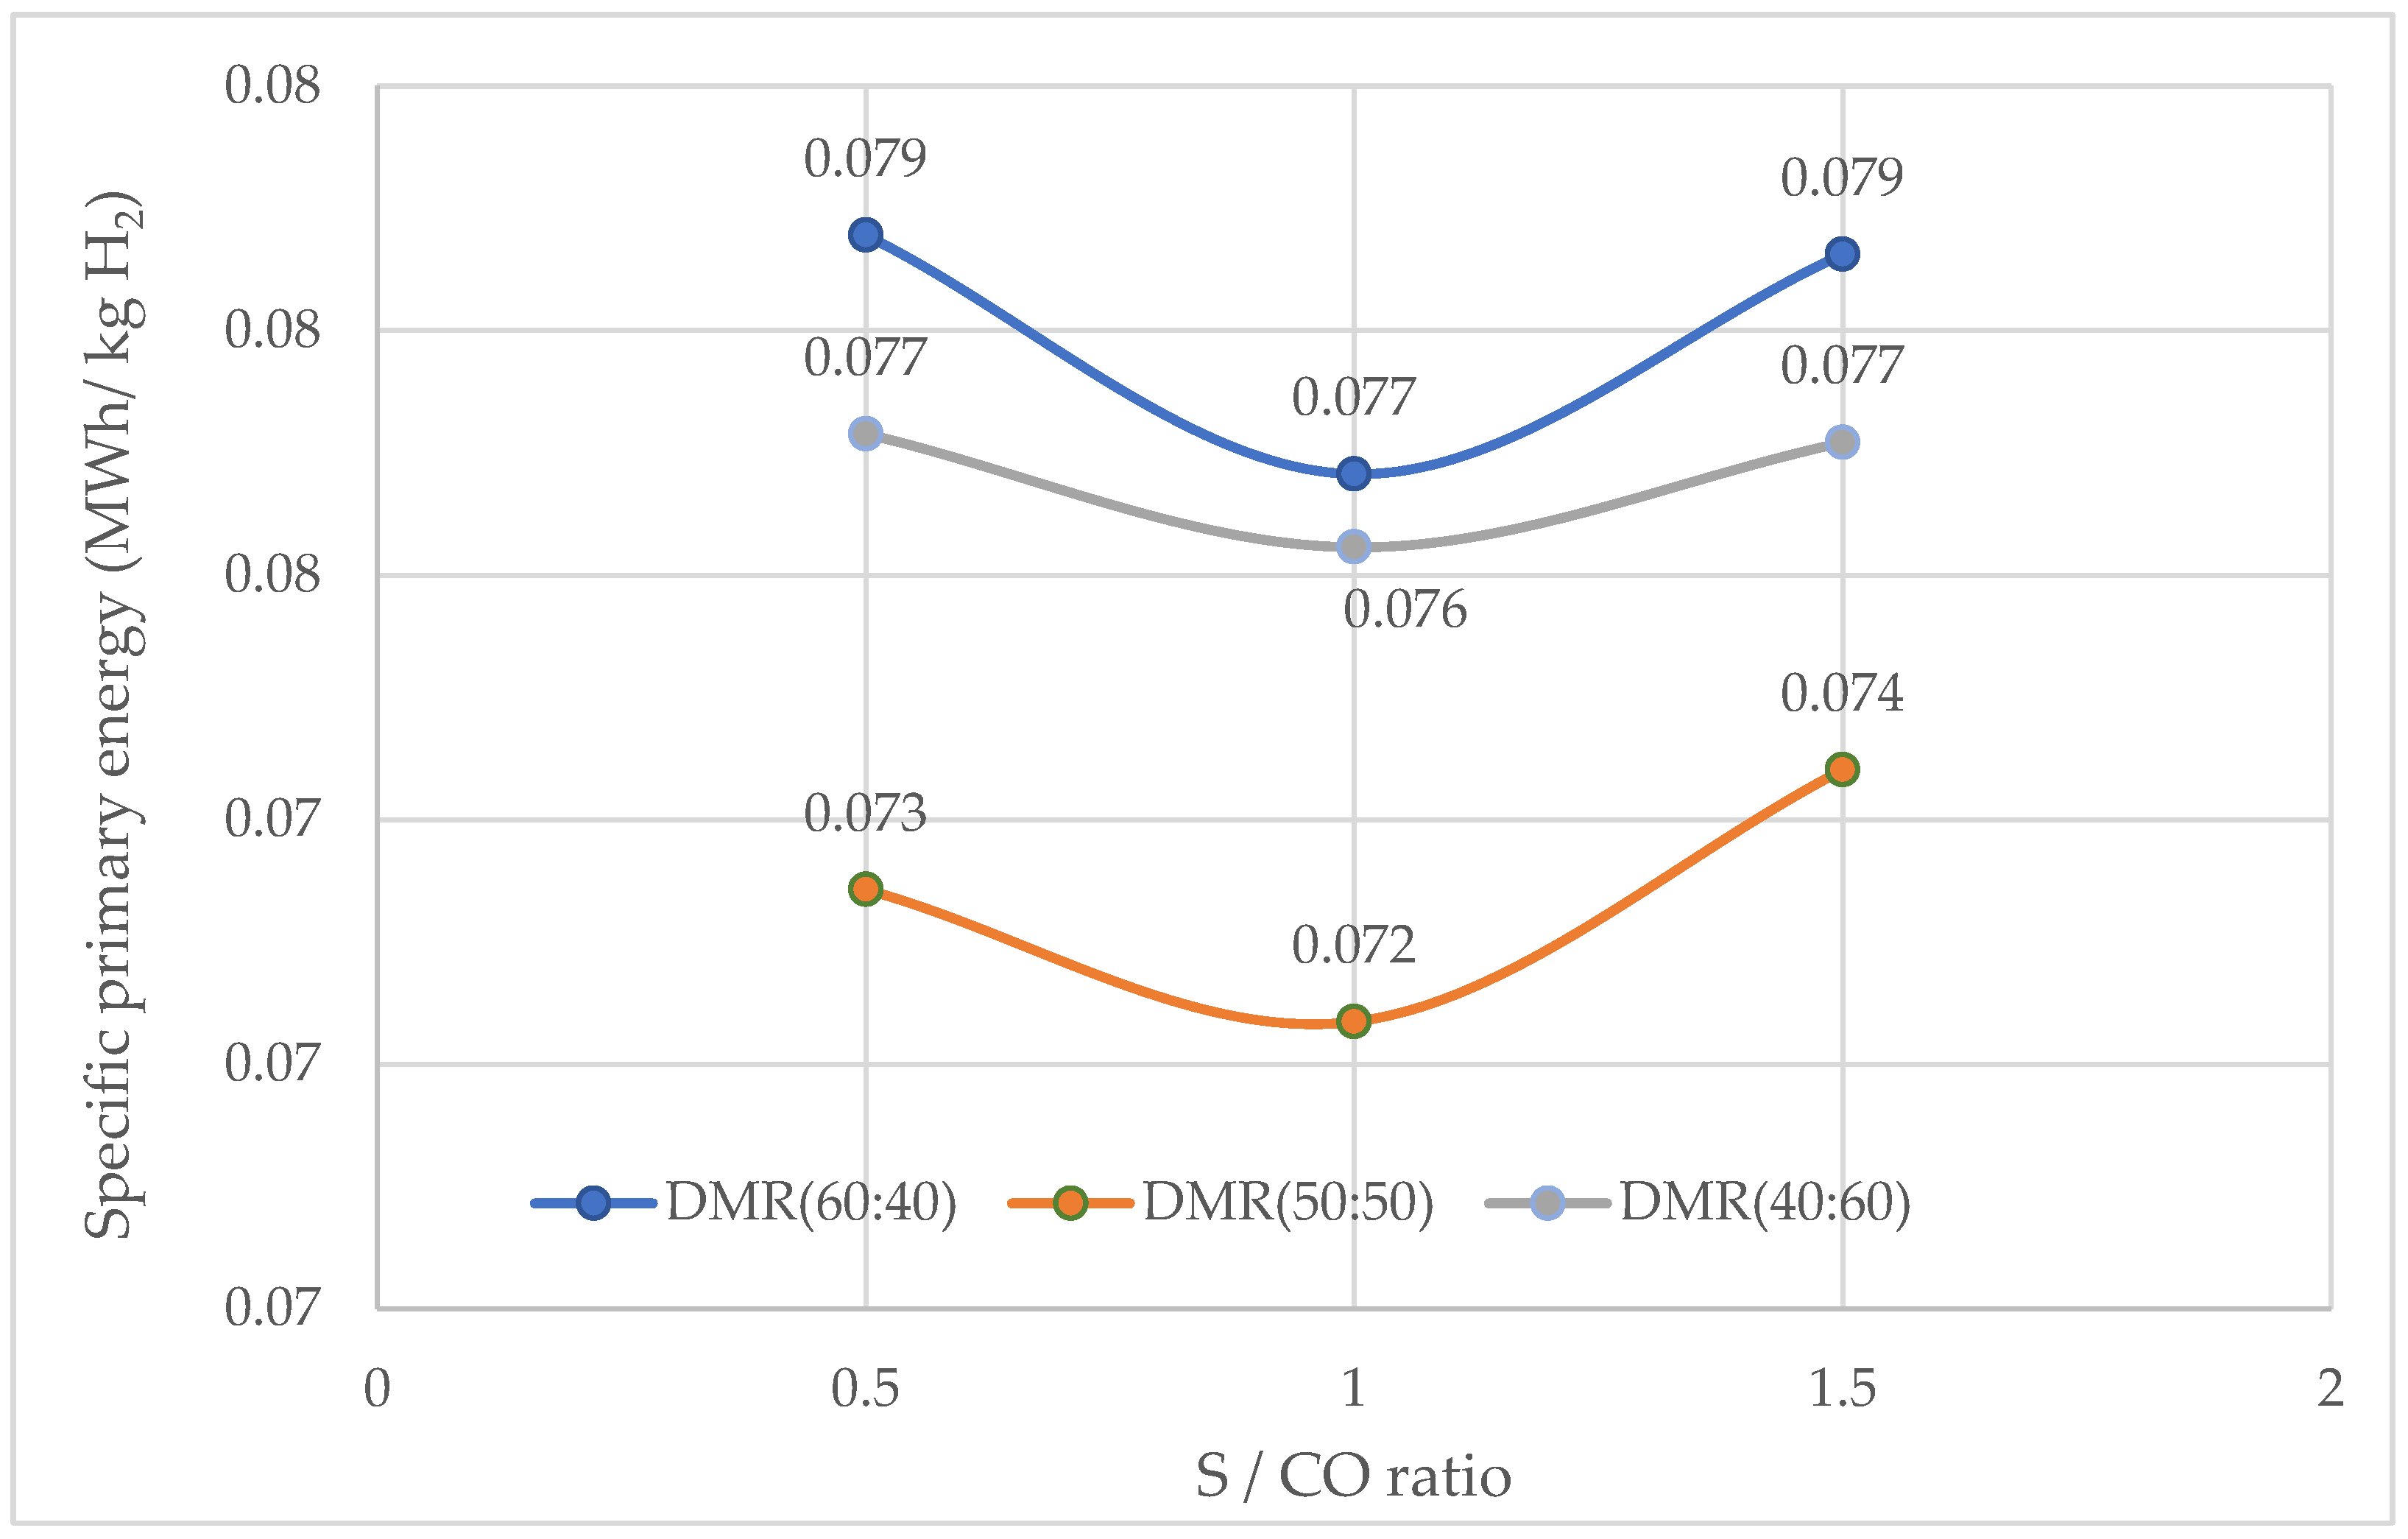
3.2.3. Specific Primary Energy Consumption

The primary energy calculations were conducted based on values obtained from SHD, SPC, and SCD across various equipment within the reforming processes. Specifically, energy requirements were analyzed for key components, such as the reformer, pumps, compressor, reboiler, and condenser within the stripping column, utilized in the water scrubbing process. Additionally, cooling loads were considered for the process coolers. By determining these values, an overall assessment of primary energy consumption was achieved, facilitating a deeper understanding of the energy profile and efficiency of each unit operation involved in the reforming and gas separation stages. This approach helps to highlight critical energy-intensive areas and provides insights for potential optimization within the SMR system.

Specific Primary Energy Consumption for SMR

Figure 7 illustrates specific primary energy consumption (kWh/kg of H2) for SMR at multiple S/C ratios, from 1 to 3, across various CH4:CO2 ratios (60:40, 50:50, and 40:60). The findings demonstrate that primary energy consumption diminishes with an increase in the S/C ratio, indicating enhanced energy efficiency at an elevated S/C ratio. A 60:40 ratio continuously necessitates the most energy, consuming 0.075 MWh/kg H2 at an S/C ratio of 1, which diminishes to 0.061 MWh/kg H2 at an S/C ratio of 2, and further to 0.056 MWh/kg H2 at an S/C ratio of 3. For the 50:50 ratio, energy consumption decreases from 0.064 MWh/kg H2 at an S/C ratio of 1 to 0.056 MWh/kg H2 at an S/C ratio of 2, ultimately reaching 0.051 MWh/kg H2 at an S/C ratio of 3. The 40:60 ratio exhibits the minimal primary energy consumption throughout all S/C ratios, commencing at 0.059 MWh/kg H2 and thereafter declining to 0.052 and 0.048 MWh/kg H2 as the S/C ratio escalates from 1 to 3.
Assuming that the energy required for the process is supplied by burning additional LFG, from the results above, it is possible to calculate that about 1.4–1.8 Nm3 of LFG are required to process by SMR 1 Nm3 of LFG, considering the worst and best cases in terms of specific hydrogen production and specific energy consumption. Similarly, 1.4–2.1 Nm3 of LFG are required to process by DMR 1 Nm3 of LFG (see details in Table S3 in the Supplementary Materials).
Details of the calculated heat, cooling and power duties distribution are reported in Table S4 (Supplementary Materials). It is observed that, for different LFG compositions, as the S/C ratio increases from 1 to 3, the reformer duty rises due to the higher energy demand required to process steam at elevated ratios. The reformer duty increased by approximately 21%, 21% and 19% for 60:40, 50:50 and 40:60 ratios with an increase in S/C from 1 to 3 for each composition, respectively. However, as the CO2 removal is included in the process, to produce pure hydrogen, the heat duty of the reboiler and condenser in the stripping column also plays an important role in the overall energy requirement. Overall, as the S/C ratio increases from 1 to 3 for all compositions, the net heat duty per kilogram of hydrogen produced decreases. This is because the increase in the S/C ratio leads to higher hydrogen production, reducing the specific heat duty required per unit of hydrogen. Another important factor is that heat is also required by HTWGS and LTWGS; however, in the present simulation, particular attention was given to recover the heat from the hot streams by several heat exchangers, enabling both to operate without the need for an external heat supply.
From our studies, it was also observed that as we move from a 60:40 to 50:50 to 40:60 LFG ratio, the specific energy requirement decreases for all S/C ratios. As the composition changes, the methane input decreases, reducing the availability of methane for reforming with steam or CO2. This explains the decrease in energy requirement for the reforming process as the methane composition decreases at specific S/C ratio [16]. The specific cooling duty required for hydrogen production varies with the CH4/CO2 ratio in LFG, and the data reveal distinct energy consumption trends.
At a 60:40 ratio, the cooling duty is highest, ranging from 0.03957 to 0.02849 MWh/kg H2. This indicates that producing hydrogen with a higher methane content requires more cooling energy. For a 50:50 CH4/CO2, the cooling duty decreases, ranging from 0.03113 to 0.02487 MWh/kg H2, demonstrating improved energy efficiency when methane and carbon dioxide are in equal proportions. The lowest cooling duty is observed for the 40:60 ratio, with values between 0.02691 and 0.02158 MWh/kg H2. Overall, it is observed that the specific primary energy decreases as the S/C ratio is increased from 1 to 3 and hydrogen production increases. Therefore, operating the LFG SMR process at a higher S/C ratio is more advantageous for efficiency.

Specific Primary Energy Consumption for DMR

Figure 8 displays primary energy consumption (MWh/kg H2) for DMR at various S/CO ratios at WGS, spanning from 0.5 to 1.5, under distinct (CH4:CO2) ratios (60:40, 50:50, and 40:60). The findings indicate a pattern where primary energy consumption diminishes to a minimum at an S/CO ratio of 1, thereafter increasing as the S/CO ratio ascends to 1.5. In the 60:40 ratio, primary energy consumption initiates at 0.079 MWh/kg H2 with an S/CO ratio of 0.5, attains a minimum of 0.077 MWh/kg H2 at an S/CO ratio of 1, and then experiences a slight rise to 0.079 MWh/kg H2 at an S/CO ratio of 1.5. For 40:60 ratio has the same pattern, with energy consumption commencing at 0.077 MWh/kg H2 at an S/CO ratio of 0.5, declining to a low of 0.076 MWh/kg H2 at an S/CO ratio of 1, and then increasing to 0.077 MWh/kg H2 at an S/CO ratio of 1.5. The 50:50 ratio exhibits the minimal primary energy consumption among all S/CO ratios, commencing at 0.073 MWh/kg H2, decreasing to 0.072 MWh/kg H2 at an S/CO ratio of 1, and then rising to 0.074 MWh/kg H2 at an S/CO ratio of 1.5.
Based on the calculated duty distribution in Table S4 (Supplementary Materials) the highest heat duties for both the reformer and reboiler are observed for a 50:50 LFG ratio. As we increase the S/CO ratio at WGS reactors, the energy requirement increases. Specifically, the reformer duty increases by about 13% when the composition shifts from 60:40 to 50:50, while changes in the reboiler duty remain minimal (less than 5%). It can also be observed that a decrease in the CH4/CO2 ratio leads to increased methane conversion. When the CH4/CO2 ratio is less than one, methane conversion becomes limited due to the excess of methane in the feed. Likewise, when CH4 is in excess, its conversion is limited. This highlights the importance of balanced CH4 and CO2 feed compositions for optimal reforming performance and energy efficiency. [76]. For this reason, hydrogen production is the highest at a 50:50 ratio, so both reactants are equimolar and have the maximum CH4 and CO2 conversion. This is true for all three S/CO ratios of 0.5, 1 and 1.5.
It can be observed from Table S4 that the overall cooling duty, which includes the contributions from the three coolers and the condenser duty in the stripping column, is highest for the 50:50 ratio compared to the 60:40 and 40:60 ratios. However, when considering the specific cooling duty relative to the higher hydrogen production at the 50:50 ratio, the SCD is still lower compared to both LFG ratios of 60:40 and 40:60.
Overall, it can be observed that irrespective of any CH4:CO2 ratio, when DMR is carried out at a S/CO ratio of 1, the process has the minimum primary energy requirement, which signifies that a S/CO ratio of 1 is the most energy efficient. The U-shaped pattern in the diagram for all three different ratios of LFG describes this. Additionally, the reformer and reboiler of stripping column heat duties are higher for the 60:40 ratio as compared to the 40:60 ratio, and the same is true for SCD for coolers and condenser duty. For both the 60:40 and 40:60 ratios, hydrogen production is almost the same. Thus, due to the higher duty requirement in the 60:40 ratio, the overall primary specific duty is higher for the 60:40 ratio compared to the 40:60 ratio of CH4 and CO2.

3.2.4. CH4 and CO2 Conversion

Table 3 presents CH4 and CO2 conversion rates for different CH4:CO2 ratios in SMR and DMR processes, for the analyzed cases. In both SMR and DMR processes, methane conversion often rises as the CH4:CO2 ratio decreases, suggesting that an increased CO2 concentration in the feed enhances methane conversion. For SMR, when the ratio shifts from 60:40 to 50:50 and 40:60, methane conversion shows a slight increase, suggesting that CO2 acts as an additional oxidizing agent, promoting methane conversion through CO2 reforming pathways. The literature indicates that a lower CH4/CO2 ratio can increase methane conversion by enabling both steam and dry reforming reactions to proceed simultaneously. On the other hand, CO2 conversion has a direct relation with the CH4/CO2 ratio; as the ratio decreases, the CO2 conversion decreases [73]. This explains the increase in methane conversion as the CH4:CO2 ratio increases.
In SMR, raising the S/C ratio from 1 to 3 greatly enhances methane conversion but decreases CO2 conversion. This is likely because higher steam concentrations favor steam reforming, shifting the reaction balance away from CO2 utilization. This observation aligns with studies that have found an excess of steam boosts methane conversion efficiency but reduces CO2 consumption due to competing reaction pathways, as previously explained [77]. It is very evident that as the S/C ratio increases, there is a drastic decrease in CO2 conversion: for the ratio of 60:40, moving from an S/C ratio 1 to 3, there is a decrease of 84% CO2 conversion; the decrease is 65% and 61% for the 50:50 and 40:60 ratios, respectively, when the S/C ratio is increased from 1 to 3.
In DMR, methane conversion reaches the highest value (98%) at a 40:60 ratio. DMR studies indicate that a higher CO2 concentration helps maintain a more stable methane conversion rate, as CO2 acts as a reactant that balances the methane reforming reactions [78]. The CH4:CO2 ratio has a major impact in the DMR process, significantly influencing both CH4 and CO2 conversion and the composition of the resulting H2 and CO. The increase in the CH4/CO2 ratio led to a decrease in methane conversion. When the CH4/CO2 ratio was greater than one, methane conversion was lower due to its excess in the feed. As the CH4/CO2 ratio dropped below one, methane conversion significantly increased, closely approaching thermodynamic equilibrium.
However, CO2 conversion declined because of its excess in the feedstock. With the increasing concentration of CO2 and the corresponding rise in methane conversion, steam availability also increased. This trend continued until the CH4/CO2 ratio reached unity, enhancing the water–gas shift process and consequently boosting hydrogen production [76]. A higher CH4/CO2 ratio increases the H2/CO ratio in the product gas, which is beneficial for the process. However, an excess of methane reduces CO2 availability, leading to lower methane conversion, especially at high temperatures. Moreover, a lower CH4/CO2 ratio (i.e., more CO2) reduces CO2 conversion and also helps in reducing coke formation on the catalyst [79].
In Table 3, it can be observed that as the ratio increases from 60:40 to 50:50, the CH4 conversion increases from 79.69 to 96.69% and further increases to 98% for the 40:60 ratio. At the same time, the CO2 conversion decreased from 99% to 96.61% to 89.75% for the respective ratios. This is due to the fact that when the ratio is 60:40, CH4 availability is greater compared to CO2, and when the ratio is 40:60, CO2 availability is greater compared to CH4. In both cases there is left over CH4 or CO2, which is not converted to product gases. On the contrary, when the ratio is 50:50, the process achieves more than 90% of both CH4 and CO2 conversion. Ee have already highlighted that for this composition, hydrogen production is the highest [80]. In the DMR case, the S/CO ratio does not affect the conversion of CH4 and CO2, as it is provided at WGS reactors to further convert CO into hydrogen.

4. Conclusions

Based on the comparative analysis of Steam Methane Reforming (SMR) and Dry Methane Reforming (DMR) applied to LFG, the following conclusions can be drawn.
In terms of CH4 and CO2 conversion, SMR shows significant improvements in methane conversion with higher S/C ratios, though this comes at the cost of reduced CO2 conversion. For example, at a 60:40 CH4 ratio, SMR achieves a methane conversion rate of up to 99.51% at an S/C ratio of 3, but CO2 conversion drops to 10.08%. On the other hand, DMR maintains high methane conversion rates, though slightly lower than SMR, while achieving nearly complete CO2 conversion, especially at the 60:40 CH4 ratio, where CO2 conversion reaches 99.01%.
Regarding hydrogen production, SMR consistently produces a higher hydrogen yield across different CH4 ratios (0.14–0.19 kgH2/Nm3), with the hydrogen output increasing as the S/C ratio rises. This makes SMR particularly effective for hydrogen production, especially when S/C ratios are optimized, with the highest yield observed at a 60:40 CH4 ratio. DMR, while stable in hydrogen yield, generally produces less hydrogen than SMR (0.104–0.136 kgH2/Nm3) and shows limited flexibility in scaling hydrogen production.
In terms of energy efficiency, SMR is more favorable with specific primary energy consumption in the range 0.048–0.075 MWh/kg of H2. Its specific heat and power requirements decrease as the S/C ratio increases, reaching optimal energy efficiency at a 40:60 CH4: CO2 ratio. This configuration has the lowest specific heat duty, making it the most energy-efficient choice among the SMR options. DMR, in contrast, shows little variation in heat and power requirements, resulting in higher specific primary energy demand, in the range of 0.072–0.079 MWh/kg of H2, which makes it less efficient overall.
From an environmental impact perspective, SMR shows that lower CO2 conversion at high S/C ratios may lead; however, the specific CO2 emissions per unit of hydrogen produced is lower (4.94–13.28 kgCO2/kgH2), thanks to higher achieved H2 specific production. DMR, even with higher CO2 conversion rates, still exhibits higher specific CO2 emissions (8.85–13.36 kg CO2/kg H2).
In conclusion, the choice SMR shows better performance than DMR for LFG reforming, in reference to the analysis criteria.
It is to be highlighted that the analysis has been carried out in reference to 1 Nm3 of feeding LFG and that the process requires an additional 1.4–2.1 Nm3 of LFG to provide the required energy. However, the effective comparison of the two processes, in term of environmental and economic sustainability, should be carried out in the future in a more comprehensive way by a Life Cycle Assessment (LCA) approach and cost analysis.

Supplementary Materials

The following supporting information can be downloaded at: https://www.mdpi.com/article/10.3390/en18102631/s1, Figure S1: H2, CO2, CH4 and CO concentration in the syngas vs. temperature, at fixed LFG composition (60:40), S/C ratio equal to 1 and pressure equal to 5 bar. SMR case; Figure S2: H2, CO2, CH4 and CO concentration in the syngas vs. temperature, at fixed LFG composition (60:40), S/C ratio equal to 1 and pressure equal to 5 bar. DMR case; Figure S3: H2, CO2, CH4 and CO concentration in the syngas vs. pressure, at fixed LFG composition (60:40), S/C ratio equal to 1 and temperature equal to 900 °C. SMR case; Figure S4: H2, CO2, CH4 and CO concentration in the syngas vs. pressure, at fixed LFG composition (60:40), S/C ratio equal to 1 and temperature equal to 900 °C. DMR case; Table S1: Comparison of simulation results and experimental results for SMR (T = 900 °C; P = 1 bar S/C ratio = 3; biogas composition CH4 (60%) and CO2(40%); Table S2: Comparison of simulation results and experimental results for DMR (T = 900 °C; P = 1 bar biogas composition CH4 (60%)and CO2 (40%); Table S3: Additional amount of landfill gas to be provided for energy for the process; Table S4: Specific primary energy consumption, specific heat and cooling duty; Table S5: Aspen flow sheet for stream results for SMR; Table S6: Aspen flow sheet for stream results for DMR.

Author Contributions

D.S.: Writing—original draft, writing—review and editing, data curation; P.S.: Supervision and review; L.L.: Conceptualization, methodology, supervision, review and editing, funding acquisition. All authors have read and agreed to the published version of the manuscript.

Funding

Dhruv Singh acknowledges the “LFGtoGreenH2” doctoral project for the grant during which this research was carried out (Bando Regione Lazio Avviso Pubblico “Intervento per il rafforzamento della ricerca e innovazione nel Lazio-incentivi per i dottorati di innovazione per le imprese e per al PA”-LR. 13/2008. Determinazione Dirigenziale n. G06899 8.06.2021).

Data Availability Statement

Additional data is available in Supplementary Materials and other data can be provided on request.

Acknowledgments

Lazio Region (IT) and IND.ECO s.r.l. (IT) are fully acknowledged for their financial support.

Conflicts of Interest

The authors declare no conflicts of interest.

References

  1. Madurai Elavarasan, R.; Pugazhendhi, R.; Irfan, M.; Mihet-Popa, L.; Khan, I.A.; Campana, P.E. State-of-the-Art Sustainable Approaches for Deeper Decarbonization in Europe—An Endowment to Climate Neutral Vision. Renew. Sustain. Energy Rev. 2022, 159, 112204. [Google Scholar] [CrossRef]
  2. Abd, A.A.; Othman, M.R.; Majdi, H.S.; Helwani, Z. Green Route for Biomethane and Hydrogen Production via Integration of Biogas Upgrading Using Pressure Swing Adsorption and Steam-Methane Reforming Process. Renew. Energy 2023, 210, 64–78. [Google Scholar] [CrossRef]
  3. De Laurentiis, V.; Biganzoli, F.; Valenzano, A.; Sala, S. Estimating Food Waste Generated and Packaging Placed on the Market at National Level; European Commission: Brussels, Belgium, 2024. [Google Scholar] [CrossRef]
  4. What a Waste 2.0. Available online: https://datatopics.worldbank.org/what-a-waste/ (accessed on 10 January 2025).
  5. Rapportorifiutiurbani_ed-2024_n406_versione_integrale. Available online: https://www.rinnovabili.it/wp-content/uploads/2024/12/rapportorifiutiurbani_ed-2024_n406_versione_integrale.pdf (accessed on 12 January 2025).
  6. Wei, Y.; Xu, W.; Chen, Y.; Peng, Y.; Ke, H.; Zhan, L.; Lan, J.; Li, H.; Zhang, Y. Evaluation of Greenhouse Gas Emission and Reduction Potential of High-Food-Waste-Content Municipal Solid Waste Landfills: A Case Study of a Landfill in the East of China. Waste Manag. 2024, 189, 290–299. [Google Scholar] [CrossRef] [PubMed]
  7. Council Directive 1999/31/EC of 26 April 1999 on the Landfill of Waste. Available online: https://eur-lex.europa.eu/legal-content/EN/TXT/PDF/?uri=CELEX:31999L0031 (accessed on 25 January 2025).
  8. DIRECTIVE 2008/98/EC OF THE EUROPEAN PARLIAMENT AND OF THE COUNCIL of 19 November 2008 on Waste and Repealing Certain Directives (Text with EEA Relevance). Available online: https://eur-lex.europa.eu/legal-content/EN/TXT/PDF/?uri=CELEX:32008L0098 (accessed on 1 February 2025).
  9. DIRECTIVE (EU) 2018/851 OF THE EUROPEAN PARLIAMENT AND OF THE COUNCIL of 30 May 2018 Amending Directive 2008/98/EC on Waste (Text with EEA Relevance). Available online: https://eur-lex.europa.eu/legal-content/EN/TXT/PDF/?uri=CELEX:32018L0851 (accessed on 21 February 2025).
  10. BIOGAS BAROMETER. Available online: https://www.eurobserv-er.org/biogas-barometer-2023/ (accessed on 21 February 2025).
  11. Mou, Z.; Scheutz, C.; Kjeldsen, P. Evaluation and Application of Site-Specific Data to Revise the First-Order Decay Model for Estimating Landfill Gas Generation and Emissions at Danish Landfills. J. Air Waste Manag. Assoc. 2015, 65, 686–698. [Google Scholar] [CrossRef]
  12. Verma, P.; Samanta, S.K. Overview of Biogas Reforming Technologies for Hydrogen Production: Advantages and Challenges. In Proceedings of the First International Conference on Recent Advances in Bioenergy Research; Springer: New Delhi, India, 2016; pp. 227–243. [Google Scholar]
  13. Nahar, G.; Mote, D.; Dupont, V. Hydrogen Production from Reforming of Biogas: Review of Technological Advances and an Indian Perspective. Renew. Sustain. Energy Rev. 2017, 76, 1032–1052. [Google Scholar] [CrossRef]
  14. Guo, X.M.; Trably, E.; Latrille, E.; Carrre, H.; Steyer, J.P. Hydrogen Production from Agricultural Waste by Dark Fermentation: A Review. Int. J. Hydrogen Energy 2010, 35, 10660–10673. [Google Scholar] [CrossRef]
  15. Jain, I.P. Hydrogen the Fuel for 21st Century. Int. J. Hydrogen Energy 2009, 34, 7368–7378. [Google Scholar] [CrossRef]
  16. Chun, Y.N.; Yang, Y.C.; Yoshikawa, K. Hydrogen Generation from Biogas Reforming Using a Gliding Arc Plasma-Catalyst Reformer. Catal. Today 2009, 148, 283–289. [Google Scholar] [CrossRef]
  17. Calbry-Muzyka, A.; Madi, H.; Rüsch-Pfund, F.; Gandiglio, M.; Biollaz, S. Biogas Composition from Agricultural Sources and Organic Fraction of Municipal Solid Waste. Renew. Energy 2022, 181, 1000–1007. [Google Scholar] [CrossRef]
  18. Wagner, J.-F.; Wagner, J.-F.; Rettenberger, G.; Reinert, P. Modern landfill technology-landfill behavior of mechanical-biological pre-treated waste. In Proceedings of the 11th International Waste Management and Landfill Symposium, S. Margherita di Pula-Cagliari, Sardinia, Italy, 1–5 October 2007. [Google Scholar]
  19. Borisova, D.; Kostadinova, G.; Petkov, G.; Dospatliev, L.; Ivanova, M.; Dermendzhieva, D.; Beev, G. Assessment of CH4 and CO2 Emissions from a Gas Collection System of a Regional Non-Hazardous Waste Landfill, Harmanli, Bulgaria, Using the Interrupted Time Series ARMA Model. Atmosphere 2023, 14, 1089. [Google Scholar] [CrossRef]
  20. Horikawa, M.S.; Rossi, F.; Gimenes, M.L.; Costa, C.M.M.; Da Silva, M.G.C. Chemical Absorption of H 2 S for Biogas Purification. Braz. J. Chem. Eng. 2004, 21, 415–422. [Google Scholar] [CrossRef]
  21. Özcan, M.D.; Özcan, O.; Akın, A.N. Effect of H2S on Oxidative Steam Reforming of Biogas for Syngas Production over MgAl-Supported Ni–Ce-Based Catalysts. Int. J. Hydrogen Energy 2025. [Google Scholar] [CrossRef]
  22. Dalpaz, R.; Konrad, O.; Cândido da Silva Cyrne, C.; Panis Barzotto, H.; Hasan, C.; Guerini Filho, M. Using Biogas for Energy Cogeneration: An Analysis of Electric and Thermal Energy Generation from Agro-Industrial Waste. Sustain. Energy Technol. Assess. 2020, 40, 100774. [Google Scholar] [CrossRef]
  23. Ardolino, F.; Cardamone, G.F.; Parrillo, F.; Arena, U. Biogas-to-Biomethane Upgrading: A Comparative Review and Assessment in a Life Cycle Perspective. Renew. Sustain. Energy Rev. 2021, 139, 110588. [Google Scholar] [CrossRef]
  24. Merkouri, L.P.; Ahmet, H.; Ramirez Reina, T.; Duyar, M.S. The Direct Synthesis of Dimethyl Ether (DME) from Landfill Gas: A Techno-Economic Investigation. Fuel 2022, 319, 123741. [Google Scholar] [CrossRef]
  25. Lin, H.; Zhang, M.H.; Singh Chauhan, B.; Elsiddieg, A.M.A.; Abdelghany Elkotb, M.; Zhu, P.; Tian, R.; Abouelela, M. Comprehensive Analysis of a Novel Power and Methanol Coproduction Process Using Landfill Gas Reforming and Renewable Hydrogen Generation by an Alkaline Electrolyzer. J. Clean. Prod. 2023, 418, 138131. [Google Scholar] [CrossRef]
  26. Singh, D.; Sirini, P.; Lombardi, L. Review of Reforming Processes for the Production of Green Hydrogen from Landfill Gas. Energies 2024, 18, 15. [Google Scholar] [CrossRef]
  27. Taherian, Z.; Khataee, A.; Han, N.; Orooji, Y. Hydrogen Production through Methane Reforming Processes Using Promoted-Ni/Mesoporous Silica: A Review. J. Ind. Eng. Chem. 2022, 107, 20–30. [Google Scholar] [CrossRef]
  28. González, J.F.; Álvez-Medina, C.M.; Nogales-Delgado, S. Biogas Steam Reforming in Wastewater Treatment Plants: Opportunities and Challenges. Energies 2023, 16, 6343. [Google Scholar] [CrossRef]
  29. Armor, J.N. The Multiple Roles for Catalysis in the Production of H2. Appl. Catal. A Gen. 1999, 176, 159–176. [Google Scholar] [CrossRef]
  30. Huang, Y.; Yan, C.F.; Guo, C.Q.; Lu, Z.X.; Shi, Y.; Wang, Z.D. Synthesis of GO-Modified Cu2O Nanosphere and the Photocatalytic Mechanism of Water Splitting for Hydrogen Production. Int. J. Hydrogen Energy 2017, 85, 4007–4016. [Google Scholar] [CrossRef]
  31. Chen, S.; Liu, J.; Zhang, Q.; Teng, F.; McLellan, B.C. A Critical Review on Deployment Planning and Risk Analysis of Carbon Capture, Utilization, and Storage (CCUS) toward Carbon Neutrality. Renew. Sustain. Energy Rev. 2022, 167, 112537. [Google Scholar] [CrossRef]
  32. Wodołażski, A.; Magdziarczyk, M.; Smoliński, A. Techno-Economic Analysis of Hydrogen Production from Swine Manure Biogas via Steam Reforming in Pilot-Scale Installation. Energies 2023, 16, 6389. [Google Scholar] [CrossRef]
  33. Full, J.; Hohmann, S.; Ziehn, S.; Gamero, E.; Schließ, T.; Schmid, H.P.; Miehe, R.; Sauer, A. Perspectives of Biogas Plants as BECCS Facilities: A Comparative Analysis of Biomethane vs. Biohydrogen Production with Carbon Capture and Storage or Use (CCS/CCU). Energies 2023, 16, 5066. [Google Scholar] [CrossRef]
  34. Barelli, L.; Bidini, G.; Gallorini, F.; Servili, S. Hydrogen Production through Sorption-Enhanced Steam Methane Reforming and Membrane Technology: A Review. Energy 2008, 33, 554–570. [Google Scholar] [CrossRef]
  35. Carapellucci, R.; Giordano, L. Steam, Dry and Autothermal Methane Reforming for Hydrogen Production: A Thermodynamic Equilibrium Analysis. J. Power Sources 2020, 469, 228391. [Google Scholar] [CrossRef]
  36. Usman, M.; Wan Daud, W.M.A.; Abbas, H.F. Dry Reforming of Methane: Influence of Process Parameters—A Review. Renew. Sustain. Energy Rev. 2015, 45, 710–744. [Google Scholar] [CrossRef]
  37. Zhu, J.; Zhang, D.; King, K.D. Reforming of CH4 by Partial Oxidation: Thermodynamic and Kinetic Analyses. Fuel 2001, 80, 899–905. [Google Scholar] [CrossRef]
  38. Boscherini, M.; Storione, A.; Minelli, M.; Miccio, F.; Doghieri, F. New Perspectives on Catalytic Hydrogen Production by the Reforming, Partial Oxidation and Decomposition of Methane and Biogas. Energies 2023, 16, 6375. [Google Scholar] [CrossRef]
  39. Galvagno, A.; Chiodo, V.; Urbani, F.; Freni, F. Biogas as Hydrogen Source for Fuel Cell Applications. Int. J. Hydrogen Energy 2013, 38, 3913–3920. [Google Scholar] [CrossRef]
  40. Deng, R.; Wu, J.; Huang, Z.; Feng, Z.; Hu, W.; Tang, Y.; Tan, H.; Zhang, H.; Zairov, R.; Pan, Z. Biogas to Chemicals: A Review of the State-of-the-Art Conversion Processes. Biomass Convers. Biorefin 2024, 1–21. [Google Scholar] [CrossRef]
  41. Zou, C.; Li, J.; Zhang, X.; Jin, X.; Xiong, B.; Yu, H.; Liu, X.; Wang, S.; Li, Y.; Zhang, L.; et al. Industrial Status, Technological Progress, Challenges, and Prospects of Hydrogen Energy. Nat. Gas Ind. B 2022, 9, 427–447. [Google Scholar] [CrossRef]
  42. Cormos, C.C. Techno-Economic and Environmental Assessment of Green Hydrogen Production via Biogas Reforming with Membrane-Based CO2 Capture. Int. J. Hydrogen Energy 2025, 101, 702–711. [Google Scholar] [CrossRef]
  43. Katebah, M.; Al-Rawashdeh, M.; Linke, P. Analysis of Hydrogen Production Costs in Steam-Methane Reforming Considering Integration with Electrolysis and CO2 Capture. Clean. Eng. Technol. 2022, 10, 100552. [Google Scholar] [CrossRef]
  44. Fedorov, M.; Maslikov, V.; Korablev, V.; Politaeva, N.; Chusov, A.; Molodtsov, D. Production of Biohydrogen from Organ-Containing Waste for Use in Fuel Cells. Energies 2022, 15, 8019. [Google Scholar] [CrossRef]
  45. Pajak, M.; Brus, G.; Kimijima, S.; Szmyd, J.S. Enhancing Hydrogen Production from Biogas through Catalyst Rearrangements. Energies 2023, 16, 4058. [Google Scholar] [CrossRef]
  46. Wilhelm, D.J.; Simbeck, D.R.; Karp, A.D.; Dickenson, R.L. Syngas Production for Gas-to-Liquids Applications: Technologies, Issues and Outlook. Fuel Process. Technol. 2001, 71, 139–148. [Google Scholar] [CrossRef]
  47. Gangadharan, P.; Kanchi, K.C.; Lou, H.H. Evaluation of the Economic and Environmental Impact of Combining Dry Reforming with Steam Reforming of Methane. Chem. Eng. Res. Des. 2012, 90, 1956–1968. [Google Scholar] [CrossRef]
  48. Tabarkhoon, F.; Rezaei, M.; Alavi, S.M. Structure-Activity Relationships in NiO–MgO Solid Solution Catalysts for Biogas Dry Reforming. Int. J. Hydrogen Energy 2025, 126, 346–358. [Google Scholar] [CrossRef]
  49. Nishimura, A.; Yamada, S.; Ichii, R.; Ichikawa, M.; Hayakawa, T.; Kolhe, M.L. Hydrogen Yield Enhancement in Biogas Dry Reforming with a Ni/Cr Catalyst: A Numerical Study. Energies 2024, 17, 5421. [Google Scholar] [CrossRef]
  50. Xanthopoulou, G.; Varitis, S.; Zhumabek, M.; Karanasios, K.; Vekinis, G.; Tungatarova, S.A.; Baizhumanova, T.S. Direct Reduction in Greenhouse Gases by Continuous Dry (CO2) Reforming of Methane over Ni-Containing Shs Catalysts. Energies 2021, 14, 6078. [Google Scholar] [CrossRef]
  51. Le Saché, E.; Johnson, S.; Pastor-Pérez, L.; Horri, B.A.; Reina, T.R. Biogas Upgrading via Dry Reforming over a Ni-Sn/CeO2-Al2O3 Catalyst: Influence of the Biogas Source. Energies 2019, 12, 1007. [Google Scholar] [CrossRef]
  52. Kong, F.; Swift, J.; Zhang, Q.; Fan, L.S.; Tong, A. Biogas to H2 Conversion with CO2 Capture Using Chemical Looping Technology: Process Simulation and Comparison to Conventional Reforming Processes. Fuel 2020, 279, 118479. [Google Scholar] [CrossRef]
  53. Hajizadeh, A.; Mohamadi-Baghmolaei, M.; Cata Saady, N.M.; Zendehboudi, S. Hydrogen Production from Biomass through Integration of Anaerobic Digestion and Biogas Dry Reforming. Appl. Energy 2022, 309, 118442. [Google Scholar] [CrossRef]
  54. Minh, D.P.; Siang, T.J.; Vo, D.V.N.; Phan, T.S.; Ridart, C.; Nzihou, A.; Grouset, D. Hydrogen Production From Biogas Reforming: An Overview of Steam Reforming, Dry Reforming, Dual Reforming, and Tri-Reforming of Methane. Hydrog. Supply Chain Des. Deploy. Oper. 2018, 111–166. [Google Scholar] [CrossRef]
  55. Balat, M. Possible Methods for Hydrogen Production. Energy Sources Part A Recovery Util. Environ. Eff. 2008, 31, 39–50. [Google Scholar] [CrossRef]
  56. El Hajj Chehade, A.M.; Daher, E.A.; Assaf, J.C.; Riachi, B.; Hamd, W. Simulation and Optimization of Hydrogen Production by Steam Reforming of Natural Gas for Refining and Petrochemical Demands in Lebanon. Int. J. Hydrogen Energy 2020, 45, 33235–33247. [Google Scholar] [CrossRef]
  57. Montenegro Camacho, Y.S.; Bensaid, S.; Lorentzou, S.; Vlachos, N.; Pantoleontos, G.; Konstandopoulos, A.; Luneau, M.; Meunier, F.C.; Guilhaume, N.; Schuurman, Y.; et al. Development of a Robust and Efficient Biogas Processor for Hydrogen Production. Part 1: Modelling and Simulation. Int. J. Hydrogen Energy 2017, 42, 22841–22855. [Google Scholar] [CrossRef]
  58. Tamilselvan, R.; Selwynraj, A.I. Model Development for Biogas Generation, Purification and Hydrogen Production via Steam Methane Reforming. Int. J. Hydrogen Energy 2024, 50, 211–225. [Google Scholar] [CrossRef]
  59. Di Marcoberardino, G.; Vitali, D.; Spinelli, F.; Binotti, M.; Manzolini, G. Green Hydrogen Production from Raw Biogas: A Techno-Economic Investigation of Conventional Processes Using Pressure Swing Adsorption Unit. Processes 2018, 6, 19. [Google Scholar] [CrossRef]
  60. Phan, T.S.; Pham Minh, D.; Espitalier, F.; Nzihou, A.; Grouset, D. Hydrogen Production from Biogas: Process Optimization Using ASPEN Plus®. Int. J. Hydrogen Energy 2022, 47, 42027–42039. [Google Scholar] [CrossRef]
  61. Nam, S.; Hur, K.-B.; Lee, N.-H. Effects of Hydrogen Sulfide and Siloxane on Landfill Utility Facilities. Environ. Eng. Res. 2011, 16, 159–164. [Google Scholar] [CrossRef]
  62. Chattanathan, S.A.; Adhikari, S.; McVey, M.; Fasina, O. Hydrogen Production from Biogas Reforming and the Effect of H2S on CH4 Conversion. Int. J. Hydrogen Energy 2014, 39, 19905–19911. [Google Scholar] [CrossRef]
  63. Soltani, R.; Rosen, M.A.; Dincer, I. Assessment of CO2 Capture Options from Various Points in Steam Methane Reforming for Hydrogen Production. Int. J. Hydrogen Energy 2014, 39, 20266–20275. [Google Scholar] [CrossRef]
  64. Cipitì, F.; Barbera, O.; Briguglio, N.; Giacoppo, G.; Italiano, C.; Vita, A. Design of a Biogas Steam Reforming Reactor: A Modelling and Experimental Approach. Int. J. Hydrogen Energy 2016, 41, 11577–11583. [Google Scholar] [CrossRef]
  65. Cruz, P.L.; Navas-Anguita, Z.; Iribarren, D.; Dufour, J. Exergy Analysis of Hydrogen Production via Biogas Dry Reforming. Int. J. Hydrogen Energy 2018, 43, 11688–11695. [Google Scholar] [CrossRef]
  66. Rosha, P.; Mohapatra, S.K.; Mahla, S.K.; Dhir, A. Catalytic Reforming of Synthetic Biogas for Hydrogen Enrichment over Ni Supported on ZnOCeO2 Mixed Catalyst. Biomass Bioenergy 2019, 125, 70–78. [Google Scholar] [CrossRef]
  67. Wylock, C.E.; Budzianowski, W.M. Performance Evaluation of Biogas Upgrading by Pressurized Water Scrubbing via Modelling and Simulation. Chem. Eng. Sci. 2017, 170, 639–652. [Google Scholar] [CrossRef]
  68. Lou, X.F.; Nair, J. The impact of landfilling and composting on greenhouse gas emissions–a review. Bioresour. Technol. 2009, 100, 3792–3798. [Google Scholar] [CrossRef]
  69. Liu, W.; Zhang, Z.; Xie, X.; Yu, Z.; von Gadow, K.; Xu, J.; Zhao, S.; Yang, Y. Analysis of the Global Warming Potential of Biogenic CO2 Emission in Life Cycle Assessments. Sci. Rep. 2017, 7, 39857. [Google Scholar] [CrossRef]
  70. Shen, Z.; Nabavi, S.A.; Clough, P.T. Intrinsic Kinetics of Steam Methane Reforming over a Monolithic Nickel Catalyst in a Fixed Bed Reactor System. Chem. Eng. Sci. 2024, 299, 120482. [Google Scholar] [CrossRef]
  71. El-Bousiffi, M.A.; Gunn, D.J. A Dynamic Study of Steam-Methane Reforming. Int. J. Heat. Mass. Transf. 2007, 50, 723–733. [Google Scholar] [CrossRef]
  72. Pashchenko, D. Experimental Investigation of Synthesis Gas Production by Methane Reforming with Flue Gas over a NiO-Al2O3 Catalyst: Reforming Characteristics and Pressure Drop. Int. J. Hydrogen Energy 2019, 44, 7073–7082. [Google Scholar] [CrossRef]
  73. Kumar, R.; Kumar, A.; Pal, A. Simulation Modelling of Hydrogen Production from Steam Reforming of Methane and Biogas. Fuel 2024, 362, 130742. [Google Scholar] [CrossRef]
  74. Contreras Bilbao, D.; Blanco Machin, E.; Travieso Pedroso, D. Operating Parameters’ Influence on Hydrogen Production Performance in Microwave-Induced Plasma. Int. J. Hydrogen Energy 2024, 80, 956–979. [Google Scholar] [CrossRef]
  75. Antzara, A.; Heracleous, E.; Bukur, D.B.; Lemonidou, A.A. Thermodynamic Analysis of Hydrogen Production via Chemical Looping Steam Methane Reforming Coupled with in Situ CO2 Capture. Int. J. Greenh. Gas. Control 2015, 32, 115–128. [Google Scholar] [CrossRef]
  76. Serrano-Lotina, A.; Daza, L. Influence of the Operating Parameters over Dry Reforming of Methane to Syngas. Int. J. Hydrogen Energy 2014, 39, 4089–4094. [Google Scholar] [CrossRef]
  77. Chouhan, K.; Sinha, S.; Kumar, S.; Kumar, S. Simulation of Steam Reforming of Biogas in an Industrial Reformer for Hydrogen Production. Int. J. Hydrogen Energy 2021, 46, 26809–26824. [Google Scholar] [CrossRef]
  78. le Saché, E.; Alvarez Moreno, A.; Reina, T.R. Biogas Conversion to Syngas Using Advanced Ni-Promoted Pyrochlore Catalysts: Effect of the CH4/CO2 Ratio. Front. Chem. 2021, 9, 672419. [Google Scholar] [CrossRef]
  79. Zhu, X.; Li, K.; Liu, J.L.; Li, X.S.; Zhu, A.M. Effect of CO2/CH4 Ratio on Biogas Reforming with Added O2 through an Unique Spark-Shade Plasma. Int. J. Hydrogen Energy 2014, 39, 13902–13908. [Google Scholar] [CrossRef]
  80. Wang, S.; Wang, Y.; Yao, L.; Hu, C. Temperature Hysteresis in Dry Reforming of Methane on Ni/SBA-15 Catalyst: Low Temperature Activity Originated from the Synergy of Ni0 and Carbon Nanotubes. Appl. Catal. B Environ. Energy 2023, 333, 122756. [Google Scholar] [CrossRef]
Figure 1. Aspen flow sheet for SMR process.
Energies 18 02631 g001
Figure 2. Aspen flow sheet for DMR process.
Energies 18 02631 g002
Figure 3. Specific hydrogen production with respect to different LFG compositions and S/C ratio in SMR process; temperature 900 °C, pressure 5 bar. S/C1 = 1, S/C2 = 2, S/C3 = 3.
Energies 18 02631 g003
Figure 4. Specific hydrogen production with respect to different LFG compositions and S/CO ratio, at the WGS, in DMR process; temperature 900 °C, pressure 5 bar. S/CO–0.5 = 0.5 = 1, S/CO–1 = 1, S/CO–1.5 = 1.5.
Energies 18 02631 g004
Figure 5. CO2 production with respect to different LFG compositions and S/C ratio in SMR process; temperature 900 °C, pressure 5 bar. S/C1 = 1, S/C2 = 2, S/C3 = 3.
Energies 18 02631 g005
Figure 6. CO2 production with respect to different LFG compositions in DMR process; temperature 900 °C, pressure 5 bar. S/CO–0.5 = 0.5 = 1, S/CO–1 = 1, S/CO–1.5 = 1.5.
Energies 18 02631 g006
Figure 7. Specific primary energy per kg H2 production for SMR process, for different LFG compositions, vs. S/C ratio. Temperature 900 °C, pressure 5 bar.
Energies 18 02631 g007
Figure 8. Specific primary energy per kg H2 production for DMR process, for different LFG compositions, vs. different S/CO ratio at WGS reaction. Temperature 900 °C, pressure 5 bar.
Energies 18 02631 g008
Table 1. Operating conditions assumed for preliminary and second-step simulations.
Preliminary Simulations (SMR and DMR)
SimulationLFG CompositionTemperaturePressureS/C or S/CO ratio
CH4CO2°Cbar
Temperature analysis6040500–100051
Pressure analysis60409000–501
Second-step simulations
LFG CompositionTemperaturePressureS/C ratio
SMRCH4CO2[°C][bar]
604090051, 2, 3
505090051, 2, 3
406090051, 2, 3
LFG CompositionTemperaturePressureS/CO ratio
DMRCH4CO2[°C][bar]
604090050.5, 1, 1.5
505090050.5, 1, 1.5
406090050.5, 1, 1.5
Table 2. Type of reactor and input specifications of different units used in SMR and DMR simulations (second step).
Unit in Aspen PlusModuleSMR SpecificationDMR Specification
ReformerRgibbsOperating temperature: 900 °COperating temperature: 900 °C
Operating pressure: 5 barOperating pressure: 5 bar
HTWGSREquilOperating temperature: 350 °COperating temperature: 350 °C
Operating pressure: 5 barOperating pressure: 5 bar
LTWGSREquilOperating temperature: 250 °COperating temperature: 250 °C
Operating pressure: 5 barOperating pressure: 5 bar
AbsorberRadFracCondenser pressure: 4 barCondenser pressure: 4 bar
No of stages: 4No of stages: 4
StripperRadFracOperating pressure: 1 barOperating pressure: 1 bar
No of stages: 3No of stages: 3
CompcomprDischarge pressure: 5 barDischarge pressure: 5 bar
efficiency: 0.85efficiency: 0.85
PUMP1pumpDischarge pressure: 5 barDischarge pressure: 5 bar
efficiency: 0.85efficiency: 0.85
PUMP2pumpDischarge pressure: 5 barDischarge pressure: 5 bar
efficiency: 0.85efficiency: 0.85
COOL1CoolerOperating temperature: 350 °COperating temperature: 350 °C
Operating pressure: 5 barOperating pressure: 5 bar
COOL2CoolerOperating temperature: 250 °COperating temperature: 250 °C
Operating pressure: 5 barOperating pressure: 5 bar
COOL3CoolerOperating temperature: 40 °COperating temperature: 40 °C
Operating pressure: 5 barOperating pressure: 5 bar
HX1HeatXHot Outlet cold inlet temperature difference:
86 °C
Hot Outlet cold inlet temperature difference: 165 °C
HX2HeatXHot Outlet cold inlet temperature difference: 103 °CHot Outlet cold inlet temperature difference: 39 °C
HX3HeatXHot Outlet cold inlet temperature difference: 210 °CHot Outlet cold inlet temperature difference: 101 °C
HX4HeatXHot Outlet cold inlet temperature difference:
25 °C
Hot Outlet cold inlet temperature difference: 536 °C
HX5HeatXHot Outlet cold inlet temperature difference:
25 °C
Hot Outlet cold inlet temperature difference: 25 °C
Table 3. CH4 and CO2 conversion with respect to different biogas/LFG composition at various S/C ratios for SMR and different S/CO ratios for DMR at WGS reactor.
ProcessCH4:CO2S/C RatioCH4 Conv.CO2 Conv.
SMR60–40196.5466.96
60–40298.9357.33
60–40399.5110.08
50–50197.9363.48
50–50299.2039.78
50–50399.6022.16
40–60199.3073.34
40–60299.4741.27
40–60399.7028.48
DMRCH4:CO2S/CO ratioCH4 conv.CO2 conv.
60–400.579.6999.01
60–40179.6999.01
60–401.579.6999.01
50–500.592.6996.61
50–50192.6996.61
50–501.592.6996.61
40–600.598.0989.75
40–60198.0989.75
40–601.598.0989.75
Disclaimer/Publisher’s Note: The statements, opinions and data contained in all publications are solely those of the individual author(s) and contributor(s) and not of MDPI and/or the editor(s). MDPI and/or the editor(s) disclaim responsibility for any injury to people or property resulting from any ideas, methods, instructions or products referred to in the content.

