Article

Enhancing Fairness and Efficiency in PV Energy Curtailment: The Role of East–West-Facing Bifacial Installations in Radial Distribution Networks

by
Francis Maina Itote
1,*,
Ryuto Shigenobu
2,
Akiko Takahashi
3,
Masakazu Ito
2 and
Ghjuvan Antone Faggianelli
4,*
1
Advanced Interdisciplinary Science and Technology, Graduate School of Engineering, University of Fukui, Fukui 910-8507, Japan
2
Department of Electrical and Electronics Engineering, Faculty of Engineering, University of Fukui, Fukui 910-8507, Japan
3
Faculty of Basic and Generic Researches, University of Fukui, Fukui 910-8507, Japan
4
Science for Environment Laboratory, CNRS UMR SPE 6134, University of Corsica, 20000 Ajaccio, France
*
Authors to whom correspondence should be addressed.
Energies 2025, 18(10), 2630; https://doi.org/10.3390/en18102630
Submission received: 30 April 2025 / Revised: 11 May 2025 / Accepted: 16 May 2025 / Published: 20 May 2025

Abstract

:
Electricity market reforms and decreasing technology costs have propelled residential solar PV growth leading distribution network operators to face operational challenges including reverse power flows and voltage regulation during peak solar generation. Traditional mono-facial south-facing PV systems concentrate production at midday when demand may be low, leading to high curtailment, especially for downstream households. This study proposes vertically installed east–west-facing bifacial PV systems (BiE and BiW), characterized by two energy peaks (morning and evening), which are better aligned with residential demand and alleviate grid constraints. Using load flow simulations, the performance of vertical bifacial configurations was compared against mono-facial systems across PV capacities from 1 to 20 kW. Fairness in curtailment was evaluated at 10 kW using Jain’s fairness index, the Gini index, and the Curtailment index. Simulation results show that BiE and BiW installations, especially at higher capacities, not only generate more energy but also are better at managing curtailment. At 10 kW, BiE and BiW increased bid energies by 815 kWh and 787 kWh, and reduced curtailed energy by 1566 kWh and 1499 kWh, respectively. These findings highlight the potential of bifacial PV installations in mitigating curtailment and improving fairness in energy distribution, supporting the demand for residential PV systems.

1. Introduction

The integration of solar-powered resources into power systems has increased worldwide in recent years. The cumulative solar capacity worldwide was approximately 1.2 TW (1185 GW) by 2022, up by 30% compared to 2021 levels, as the solar industry added 240 GW of new capacity, representing a 37% annual growth in PV installations [1]. Looking ahead, projections for 2027 forecast a solar market expansion to 3.5 TW of total operating capacity. This growth is attributed to several factors, with key drivers including the cost-competitiveness of solar-based sources, which facilitates both individual energy self-sufficiency and the comparatively quick deployment of utility-scale projects at low costs. Additionally, the continued restructuring of electricity markets, including feed-in tariffs (FITs) and feed-in premiums (FIPs), has promoted the effective selling of solar power. Hence, the business model of energy aggregation is gaining momentum where households can engage in contractual agreements with aggregators to trade surplus solar energy.
However, increased integration of photovoltaic systems in the distribution grids introduces operation and control challenges for power networks. Specifically, PV systems can generate reverse power flows and contribute to voltage rises resulting in overvoltage limit violations in distribution grids, especially during peak solar production hours around midday [2,3,4]. In response to this challenge, Distribution Network Operators (DNOs) curtail photovoltaic (PV) energy production to mitigate these violations, given the fact that networks are constrained by transmission line capacity and voltage limits. As such, aggregators encounter challenges in correctly determining bid volumes for energy markets, resulting in financial losses incurred due to penalties by market or grid operators due to supply–bid imbalances. Furthermore, households’ potential earnings are reduced due to energy curtailment, which prevents them from fully utilizing their excess PV energy [5,6,7]. Consequently, integrating PV systems into power grids requires suitable methods for balancing economic and operational demands on power networks.
To mitigate voltage violations, a number of strategies have been suggested by authors. Firstly, the utilization of inverters with droop control (Volt/VAR and Volt/Watt) as presented in [8,9,10] leads to greater curtailment for downstream buses in radial distribution feeders [2,11,12]. This unfairly impacts remote households, necessitating a review of fairness in PV curtailment in distribution networks. To realize fairness, DNOs set static export limits during the initial connection of PV systems considering worst-case scenarios [13,14,15,16]. However, these limits restrict the PV contribution from households in areas with either low PV penetration or in robust networks, especially during periods of minimal load. As a result, there is growing advocacy for the implementation of flexible export limits based on network conditions [17,18,19].
Fairness in PV energy curtailment is critical to maintain equity among residential energy market participants. Unfair curtailment, particularly for houses at the end of distribution lines, not only lowers their economic return but also has the potential to undermine public support for solar energy adoption [20,21]. While minimizing total curtailment is often considered as the primary goal of distribution system operation, this approach may overlook fairness concerns and the significance of long-term public support. A fair distribution of curtailment guarantees that no single household is disproportionately affected, which is important in sustaining public trust and long-term adoption of PV systems. Various optimal power flow (OPF) schemes have been developed to ensure fair curtailment. For example, the authors in [2] created three optimal power flow (OPF) schemes each with a distinct focus: PV harvesting, energy export, and financial benefits. Similarly, in [22], the authors suggested a distributed optimal power flow (DOPF) method for DER coordination that incorporates three equity principles: egalitarian, proportionate, and uniform dynamic PV curtailment redistribution. While these approaches can encourage fairness within their given frameworks, they may not fully resolve the trade-offs between fairness and system performance. As a result, the most appropriate fairness indicator is determined by the decision makers’ specific aims and constraints. Given the diversity of needs in modern distribution networks, it is necessary to develop multifaceted approaches that ensure both operational efficiency and fairness in curtailment.
In parallel with control-based strategies, recent studies have explored how physical system design (particularly PV orientation) affects not only generation performance but also curtailment dynamics. One of the greatest challenges in managing PV energy curtailment is the mismatch between peak solar power and network demand. Traditional mono-facial PV systems generate the most power at midday, which is generally the period when the grid is most constrained. As a consequence, energy curtailment is concentrated during these hours, resulting in significant PV energy loss. Vertically installed east–west-facing bifacial PV systems have emerged as a promising architectural alternative.
Bifacial PV modules absorb sunlight from both the front and rear sides, shifting generation to morning and evening hours when demand is typically higher and grid constraints are less severe, thereby reducing the requirement for curtailment during midday peak hours. For instance, recent empirical studies have demonstrated that vertically mounted east–west bifacial installations can have installation efficiencies near those of conventional south-facing installations, due to their favorable angle-of-incidence characteristics that optimize solar irradiance collection in the morning and late afternoon [23]. This solves the issue of midday curtailment very effectively and offers a good way of reducing peak time overvoltages and energy losses. Figure 1 illustrates the differences in energy output between mono-facial and vertical sets of east–west-facing bifacial PV panels, emphasizing the ability of bifacial systems to align generation with demand. Similarly, the authors in [24] demonstrated that east–west vertically mounted bifacial PV systems had higher specific yields comparable to traditional south-facing systems but with the additional spatial and aesthetic benefits, which are especially valuable for urban green roofs. In addition, the modelling results given in [25] suggested that vertical east–west-oriented modules could outperform conventional setups, based on design specifications, curtailment strategies, and local electricity market prices.
This study proposes the installation of vertical east–west-facing bifacial PV modules for residential systems as a novel approach to simultaneously minimize curtailment and enhance fairness in distribution networks While previous studies have established that vertically mounted east–west bifacial PV systems have the potential to increase energy yield distribution and spatial efficiency, they have largely overlooked the impact of such architectural configurations on fairness in curtailment distribution across network users. This work addresses that gap by examining the influence of vertical bifacial PV orientation on both operational performance and equitable curtailment allocation under radial distribution network conditions. Through the utilization of time-shifted generation characteristics as shown in Figure 1, this study incorporates fairness metrics into network models to provide new insights into the manner in which design choices can improve technical performance and fairness in distribution networks.
The installation of vertical sets of east–west-facing bifacial PV modules is not only relevant in terms of improving distribution network operation performance and fairness in energy curtailment, but it will also improve economic returns for households, given that residential PV installations are likely to rise more in the future. Referring to Figure 2, Japan leads in solar PV installation capacity per land area among major countries, with a capacity twice that of Germany for flat land installations [26]. However, Japan’s capacity for further solar generation on flat land becomes increasingly difficult due to geographic and urban constraints [27,28]. Therefore, not only roof-top PV but also innovative approaches such as wall-mounted PV systems on east-facing and west-facing walls, along with vertical bifacial installations, are essential to maximize solar generation [29]. These systems are particularly promising for deployment on roof-top fences and ground-installed fences around buildings, where space constraints can be mitigated by their vertical configuration. Additionally, they can play a significant role in agrivoltaics, where they can coexist with agricultural activities such as pasturage to enhance land-use efficiency while generating PV energy [30,31,32].
To evaluate how the installation of vertical east–west bifacial PV affects curtailment dynamics in terms of fairness, three key metrics are used: Jain’s fairness index, the Gini index, and the Curtailment index. These metrics assess how equitably curtailment is distributed among households, offering a comprehensive understanding of the trade-offs between fairness and curtailment efficiency. To assess the effectiveness of these bifacial installations, this study compares energy output with mono-facial south-facing PV installations at various capacity levels (1–20 kW). Fairness metrics are employed at a 10 kW PV capacity to quantify and evaluate curtailment distribution.
The rest of this paper is structured as follows: Section 2 discusses vertical bifacial modules and the irradiance calculation model used to calculate the power output from both bifacial and mono-facial installations. Section 3 describes the model for calculating curtailed energy as well as the metrics used to assess fairness in PV energy curtailment. Section 4 describes the simulation conditions and case studies. Section 5 presents the simulation results, whereas Section 6 presents the study’s conclusions.

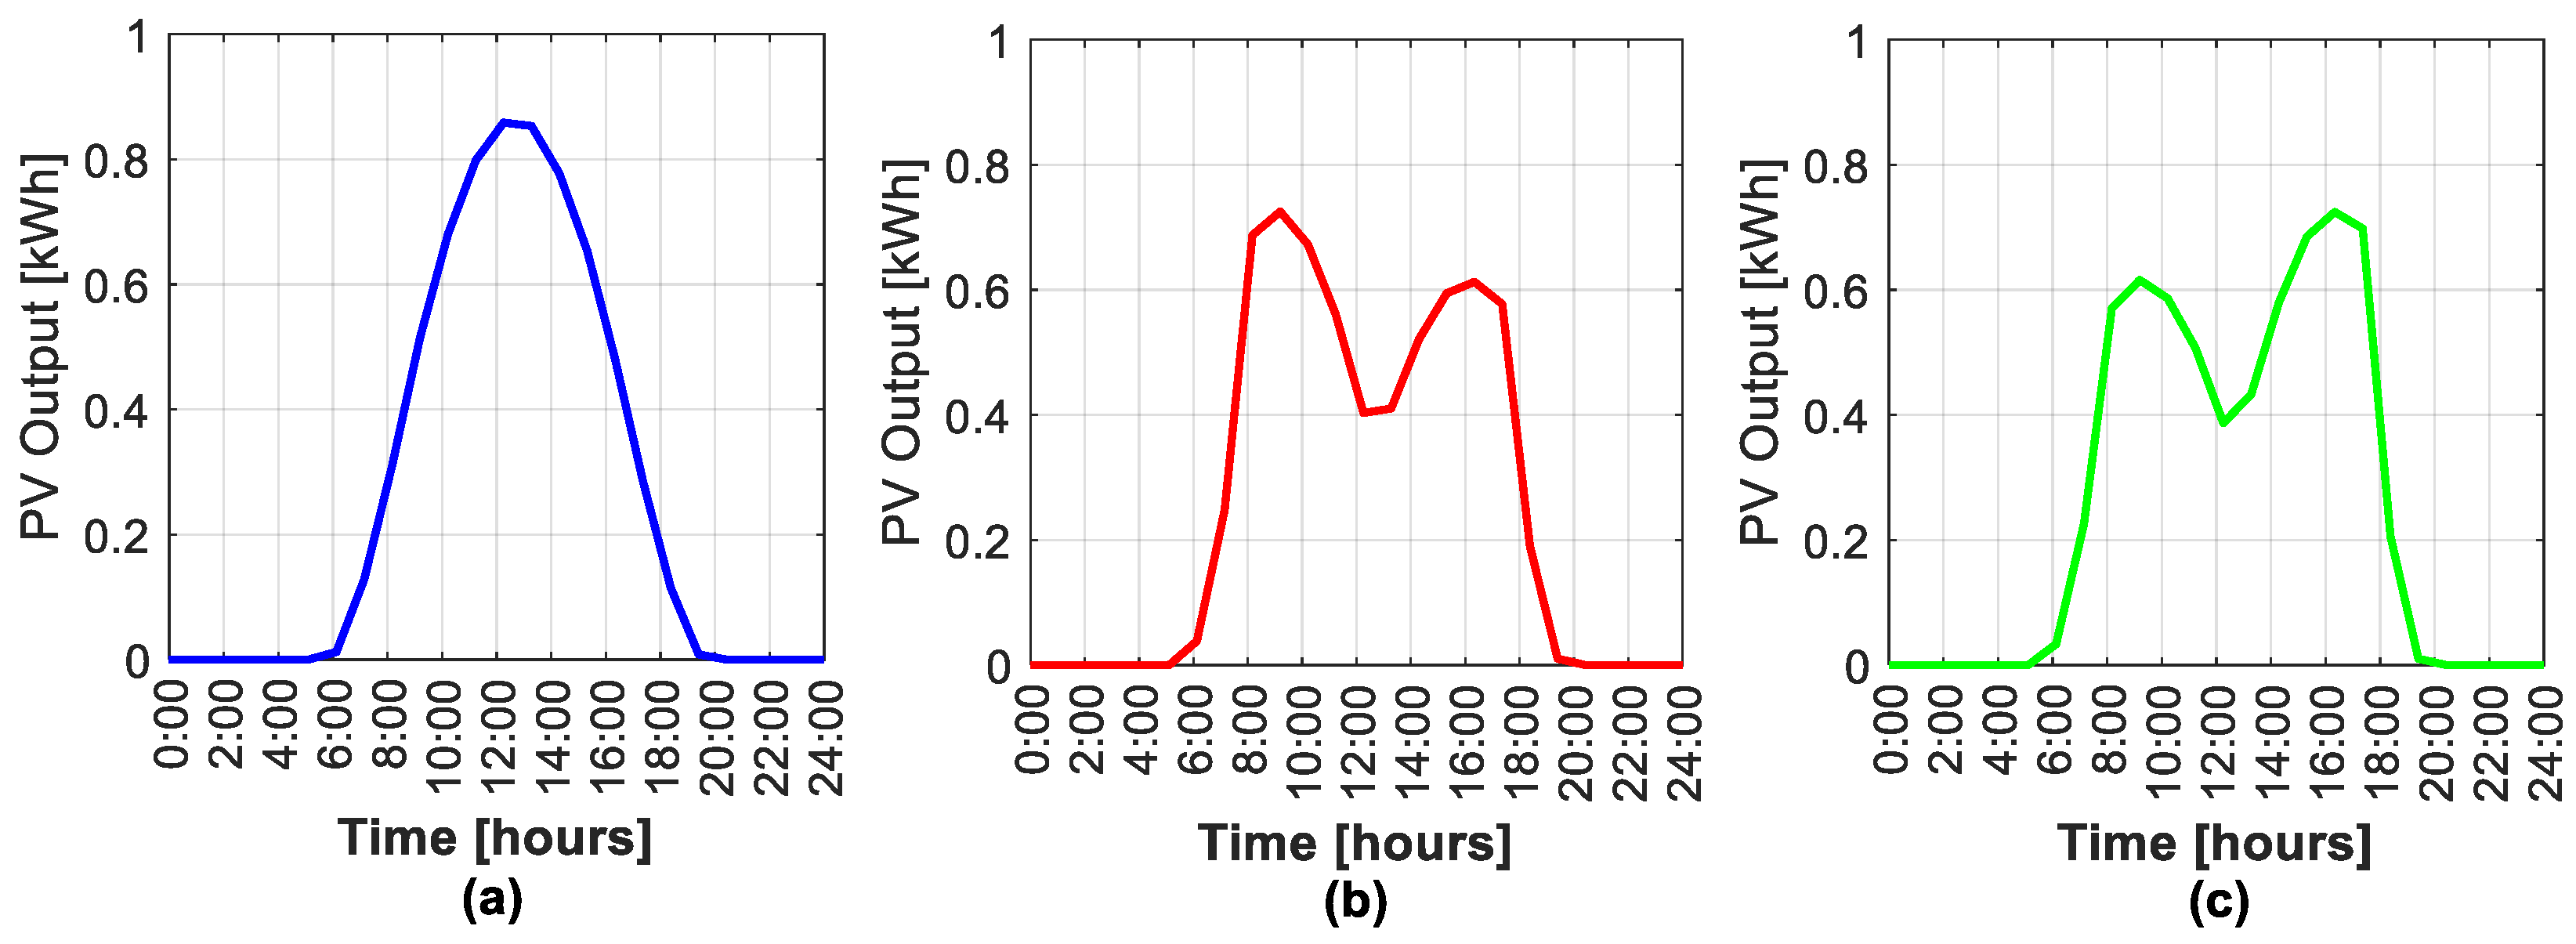
2. Vertical Bifacial Modules

Vertical bifacial PV modules offer versatility and adaptability in various installation scenarios, making them particularly suitable for applications where space is limited or traditional horizontal installations are impractical. Their design flexibility enables integration in buildings, expanding possibilities for solar energy deployment in urban environments.

Irradiance Calculation Model

This study considers east–west-facing bifacial PV installations (BiE and BiW) characterized by two power peaks during morning and evening periods due to their vertical installation orientation (90 degrees tilt angle). According to [33,34], the global irradiance, G T f , on the front side of a tilted surface is estimated from transposition models that assume the form
G T f = G C + G D + G R ,
where G c , G D , and G R represent direct, diffused, and reflected irradiance. This study assumed the isotropic sky model to estimate diffuse irradiance and the model developed by Liu and Jordan [35] was adopted. From Equation (1), the global irradiance was computed as follows
G T f = I b R b + I d 1 + c o s β 2 + I ρ g 1 c o s β 2 ,
where I b is the direct (beam) irradiance on a horizontal surface, I d is the horizontal diffuse irradiance, and I is the total horizontal irradiance ( I = I b + I d ). R b represents the geometric factor, i.e., the ratio of beam radiation on a tilted surface to that of a horizontal surface ( R b = c o s θ c o s Z ) . θ , Z , and β denote the incident angle, solar zenith angle, and surface tilt angle, respectively. The ground surface albedo was set to 0.3, typical for concrete or glass-covered urban surfaces [36,37], influencing both front-side reflected irradiance (Equation (2)) and rear-side irradiance (Equation (4)). Refer to [33] for the calculation method of radiation on tilted surfaces.
For bifacial PVs, the total irradiance is calculated by adding contributions from the front and rear sides. Following the IEC TS 60904-1-2 standard [38] which provides guidelines for evaluating bifacial PV performance under natural sunlight conditions, the total irradiance was calculated using
G t o t a l = G T f + φ G T r ,
where φ represents the bifaciality factor and G T r is the rear irradiance. Under IEC TS 60904-1-2 testing by TÜV Rheinland [39] depending on cell technology, bifacial modules exhibit φ values from 0.60–0.90; thus, in this study, φ was set to 0.8 to represent a typical, mid-range bifaciality factor. Neglecting shadows, panel height, and partial shading effects, the rear irradiance was estimated using
G T r = I b R b , r e a r + I d 1 + c o s ( π β ) 2 + I ρ g 1 c o s ( π β ) 2 ,
where R b , r e a r is the geometric factor for the rear side. This simplification assumes uniform rear-side irradiance, excluding partial shading from nearby obstructions (such as vegetation or structures), to focus on orientation and bifaciality impacts. Using Equation (3), PV output of the bifacial PV model was given by
P P V = G t o t a l × C P V × P R ,
where C P V denotes installed panel capacity and P R represents the PV system performance ratio. In this model, the performance ratio was assumed to be 0.8, reflecting standard operational conditions including inverter efficiency, dirt accumulation, shading, and temperature effects. The choice of 0.8 for P R lies within the 0.75–0.85 range reported for residential PV systems [40,41,42]. For the south-facing mono-facial panels, the bifaciality factor is zero; therefore, G t o t a l = G T f , and Equation (5) is also applied to calculate their PV output. The tilt angle for the mono-facial south-facing installation was assumed to be 30 degrees.

3. Curtailment and Fairness Evaluation

3.1. Curtailment Energy Modelling

Distribution network operators usually curtail PV energy during periods of high generation to maintain grid stability and ensure a balance between supply and demand. This is necessary to prevent voltage rise, especially in distribution networks with high PV penetration, where reverse power flows can lead to overvoltage. In compliance with established grid codes and regulations, DNOs set upper voltage limits and actively monitor and manage the current flow and frequency stability across the network. For example, in Japan, voltage regulation standards specify that for low voltage customers, voltages must be maintained within 101 ± 6 V for a standard voltage of 100 V, and 202 ± 20 V for a standard voltage of 200 V [43,44]. Therefore, if reverse power flows cause the voltage to deviate from these limitations, distributed generation installations, such as PV systems, should use reactive power control and output control functions to automatically control it. Therefore, while centralized generators are conventionally used to balance grids during periods with excess renewable generation, PV systems with advanced inverter control strategies (such as active power curtailment, Volt/VAR control, and Volt/Watt control) can play a vital role in locally addressing voltage rises where they occur, thereby providing a faster response. This reduces overreliance on centralized generation for voltage control and enhances the resilience of distribution grids, also considering that more renewable sources are being connected to grids. In addition to voltage management, network operators must maintain network frequency within permissible limits. The frequency must be kept within ±0.3 Hz of the standard frequency in Hokkaido/Okinawa and ±0.2 Hz in other locations. This comprehensive approach effectively facilitates the integration of distributed generation installations such as PV systems into the grid.
This study focuses exclusively on active power curtailment triggered by local bus voltage violations. Reactive power control methods (including Volt/VAR control and Volt/Watt control) as mandated by IEEE 1547 standards [9] or local regulations are excluded in order to isolate the standalone performance of local active power reduction. Furthermore, operational constraints such as transformer thermal limits and feeder loading thresholds are omitted to prioritize voltage-driven curtailment dynamics. Voltage curtailment is employed as a mechanism to prevent voltage rise in distribution grids with high PV integration. The energy curtailment process is carried out at regular 5 min intervals (288 timeframes per day) based on Newton–Raphson power flow simulations. These simulations, combined with voltage profile analyses, ensure that network operational limits are maintained at every timeframe by iteratively adjusting the power output at each bus as needed. Therefore, multiple iterations may be required for each timeframe as the bus voltage profiles are examined and curtailment applied until each bus’s voltage is within the acceptable limits.
Compared to other power flow models, such as the DistFlow model, the Newton–Raphson method was chosen for this study because of its robustness in solving non-linear power flow equations, making it ideal for dynamic voltage control in distribution grids with high PV integration where voltage conditions change rapidly. The iterative nature of the Newton–Raphson method ensures precise regulation of voltage levels across the network. In this model, curtailment is triggered and executed independently at each bus based on local voltage measurements and does not incorporate feeder-level or substation-level coordination. The active power output at each bus is adjusted based on the calculated voltage deviation at that bus. This localized decision making allows for voltage regulation to be tailored to meet the specific needs of each bus, ensuring that curtailment is only applied when necessary.
Considering radial distribution networks, curtailment is not uniformly applied across all buses. Buses located farther from the substation are more prone to voltage rise and, as a result, experience more frequent and larger curtailment actions. Figure 3 illustrates the voltage profiles of the nearest and farthest buses in a 30-bus feeder system, highlighting how distant buses require more aggressive curtailment measures. The power curtailed at each bus i during each simulation iteration, P c u r t a i l ( i ) , is determined based on the excess voltage at the bus and is given by:
P c u r t a i l ( i ) = V b u s i V m a x V b u s i × P b u s ( i ) ,
where V m a x denotes the upper voltage limit, and V b u s ( i ) and P b u s ( i ) represent the voltage and power output at bus i , respectively. Equation (6) only modifies the active power setpoint (no reactive power term is included); thus, active power curtailment is applied precisely where voltage violations occur, enabling a dynamic, voltage-driven curtailment strategy. The total energy curtailment at bus i , E c u r t a i l ( i ) , for each 5 min timeframe, t , is calculated by summing the power curtailed in all simulations within the interval, and is given by
E c u r t a i l ( i ) = P c u r t a i l ( i ) × t .

3.2. Fairness Evaluation Metrics

Fairness in the context of residential PV energy curtailment refers to the equitable allocation of curtailment actions among the various households involved in energy markets [45]. In this study, three fairness indexes are utilized to assess the fairness of PV energy curtailment when vertical bifacial east–west-facing PV installations are used in place of mono-facial south-facing PV systems. By providing a thorough examination of the distribution of curtailment among several buses, these indexes allow this paper to assess both the technical efficacy of the proposed curtailment approach and its effects on the social welfare of the various households.

3.2.1. Curtailed Energy Index (CEI)

The Curtailed Energy Index is specifically designed to assess the fairness of energy curtailment across the different buses in the distribution network. CEI evaluates curtailment fairness quantitatively by assessing the distribution of curtailed energy at 5 min intervals following load flow simulations. CEI is computed using:
C E I = i = 1 n E c u r t a i l ( i ) E c u r t a i l a v g 2 2 · E c u r t a i l t o t a l 2 ,
where E c u r t a i l ( i ) represents curtailed energy at the i t h bus, and E c u r t a i l a v g represents the average curtailed energy in the network, while E c u r t a i l t o t a l is the total amount of curtailed energy during the 5 min timeframe. The factor of 2 normalizes the variation in curtailed energy among the different buses with respect to the total curtailed energy. The C E I varies from 0 to 1, with a value of 0 denoting uniform distribution of curtailed energy, signifying that each bus experiences the same level of curtailment.

3.2.2. Jain Fairness Index (JFI)

Jain’s fairness index provides a measure of assessing fairness in resource allocation in various systems, including evaluating the level of equity in the distribution of curtailment impacts for residential PVs in distribution networks [46]. In this study, it is used to evaluate the level of fairness in the distribution of energy sold relative to the surplus energy available at each bus, i.e., it measures how uniformly the available surplus energy is being converted into energy sold across the network at each 5 min timeframe. J F I is calculated using:
J F I x 1 , , x n = i = 1 n x i 2 n · i = 1 n x i 2 ,
where x i = s o l d   b u s   e n e r g y s u r p l u s   b u s   e n e r g y represents the ratio of the energy that can be sold to the total surplus energy at the ith bus. Surplus bus energy refers to the energy which is generated by the PV systems connected at bus i that exceeds load consumption at bus i and is available for sale to the grid. Sold bus energy is the actual amount of surplus bus energy that is sold after curtailment. The JFI ranges between 0 and 1 where a value of 1 indicates perfect fairness meaning that all buses have an equal ratio of energy sold to surplus energy.

3.2.3. Gini Index (GI)

The Gini index, a statistical measure frequently utilized to evaluate inequality in income distribution has been applied to analyse the fairness of energy curtailment in networks incorporating photovoltaic (PV) systems [47,48]. The Gini index is adapted in this paper to evaluate how equitably s o l d   b u s   e n e r g y is distributed across the different buses. Unlike the J F I ,which measures fairness based on the s u r p l u s   b u s   e n e r g y injection efficiency, the Gini index assesses how evenly benefits of PV generation, i.e., s o l d   b u s   e n e r g y , are distributed during each 5 min timeframe. The Gini index is given by:
G I = 1 2 n 2 y ¯ i = 1 n j = 1 n y i y j ,
where y i and y j represent s o l d   b u s   e n e r g y at the i t h and j t h buses, respectively, and y ¯ is the average value of energy sold across all buses. The Gini index ranges between 0 and 1 where a lower value reflects a fairer system in which all buses have an equal opportunity of selling energy generated. On the other hand, a higher value indicates that some buses benefit more than others from the energy sold due to their location or system configuration.

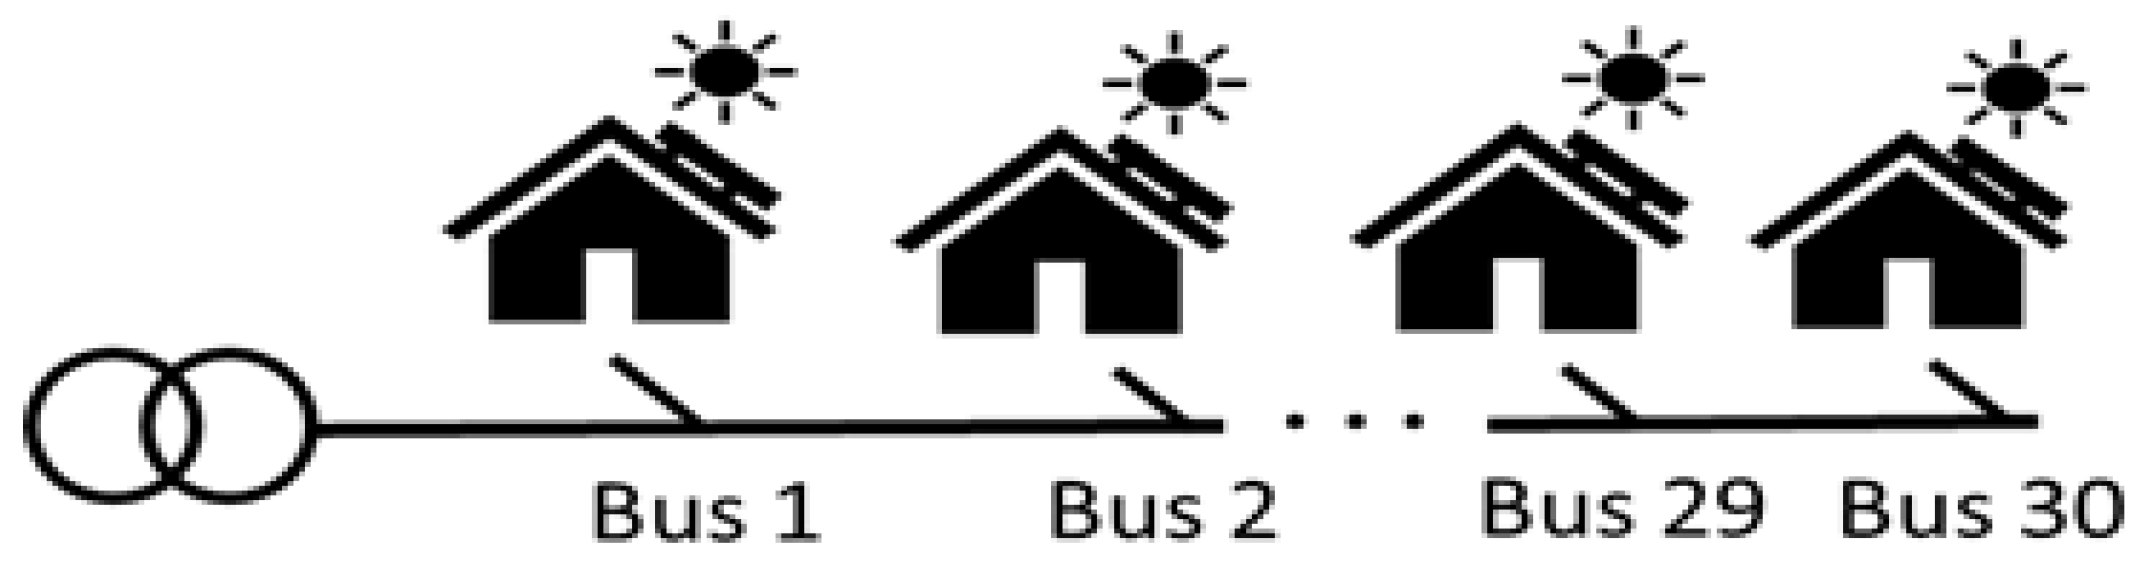
4. Simulation Conditions

In this study, a 30-bus distribution network, shown in Figure 4, designed in a radial configuration, was constructed using MATLAB R2024b (version 24.2) based on the JST-CREST 126 distribution feeder model data [49]. The separation between the buses was assumed to be 300 m, and each bus was connected to 10 households, each equipped with its own photovoltaic (PV) system representing a 100% penetration rate. This high-penetration scenario was assumed to enable a focused evaluation of the effects of PV generation profiles on grid performance, particularly in terms of curtailment and fairness under stress conditions. The data used to construct the distribution network are presented in Table 1.
To simulate daily load data per household, this study employed the IEEJ residential load curve model [50]. This model encompasses load curves for both weekdays and holidays, structured around three seasonal profiles: winter, summer, and autumn/spring. To align the model with the consumption patterns of Fukui city, the model’s hourly load curves were normalized and adjusted to match the annual household electricity usage in Fukui city, which amounts to approximately 7748 kWh per household per year [51]. Figure 5 shows the annual load curve adopted in this study. Figure 6 shows hourly load profiles at selected days of the annual load curve.
In this study, solar radiation data for Fukui city were sourced from the AMeDAS system of Japan’s Meteorological Agency for the year 2022 [52]. Using these data, PV output curves for the various installation types on selected days of the year at 10 kW are illustrated in Figure 7. The transaction prices for daily PV energy sales across timeframes were determined based on the 2022 spot market prices for the Hokuriku region, as obtained from the Japan Electric Power Exchange [53]. A future scenario is assumed where PV penetration has rendered policy incentives such as feed-in tariffs and feed-in premiums obsolete and energy is traded exclusively on the wholesale market. This simplification isolates market dynamics on revenue and curtailment fairness and enables a focused analysis of generation profiles under grid constraints.
For this study, three PV installation scenarios were considered for simulation to assess and compare the surplus and curtailed bus energies. The values for these energies were determined through load flow simulations conducted at 5 min intervals. The scenarios considered were:
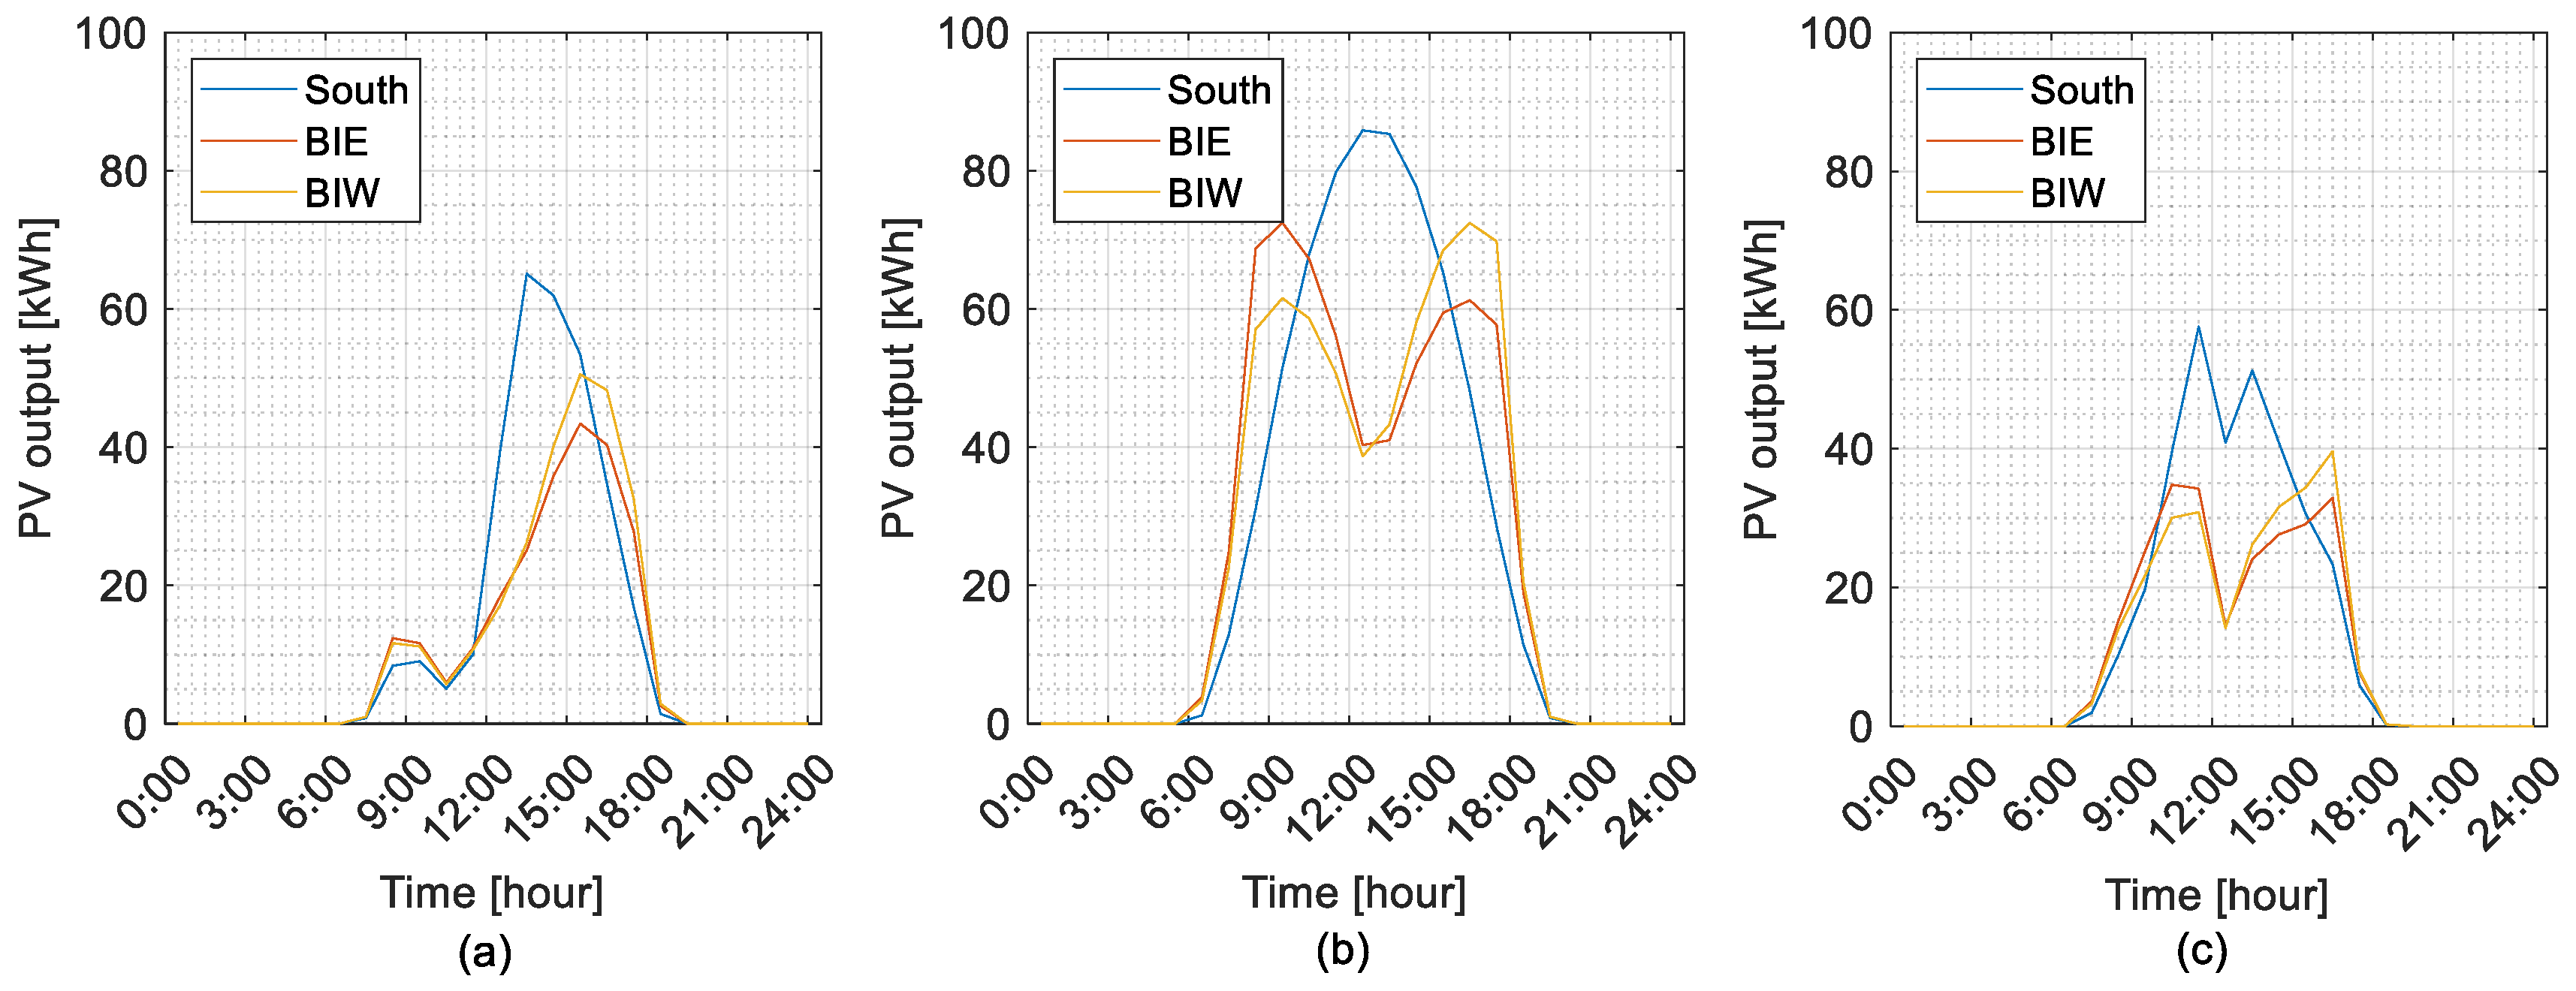
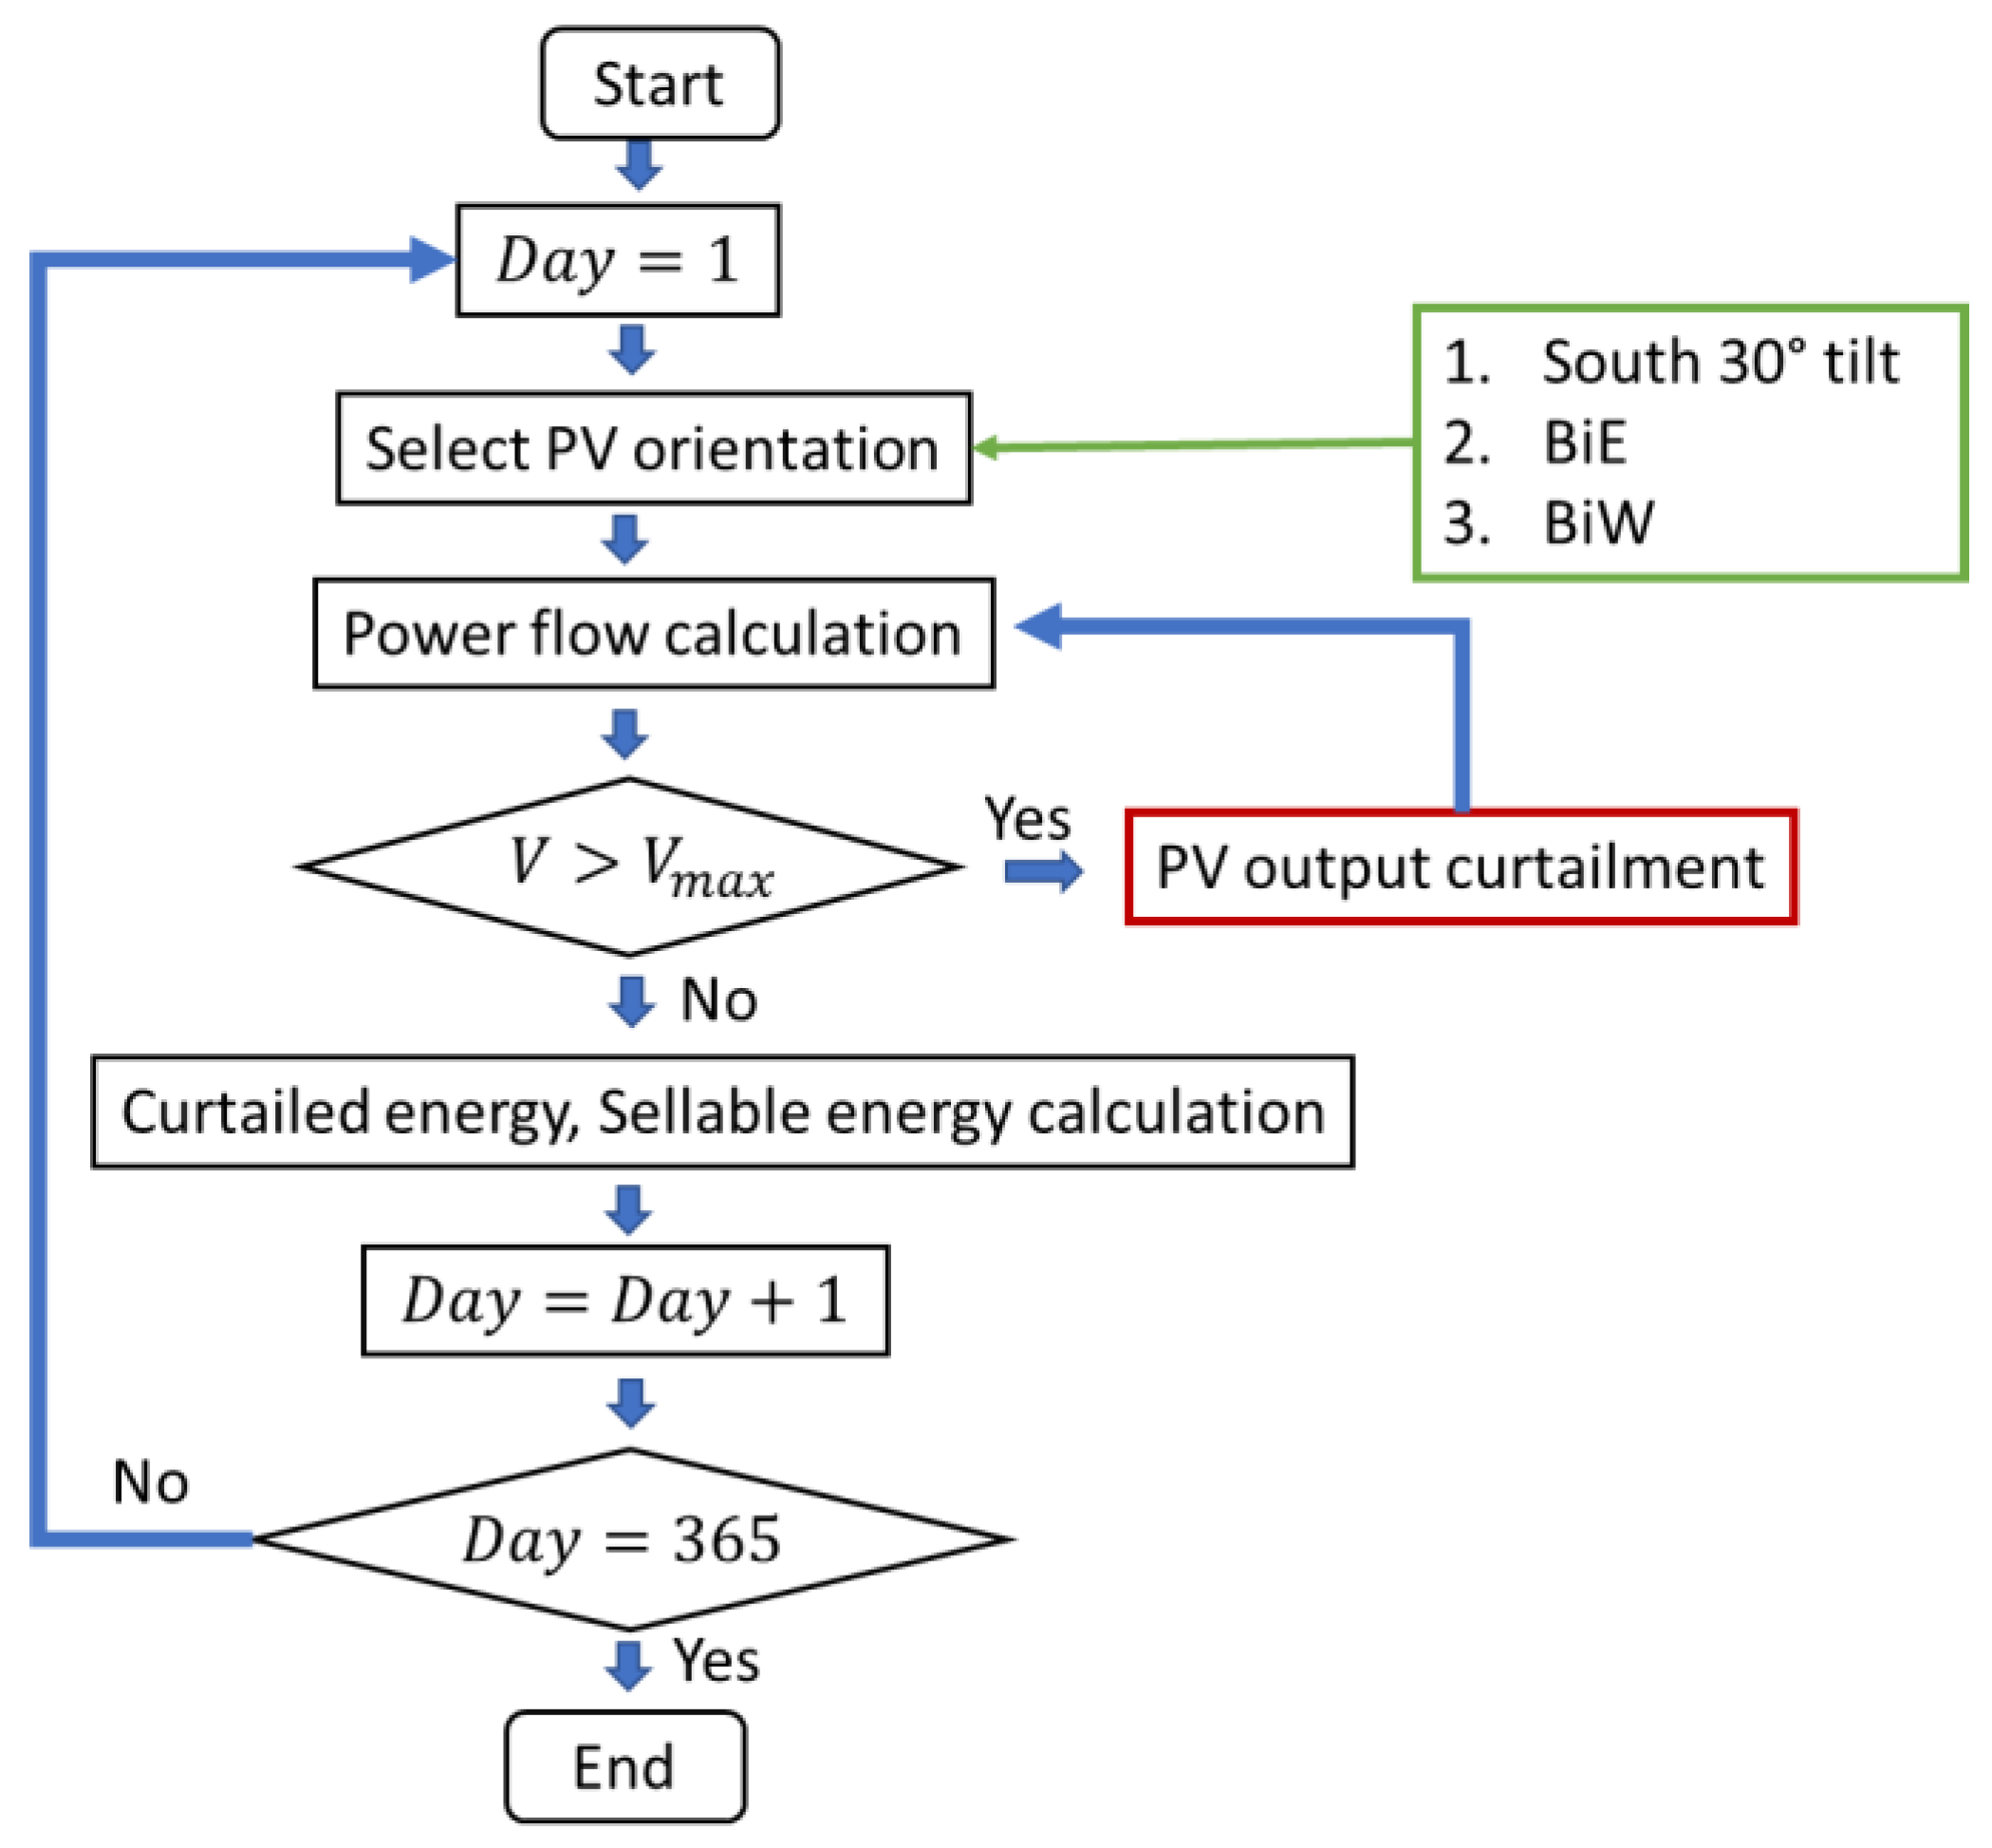
  • All buses connected with mono-facial south-facing PV systems.
  • All buses connected with bifacial PVs, with the front side facing east (BiE).
  • All buses connected with bifacial PVs, with the front side facing west (BiW).
For each scenario, it was assumed that all households had a uniform load and PV generation profiles. The upper limit for bus voltages was set at 1.05 per unit. Figure 8 illustrates the flowchart adopted for carrying out the simulations.

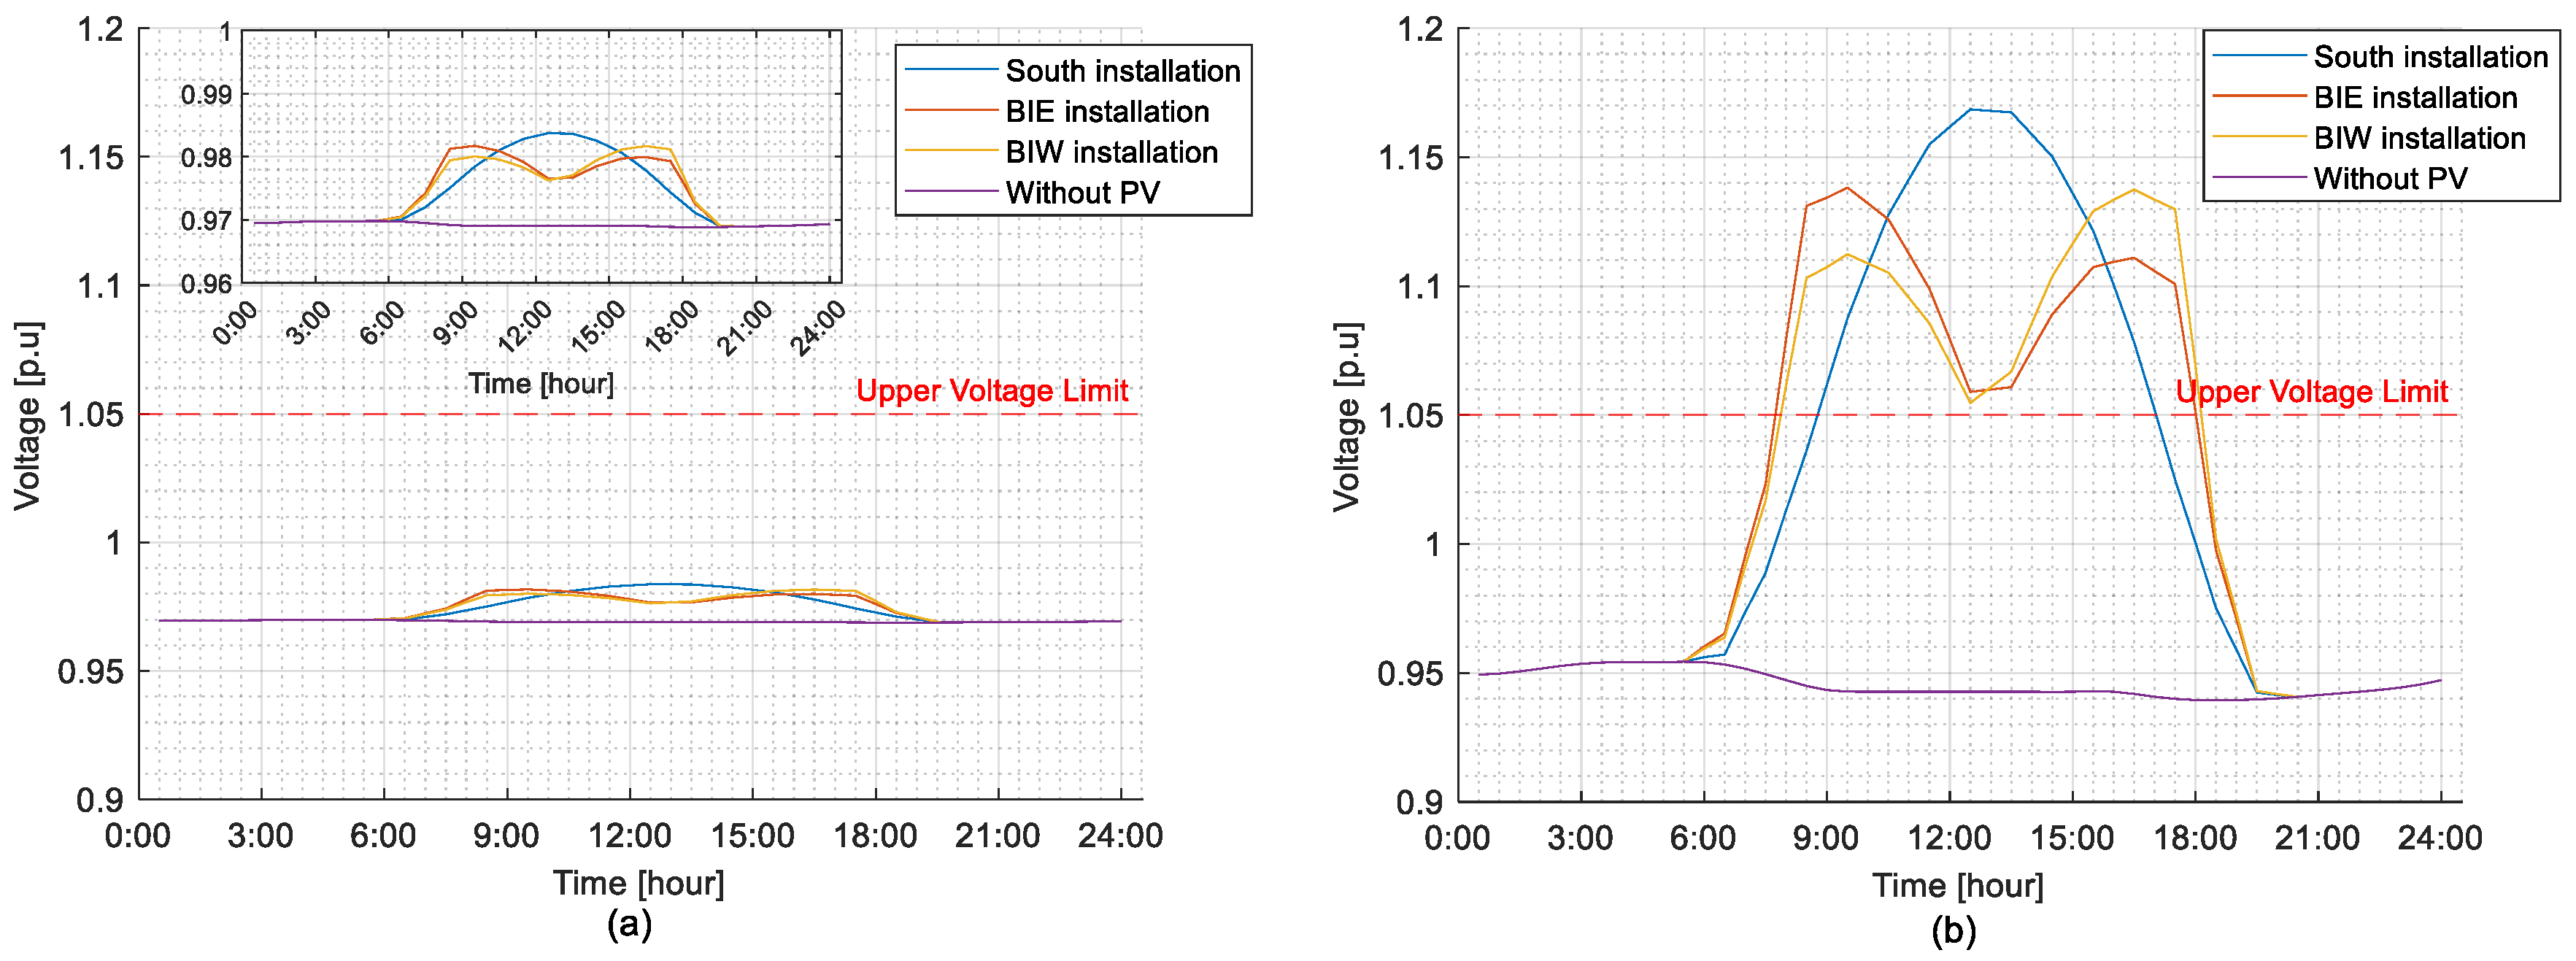
5. Simulation Results

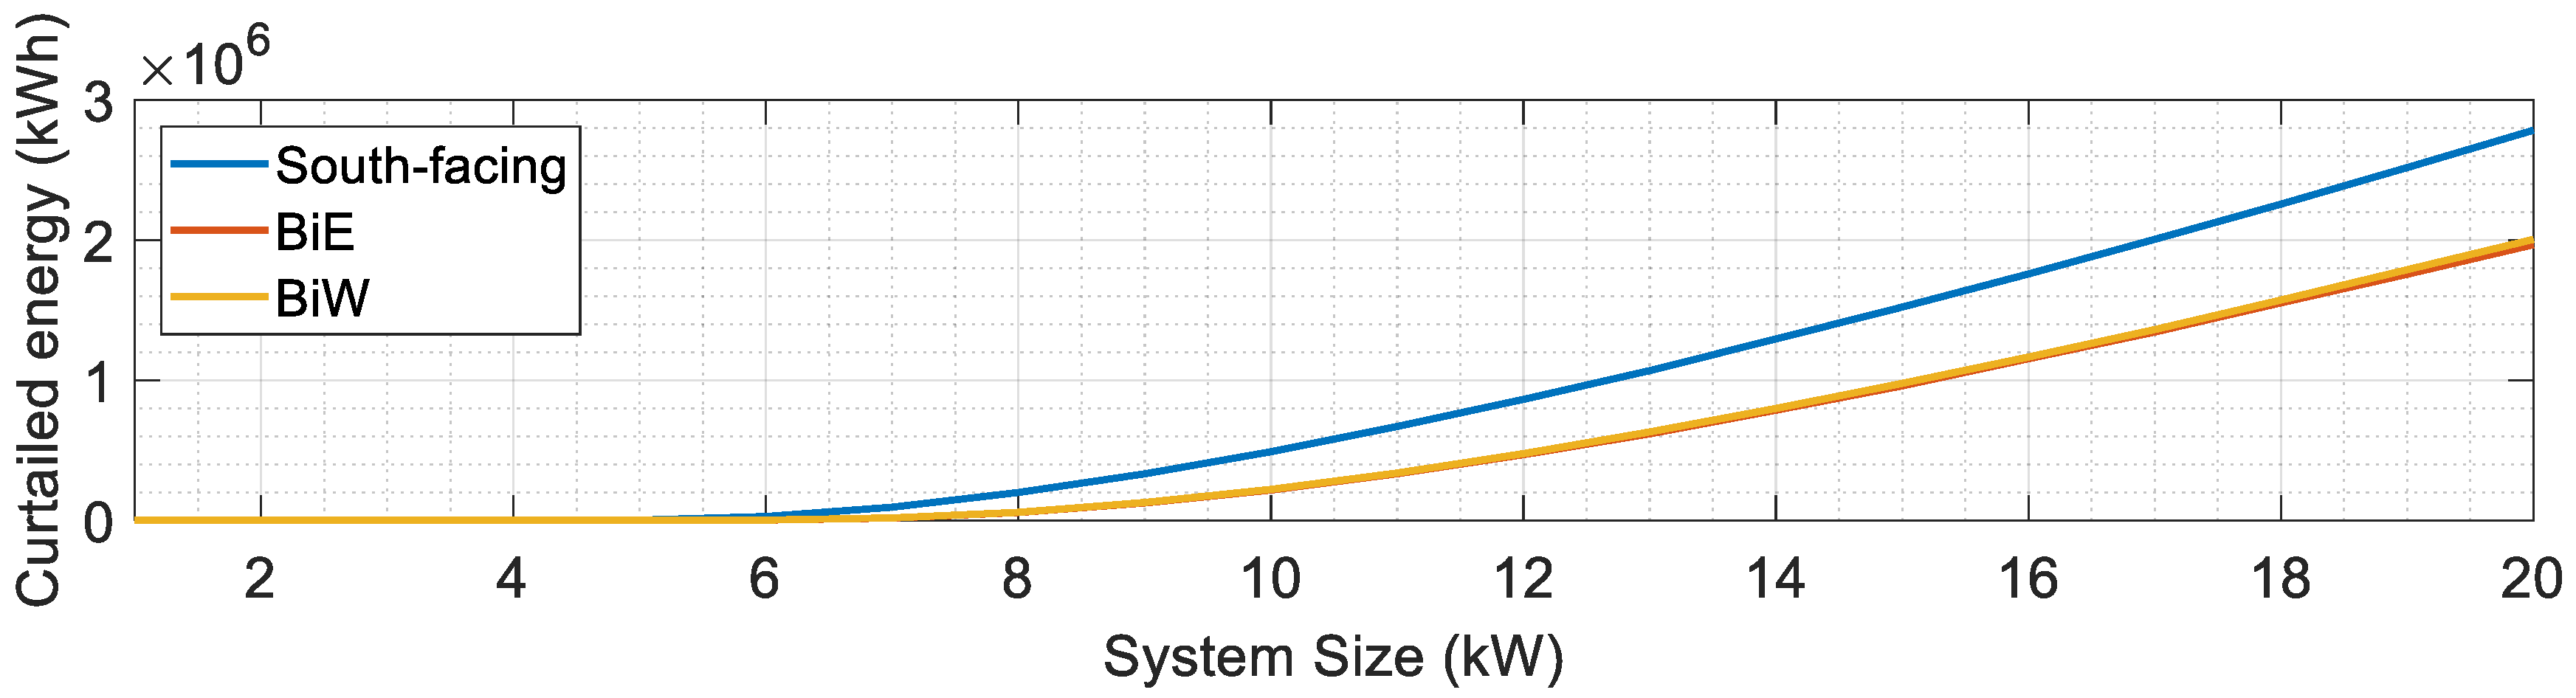
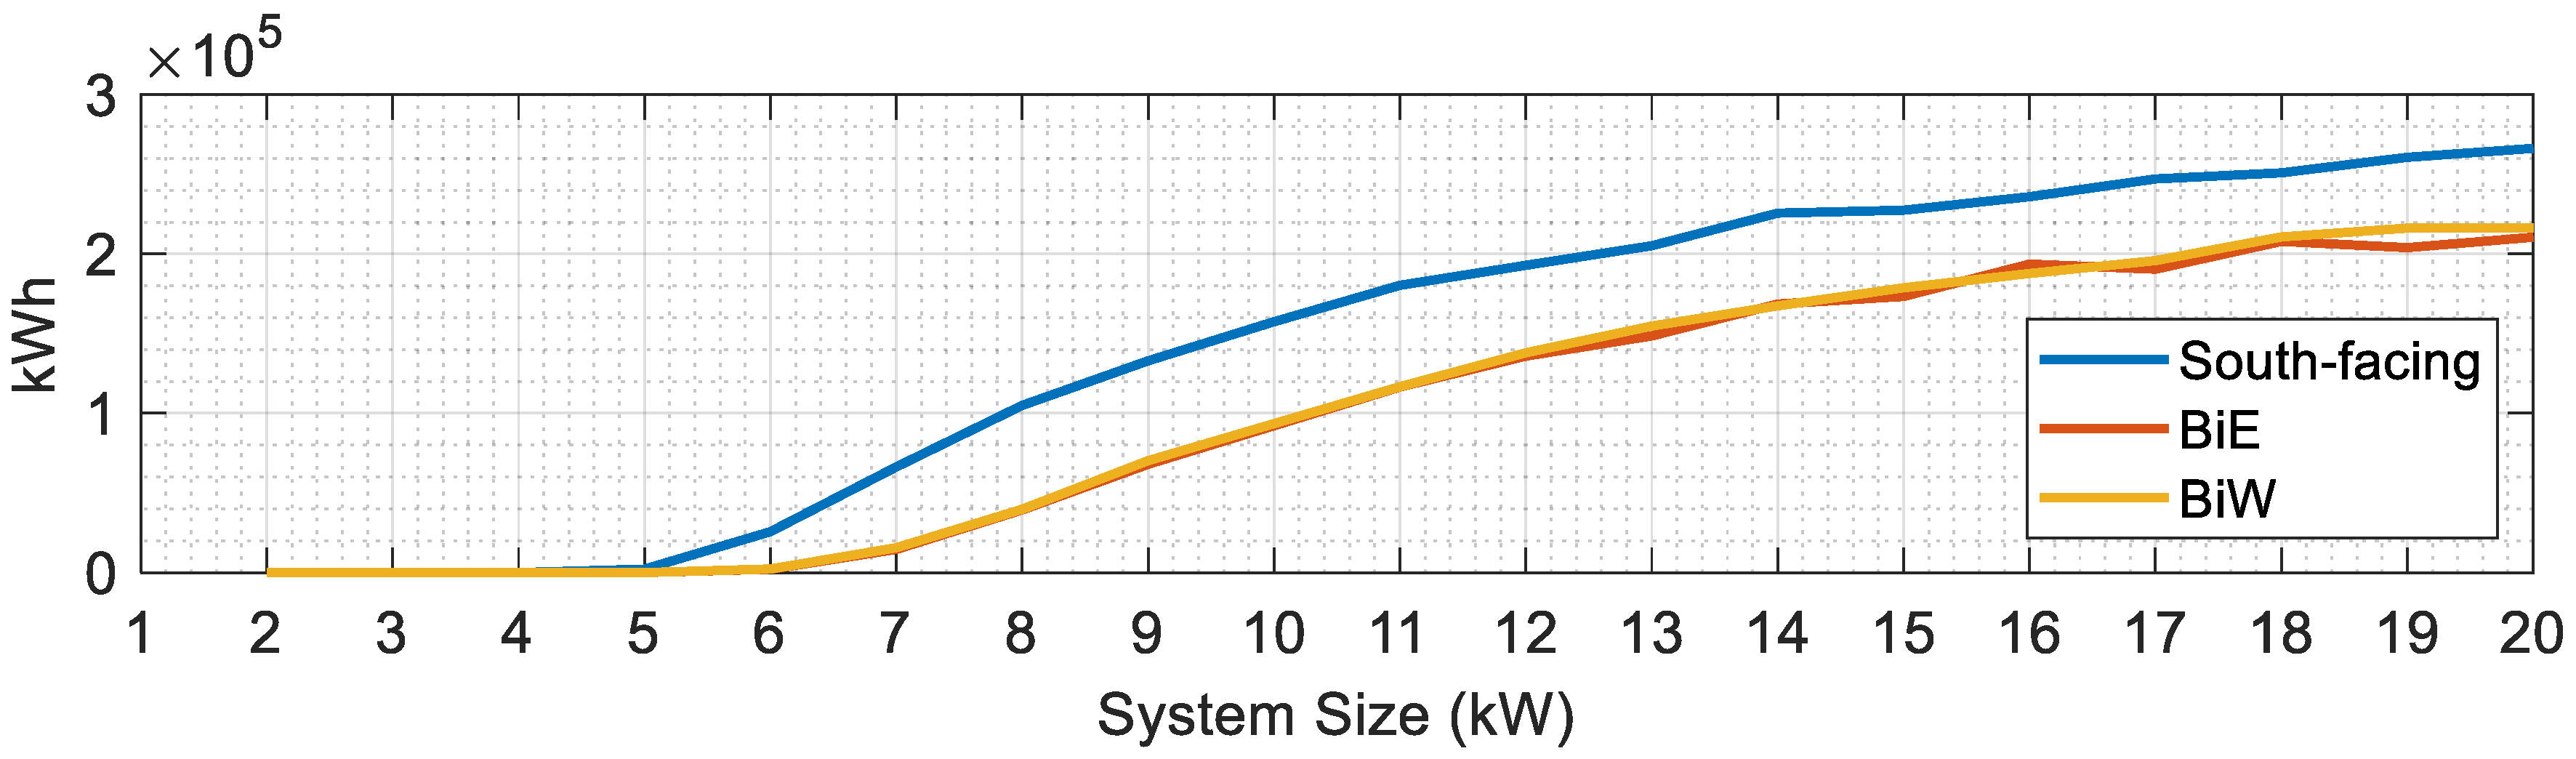
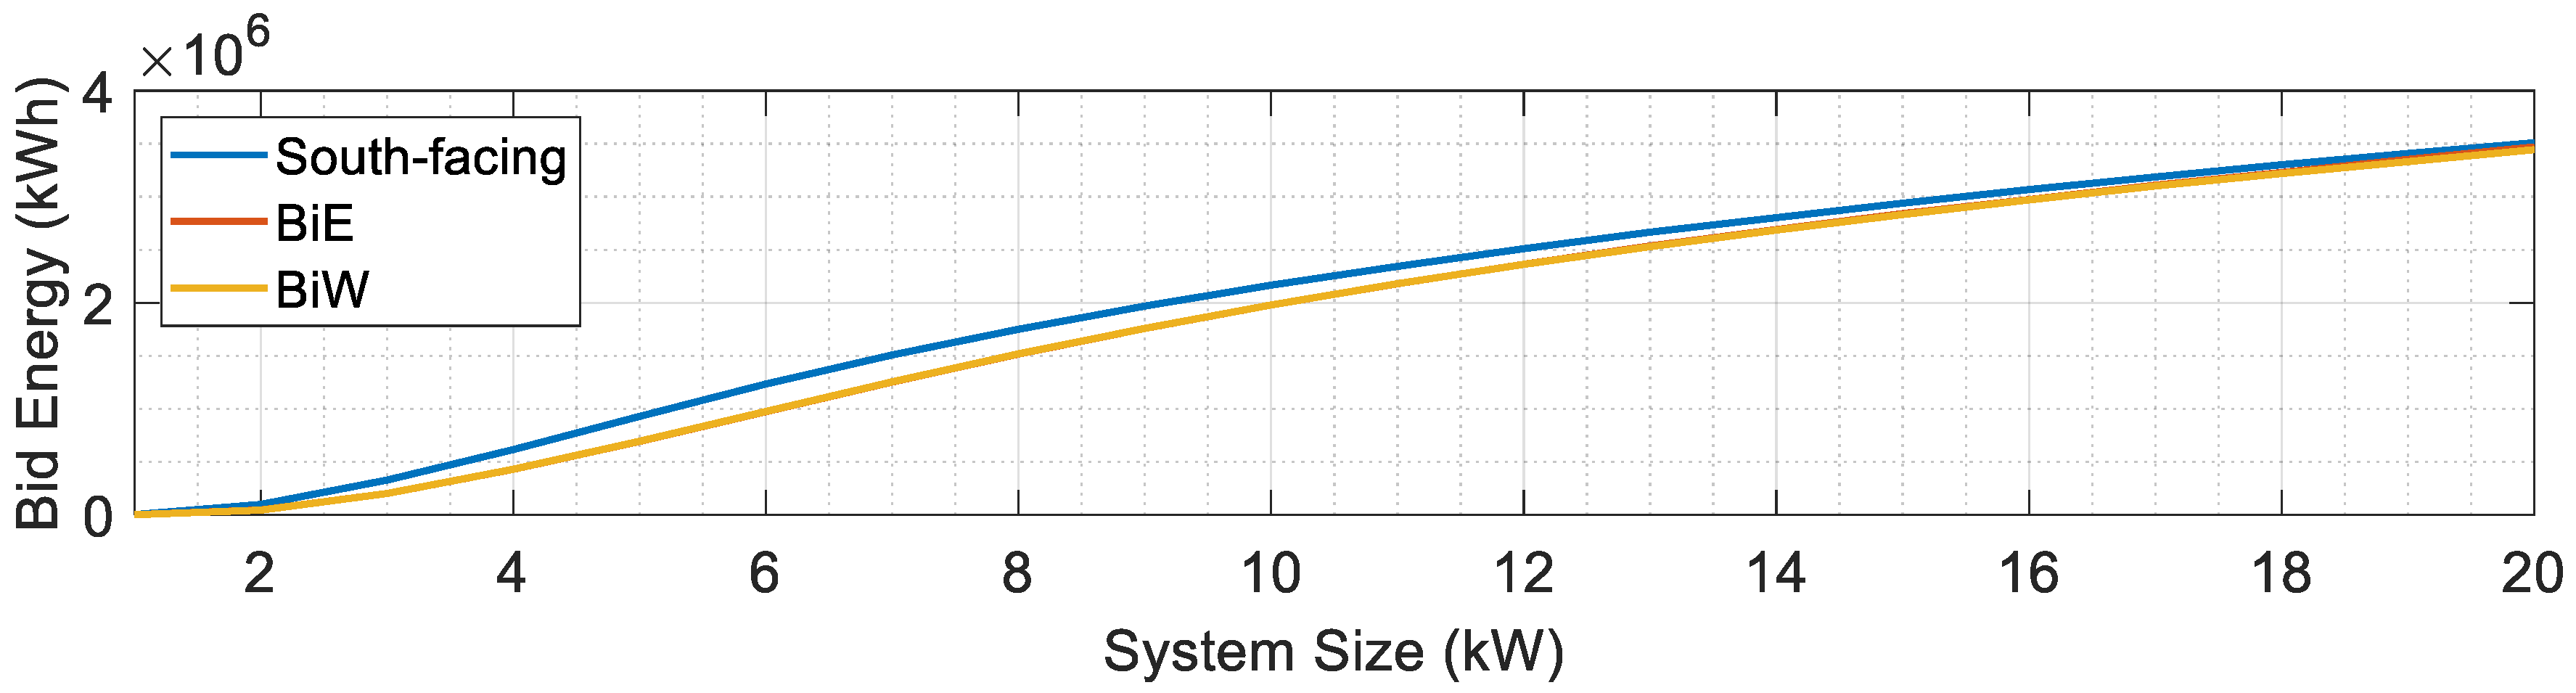
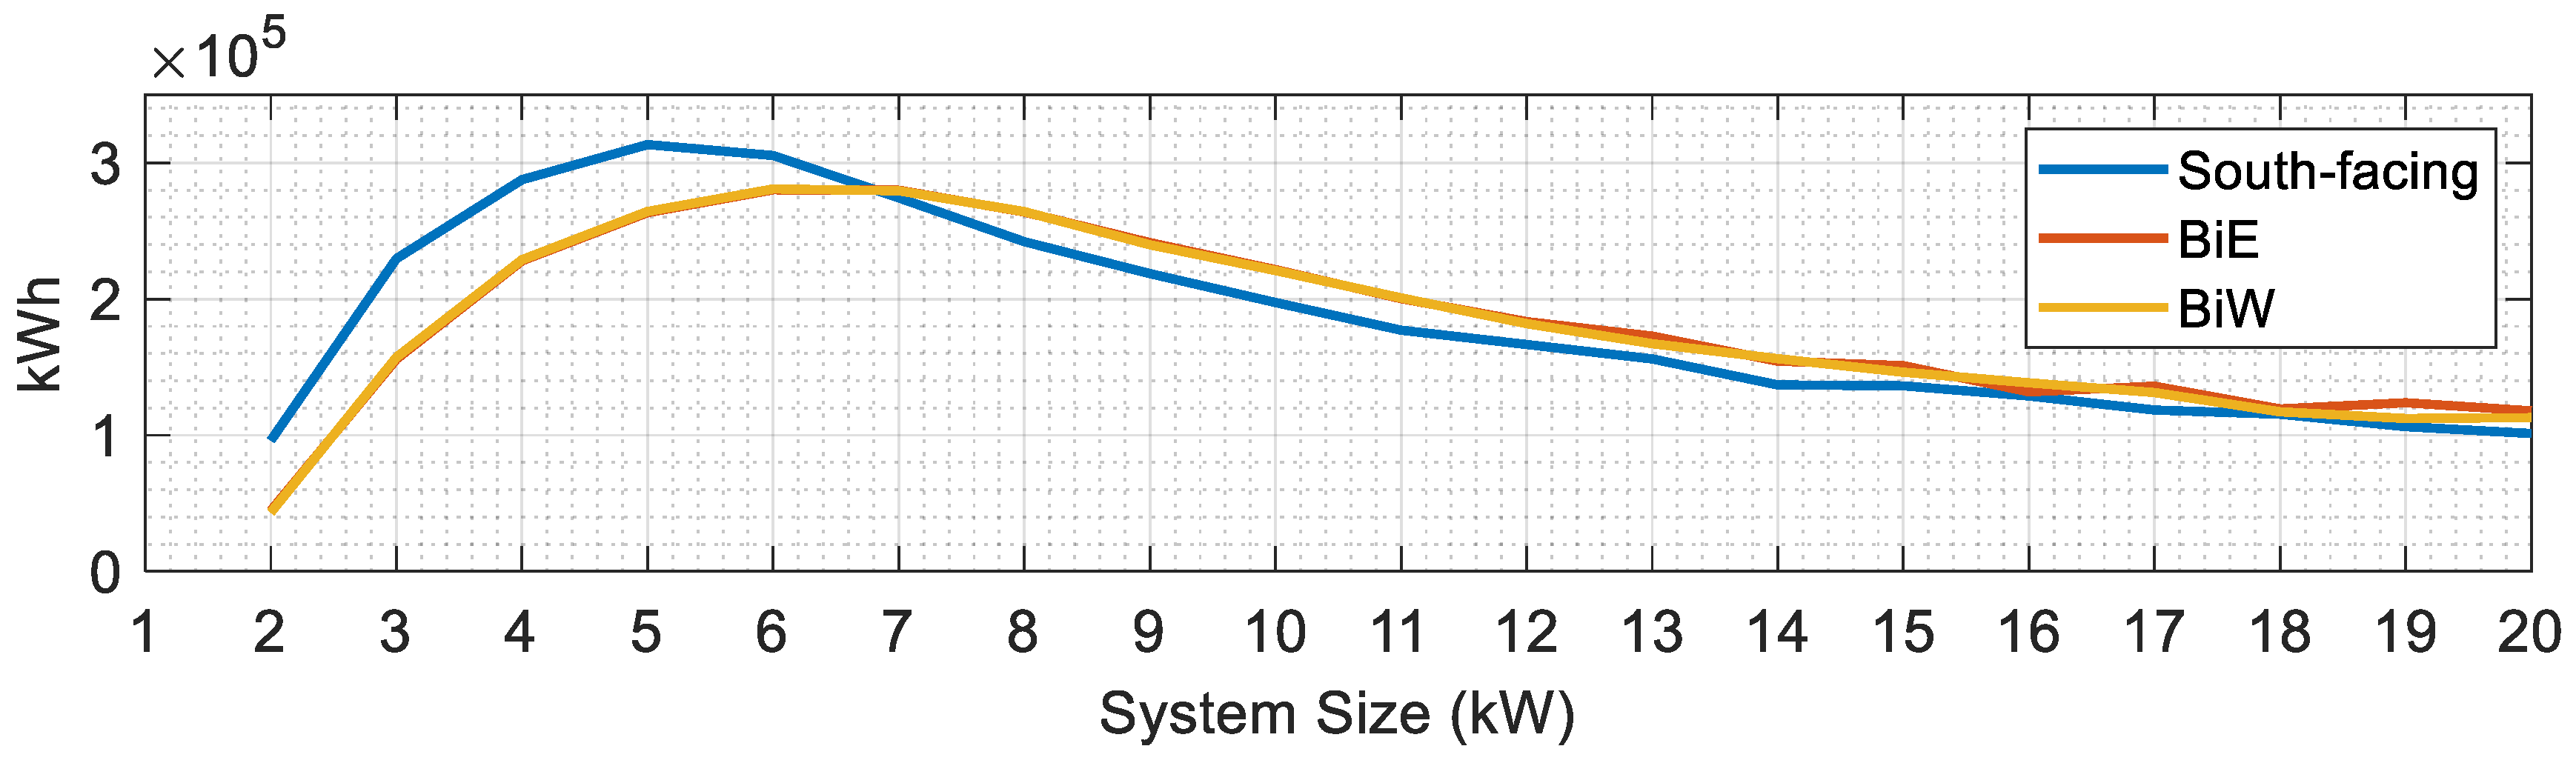
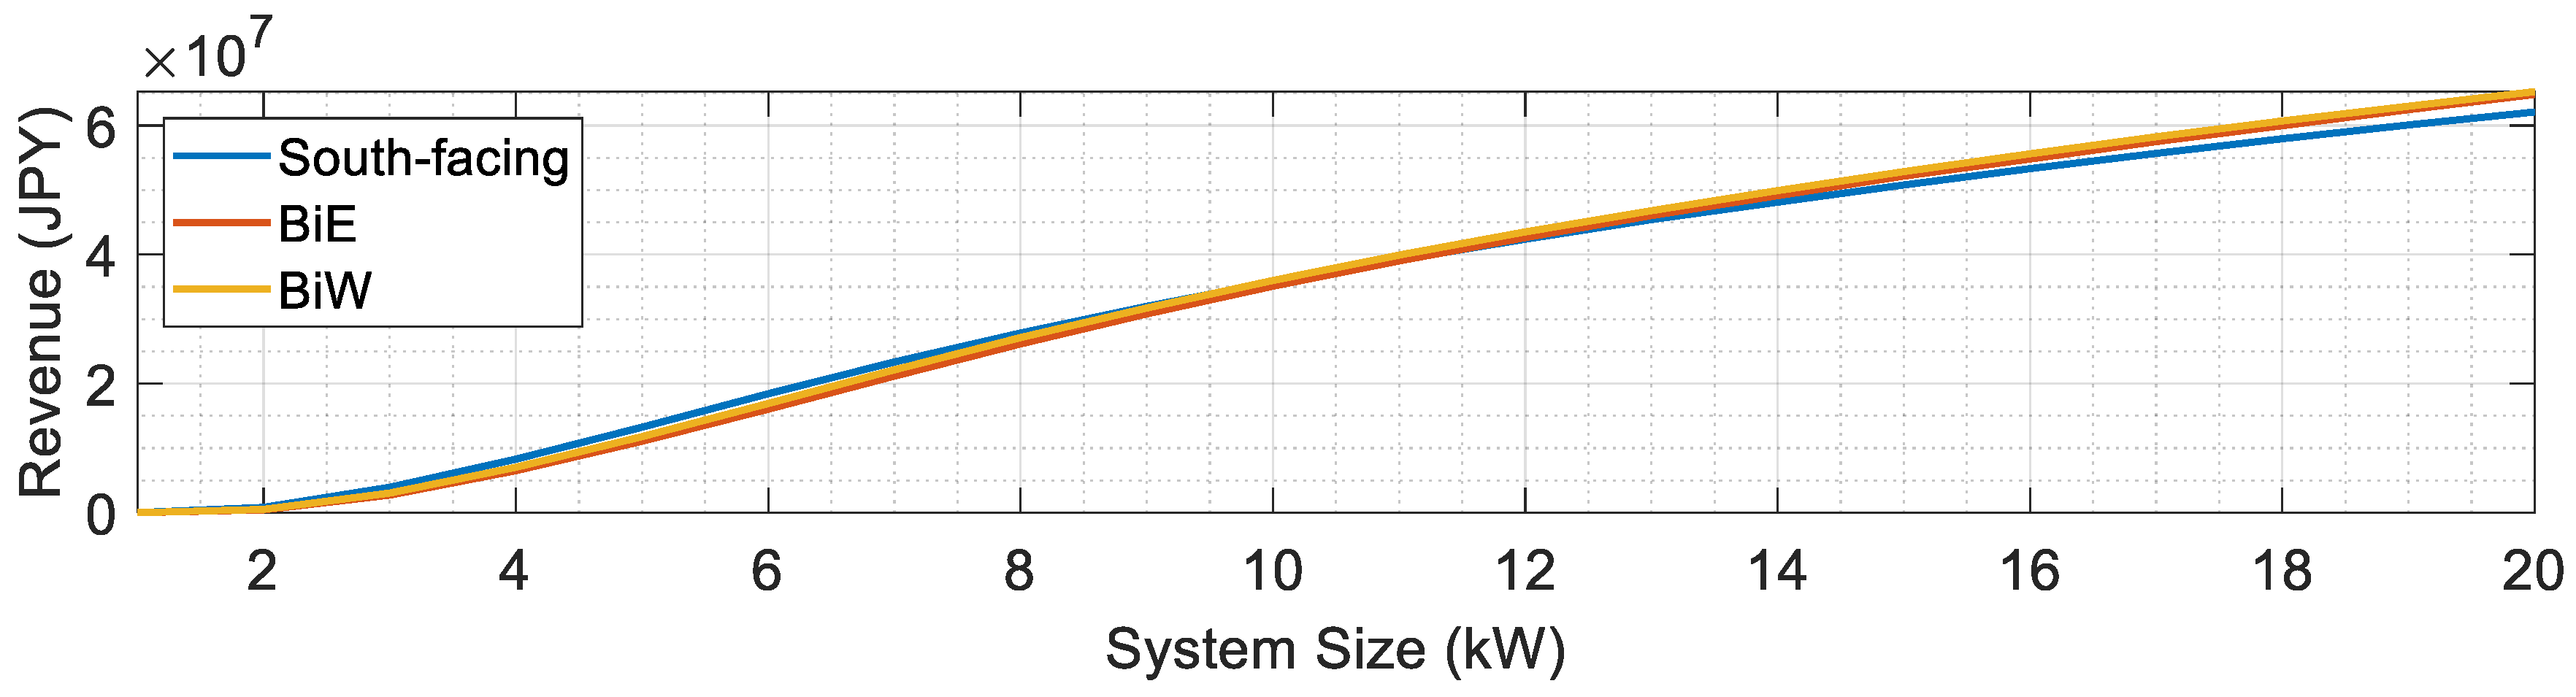
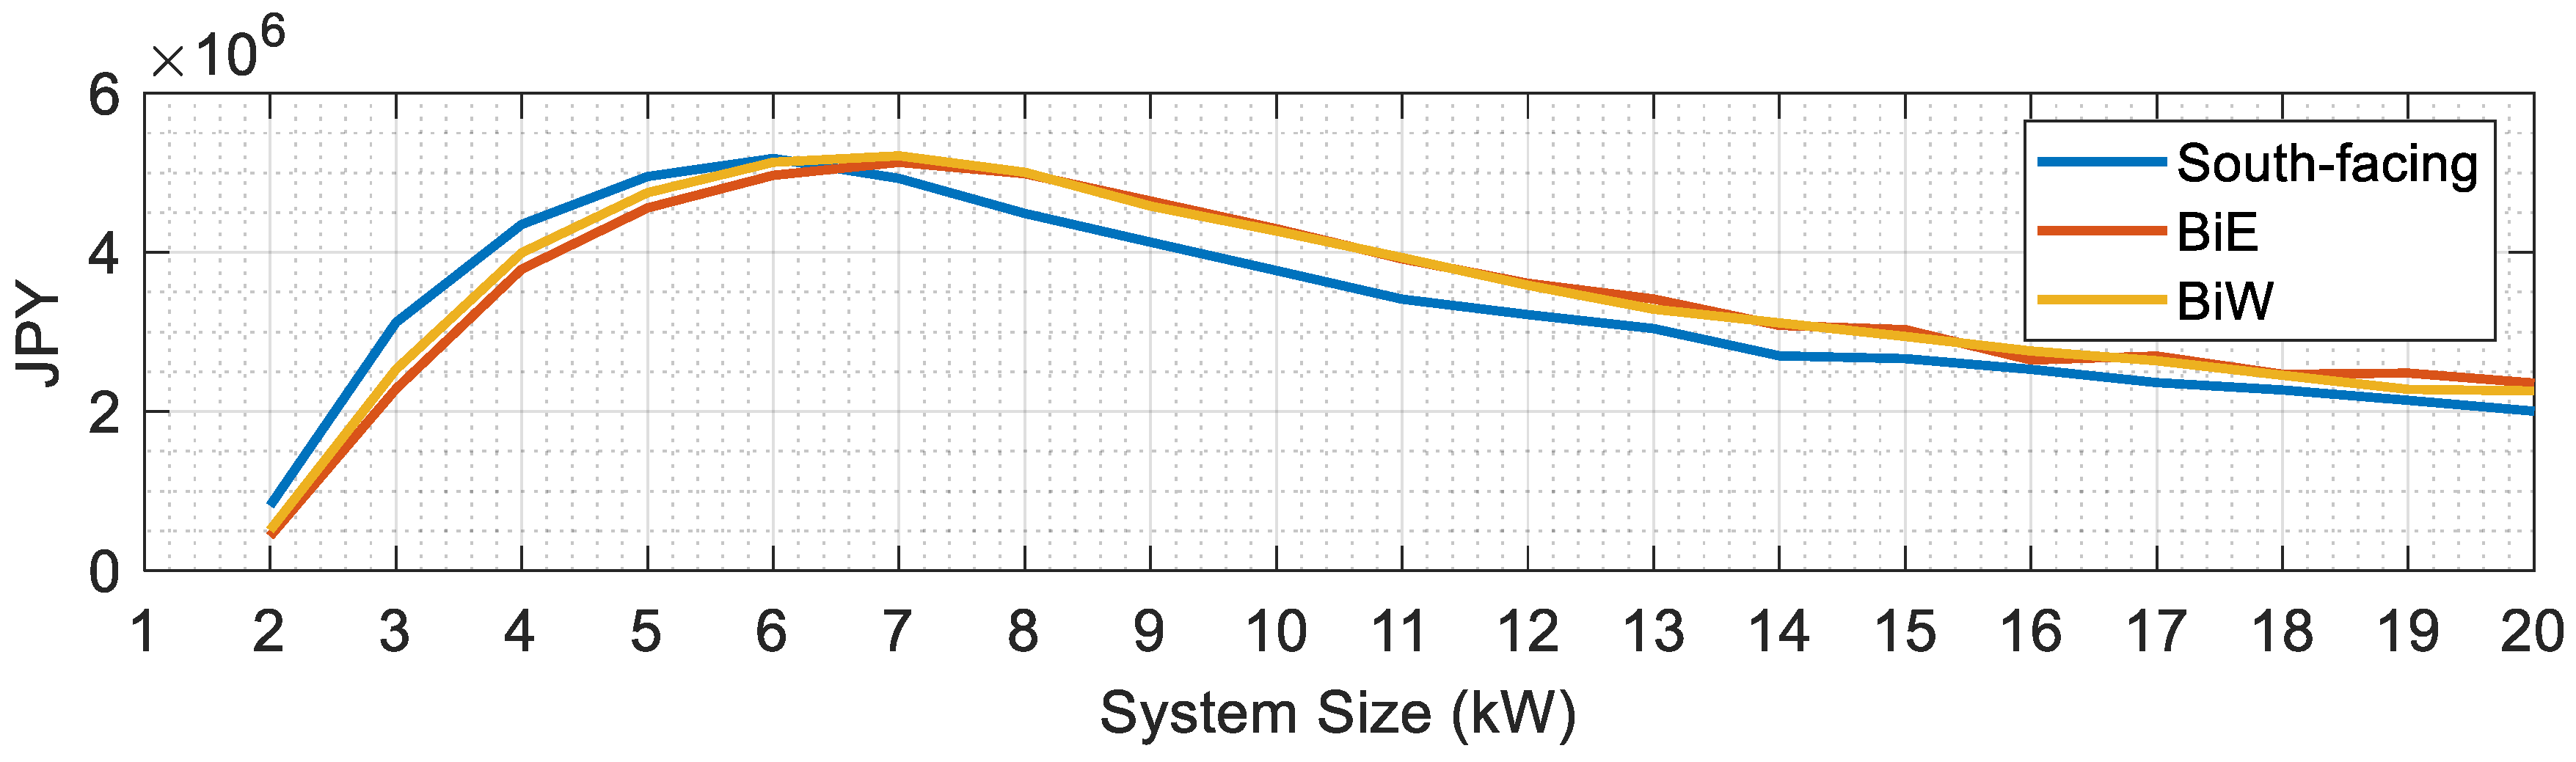
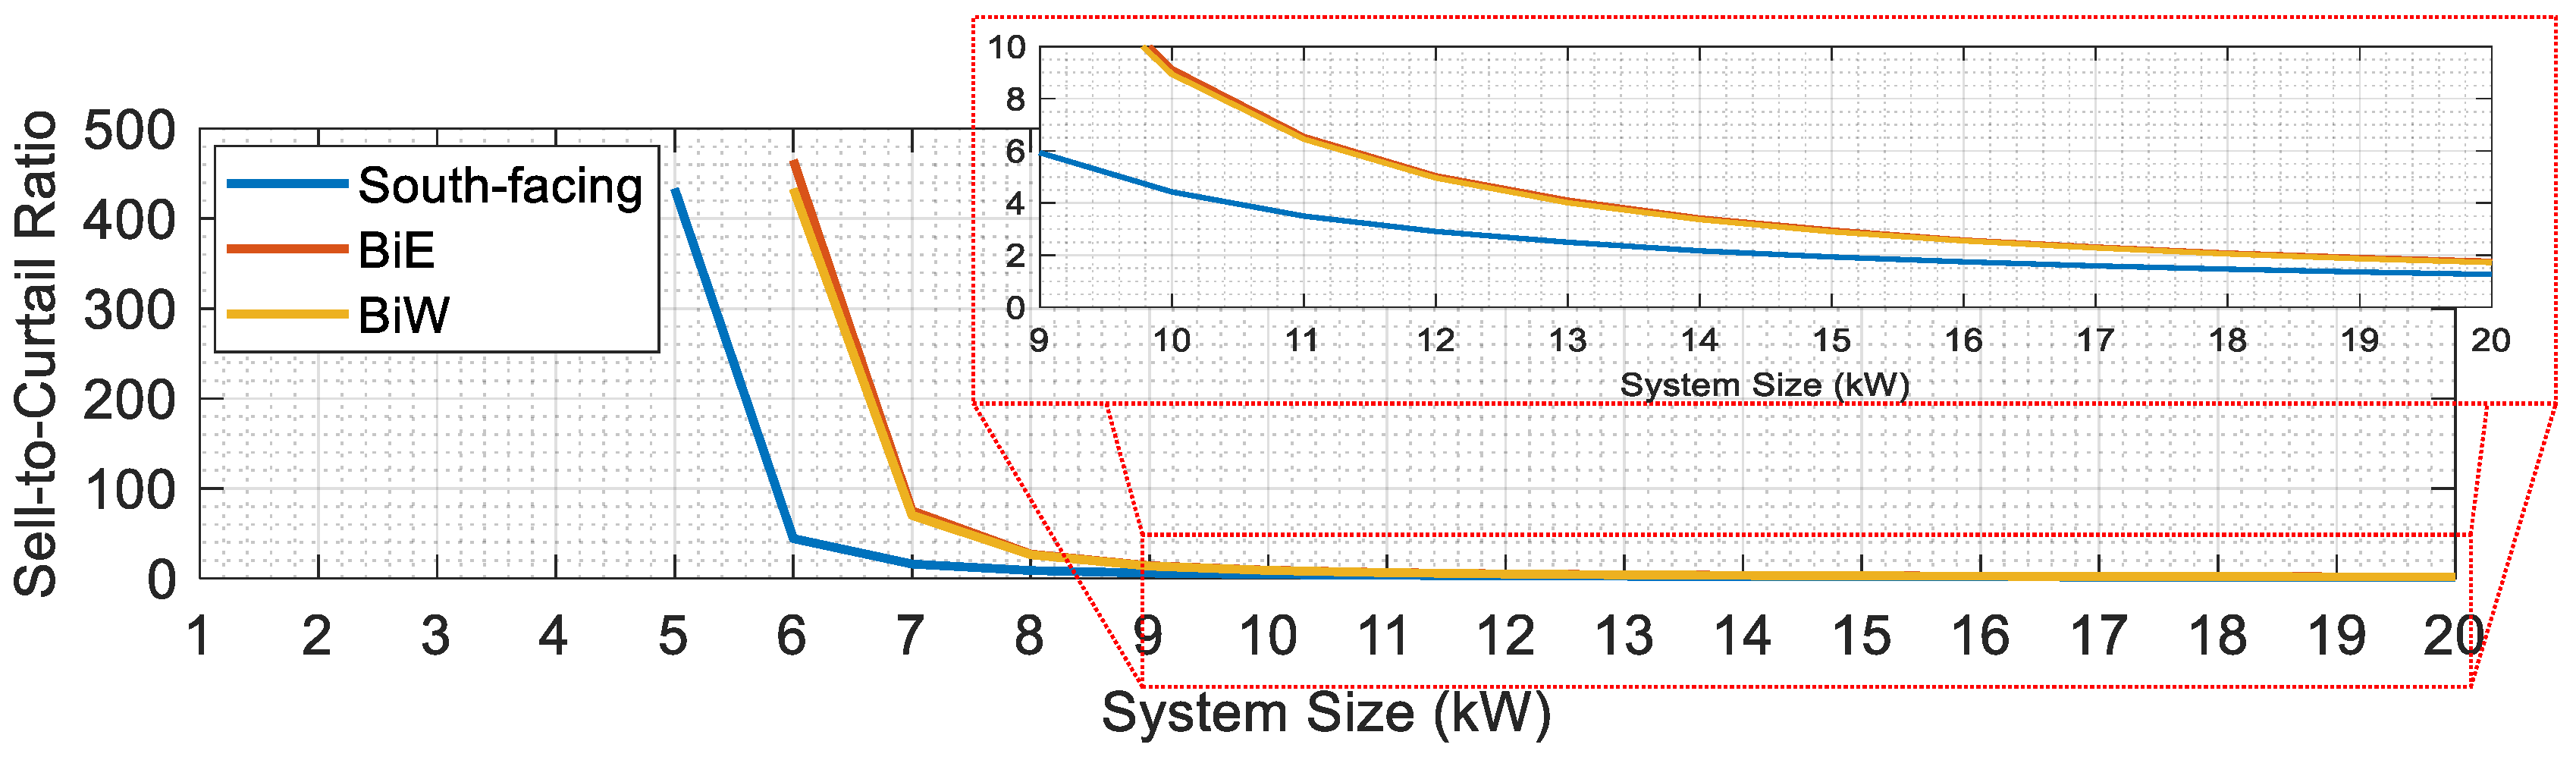
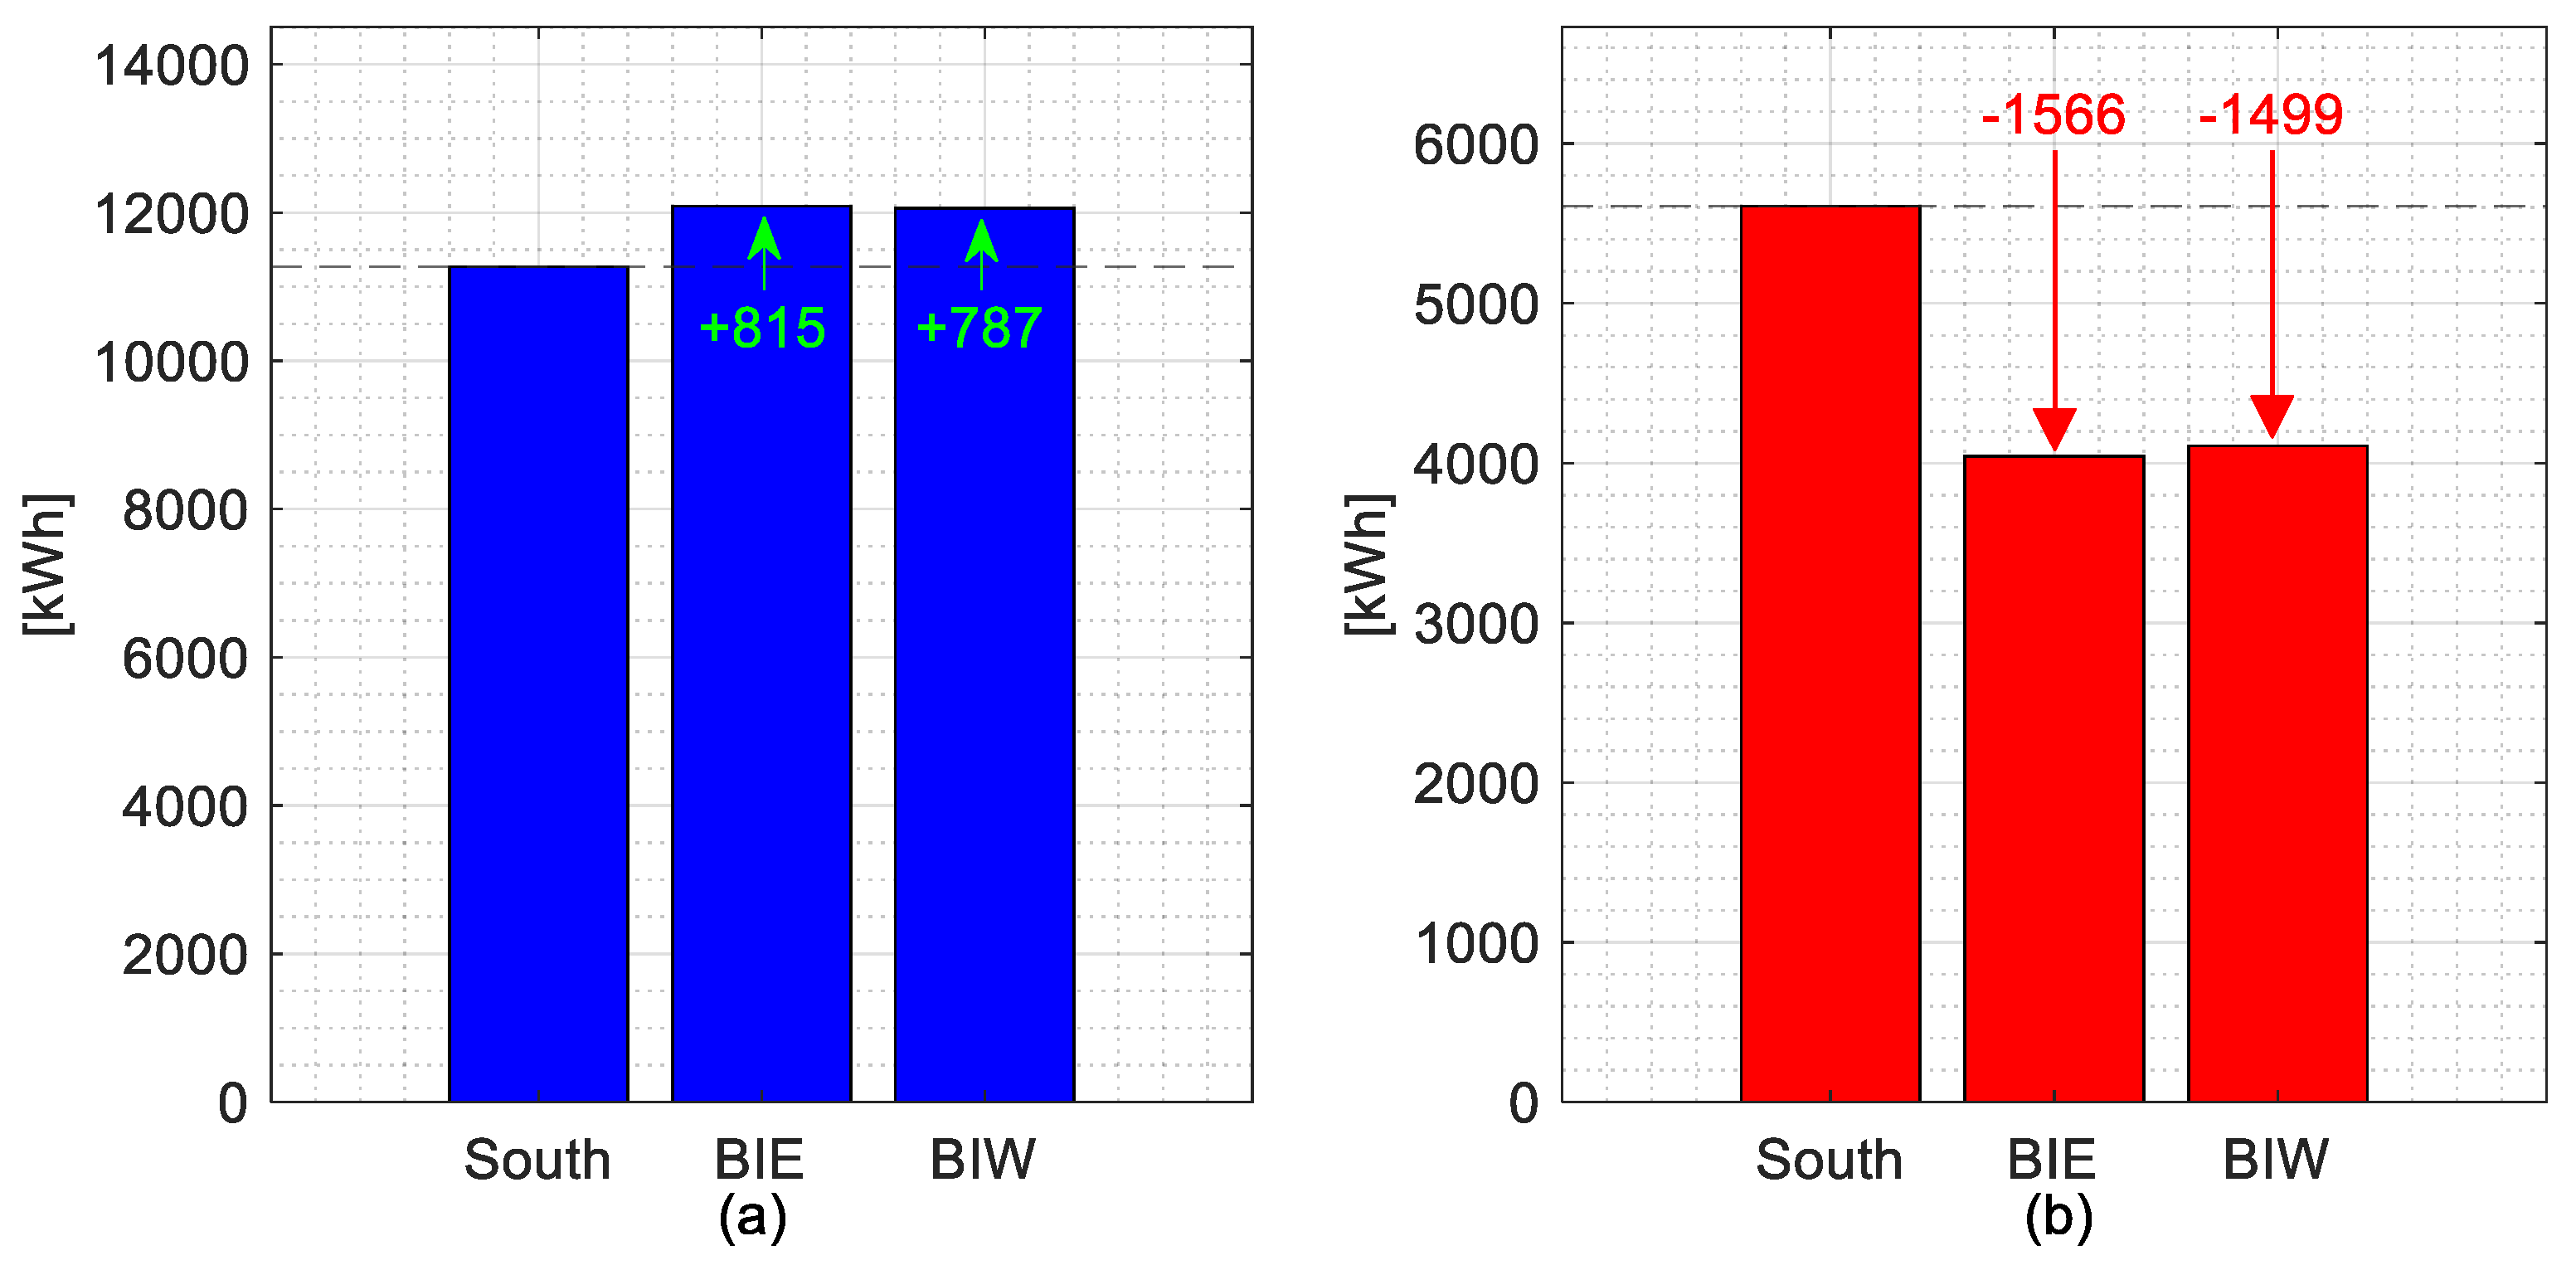
5.1. Performance Analysis Across Different PV Capacities

Since all households were modeled with an identical load and PV generation profiles, differences in performance (e.g., curtailment or revenue) arise solely from system configuration and network location rather than individual variability. This uniformity isolates network-induced effects on curtailment; however, in practice, variation in load profiles and PV outputs will further affect fairness outcomes. The annual results for curtailed and bid energies, as well as the revenue from bid energy at the different PV capacity levels, are shown in Figures 9, 11, and 13, respectively. Additionally, Figures 10, 12, and 14 show incremental curtailed energy, incremental bid energy, and incremental revenue, respectively, for each additional capacity increase. As illustrated in Figure 9 and Figure 10, curtailment begins at 5 kW for the mono-facial south-facing PV installation and 6 kW for both east-facing and west-facing bifacial installations. Curtailment significantly increases beyond these capacities for all the configurations with the south-facing installation curtailing more energy than the bifacials for each capacity increase. This can be attributed to the south-facing installation’s overproduction during peak sunlight hours leading to greater curtailment. On the other hand, BiE and BiW installations generate a bimodal generation profile with morning and evening peaks. While each individual peak is lower than the south-facing midday maximum, considering they are vertically installed, their combined effect spreads energy generation more evenly during the day. This temporal spread enables BiE and BiW systems to capture irradiance during early and late hours (periods when output from the south-facing system is minimal), resulting in higher usable energy. As installed capacity increases and voltage-based constraints become more restrictive, the bifacial systems also experience curtailment. However, a larger portion of their generation remains below the curtailment threshold compared to the south-facing system; therefore, a higher fraction of their output is injected into the grid. As a result, especially at higher capacities like 10 kW, BiE and BiW systems incur significantly less curtailment and achieve a more equitable distribution of energy among households in radial distribution networks.
According to the bid energy results shown in Figure 11, all three installation types show a consistent increase in bid energy as the installed capacity increases, indicating that higher capacities will result in more energy being sold. The south-facing installation shows higher initial bid energy amounts compared to the bifacial installation types with the bifacials catching up at higher capacities (the gap narrows towards 20 kW). This competitive performance demonstrated by bifacials indicates their efficiency in the utilization of available solar irradiance. The BiE and BiW installations exhibit similar patterns in the bid energy versus system size plots, as well as the incremental bid energy versus system size plots, with only slight variations beyond 12 kW, as shown in Figure 12. This consistency indicates that the performance for both BiE and BiW installations is nearly equally effective under similar conditions. Additionally, it is noticeable from Figure 11 and Figure 12 that the rate of increase in bid energy seems to gradually plateau beyond 15 kW for all installation types, signifying diminishing returns from sellable energy on additional capacity installations. The large increase in incremental bid energy at the initial capacities, from 1 kW to 5 kW for south-facing panels and up to 6 kW for bifacials, can be attributed to a low base effect whereby slight increases in bid energies result in large percentage increases due to small initial values for bid energy.
Similar to bid energy, revenues from bid energy increased consistently with an increase in installed capacity as shown in Figure 13 for all installation types. Initially, revenues from the south-facing installations are higher than for the bifacials. However, at installation capacities of around 10 kW and 12 kW, the BiW and BiE configurations surpass that of the south-facing installation. This implies that BiE and BiW installations offer better financial returns from energy sold than south-facing installations in scenarios where higher capacities are feasible. Similar to the incremental bid energy plot, the incremental revenue plot in Figure 14 shows diminishing marginal returns on capacities beyond 15 kW as indicated by the plateau observed in revenue growth.
Furthermore, Figure 15 illustrates the sell-to-curtail energy ratio for all installation types at various capacities. From the figure, the ratio is initially high, below 5 kW for south-facing and 6 kW for bifacial installations, respectively, due to zero curtailment. Beyond these capacities, the ratio decreases sharply as curtailment begins and then saturates at higher capacities. This indicates that curtailment becomes more significant as installed capacity increases, emphasizing the need for careful planning when selecting installation capacities to minimize curtailment while maximizing energy sales.

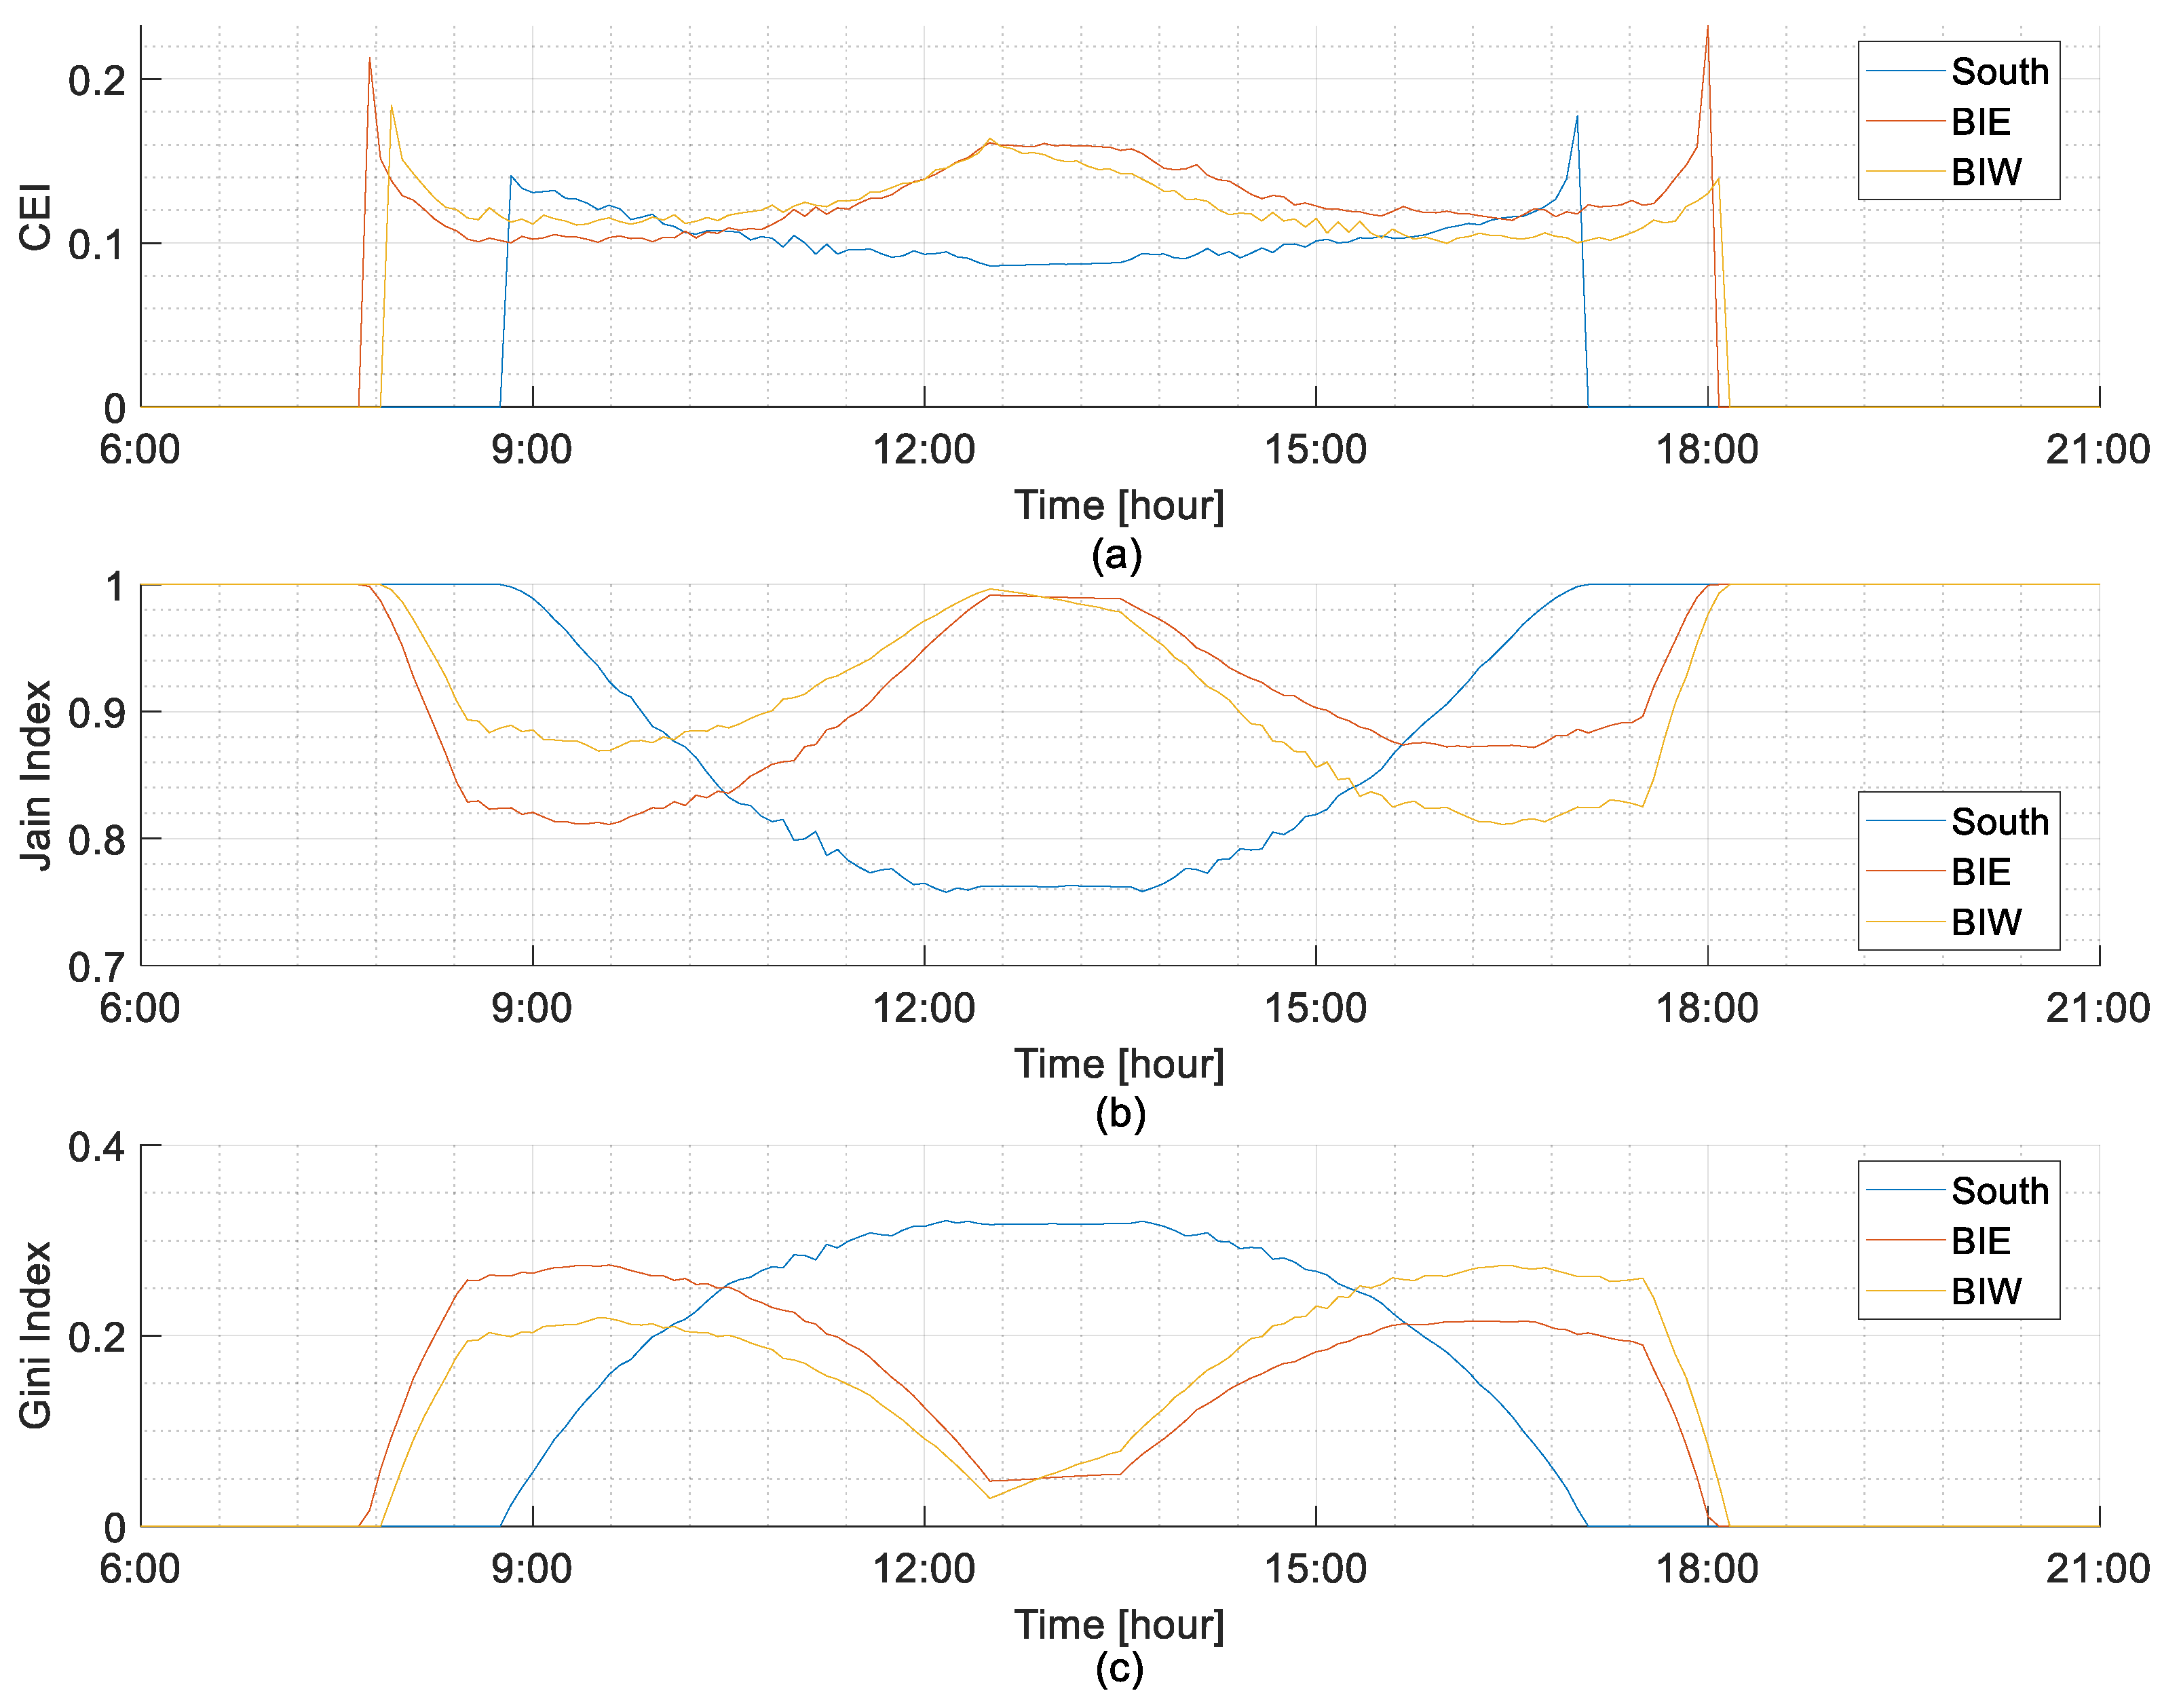
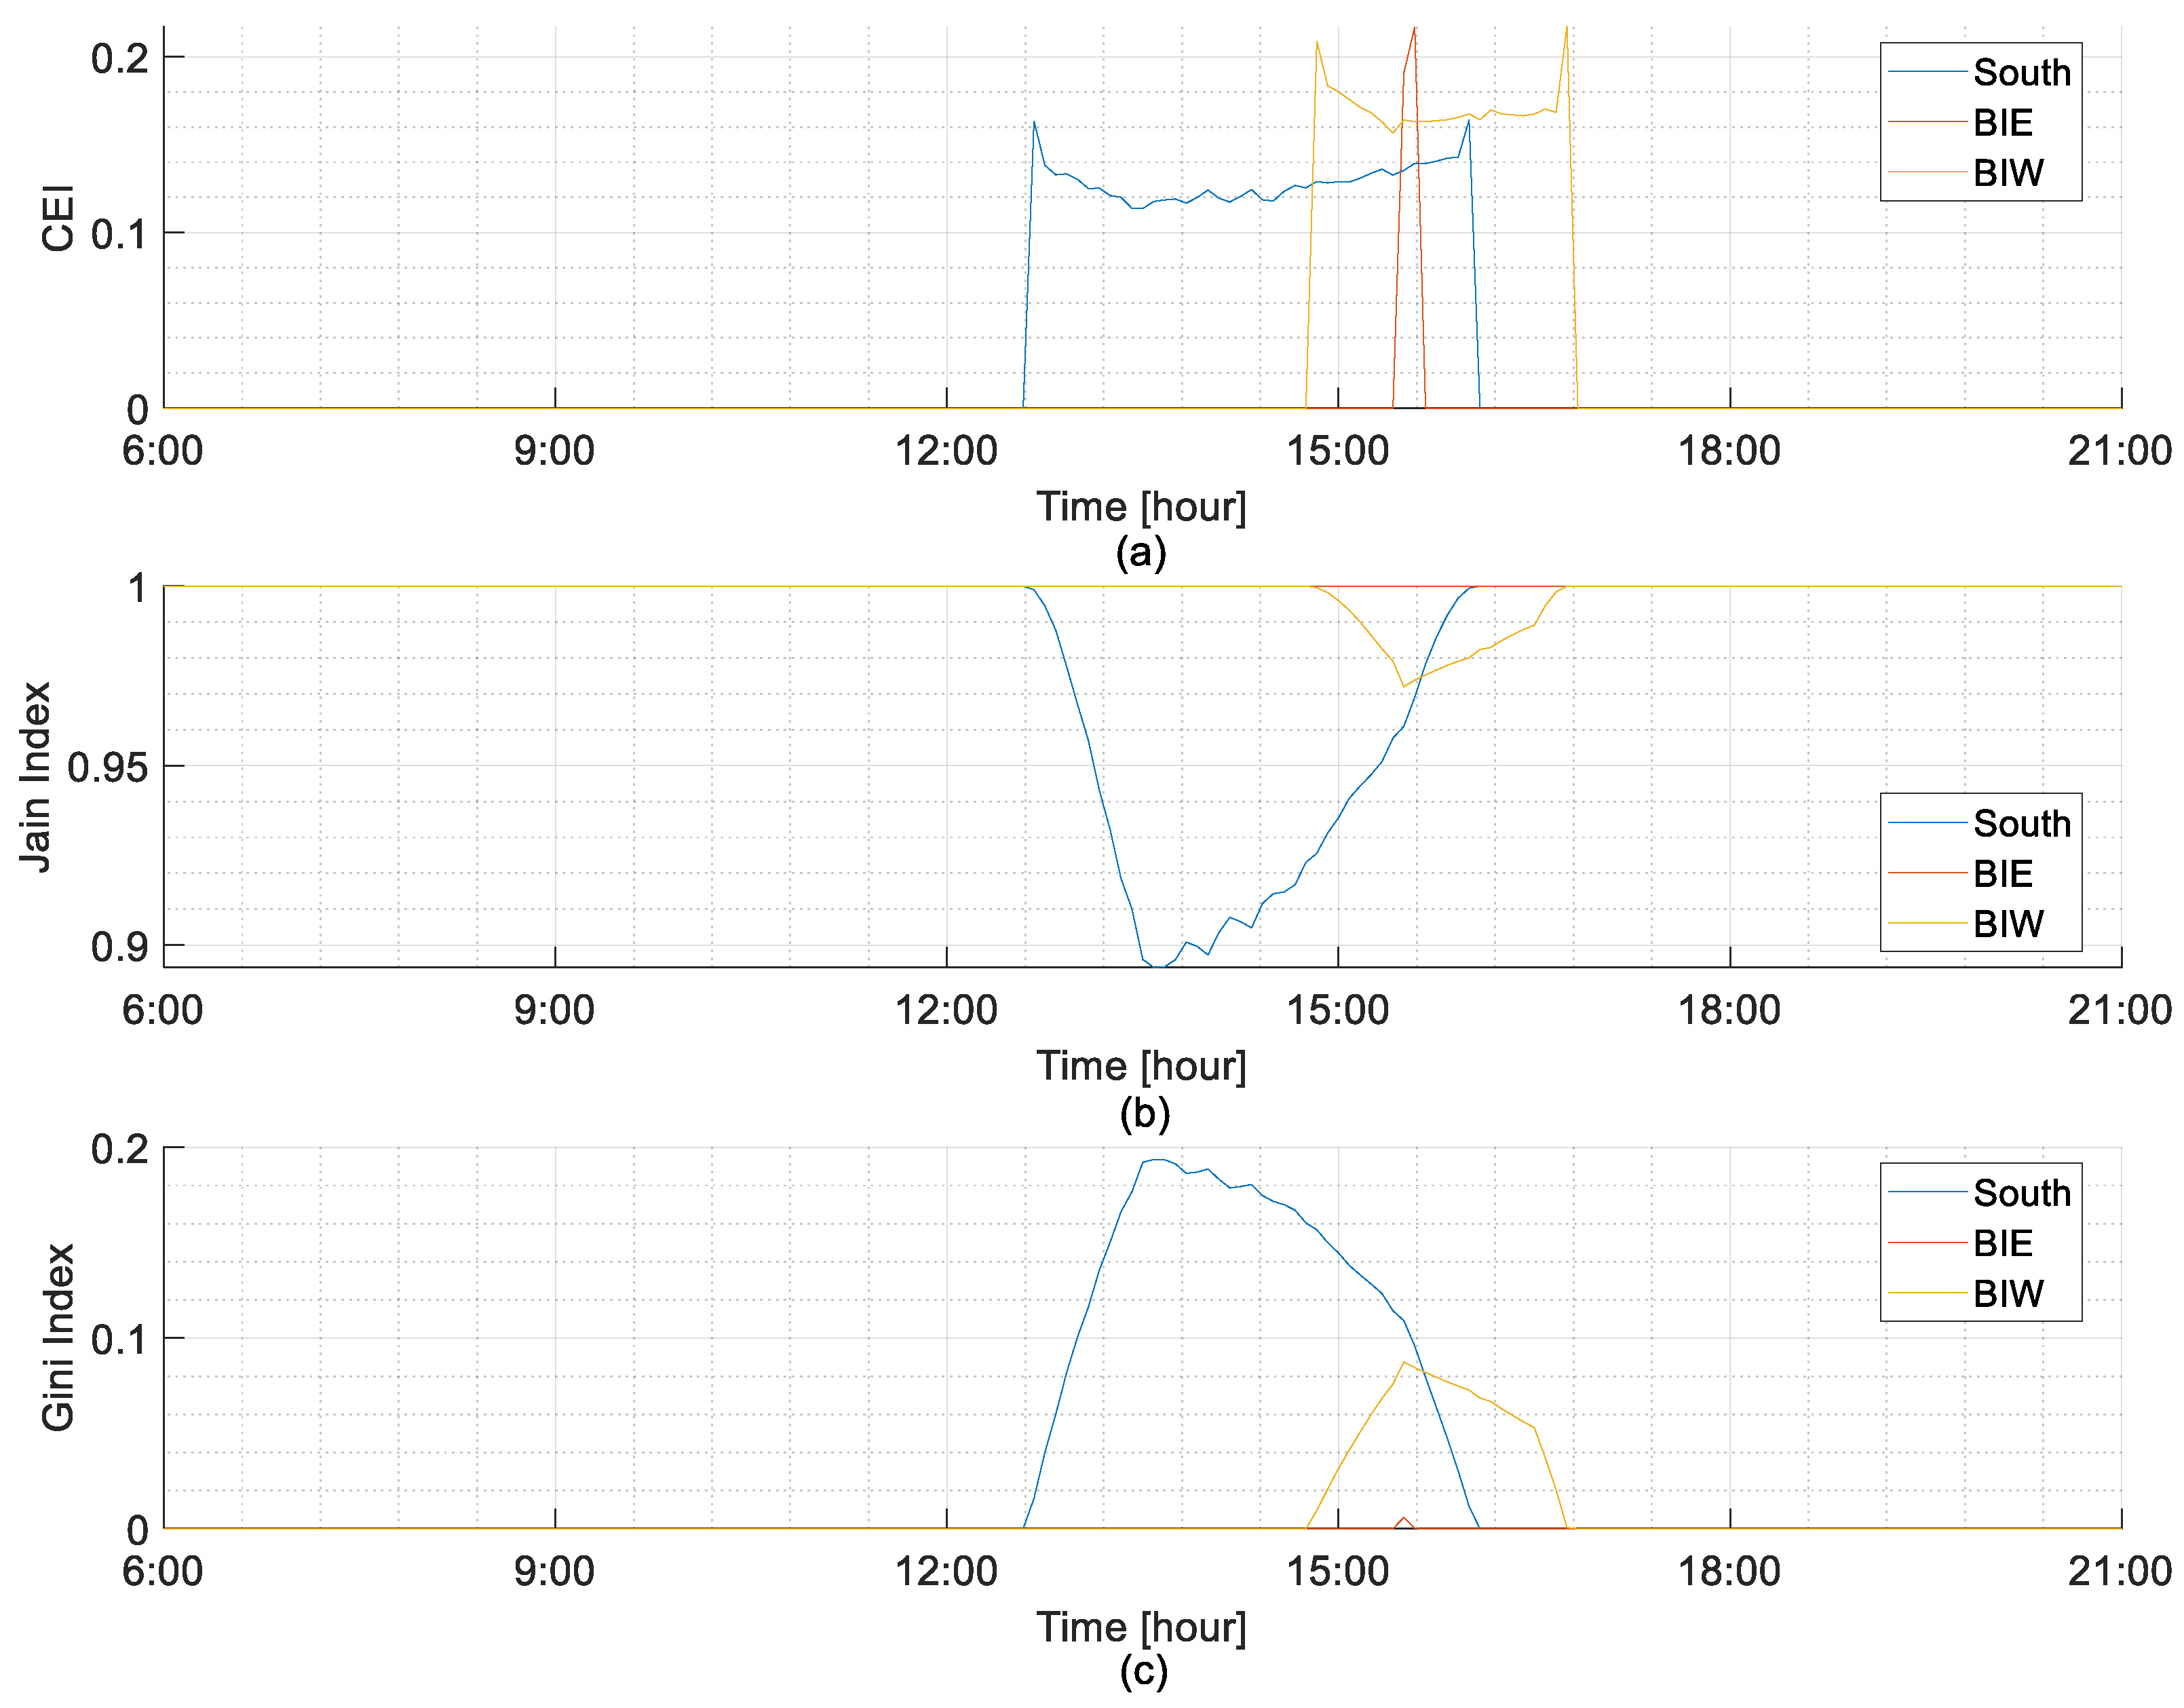
5.2. Fairness Evaluation at 10 kW Installation Capacity

Since implementing Japan’s Feed-in-Tariff scheme, the capacity for residential PV integration has expanded to 10 kW. Therefore, this study focused on a PV installation capacity of 10 kW (reflecting the policy upper limit) and assessed fairness in energy curtailment across the different types of installation. The results include analyses of the day with the highest curtailed energy across all the installation types and the day with the lowest curtailed energy for each bifacial configuration.

5.2.1. Highest Curtailed Energy Day

Figure 16 depicts the fairness index plots for 17 April 2022, which was the day with the highest curtailed energy in all three installation types. The generated PV output plot for this day is shown in Figure 7. From the curtailment index plot, bifacial installations had a more spread-out curtailment pattern and higher values than south-facing installations between 10:30 a.m. and 3:30 p.m. This implies that bifacials generated more energy compared to south-facing installation and, as a result, experience higher curtailment. From the Jain fairness index plot, it is observed that the south-facing installation had lower values than the bifacials between 10:30 a.m. and 3:20 p.m. whose values were close to 1 between 12:30 p.m. and 1:30 p.m. This indicates that the bifacials maintained fairness in the ratio of bus sellable to surplus PV energy even at midday. Furthermore, the Gini index plot, which quantified fairness in terms of bus sellable energy, also showed that bifacials effectively maintained fairness in sellable energy during this period compared to the south-facing installation as indicated by the lower Gini values around midday. This is attributed to the bimodal generation profiles of BiE and BiW systems, which inherently promotes fairness by distributing curtailment actions across two time windows (morning and evening). This prevents downstream buses from being disproportionately affected during midday overvoltage events. The bid and curtailed energy values for the day are shown in Figure 17. Compared to the bid and curtailed energy amounts of the mono-facial south-facing installation, the BiE and BiW installations increased bid energy by 815 kWh (7.2%) and 787 kWh (7.0%), respectively, while decreasing curtailed energy by 1566 kWh (27.9%) and 1499 kWh (26.7%), respectively.

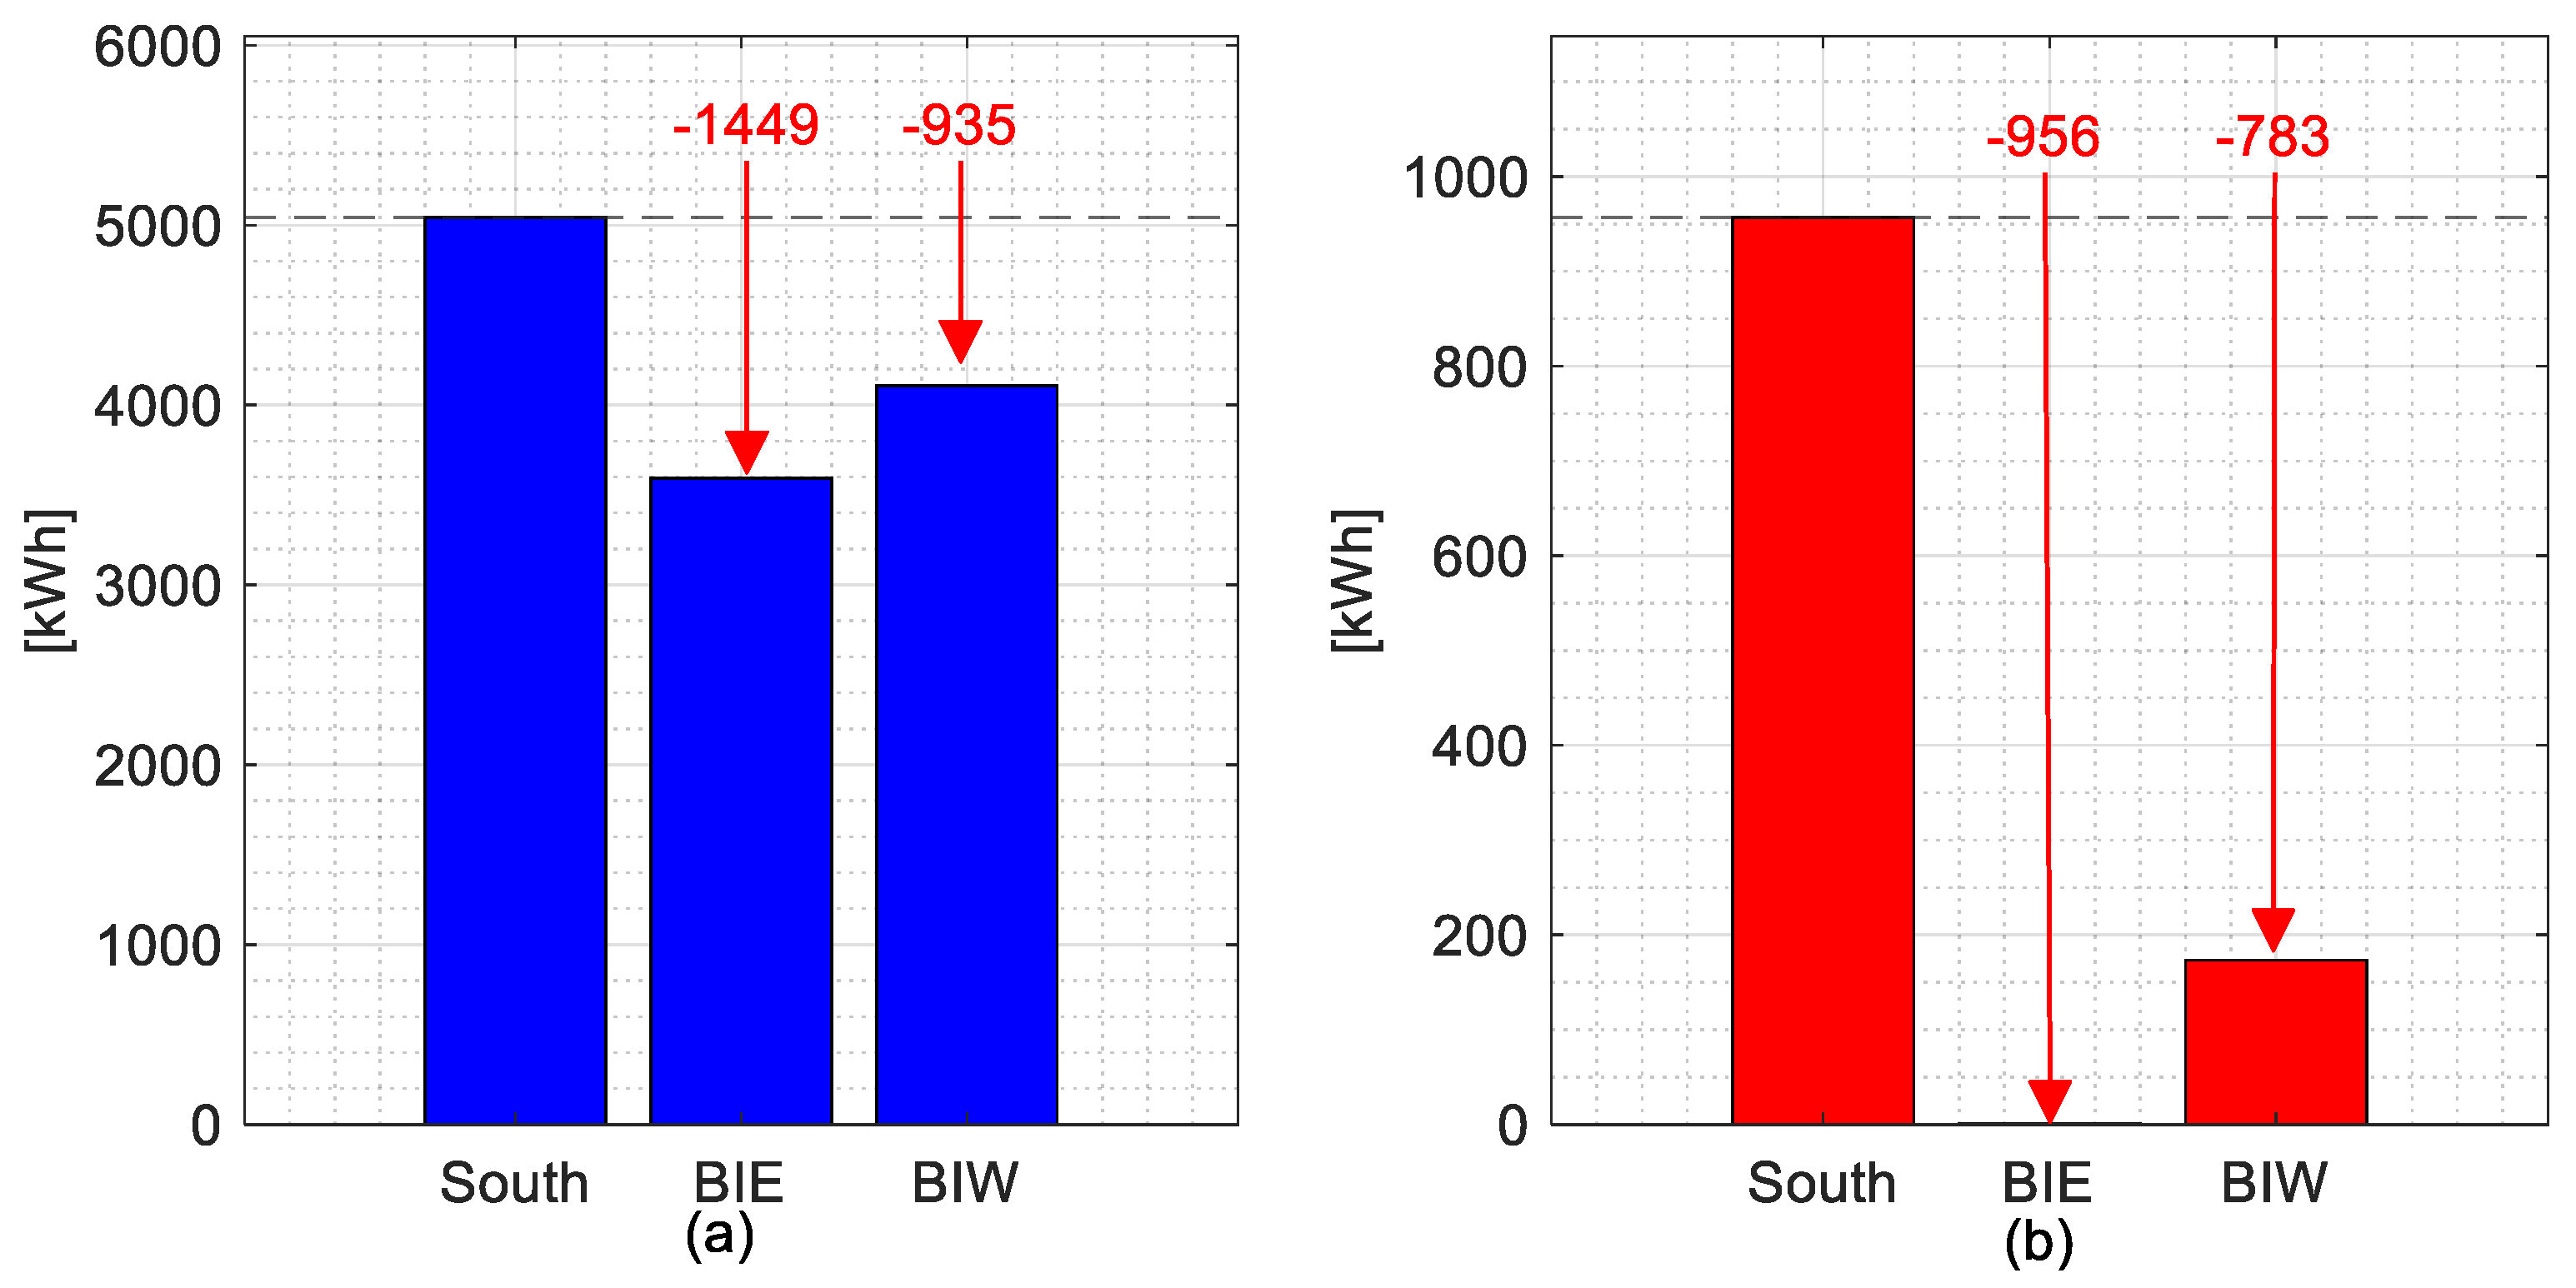
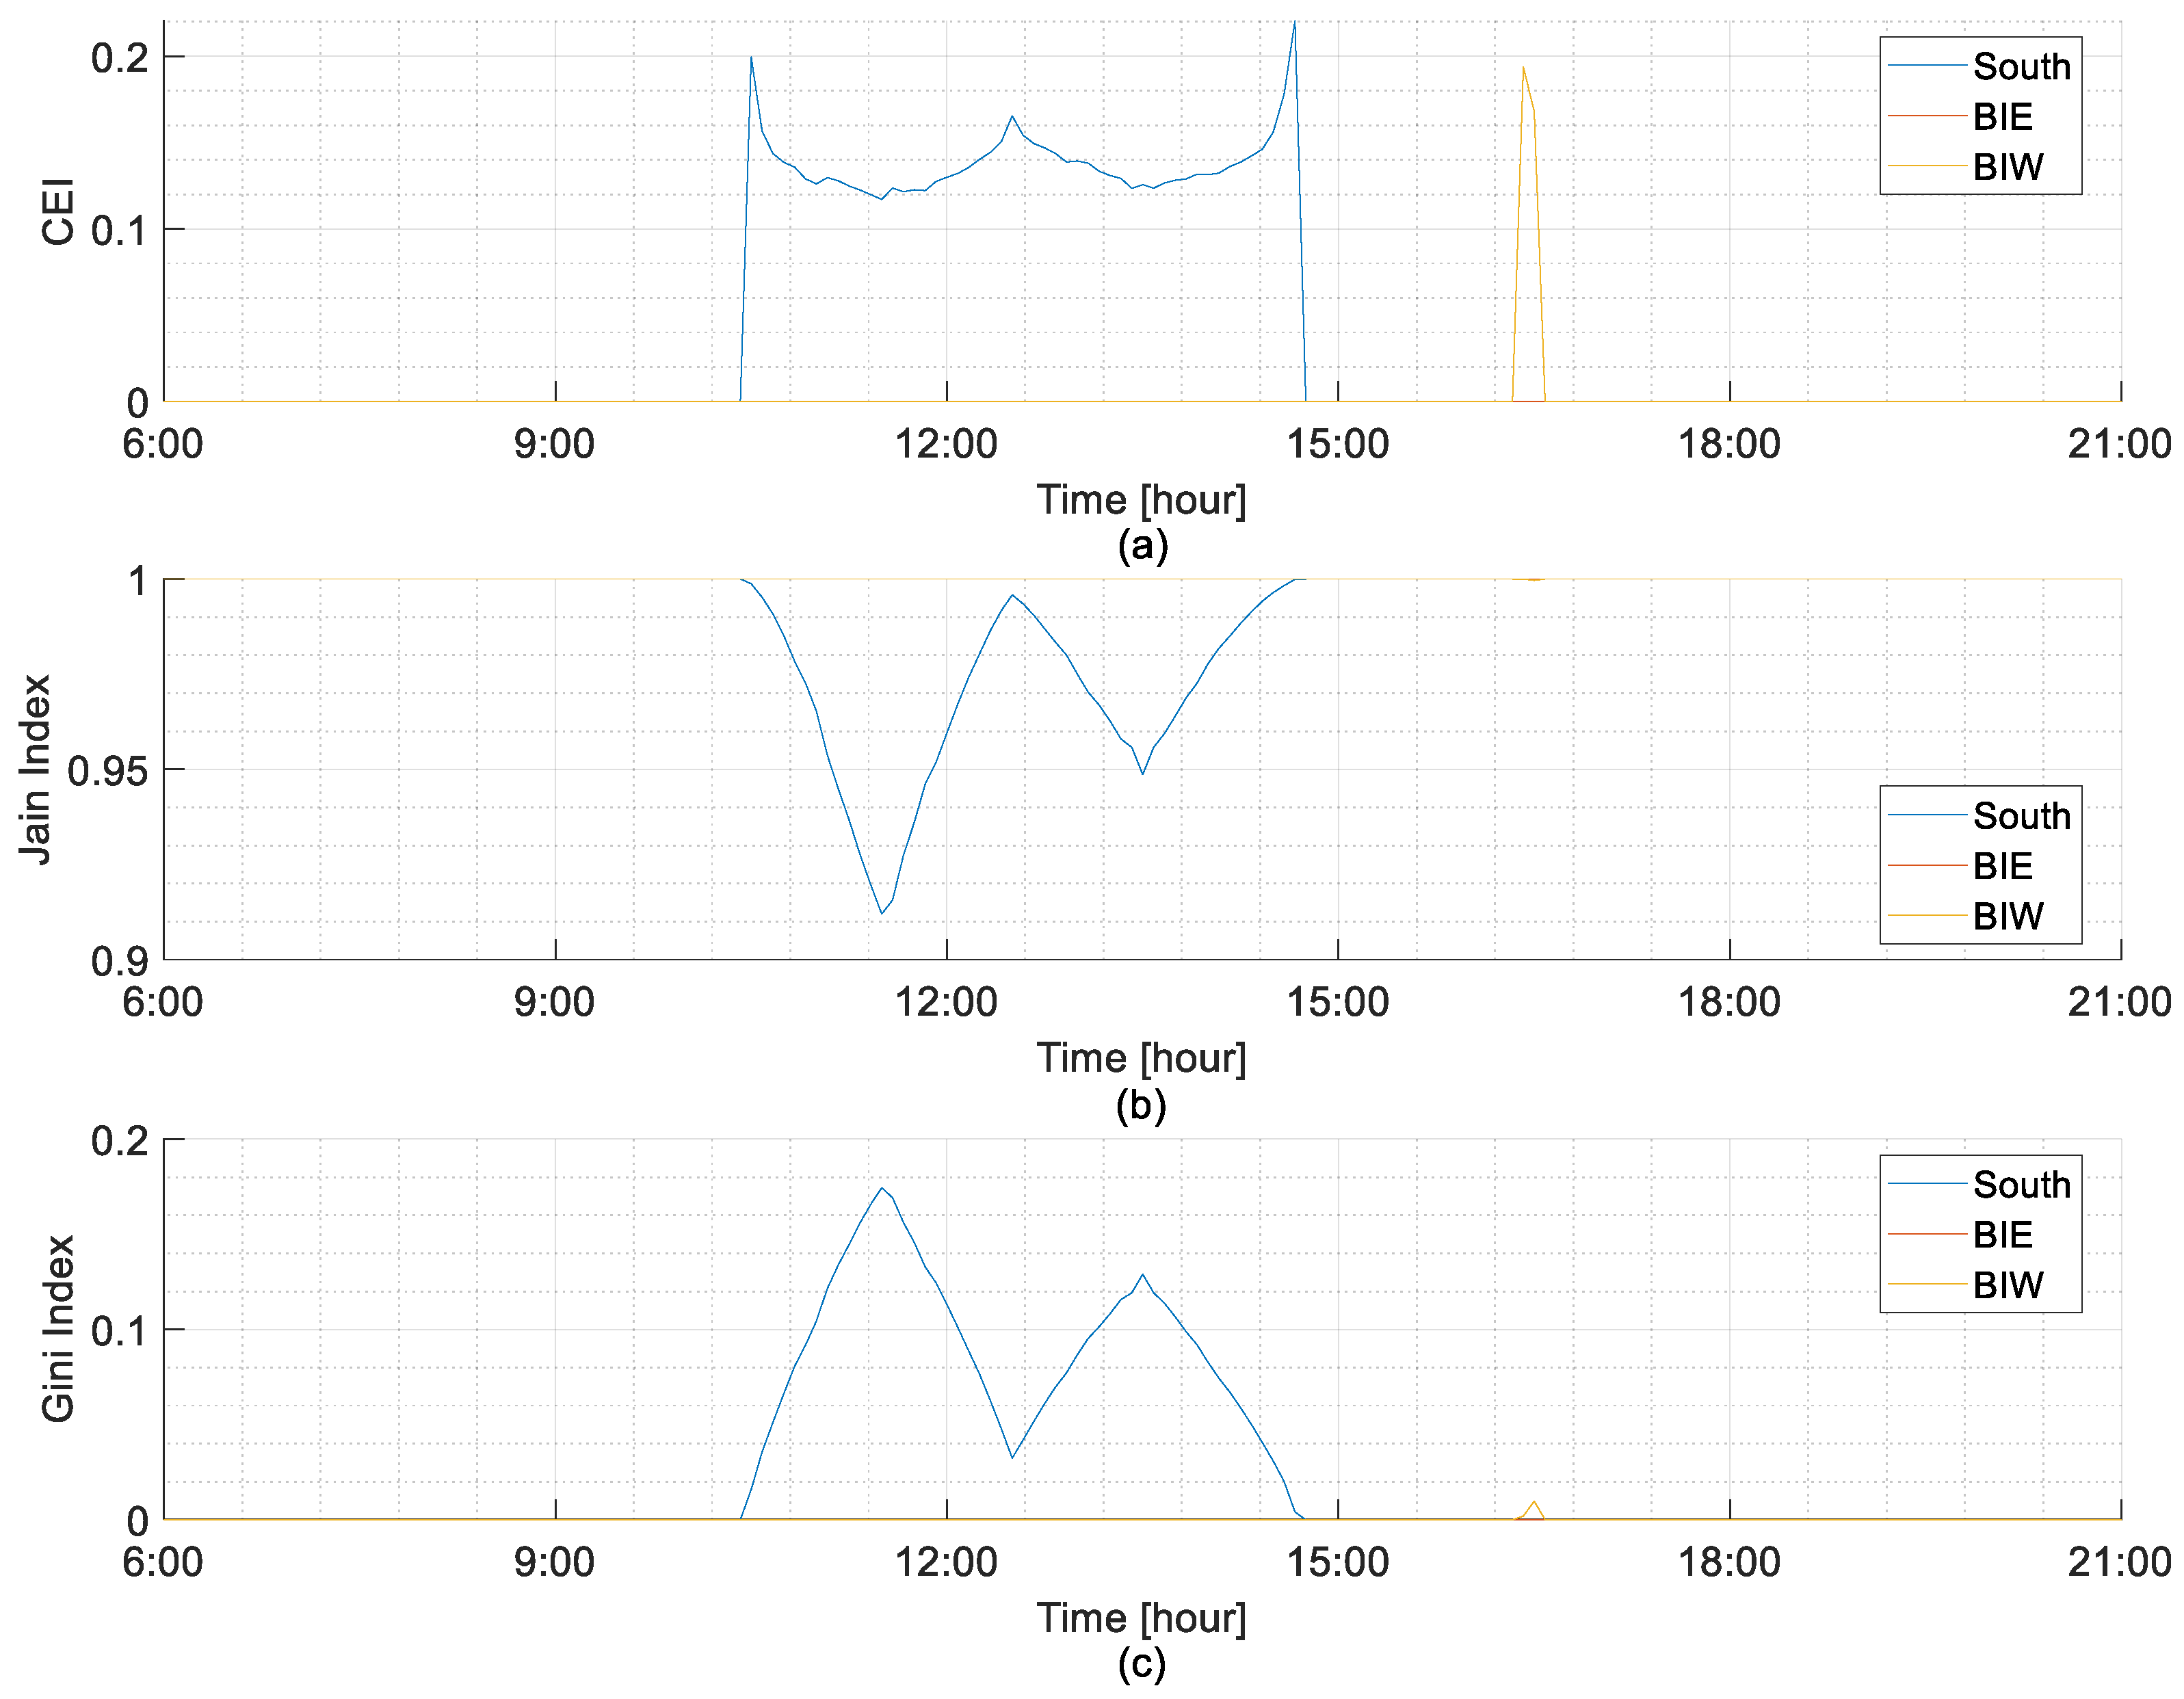
5.2.2. Lowest Curtailed Energy Days Considering BiE and BiW Installations

Figure 18 illustrates the fairness index plots for 28 February 2022, the day with the lowest curtailed energy for the BiE configuration. As shown in the curtailment index plots, the BiE and BiW installations achieved perfect fairness at all periods except from 3:25 p.m. to 3:40 p.m. and 2:45 p.m. to 4:50 p.m., respectively. On the other hand, the south-facing installation underwent curtailment between 12:35 p.m. and 4:05 p.m. These observations imply that the bifacials are more effective in managing energy distribution without significant curtailment during periods with low solar intensity. Additionally, the BiE configuration achieved near perfect fairness in terms of the ratio of bus sellable to surplus energy and the equitable distribution of sellable energy as shown by the Jain and Gini index plots, respectively. The absence of midday generation peaks in BiE and BiW systems ensures that even during low solar intensity, curtailment is minimized and fairly distributed across buses, avoiding localized overvoltage. The bid and curtailed energy amounts for the day across the three installations are presented in Figure 19. The BiE and BiW installations reduced curtailed energy by 956 kWh (99.9%) and 783 kWh (81.9%), respectively, while their bid energy decreased by 1449 kWh (28.7%) and 935 kWh (18.5%) compared to the south-facing installation.
Similarly, Figure 20 presents the fairness index plots for 18 October 2022, the day with the lowest curtailed energy for the BiW configuration. From the curtailment index, both bifacial orientations achieved perfect fairness across the day except from 4:20 p.m. to 4:35 p.m. In contrast, the south-facing installation underwent curtailment between 10:25 a.m. and 2:45 p.m., which was unevenly distributed among the buses. Furthermore, as illustrated by the Jain and Gini index plots, bifacial installations exhibited a better performance in terms of both fairness and curtailment management compared to the south-facing installation. For the day’s bid and curtailed energies, as illustrated by Figure 21, the BiE and BiW configurations reduced curtailed energies by 708 kWh (100%) and 707 kWh (99.8%), respectively, while bid energies decreased by 1571 kWh (24.3%) and 1423 kWh (22.0%) compared to the south-facing installation. Therefore, the temporal shift in generation reduced midday grid stress, allowing even downstream buses to inject energy without triggering overvoltage as evidenced by near-zero curtailed energy for the bifacials in Figure 21b.

6. Conclusions

In this study, the installation of a vertical set of east–west-facing bifacial PVs (BiE and BiW) for residential PV systems was proposed as a strategy to minimize curtailment and promote fairness in energy curtailment within distribution networks. Through analysis and comparison of the energy output of BiE and BiW installations and traditional mono-facial south-facing PV installations for various capacity sizes from 1 kW to 20 kW, this study demonstrates the effectiveness of bifacial installations in curtailment reduction in grids with highly integrated PV systems.
The results of simulations demonstrated that bifacial installations, especially at larger installation capacities, generate more energy and manage curtailment more efficiently than mono-facial south-facing installations. Their bid energy plots show similar trends, indicating that BiE and BiW configurations will perform nearly the same under similar situations. At higher capacity (more than 15 kW), the plots of incremental curtailed energy, bid energy, income from bid energy, and sell-to-curtail energy ratio show diminishing returns from sellable energy. This emphasizes the importance of optimizing system size in order to maximize energy sales revenue and operational efficiency.
Furthermore, fairness index plots evaluated at a 10 kW installation capacity demonstrate bifacial installations’ superior performance in maintaining fairness in energy distribution without considerable curtailment during both low and high solar intensity periods, highlighting their suitability for residential settings. On the day with highest curtailment, the BiE and BiW installations increased bid energies by 815 kWh (7.2%) and 787 kWh (7.0%), respectively, while reducing curtailed energy by 1566 kWh (27.9%) and 1499 kWh (26.7%), respectively, compared to the mono-facial south-facing installation. During the day with the lowest curtailed energy for the BiE configuration, the BiE and BiW installations reduced curtailed energy by 956 kWh (99.9%) and 783 kWh (81.9%), respectively, although this was accompanied by a decrease in bid energy by 1449 kWh (28.7%) and 935 kWh (18.5%). Similarly, under the BiW configuration, the BiE and BiW installations reduced curtailed energy by 708 kWh (100%) and 707 kWh (99.8%), respectively, with corresponding decreases in bid energy of 1571 kWh (24.3%) and 1423 kWh (22.0%).
While this study focused on a radial distribution network in Japan, the principles of dual-peak generation profiles and fairness-driven curtailment management could extend to other regions with similar grid constraints or high solar penetration. However, variations in grid topology, load profiles, and solar irradiance may affect performance, and broader validation across diverse systems is recommended. Future work will include cost–benefit analysis comparing bifacial and mono-facial installations over their lifecycle considering initial costs, maintenance, and potential energy sale revenues. Additionally, an energy management system that predicts energy generation and demand will be developed to dynamically manage the distribution and curtailment of energy to improve fairness and efficiency. Future studies will also investigate the impacts of partial shading on bifacial PV performance to refine rear-side irradiance models under real-world conditions. Moreover, fairness evaluation will be extended beyond the 10 kW installation capacity to a broader range of capacities (both below and above the threshold) to assess the scalability and generality of these results. Further models will explore the integration of Unit Commitment (UC), voltage control, and fairness, as well as market factors like pricing and generation bids, to enhance the integration of PV systems into modern networks.

Author Contributions

Conceptualization, F.M.I., R.S. and M.I.; Methodology, F.M.I. and M.I.; Software, F.M.I.; Validation, R.S., A.T. and G.A.F.; Formal analysis, F.M.I. and R.S.; Investigation, R.S., A.T. and G.A.F.; Resources, M.I.; Data curation, F.M.I.; Writing—original draft, F.M.I.; Writing—review & editing, F.M.I.; Visualization, M.I. and G.A.F.; Supervision, R.S., A.T., M.I. and G.A.F. All authors have read and agreed to the published version of the manuscript.

Funding

This research received no external funding.

Data Availability Statement

The data presented in this study are available on request from the corresponding authors. The data are not publicly available due to privacy restrictions.

Conflicts of Interest

The authors declare no conflict of interest.

References

  1. Masson, G.; Bosch, E.; van Rechem, A.; de l’Epine, M.; Kaizuka, I.; Jäger-Waldau, A.; Donoso, J. Snapshot of Global PV Markets 2023 Task 1 Strategic PV Analysis and Outreach PVPS; IEA: Paris, France, 2023. [Google Scholar]
  2. Liu, M.Z.; Procopiou, A.T.; Petrou, K.; Ochoa, L.F.; Langstaff, T.; Harding, J.; Theunissen, J. On the Fairness of PV Curtailment Schemes in Residential Distribution Networks. IEEE Trans. Smart Grid 2020, 11, 4502–4512. [Google Scholar] [CrossRef]
  3. Alboaouh, K.A.; Mohagheghi, S. Impact of Rooftop Photovoltaics on the Distribution System. J. Renew. Energy 2020, 2020, 4831434. [Google Scholar] [CrossRef]
  4. Anzalchi, A.; Sundararajan, A.; Moghadasi, A.; Sarwat, A. High-Penetration Grid-Tied Photovoltaics: Analysis of Power Quality and Feeder Voltage Profile. IEEE Ind. Appl. Mag. 2019, 25, 83–94. [Google Scholar] [CrossRef]
  5. Yildiz, B.; Stringer, N.; Adams, S.; Samarakoon, S.; Bruce, A.; Macgill, I.; Sproul, A.B. Curtailment and network voltage analysis study. In Proceedings of the 2021 IEEE PES Innovative Smart Grid Technologies—Asia (ISGT Asia), Brisbane, Australia, 5–8 December 2021; p. 5. [Google Scholar] [CrossRef]
  6. Sharma, V.; Aziz, S.M.; Haque, M.H.; Kauschke, T. Effects of high solar photovoltaic penetration on distribution feeders and the economic impact. Renew. Sustain. Energy Rev. 2020, 131, 110021. [Google Scholar] [CrossRef]
  7. O’Shaughnessy, E.; Cruce, J.R.; Xu, K. Too much of a good thing? Global trends in the curtailment of solar PV. Sol. Energy 2020, 208, 1068–1077. [Google Scholar] [CrossRef] [PubMed]
  8. Attarha, A.; Scott, P.; Thiébaux, S. Affinely Adjustable Robust ADMM for Residential DER Coordination in Distribution Networks. IEEE Trans. Smart Grid 2020, 11, 1620–1629. [Google Scholar] [CrossRef]
  9. IEEE Std 1547-2018 (Revision of IEEE Std 1547-2003); IEEE Standard for Interconnection and Interoperability of Distributed Energy Resources with Associated Electric Power Systems Interfaces. IEEE: Piscataway, NJ, USA, 2018; pp. 1–138. [CrossRef]
  10. Grid Connection of Energy Systems via Inverters Part 2: Inverter Requirements. 2015. Available online: https://www.endeavourenergy.com.au/__data/assets/pdf_file/0019/6094/ASNZS-4777.2-2020.pdf (accessed on 29 April 2025).
  11. Alonso, A.M.S.; Arenas, L.D.O.; Brandao, D.I.; Tedeschi, E.; Marafao, F.P. Integrated Local and Coordinated Overvoltage Control to Increase Energy Feed-In and Expand DER Participation in Low-Voltage Networks. IEEE Trans. Sustain. Energy 2022, 13, 1049–1061. [Google Scholar] [CrossRef]
  12. Poudel, S.; Mukherjee, M.; Reiman, A.P. A Fairness-Based Distributed Energy Coordination for Voltage Regulation in Distribution Systems. In Proceedings of the 2022 IEEE Green Technologies Conference (GreenTech), Houston, TX, USA, 30 March–1 April 2022; pp. 45–50. [Google Scholar] [CrossRef]
  13. Alyami, S.; Wang, Y.; Wang, C.; Zhao, J.; Zhao, B. Adaptive Real Power Capping Method for Fair Overvoltage Regulation of Distribution Networks With High Penetration of PV Systems. IEEE Trans. Smart Grid 2014, 5, 2729–2738. [Google Scholar] [CrossRef]
  14. Rankin, M.; Colavizza, B. Export Limits for Embedded Generators Up to 200 kVA Connected at Low Voltage: Standard Operating Procedure; AusNet Services: Southbank, VIC, Australia, 2017. [Google Scholar]
  15. Petrou, K.; Procopiou, A.T.; Gutierrez-Lagos, L.; Liu, M.Z.; Ochoa, L.F.; Langstaff, T.; Theunissen, J.M. Ensuring Distribution Network Integrity Using Dynamic Operating Limits for Prosumers. IEEE Trans. Smart Grid 2021, 12, 3877–3888. [Google Scholar] [CrossRef]
  16. SA Power Networks. LV Management Business Case (Business Case 5.18); Phase 4—2020–25 Regulatory Proposal Supporting Document; SA Power Networks: Adelaide, Australia, 2019. [Google Scholar]
  17. Procopiou, A.T.; Petrou, K.; Ochoa, L.F.; Langstaff, T.; Theunissen, J. Adaptive Decentralized Control of Residential Storage in PV-Rich MV–LV Networks. IEEE Trans. Power Syst. 2019, 34, 2378–2389. [Google Scholar] [CrossRef]
  18. Lankeshwara, G. A Real-time Control Approach to Maximise the Utilisation of Rooftop PV Using Dynamic Export Limits. In Proceedings of the 2021 IEEE PES Innovative Smart Grid Technologies—Asia (ISGT Asia), Brisbane, Australia, 5–8 December 2022; pp. 1–5. [Google Scholar] [CrossRef]
  19. Australian Renewable Energy Agency. Advanced VPP Grid Integration. Available online: https://arena.gov.au/projects/advanced-vpp-grid-integration/ (accessed on 10 December 2023).
  20. Golden, R.; Paulos, B. Curtailment of Renewable Energy in California and Beyond. Electr. J. 2015, 28, 36–50. [Google Scholar] [CrossRef]
  21. O’Shaughnessy, E.; Cruce, J.; Xu, K. Rethinking solar PV contracts in a world of increasing curtailment risk. Energy Econ. 2021, 98, 105264. [Google Scholar] [CrossRef]
  22. Gebbran, D.; Mhanna, S.; Ma, Y.; Chapman, A.C.; Verbič, G. Fair coordination of distributed energy resources with Volt-Var control and PV curtailment. Appl. Energy 2021, 286, 116546. [Google Scholar] [CrossRef]
  23. Golub, G.; Blažauskas, E.; Tsyvenkova, N.; Šarauskis, E.; Jasinskas, A.; Kukharets, S.; Nadykto, V.; Holubenko, A. Determination of the Installation Efficiency of Vertical Stationary Photovoltaic Modules with a Double-Sided ‘East–West’-Oriented Solar Panel. Appl. Sci. 2025, 15, 1635. [Google Scholar] [CrossRef]
  24. Baumann, T.; Nussbaumer, H.; Klenk, M.; Dreisiebner, A.; Carigiet, F.; Baumgartner, F. Photovoltaic systems with vertically mounted bifacial PV modules in combination with green roofs. Sol. Energy 2019, 190, 139–146. [Google Scholar] [CrossRef]
  25. Baricchio, M.; Korevaar, M.; Babal, P.; Ziar, H. Modelling of bifacial photovoltaic farms to evaluate the profitability of East/West vertical configuration. Sol. Energy 2024, 272, 112457. [Google Scholar] [CrossRef]
  26. Agency of Natural Resources and Energy. Approach to the Energy Policy Toward 2030; Document 5, 40th Meeting, Basic Policy Subcommittee, Advisory Committee for Natural Resources and Energy 040_005; Ministry of Economy, Trade and Industry (METI): Tokyo, Japan, 2021. Available online: https://www.enecho.meti.go.jp/committee/council/basic_policy_subcommittee/2021/040/040_005.pdf (accessed on 6 January 2025).
  27. Hao, K.; Ialnazov, D.; Yamashiki, Y. GIS Analysis of Solar PV Locations and Disaster Risk Areas in Japan. Front. Sustain. 2021, 2, 815986. [Google Scholar] [CrossRef]
  28. Jouttijärvi, S.; Lobaccaro, G.; Kamppinen, A.; Miettunen, K. Benefits of bifacial solar cells combined with low voltage power grids at high latitudes. Renew. Sustain. Energy Rev. 2022, 161, 112354. [Google Scholar] [CrossRef]
  29. Damiani, A.; Ishizaki, N.N.; Sasaki, H.; Feron, S.; Cordero, R.R. Exploring super-resolution spatial downscaling of several meteorological variables and potential applications for photovoltaic power. Sci. Rep. 2024, 14, 7254. [Google Scholar] [CrossRef]
  30. Ghosh, A. Nexus between agriculture and photovoltaics (agrivoltaics, agriphotovoltaics) for sustainable development goal: A review. Sol. Energy 2023, 266, 112146. [Google Scholar] [CrossRef]
  31. Miskin, C.K.; Li, Y.; Perna, A.; Ellis, R.G.; Grubbs, E.K.; Bermel, P.; Agrawal, R. Sustainable co-production of food and solar power to relax land-use constraints. Nat. Sustain. 2019, 2, 972–980. [Google Scholar] [CrossRef]
  32. Imran, H.; Riaz, M.H. Investigating the potential of east/west vertical bifacial photovoltaic farm for agrivoltaic systems. J. Renew. Sustain. Energy 2021, 13, 033502. [Google Scholar] [CrossRef]
  33. Duffie, J.A.; Beckman, W.A. Available Solar Radiation. In Solar Engineering of Thermal Processes, 4th ed.; John Wiley & Sons, Ltd.: Hoboken, NJ, USA, 2013; pp. 43–137. [Google Scholar] [CrossRef]
  34. Yang, D. Solar radiation on inclined surfaces: Corrections and benchmarks. Sol. Energy 2016, 136, 288–302. [Google Scholar] [CrossRef]
  35. Liu, B.; Jordan, R. Daily insolation on surfaces tilted towards equator. ASHRAE J. 1961, 10, 5047843. Available online: https://www.osti.gov/biblio/5047843 (accessed on 17 April 2025).
  36. Ledesma, J.R.; Almeida, R.; Martinez-Moreno, F.; Rossa, C.; Martín-Rueda, J.; Narvarte, L.; Lorenzo, E. A simulation model of the irradiation and energy yield of large bifacial photovoltaic plants. Sol. Energy 2020, 206, 522–538. [Google Scholar] [CrossRef]
  37. Alam, M.; Gul, M.S.; Muneer, T. Performance analysis and comparison between bifacial and monofacial solar photovoltaic at various ground albedo conditions. Renew. Energy Focus 2023, 44, 295–316. [Google Scholar] [CrossRef]
  38. IEC TS 60904-1-2; Photovoltaic Devices-Part 1-2: Measurement of Current-Voltage Characteristics of Bifacial Photovoltaic (PV) Devices, IEC TS 60904-1-2. International Electrotechnical Commission: Geneva, Switzerland, 2019.
  39. Stein, J.; Reise, C.; Castro, J.B.; Friesen, G.; Mauger, G.; Urrejola, E.; Ranta, S. Bifacial Photovoltaic Modules and Systems: Experience and Results from International Research and Pilot Applications; SAND-2021-4835R, IEA-PVPS T13-14:2021, 1779379; IEA: Paris, France, 2021. [Google Scholar] [CrossRef]
  40. Dhimish, M. Performance Ratio and Degradation Rate Analysis of 10-Year Field Exposed Residential Photovoltaic Installations in the UK and Ireland. Clean Technol. 2020, 2, 170–183. [Google Scholar] [CrossRef]
  41. Nordmann, T.; Clavadetscher, L.; van Sark, W.; Green, M. Analysis of Long-Term Performance of PV Systems; IEA: Paris, France, 2015. [Google Scholar]
  42. Dehwah, A.H.A.; Asif, M.; Budaiwi, I.M.; Alshibani, A. Techno-Economic Assessment of Rooftop PV Systems in Residential Buildings in Hot–Humid Climates. Sustainability 2020, 12, 10060. [Google Scholar] [CrossRef]
  43. Agency for Natural Resources and Energy. Guidelines on Technical Requirements for Grid Connection to Ensure Power Quality; Guideline (Revised Edition); Agency for Natural Resources and Energy, Ministry of Economy, Trade and Industry: Tokyo, Japan, 2023.
  44. Bucher, C.; Chen, S.; Adinolfi, G.; Guerrero-Lemus, R.; Ogasawara, Y.; Heilscher, G.; McGill, I.; El Hamaoui, M.S.; Kondzialka, C.; Mende, D.; et al. Active Power Management of Photovoltaic Systems—State of the Art and Technical Solutions; Task 14, Report IEA-PVPS T14-15:2024; International Energy Agency, Photovoltaic Power Systems Programme (IEA PVPS): Paris, France, 2024; Available online: https://iea-pvps.org/wp-content/uploads/2024/01/IEA-PVPS-T14-15-REPORT-Active-Power-Management.pdf (accessed on 17 April 2025).
  45. Wei, Z.; de Nijs, F.; Li, J.; Wang, H. Model-Free Approach to Fair Solar PV Curtailment Using Reinforcement Learning. In Proceedings of the 14th ACM International Conference on Future Energy Systems, Orlando, FL, USA, 20–23 June 2023; pp. 14–21. [Google Scholar] [CrossRef]
  46. Alyami, S.; Wang, C. Renewable Curtailment Fairness in Distribution Networks: Application of Division Rules. In Proceedings of the 2022 IEEE Power & Energy Society General Meeting (PESGM), Denver, CO, USA, 17–21 July 2022; pp. 1–5. [Google Scholar] [CrossRef]
  47. Gupta, R.K.; Molzahn, D.K. Analysis of Fairness-promoting Optimization Schemes of Photovoltaic Curtailments for Voltage Regulation in Power Distribution Networks. arXiv 2024, arXiv:2404.00394. [Google Scholar] [CrossRef]
  48. Vassallo, M.; Benzerga, A.; Bahmanyar, A.; Ernst, D. Fair Reinforcement Learning Algorithm for PV Active Control in LV Distribution Networks. In Proceedings of the 2023 International Conference on Clean Electrical Power (ICCEP), Terrasini, Italy, 27–29 June 2023; pp. 796–802. [Google Scholar] [CrossRef]
  49. Advanced Collaborative Research Organization for Smart Society (ACROSS), Waseda University. ‘JST-CREST 126 Distribution Feeder Model’ Is Published. Available online: https://www.waseda.jp/inst/across/news-en/2554 (accessed on 17 April 2025).
  50. Power and Energy Society, The Institute of Electrical Engineers of Japan. Regional Supply System Model (Base Model)—Overview. Available online: https://www.iee.jp/pes/ele_systems/base_model/overview/ (accessed on 17 April 2025).
  51. Fukui Prefecture, Statistics Survey Division. Electricity Consumption and Costs in Fukui Under Rising Prices; FukuStat Statistics Letter; Fukui Prefecture, Statistics Survey Division: Fukui, Japan, 2023. Available online: https://www.pref.fukui.lg.jp/doc/toukei-jouhou/spot/fukustat_d/fil/202307_fukustat.pdf (accessed on 17 April 2025).
  52. Japan Meteorological Agency. Past Weather Data Download Service (ObsDL). Available online: https://www.data.jma.go.jp/risk/obsdl/index.php (accessed on 21 December 2023).
  53. Japan Electric Power Exchange. Japan Electric Power Exchange (JEPX)—Official Website. Available online: https://www.jepx.jp/ (accessed on 12 April 2024).
Figure 1. Comparison of solar output for (a) mono-facial, (b) vertical bifacial east-facing (BiE), and, (c) vertical bifacial west-facing (BiW) systems.
Energies 18 02630 g001
Figure 2. PV installed capacity per land area by country (kW/km2) [26].
Energies 18 02630 g002
Figure 3. Voltage profiles for (a) bus 1 and (b) bus 30.
Energies 18 02630 g003
Figure 4. Model of the distribution network.
Energies 18 02630 g004
Figure 5. Annual load curve for a household.
Energies 18 02630 g005
Figure 6. Hourly load profiles for selected days: (a) 28 February, (b) 17 April, (c) 27 July, and (d) 18 October.
Energies 18 02630 g006
Figure 7. PV output curves for selected days at 10 kW installation capacity: (a) 28 February, (b) 17 April, and (c) 18 October.
Energies 18 02630 g007
Figure 8. Flowchart of the simulation model.
Energies 18 02630 g008
Figure 9. Curtailed energy versus system size for south-facing, BiE, and BiW PV configurations.
Energies 18 02630 g009
Figure 10. Incremental curtailed energy across system sizes.
Energies 18 02630 g010
Figure 11. Bid energy versus system size for south-facing, BiE, and BiW PV configurations.
Energies 18 02630 g011
Figure 12. Incremental bid energy across system sizes.
Energies 18 02630 g012
Figure 13. Revenue versus system size for south-facing, BiE, and BiW PV configurations.
Energies 18 02630 g013
Figure 14. Incremental revenue across system sizes.
Energies 18 02630 g014
Figure 15. Sell-to-curtail energy ratio across all configuration types.
Energies 18 02630 g015
Figure 16. Fairness metrics for 17 April: (a) Curtailment index, (b) Jain’s index, and (c) Gini index.
Energies 18 02630 g016
Figure 17. (a) Bid energy and (b) curtailed energy for 17 April.
Energies 18 02630 g017
Figure 18. Fairness metrics for 28 February: (a) Curtailment index, (b) Jain index, and (c) Gini index.
Energies 18 02630 g018
Figure 19. (a) Bid energy and (b) curtailed energy for 28 February.
Energies 18 02630 g019
Figure 20. Fairness metrics for 18 October: (a) Curtailment index, (b) Jain index, and (c) Gini index.
Energies 18 02630 g020
Figure 21. (a) Bid energy and (b) curtailed energy for 18 October.
Energies 18 02630 g021
Table 1. Data for the distribution network.
ParameterValue
LRT installed capacity10 MVA
Reference voltage6.6 kV
Line typeALOE32
Line impedance0.928 + j 0.415 Ω/km
Susceptance2.844 × 10−6 S/km
Disclaimer/Publisher’s Note: The statements, opinions and data contained in all publications are solely those of the individual author(s) and contributor(s) and not of MDPI and/or the editor(s). MDPI and/or the editor(s) disclaim responsibility for any injury to people or property resulting from any ideas, methods, instructions or products referred to in the content.

