Article

Analysis of the Operational Reliability of Different Types of Switching Substations Using the Monte Carlo Method

Faculty of Energy Technology, University of Maribor, Hočevarjev trg 1, 8270 Krško, Slovenia
*
Author to whom correspondence should be addressed.
Energies 2024, 17(13), 3142; https://doi.org/10.3390/en17133142
Submission received: 27 May 2024 / Revised: 17 June 2024 / Accepted: 24 June 2024 / Published: 26 June 2024
(This article belongs to the Collection Featured Papers in Electrical Power and Energy System)

Abstract

:
This study investigates the operational reliability of different types of switching substations within the context of power systems, employing the Monte Carlo method for analysis. The research focuses on evaluating the reliability of high-voltage substations, including single-busbar systems, double-busbar systems, and switchgears with a ring-type power supply. By conducting simulations and analyzing statistical data on device reliability, the study aims to identify the most reliable implementation of switching substations. The results are presented through graphical representations and comparative tables, highlighting the impact of factors such as the number of switching elements and their connection on operational reliability. The findings indicate that configurations with a greater number of busbars and a parallel connection of switching elements exhibit higher operational reliability. The study provides insights to inform decision-making in the construction of new switching substations, emphasizing the importance of stable operation within power systems.

1. Introduction

Ensuring the reliability of power systems, especially within the framework of power grids, is crucial, with switchgears playing a pivotal role in this domain [1,2]. This article investigates the operational reliability of high-voltage substations, specifically focusing on switching substations (switchgears). While various terms such as high-voltage substations or power substations are used interchangeably in the literature, they consistently serve the function of distributing and transforming electrical energy. Switching substations, without power transformers, primarily consist of switching devices and busbars.
Analyzing the reliability of power systems employs diverse methodologies. Notably, authors in [3] propose a prioritization method for switchgear maintenance that integrates equipment failure mode analysis with integrated risk assessment. This approach optimizes maintenance strategies by considering factors such as failure probability, impact on the power grid, and cost-efficiency, demonstrated through case studies on 12 kV substations. Meanwhile, Ref. [4] conducts a comprehensive survey on the reliability of electrical network systems, examining the implications of integrating new and renewable energy sources. They emphasize the significance of the Monte Carlo method in power system analysis, which is widely applied across the field.
Furthermore, Ref. [5] introduces the Monte Carlo simulation method to evaluate reliability indicators such as the average service availability index (ASAI), system average interruption frequency index (SAIFI), and expected energy not supplied (EENS). This methodology simulates random behaviors, including failures in control, communication, and protection systems, to compute these indices at load points.
Assessing the health of switchgears is critical, as degraded equipment poses threats to grid security and reliability [6]. Numerous studies, including [7,8,9,10], explore various aspects of switchgear health assessment, using methods from contact resistance measurement to vibration signal analysis and partial discharge measurement.
Moreover, Ref. [6] provides insights into switchgear asset management within power grids, highlighting condition monitoring indicators and methodologies for health index assessment. Additionally, Ref. [11] proposes an innovative approach to assess power system reliability indices by combining Monte Carlo simulation with Multilabel Radial Basis Function classifiers, enhancing accuracy through multiple class assignments.
In summary, the current research reflects a growing interest in applying probabilistic methods to model and simulate switching substation performance under various operational scenarios. However, a comprehensive comparison of different switching substation types remains a gap in the literature.
This study aims to fill this gap by applying the Monte Carlo method to assess the operational reliability of various switching substation configurations. The primary objective is to determine which configuration offers the highest reliability and probability of uninterrupted energy transfer.
In the analysis, we consider single-busbar systems, double-busbar systems, and switchgears with ring-type power supply configurations. These include
Single-Busbar Systems (SBS):
  • SBS;
  • SBS with auxiliary bus;
  • SBS with one active incoming and outgoing field;
  • SBS with two active incoming and outgoing fields;
  • SBS with one active incoming and outgoing field with an auxiliary bus;
  • SBS with two active incoming and outgoing fields with an auxiliary bus;
  • SBS with withdrawable circuit breaker;
  • SBS with withdrawable circuit breaker with one active incoming and outgoing field;
  • SBS with withdrawable circuit breaker with two active incoming and outgoing fields.
Double-Busbar Systems (DBS):
  • DBS;
  • DBS with auxiliary bus;
  • DBS with one active incoming and outgoing field;
  • DBS with two active incoming and outgoing fields;
  • DBS with withdrawable circuit breaker;
  • DBS with withdrawable circuit breaker with one active incoming and outgoing field;
  • DBS with withdrawable circuit breaker with two active incoming and outgoing fields;
  • DBS with Bypass Disconnector (all configurations).
Switchgears with Ring-Type Power Supply:
  • Switchgear with ring-type power supply;
  • Switchgear with ring-type power supply with one active incoming and outgoing field;
  • Switchgear with ring-type power supply with two active incoming and outgoing fields.
The aim of this research is to evaluate, based on the examination of the obtained results for individual types of switchgears, which design is the most reliable or has a higher probability of energy transmission.

2. Switchgear

Various factors influence the selection of switchgears, with available space being a primary consideration. However, decisions should prioritize desired system reliability and the facility’s importance. It is crucial not to prioritize minimizing initial costs in public procurement without assessing potential operational consequences, particularly for production facilities where downtime due to an improperly selected switchgear can be costly. Economic evaluations should weigh the financial costs of potential outages, with investment in additional equipment being minimal compared to potential losses during the life cycle, especially during peak production periods [4].
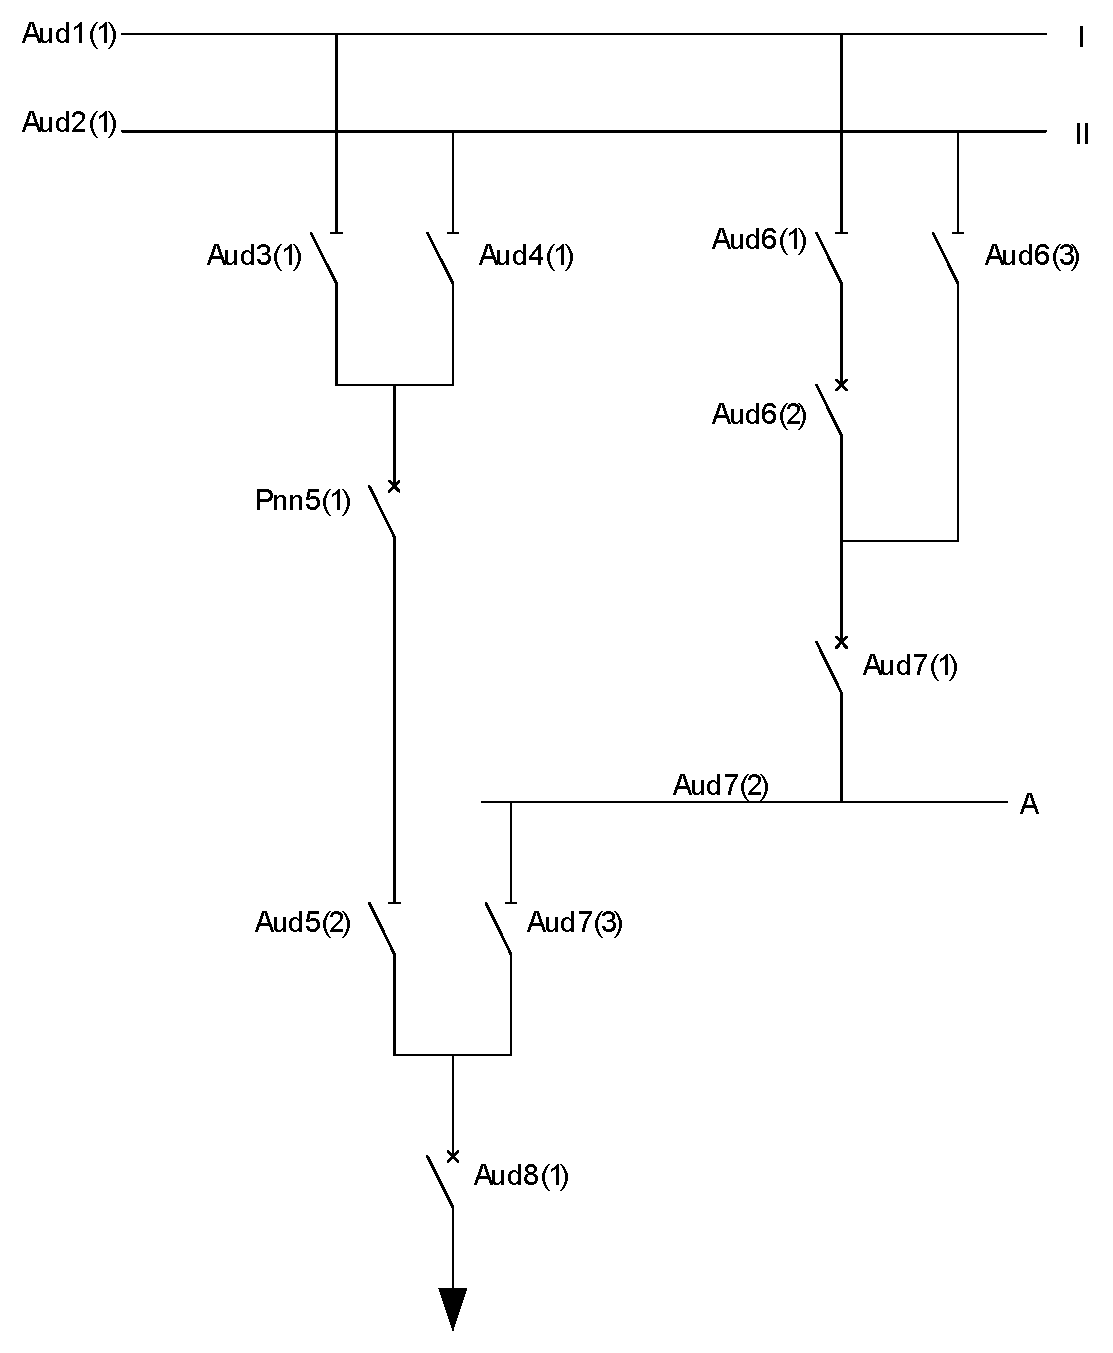
Single-line diagrams depict various options for busbar systems and equipment used in switchgears, with circuit configurations tailored to operational requirements, station size, importance, busbar selection needs, and other factors. The single-busbar system, depicted in Figure 1, is suitable for smaller and less-demanding stations. Despite its single-bus configuration, operational availability can be high if the network allows for the circular and redundant powering of busbars. The introduction of withdrawable cells has further enhanced the single-bus system.
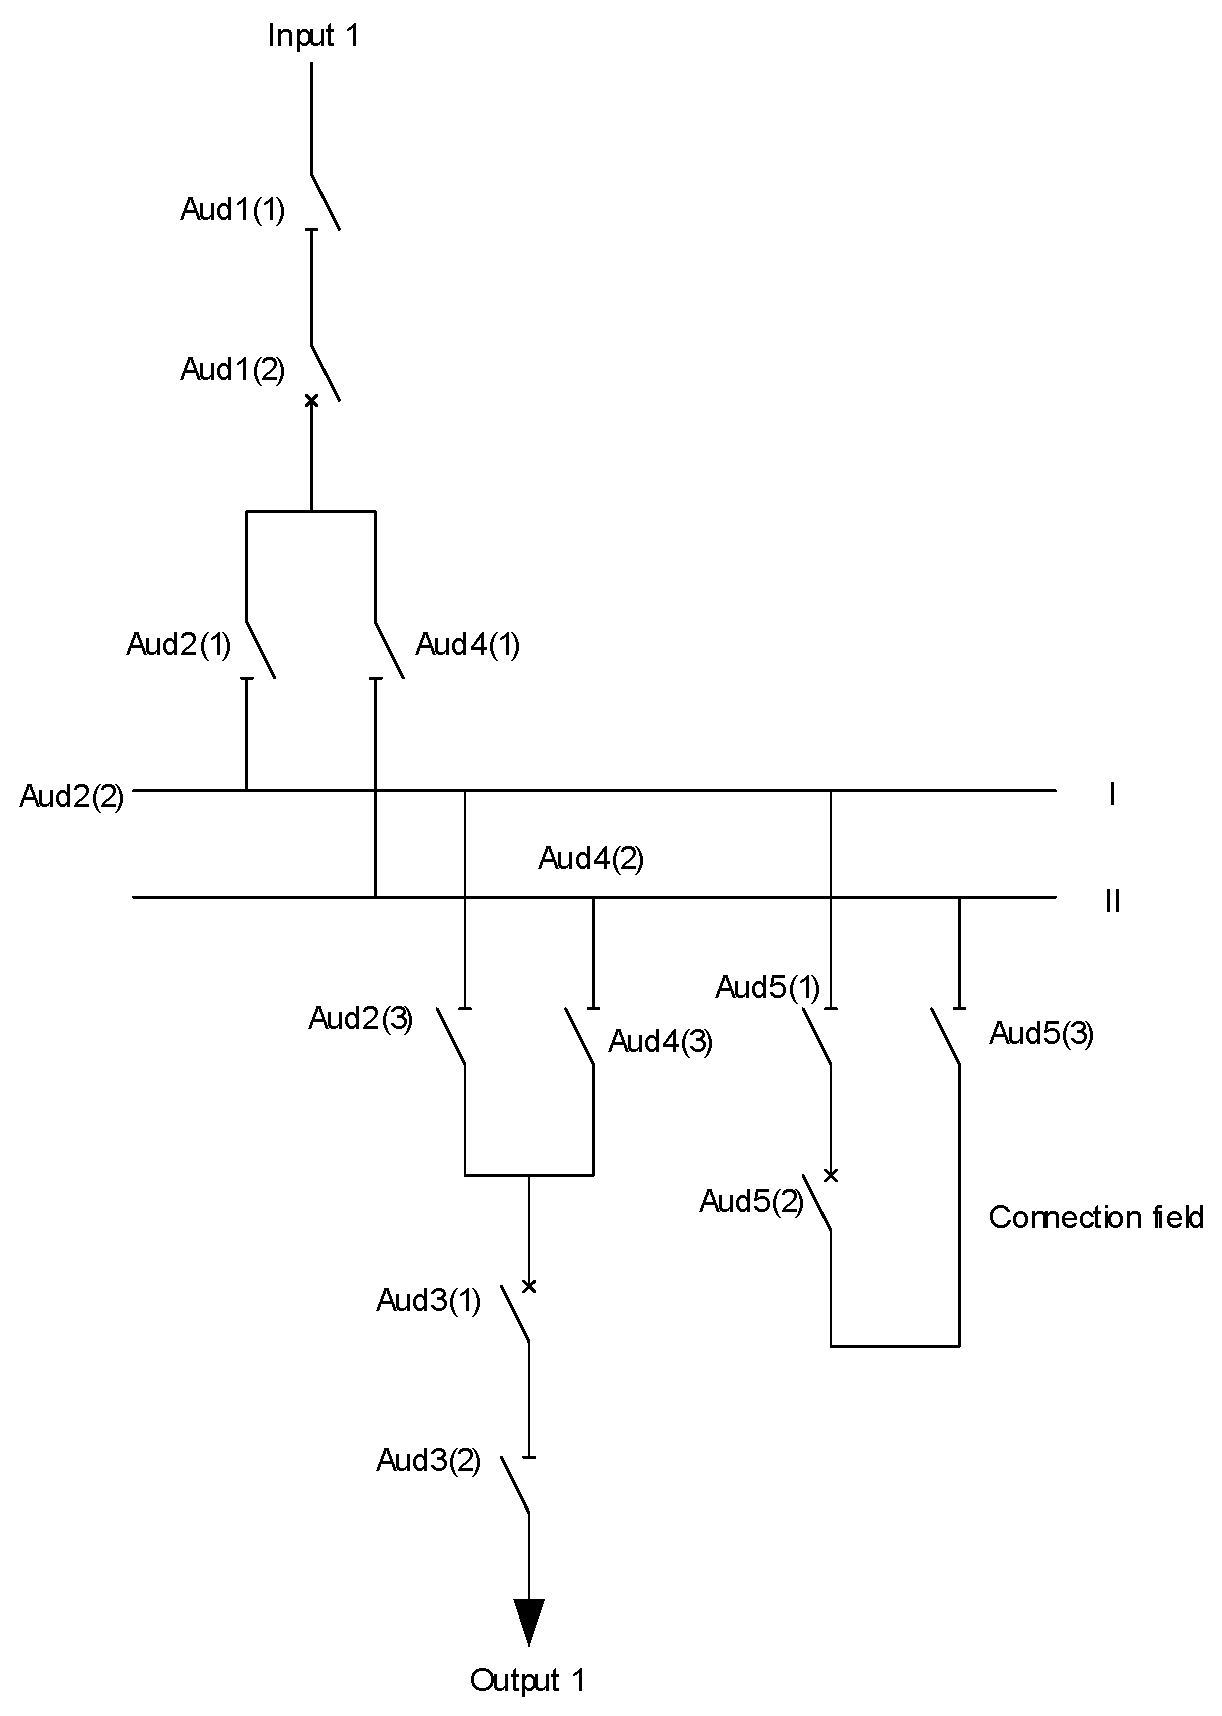
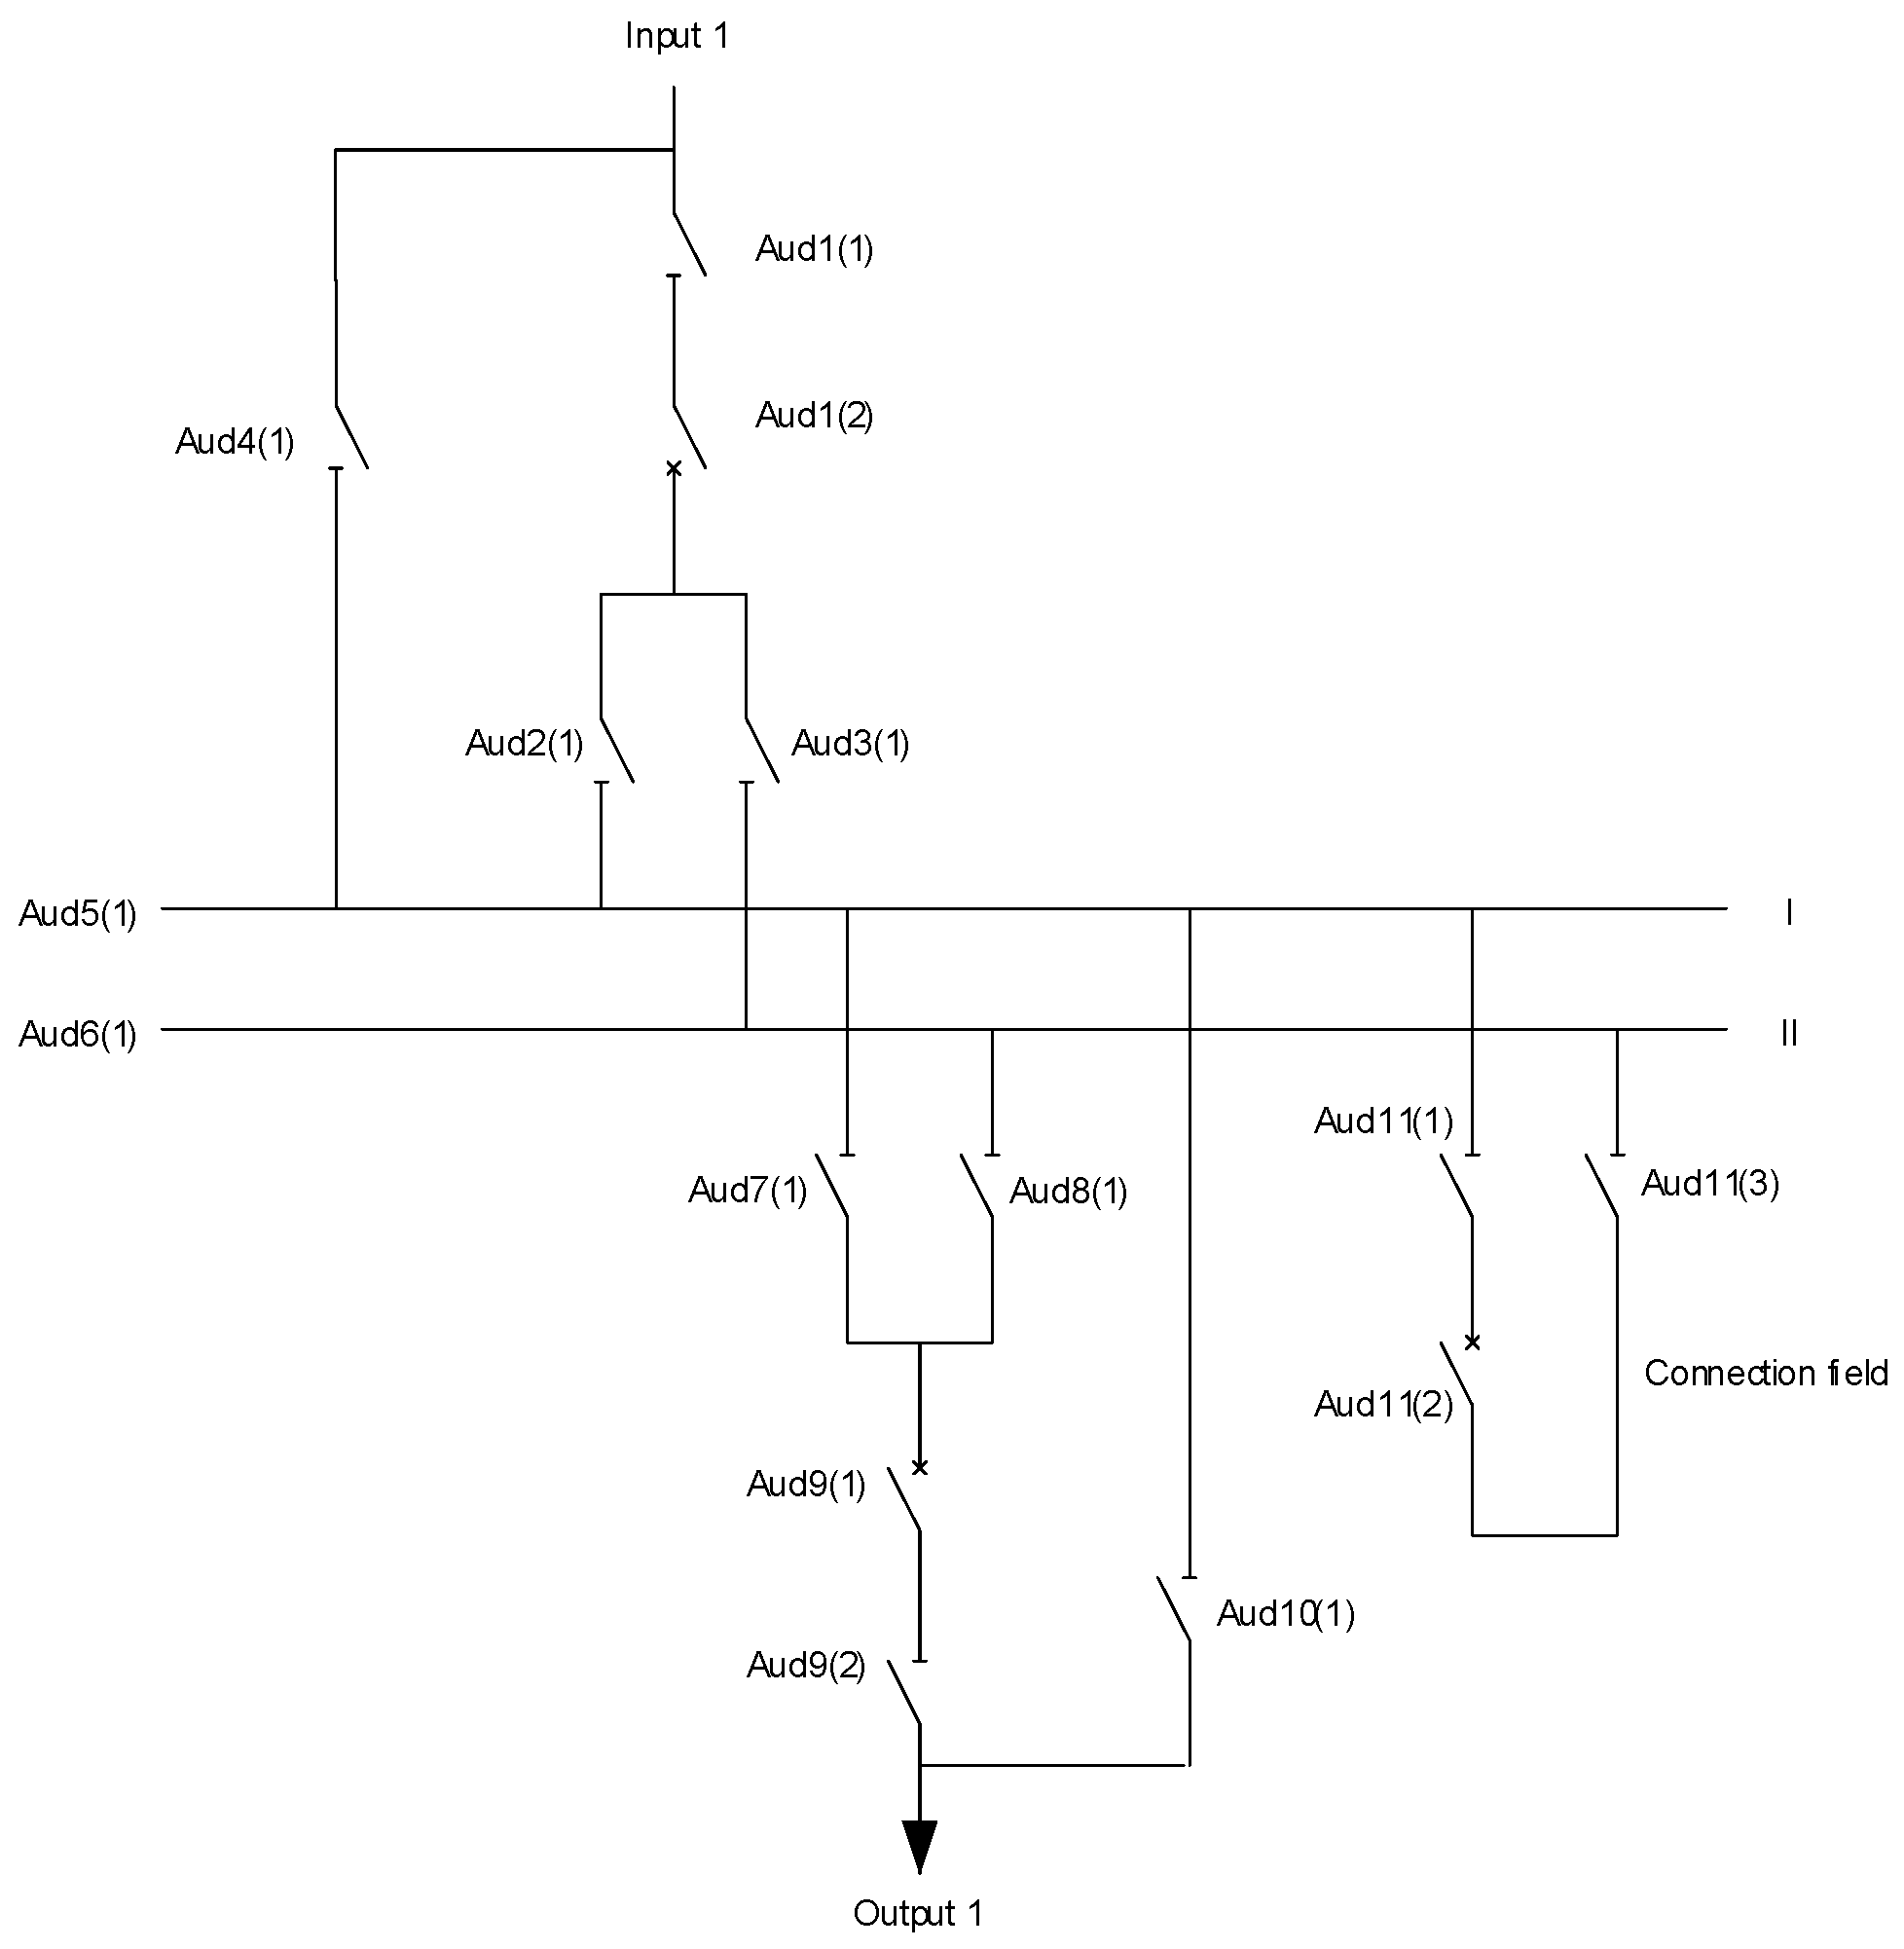
The figure also illustrates the switchgear layout distribution used in the program, with “Aud” representing the average unavailability of devices and “D” denoting the field under consideration. For instance, in Figure 1, “Aud1” represents the average unavailability of a busbar, while “Aud 2” and “Aud 4” represent the average unavailability of a disconnector, and “Aud 3” represents the average unavailability of a circuit breaker.
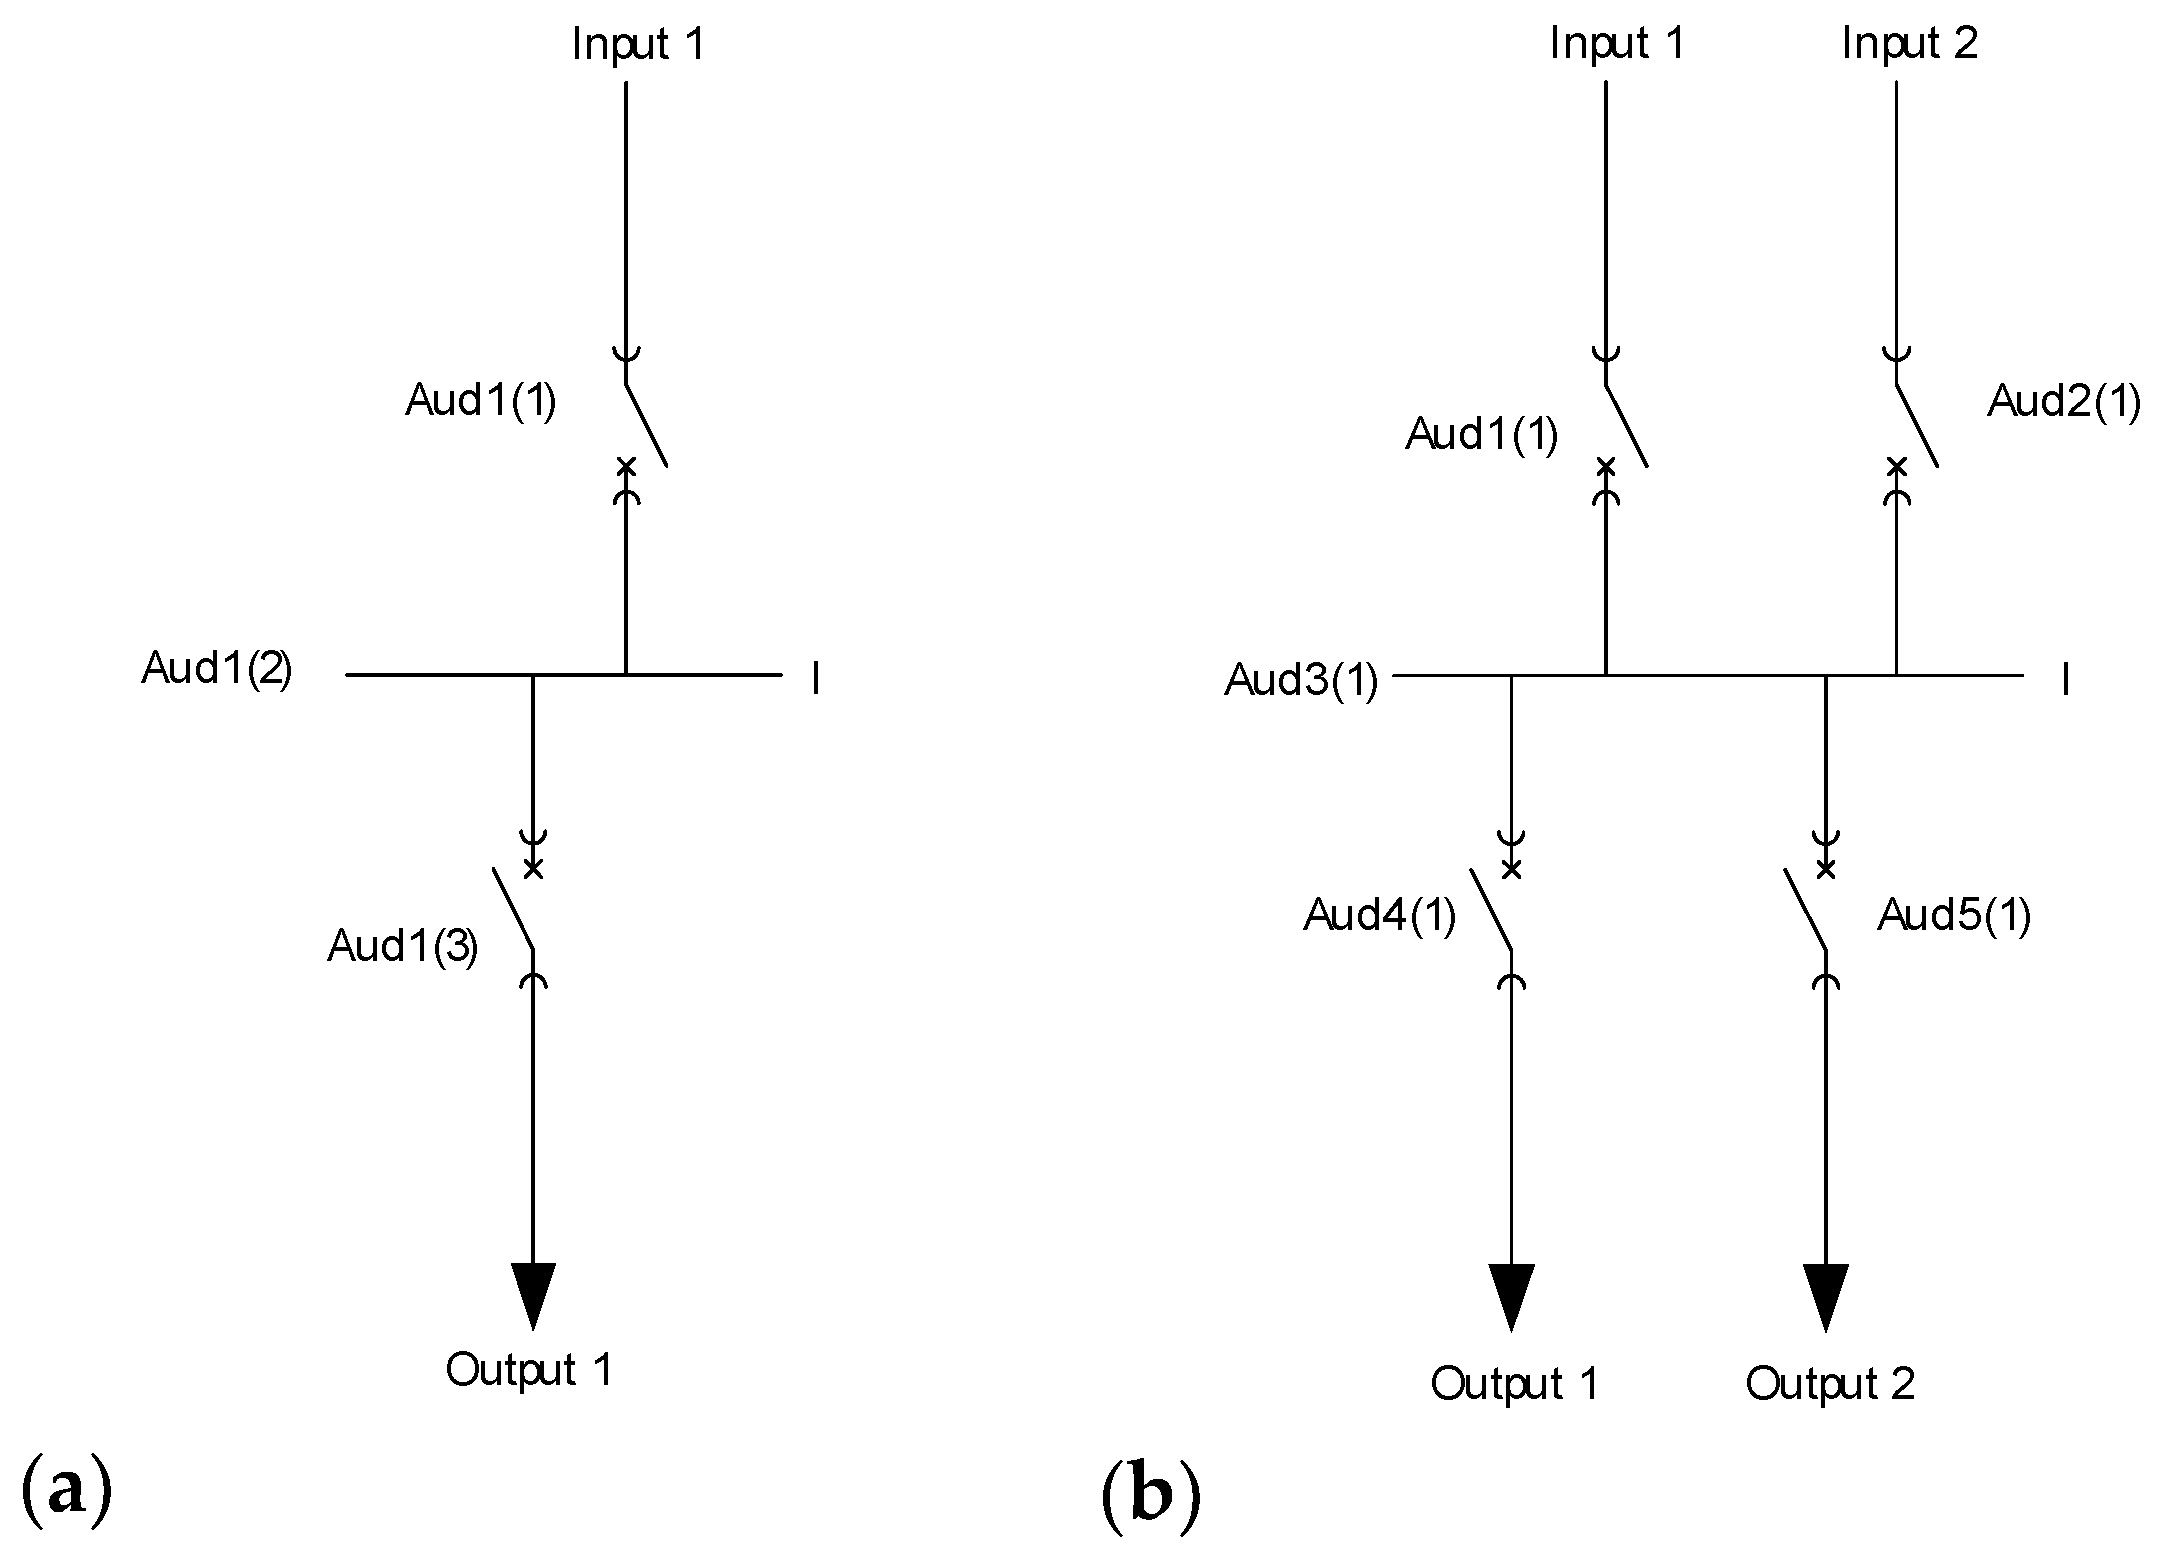
Figure 2 shows the single-busbar system with one (a) and two (b) input and output fields.
Figure 3 and Figure 4 show the single-busbar system with one active incoming and outgoing field with an auxiliary bus and with two active incoming and outgoing fields with an auxiliary bus, respectively.
Figure 5 shows the single-busbar system with withdrawable circuit breaker and Figure 6 shows the single-busbar system with a withdrawable circuit breaker with one (a) and two (b) input and output fields.
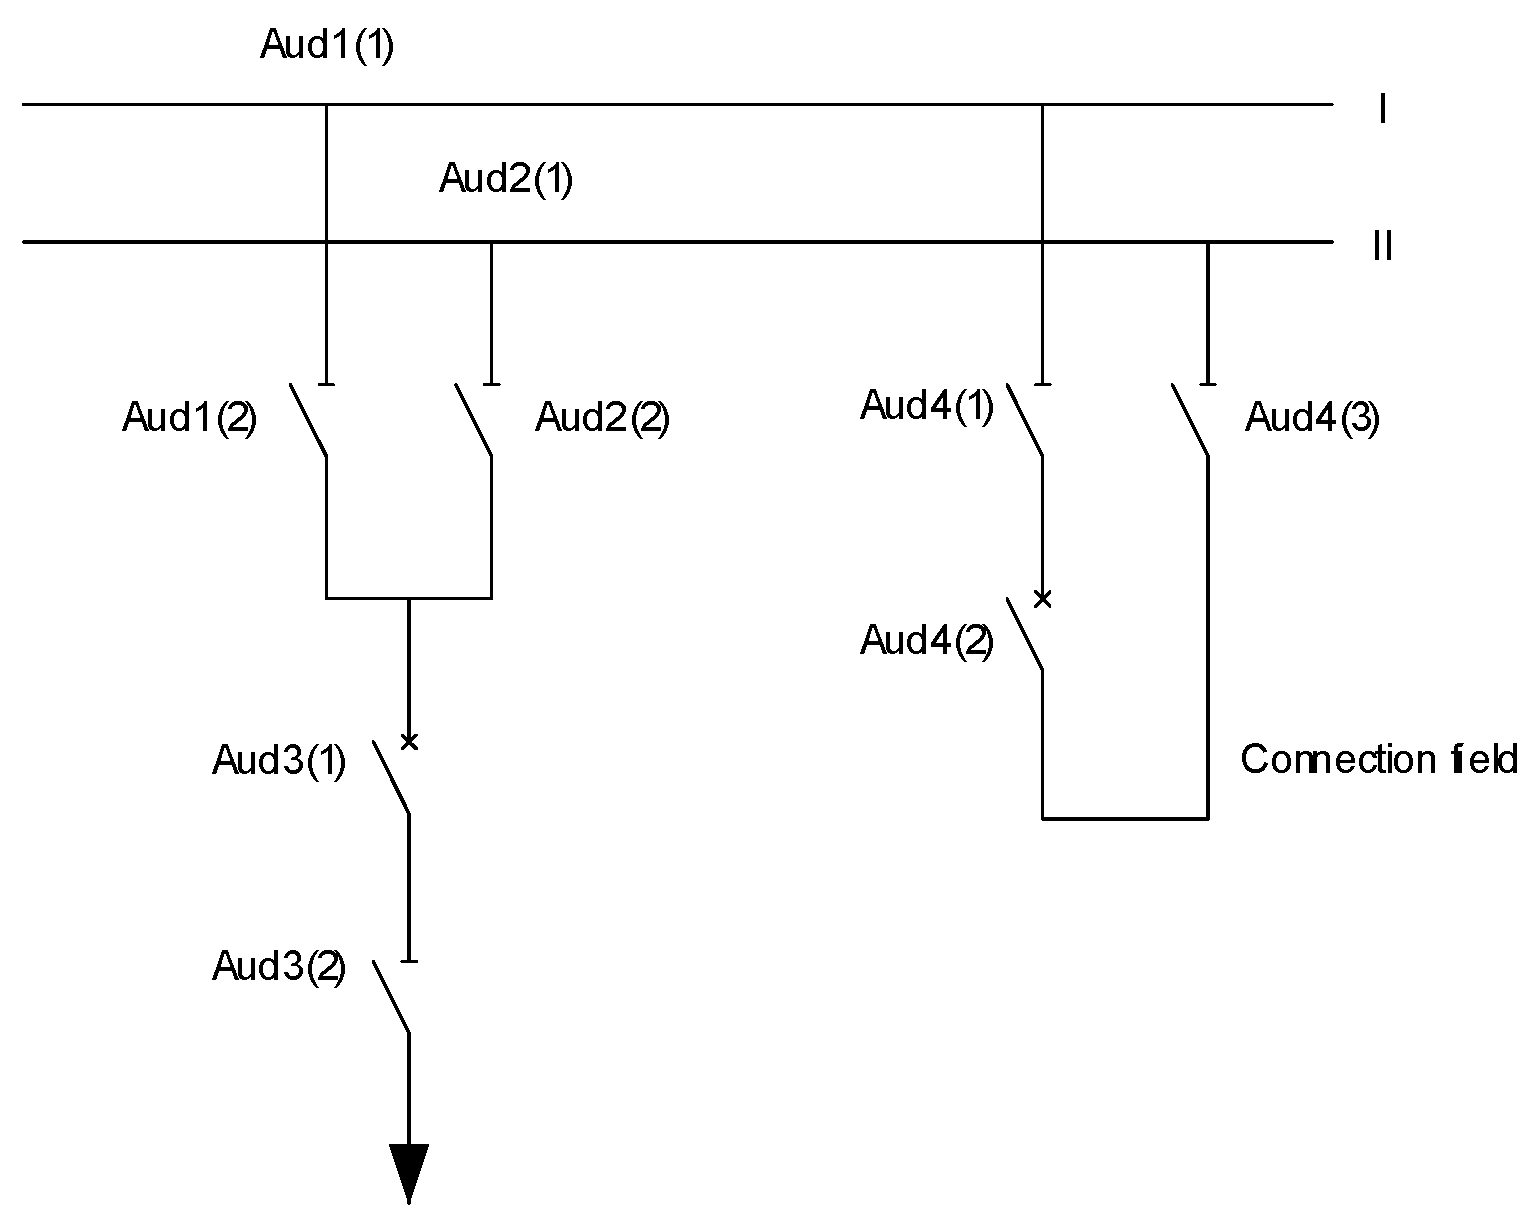
The operational reliability of double-busbar systems is enhanced due to their inherent selection capabilities. This feature allows for increased reliability in power distribution. Figure 7, Figure 8, Figure 9, Figure 10, Figure 11, Figure 12, Figure 13, Figure 14, Figure 15 and Figure 16 illustrate the diverse topologies characteristic of double-busbar systems.
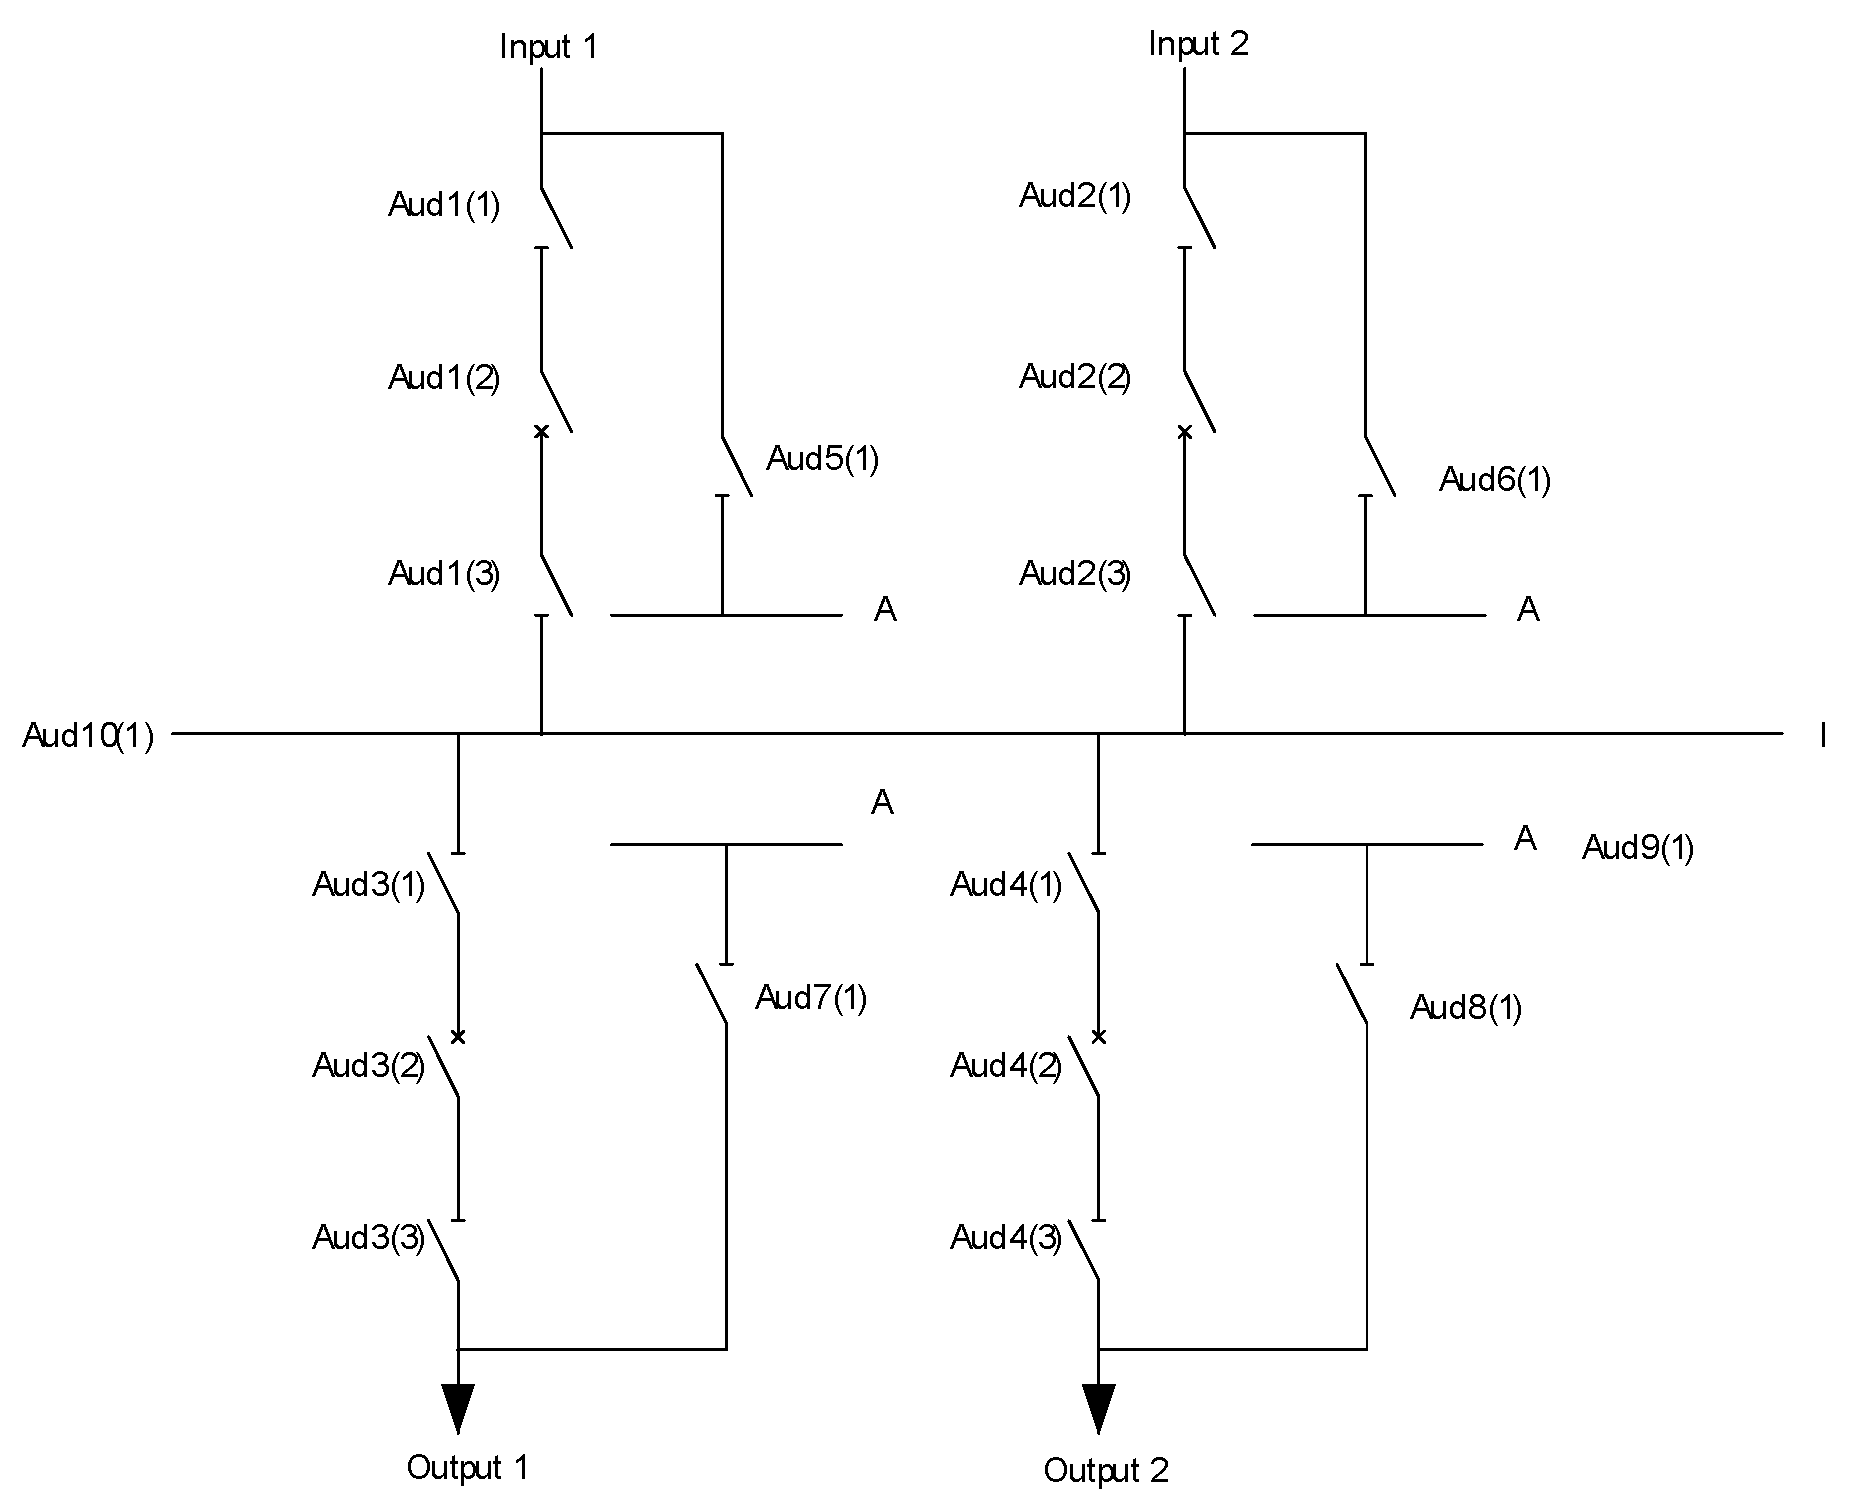
There is a reliable option for uninterrupted power supply to the consumer, and that is through the use of looped power supply circuits, namely ring-type power. A switchgear with a ring-type power supply is shown in Figure 17, Figure 18, Figure 19 and Figure 20, where Figure 17 shows the switchgear with a ring-type power supply, Figure 18 shows the switchgear with a ring-type power supply with one active incoming and outgoing field, and Figure 19 shows the switchgear with a ring-type power supply with two active incoming and outgoing fields.

3. Materials and Methods

For each of the previously mentioned switchgears, a program for reliability determination was written in MATLAB software (R2023b), based on the average annual unavailability intervals of the switching elements and the Monte Carlo method.
The Monte Carlo method, named after the famed Monaco district, originated from efforts by physicists during World War II. Initially applied to solve complex problems in physics, it gained prominence with the development of digital computing. Today, Monte Carlo simulations find extensive use across various disciplines, offering a versatile approach to solving problems involving uncertainty and randomness. [hasan] By iteratively sampling from probability distributions and evaluating model behaviors, Monte Carlo simulations enable the estimation of performance indexes and complex indicators with reliable statistical properties. Its flexibility and robustness make it a cornerstone technique in fields ranging from finance and engineering to biology and social sciences [12].

Operation Principle of the Program

Programs written in MATLAB are based on generating random numbers, which is the basis of the Monte Carlo method [13].
The purpose of the programs is to identify failures or partial failures of the power supply in switchgears (switching substations). Each element in the switching substation has its failure interval, consisting of the time required for maintenance per year and the duration of failures. These intervals are determined based on statistical data on the reliability of switching device elements and are presented in Table 1.
The simulation process involves generating random numbers to simulate the occurrence of failures or partial failures in power supply within the switchgear system over a one-year period. Here is a step-by-step outline of the simulation process:
  • Initialization: The program initializes by defining parameters such as the number of random attempts (n) to hit the failure interval, and the sizes of individual fields (D). It also incorporates the average unavailability of devices per field (Aud1(1)…).
  • Field Creation: Each field in the switchgear system is constructed by sequentially connecting switching elements. This configuration facilitates the identification of conditions leading to power outages or partial power outages.
  • Main Simulation Loop: The core simulation loop iterates over a specified number of repetitions to calculate the occurrences of power outages and partial power outages. At the start of each iteration,
    • Random initial seconds of outage are generated for each field to simulate the start of potential failure intervals within the one-year timeframe.
    • These initial seconds are randomized using the “rand” command to avoid bias towards specific time intervals within the year.
    • The average unavailability of individual devices is added to the initial random seconds to determine the outage intervals for each field.
  • Fault Interval Calculation: Using nested “for” loops, the program verifies whether the simulated outage intervals fall within the one-year period. If an outage or fault interval exceeds the one-year timeframe, it adjusts the interval accordingly to ensure accuracy.
  • Probability Calculation: Upon successfully hitting the fault intervals within the specified number of attempts (n), the program calculates the probabilities of failures for each field.
  • Outcome Determination: The simulation concludes by assessing whether the combination of field hits results in a complete power outage or partial power outage, depending on the switchgear configuration.
The results of the simulations are presented using bar plots, depicting the occurrences of power outages and, for switchgear configurations with multiple input and output fields, partial power outages.
This approach allows for a detailed analysis of switchgear reliability under various operational scenarios, providing insights into the performance and robustness of different switchgear configurations.

4. Results and Discussion

As mentioned above, the programs calculate the number of power outages and partial power outages for each switchgear separately. The results are presented below in form of bar plots for single-busbar systems, double-busbar systems and ring-type power supply systems. The results are also summarized in tables for each type of busbar.
Figure 20, Figure 21, Figure 22, Figure 23, Figure 24, Figure 25, Figure 26, Figure 27, Figure 28 and Figure 29 show the power and partial power outages for all single-busbar systems, and Table 2 is a comparison table of the results.
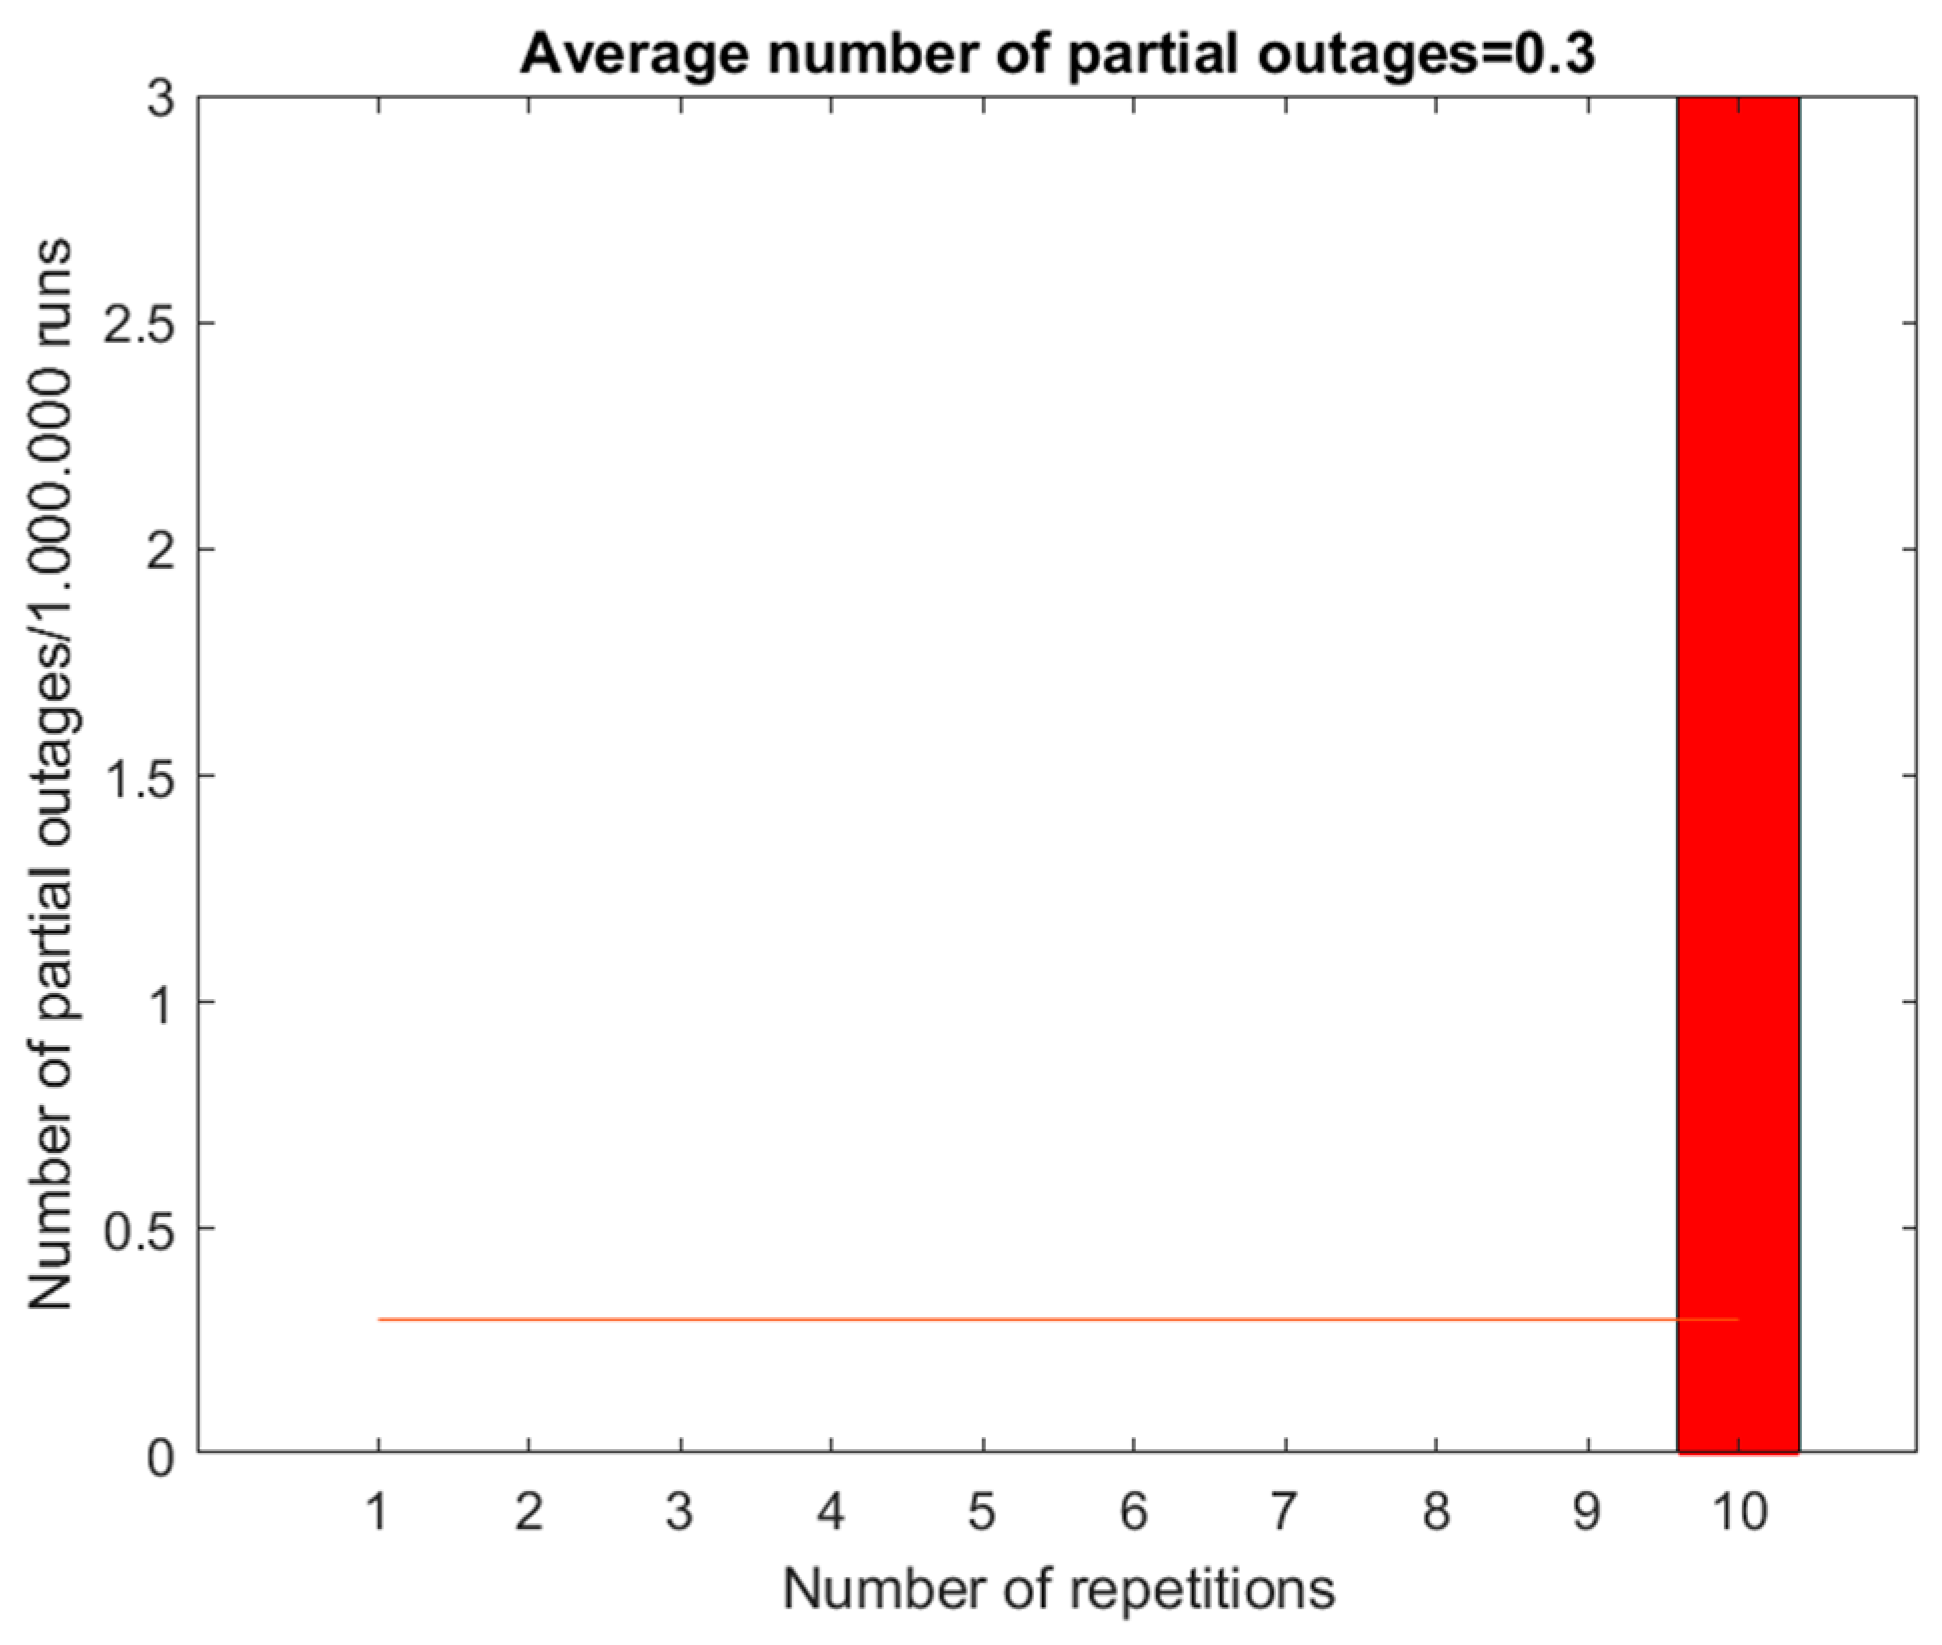
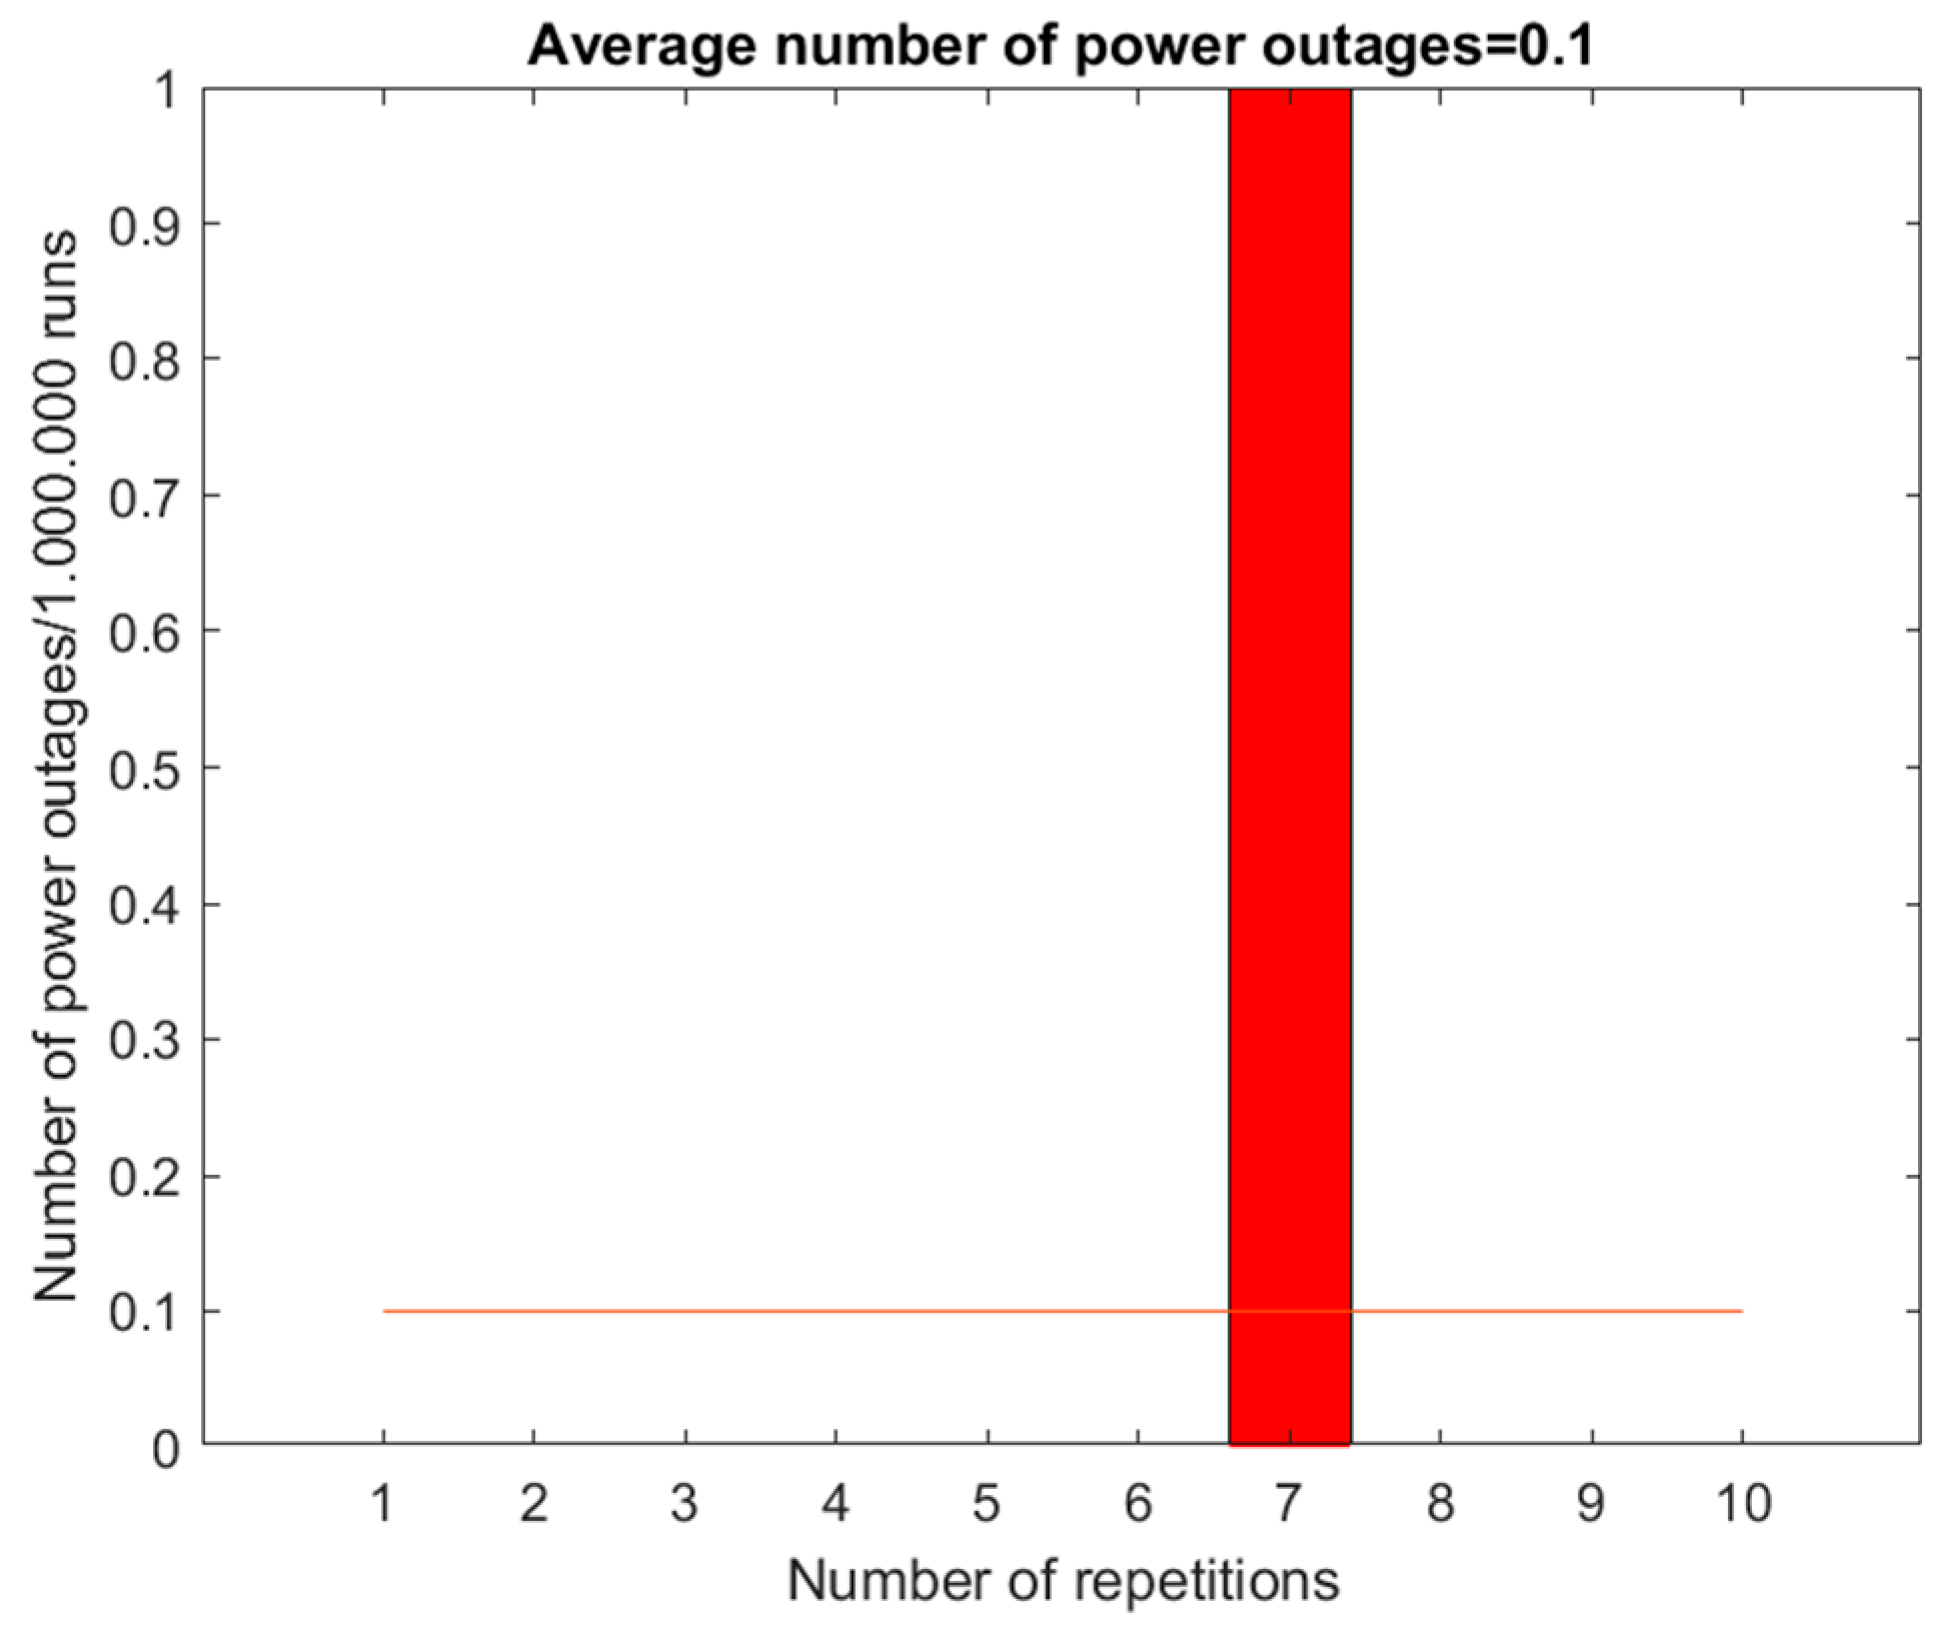
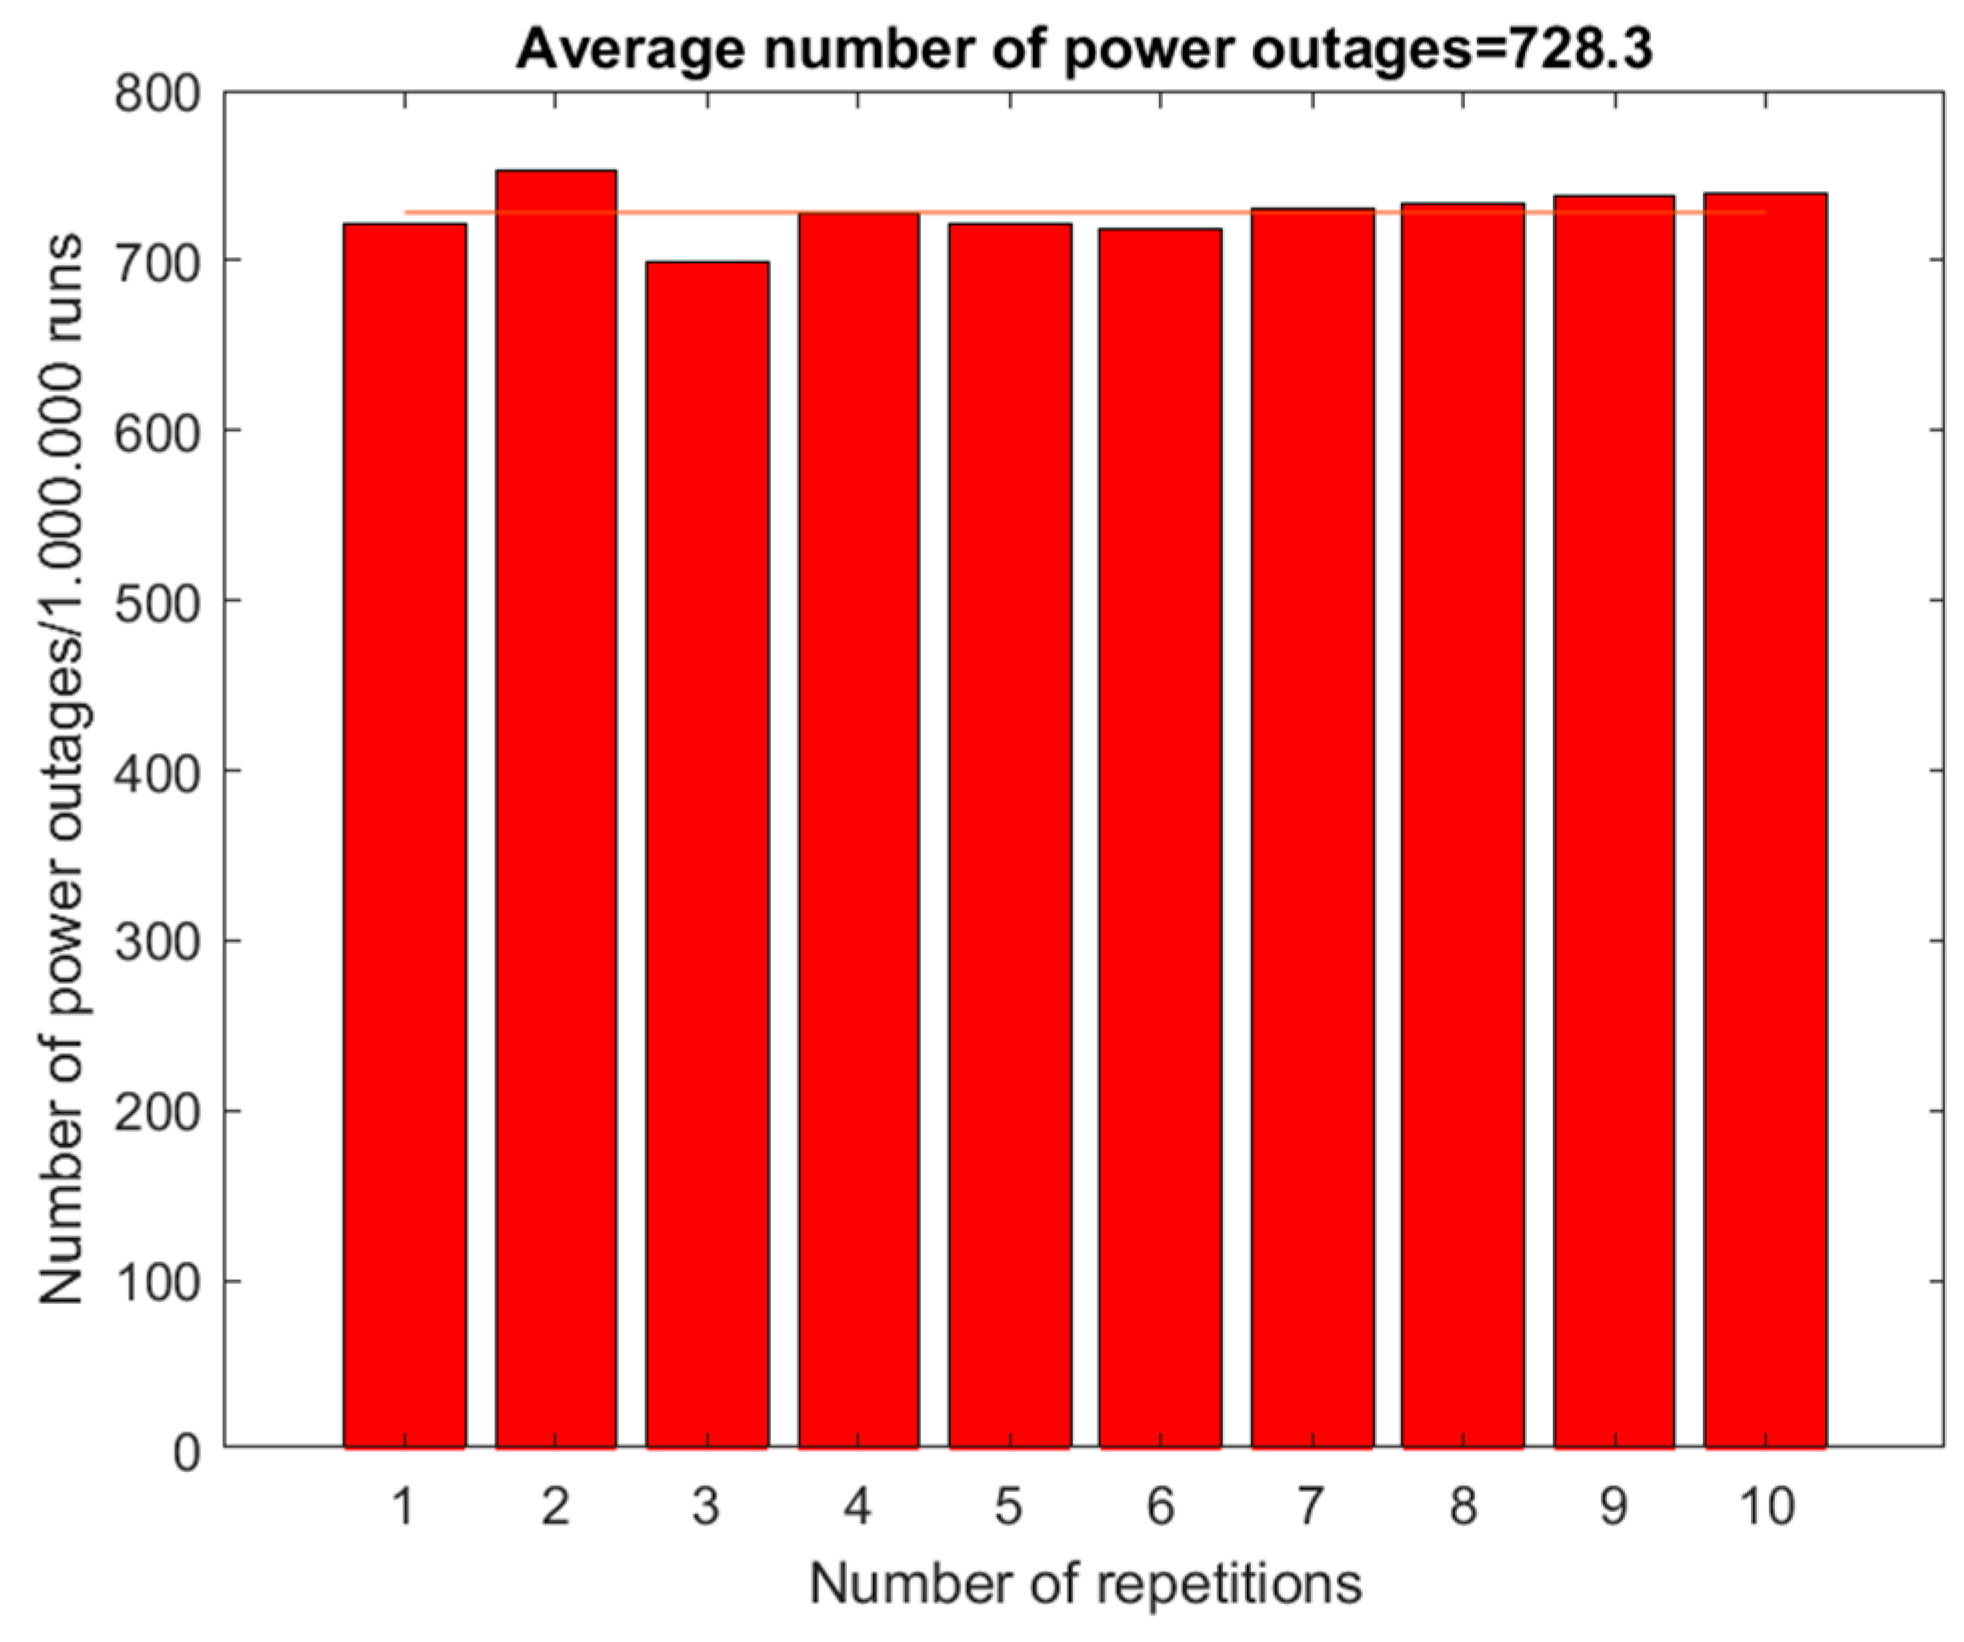
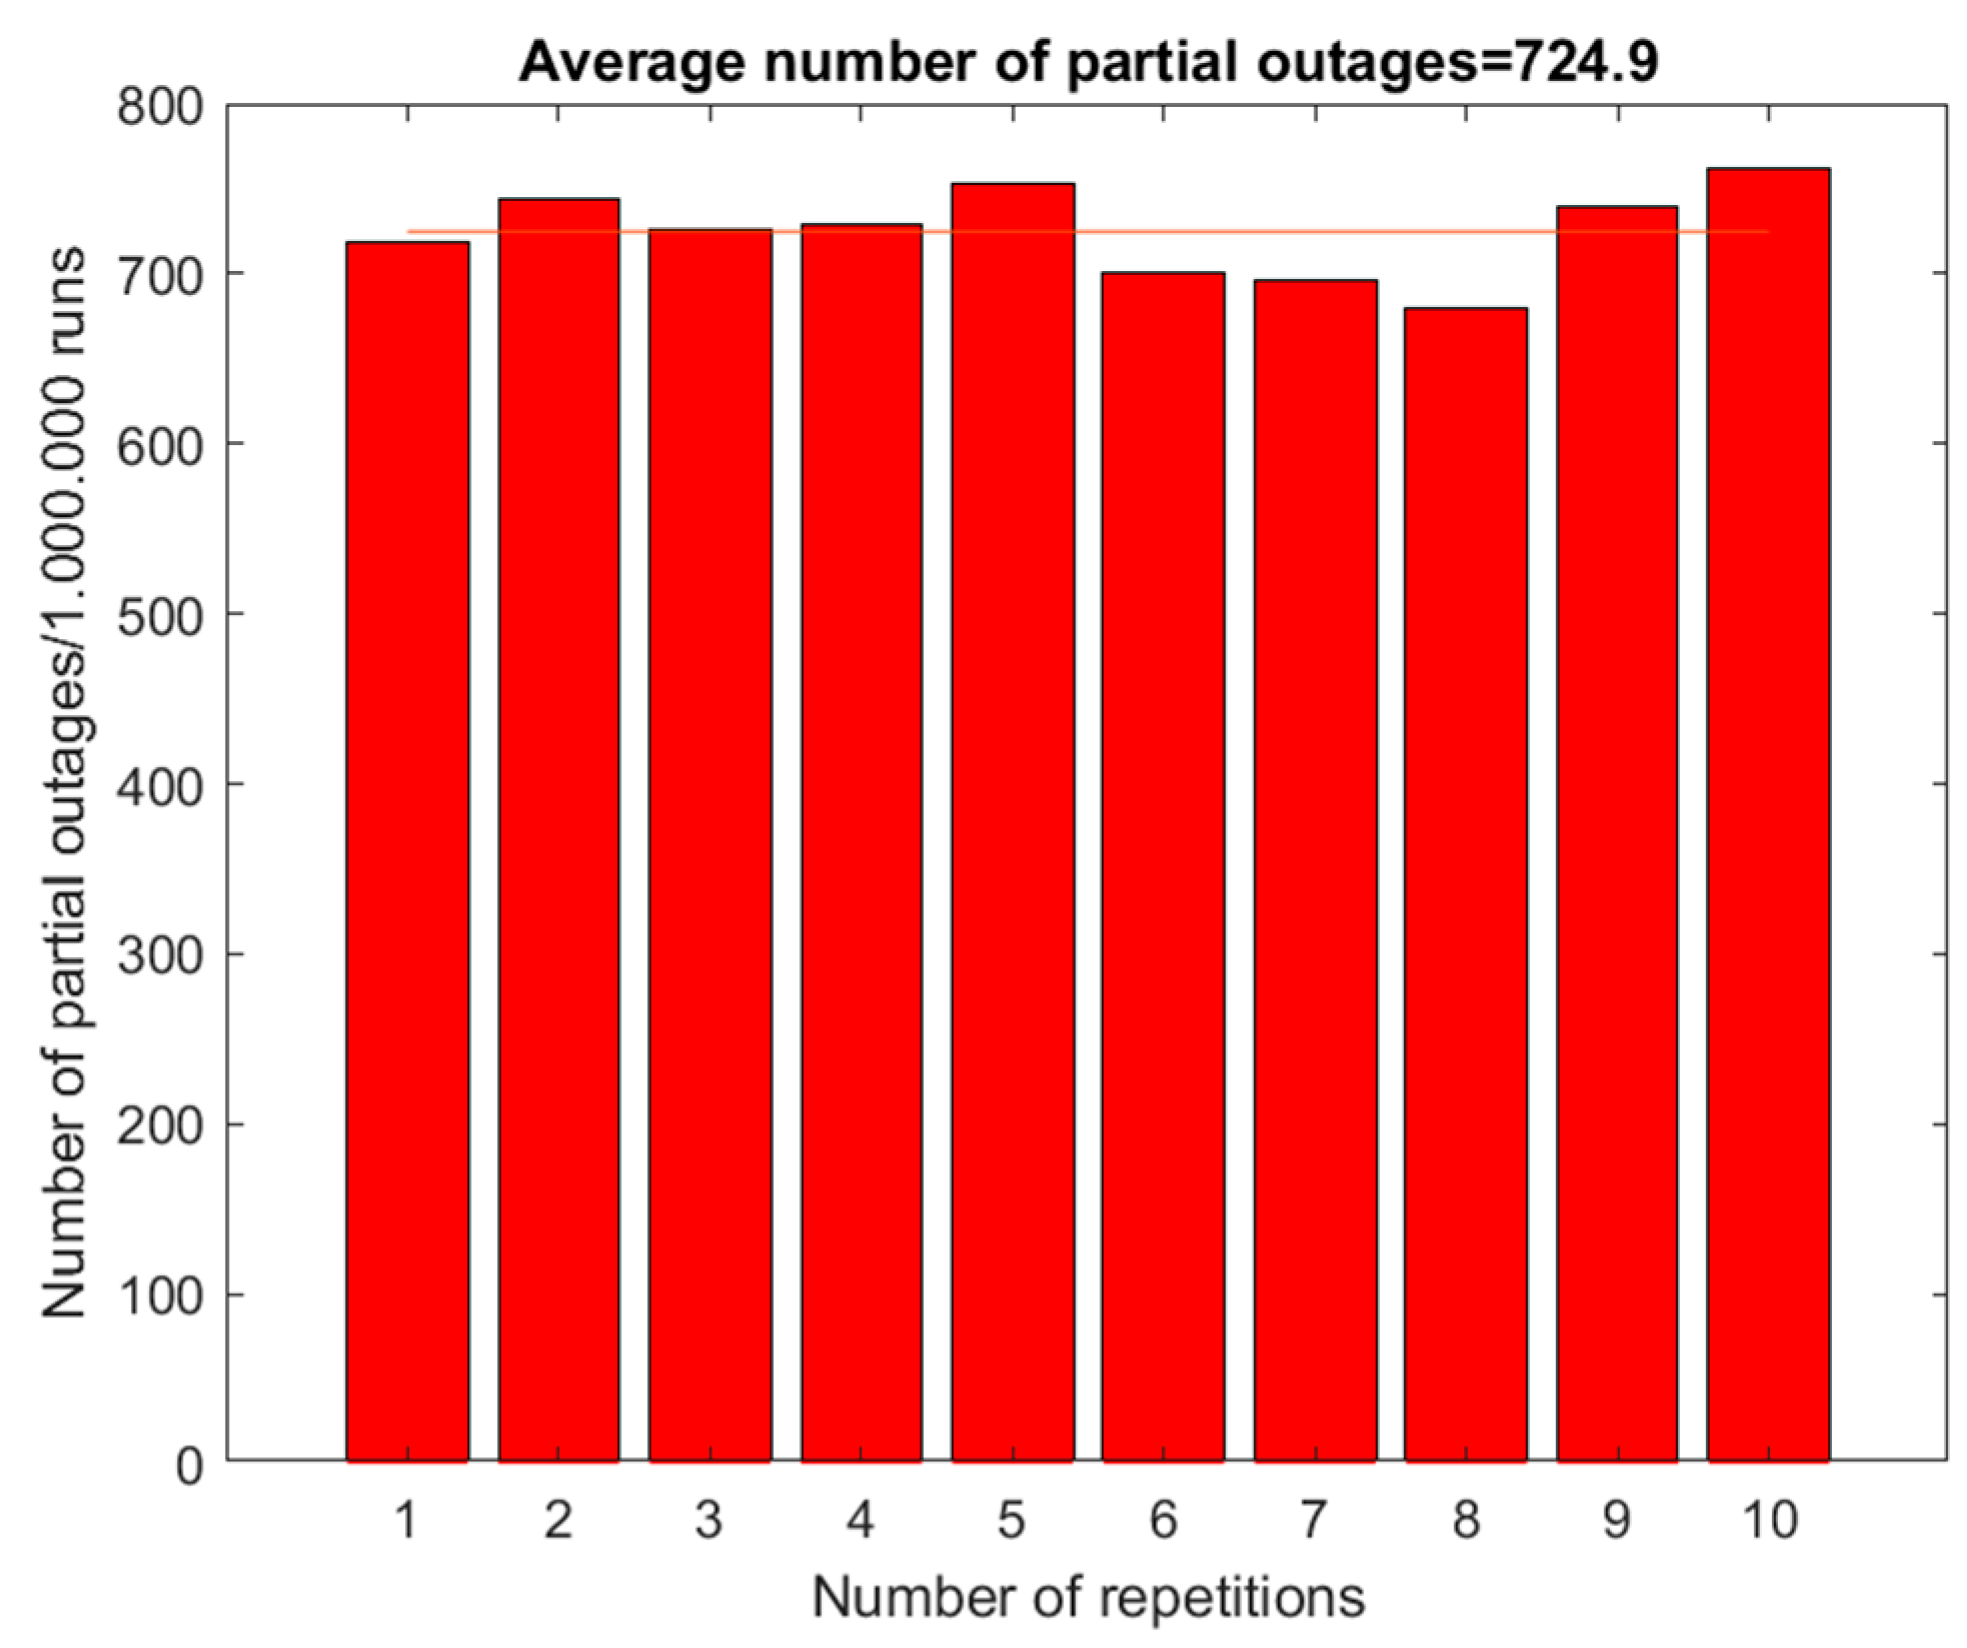
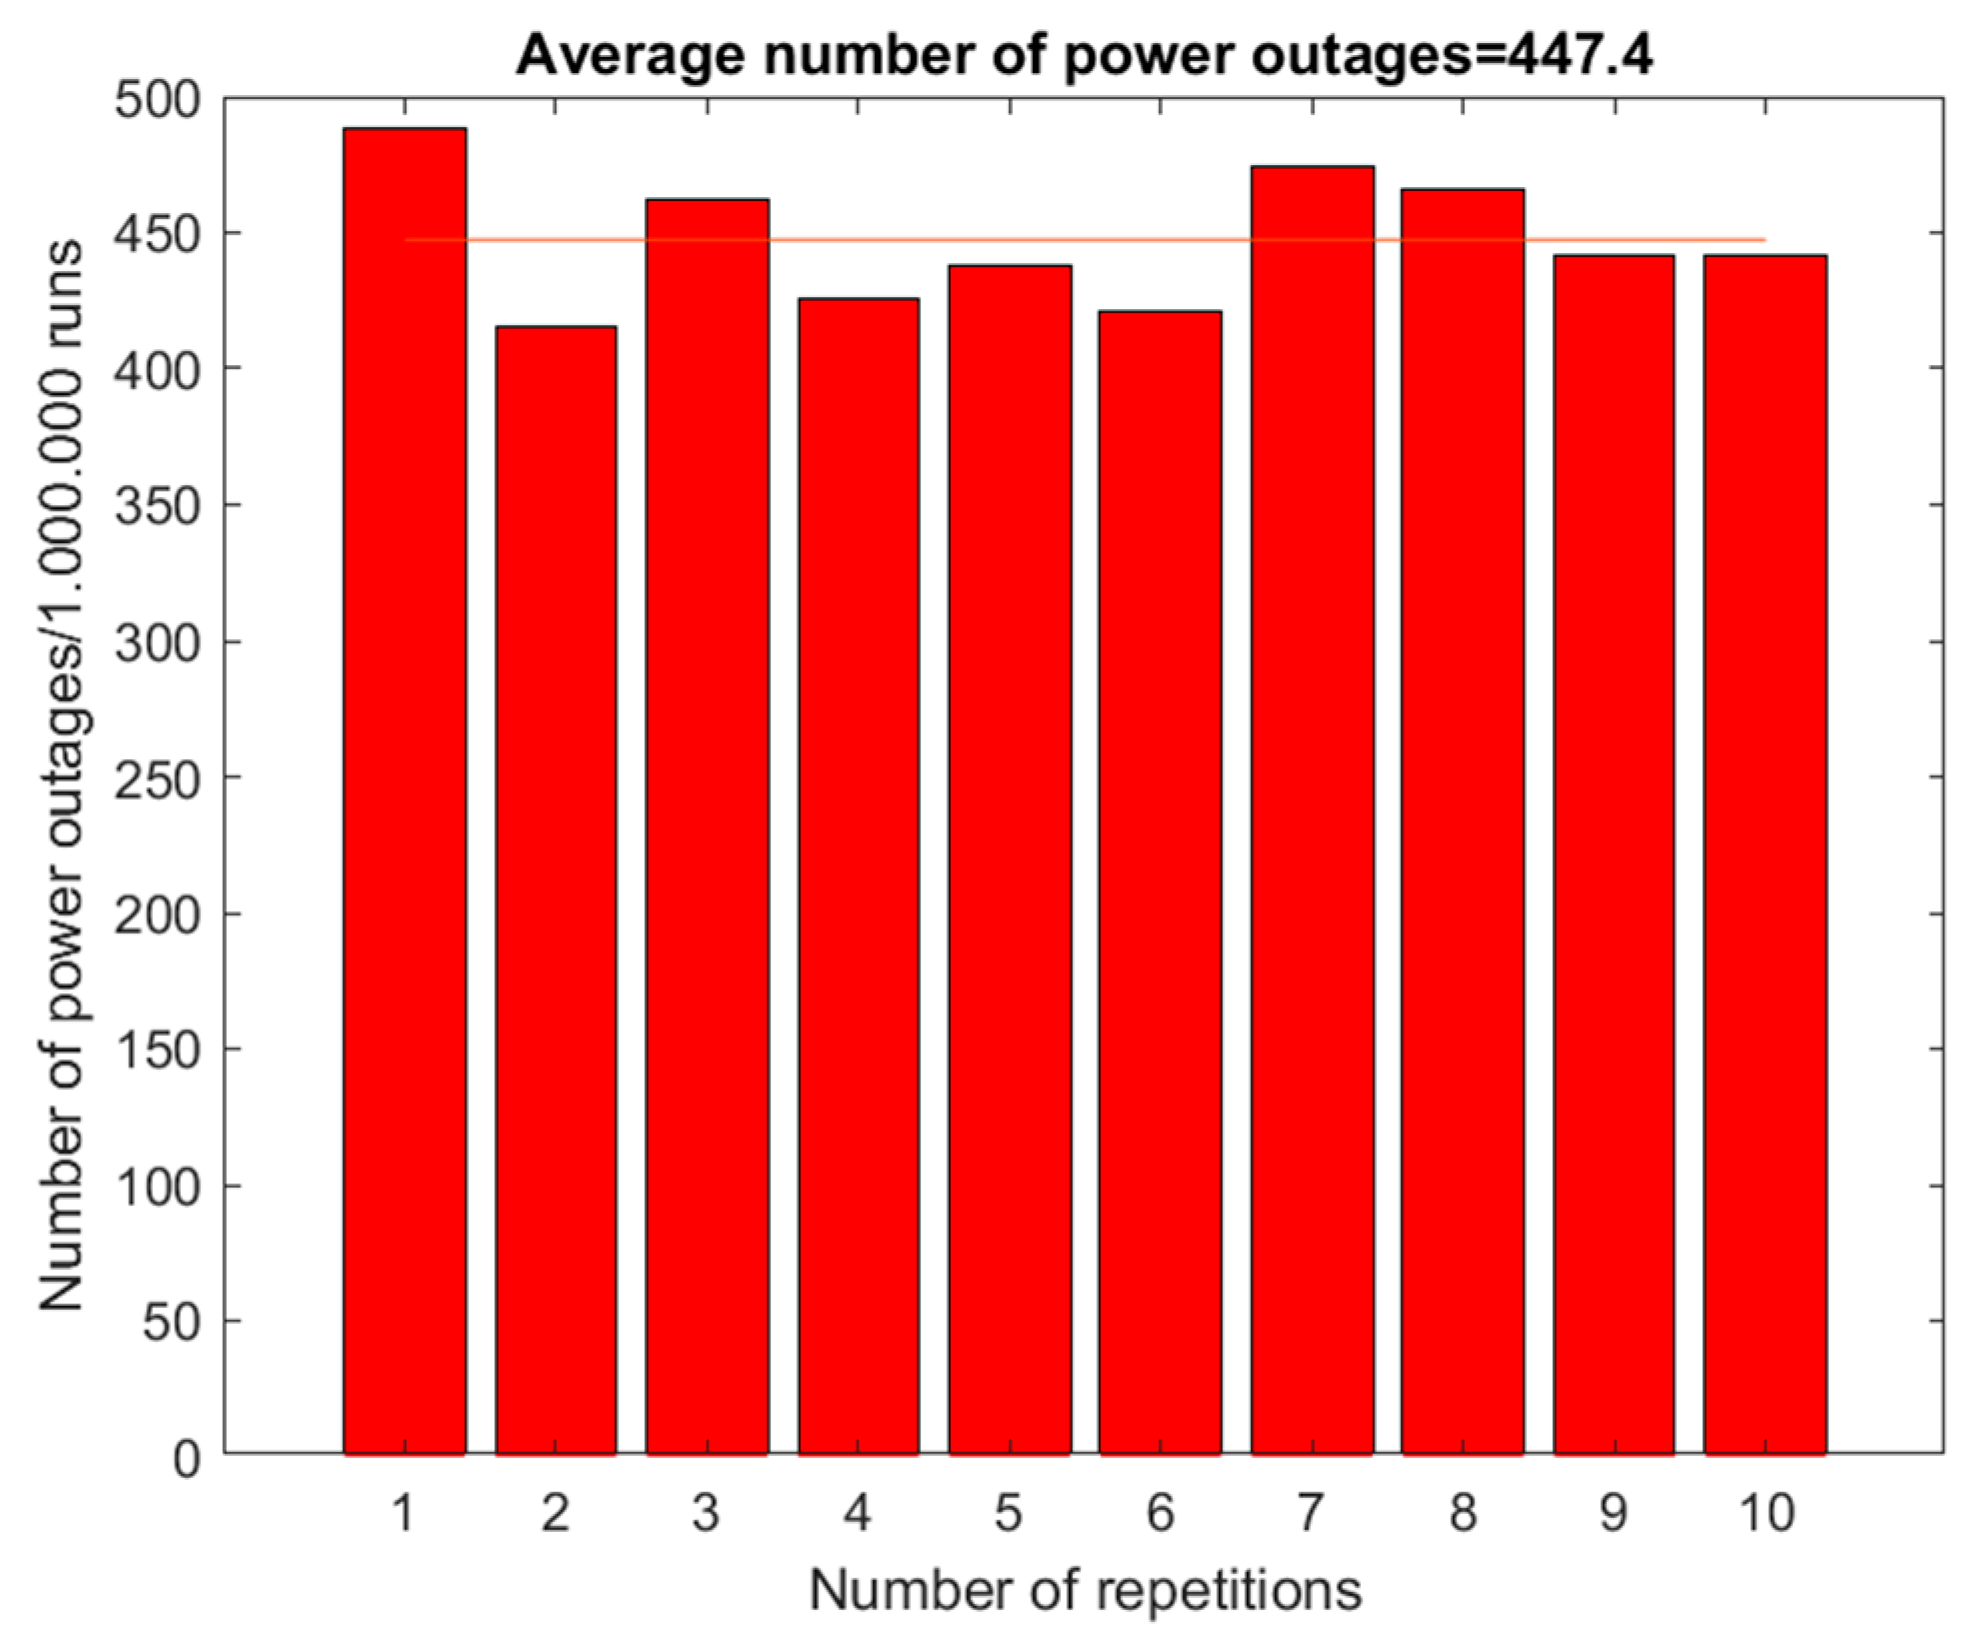
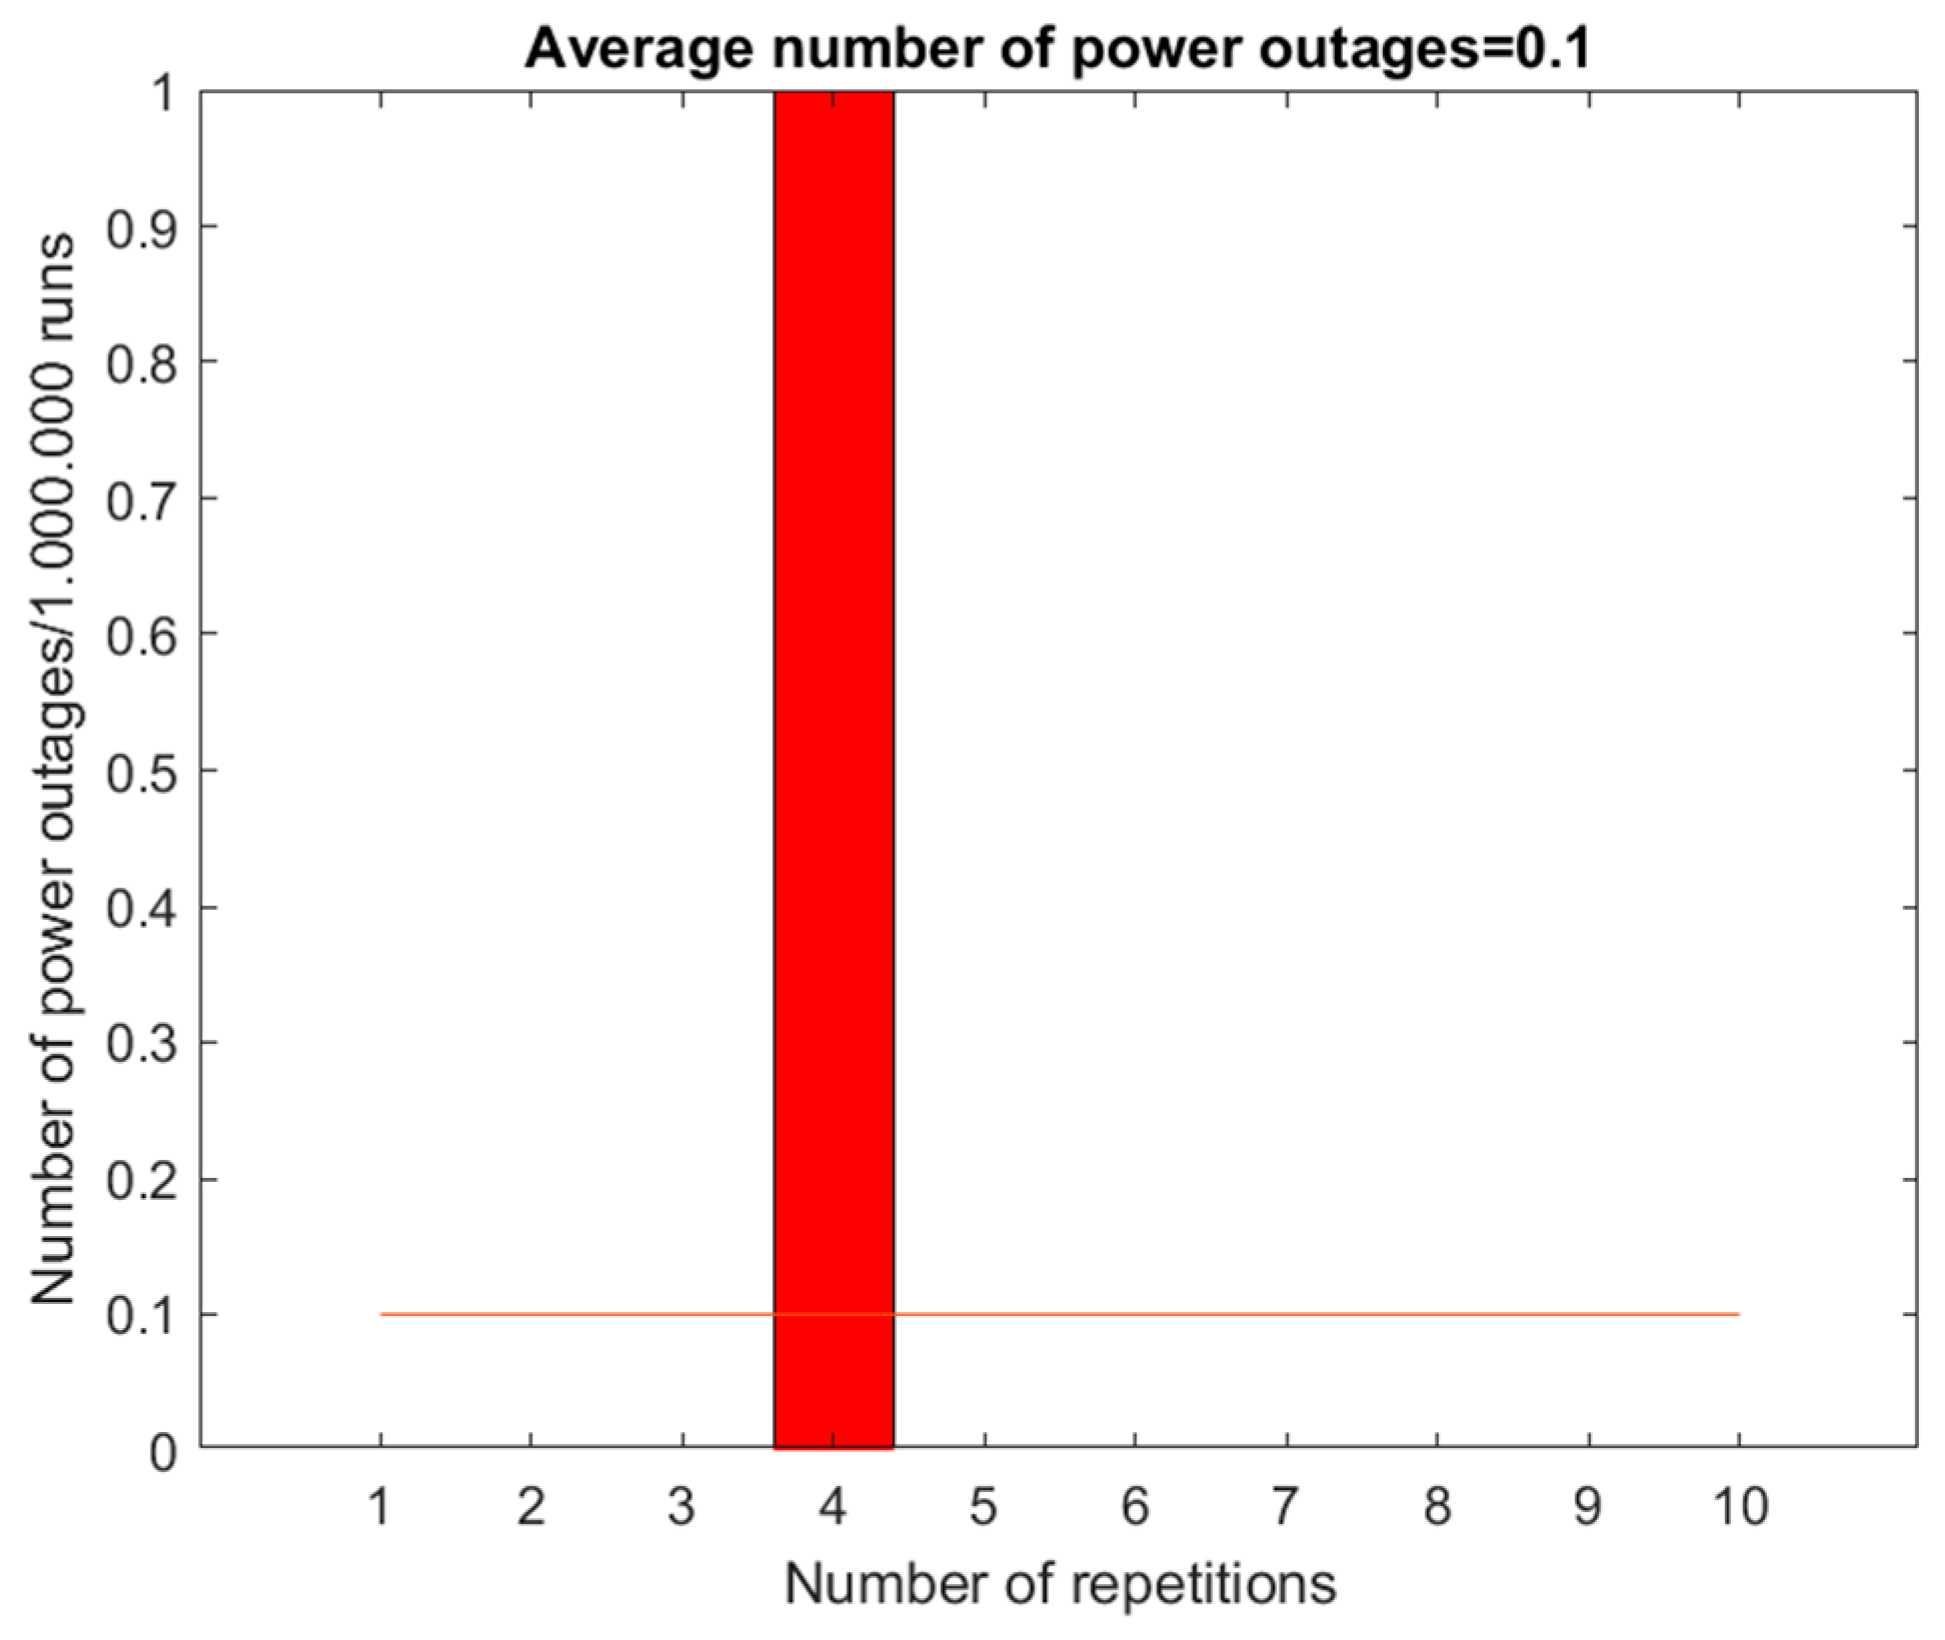
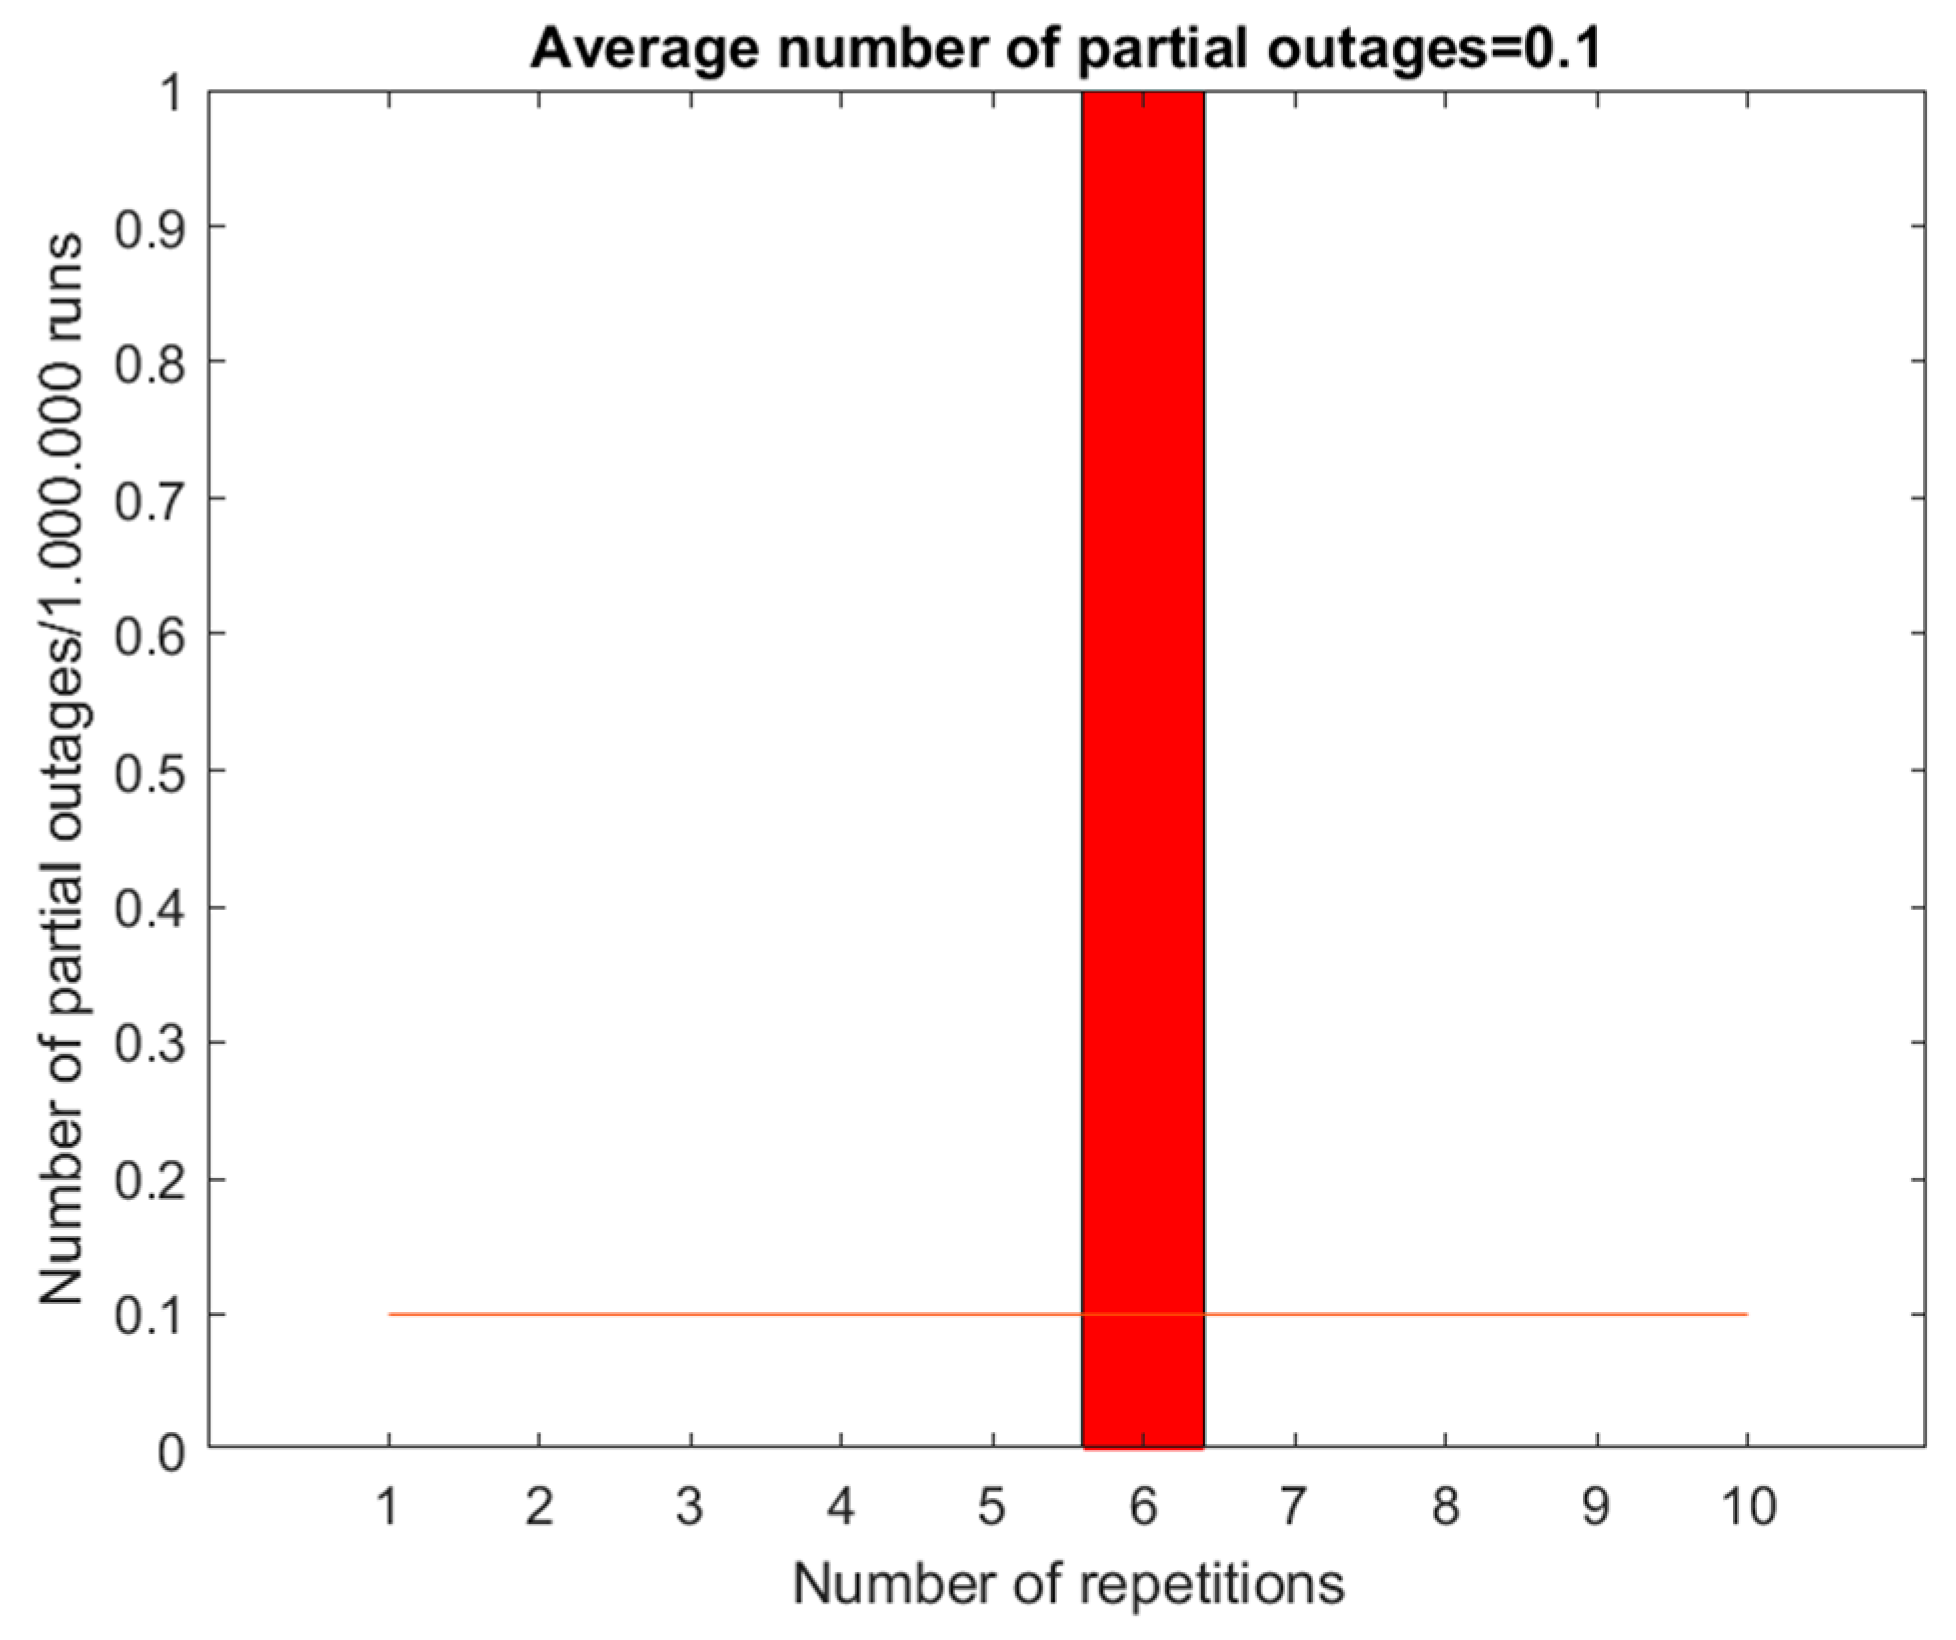
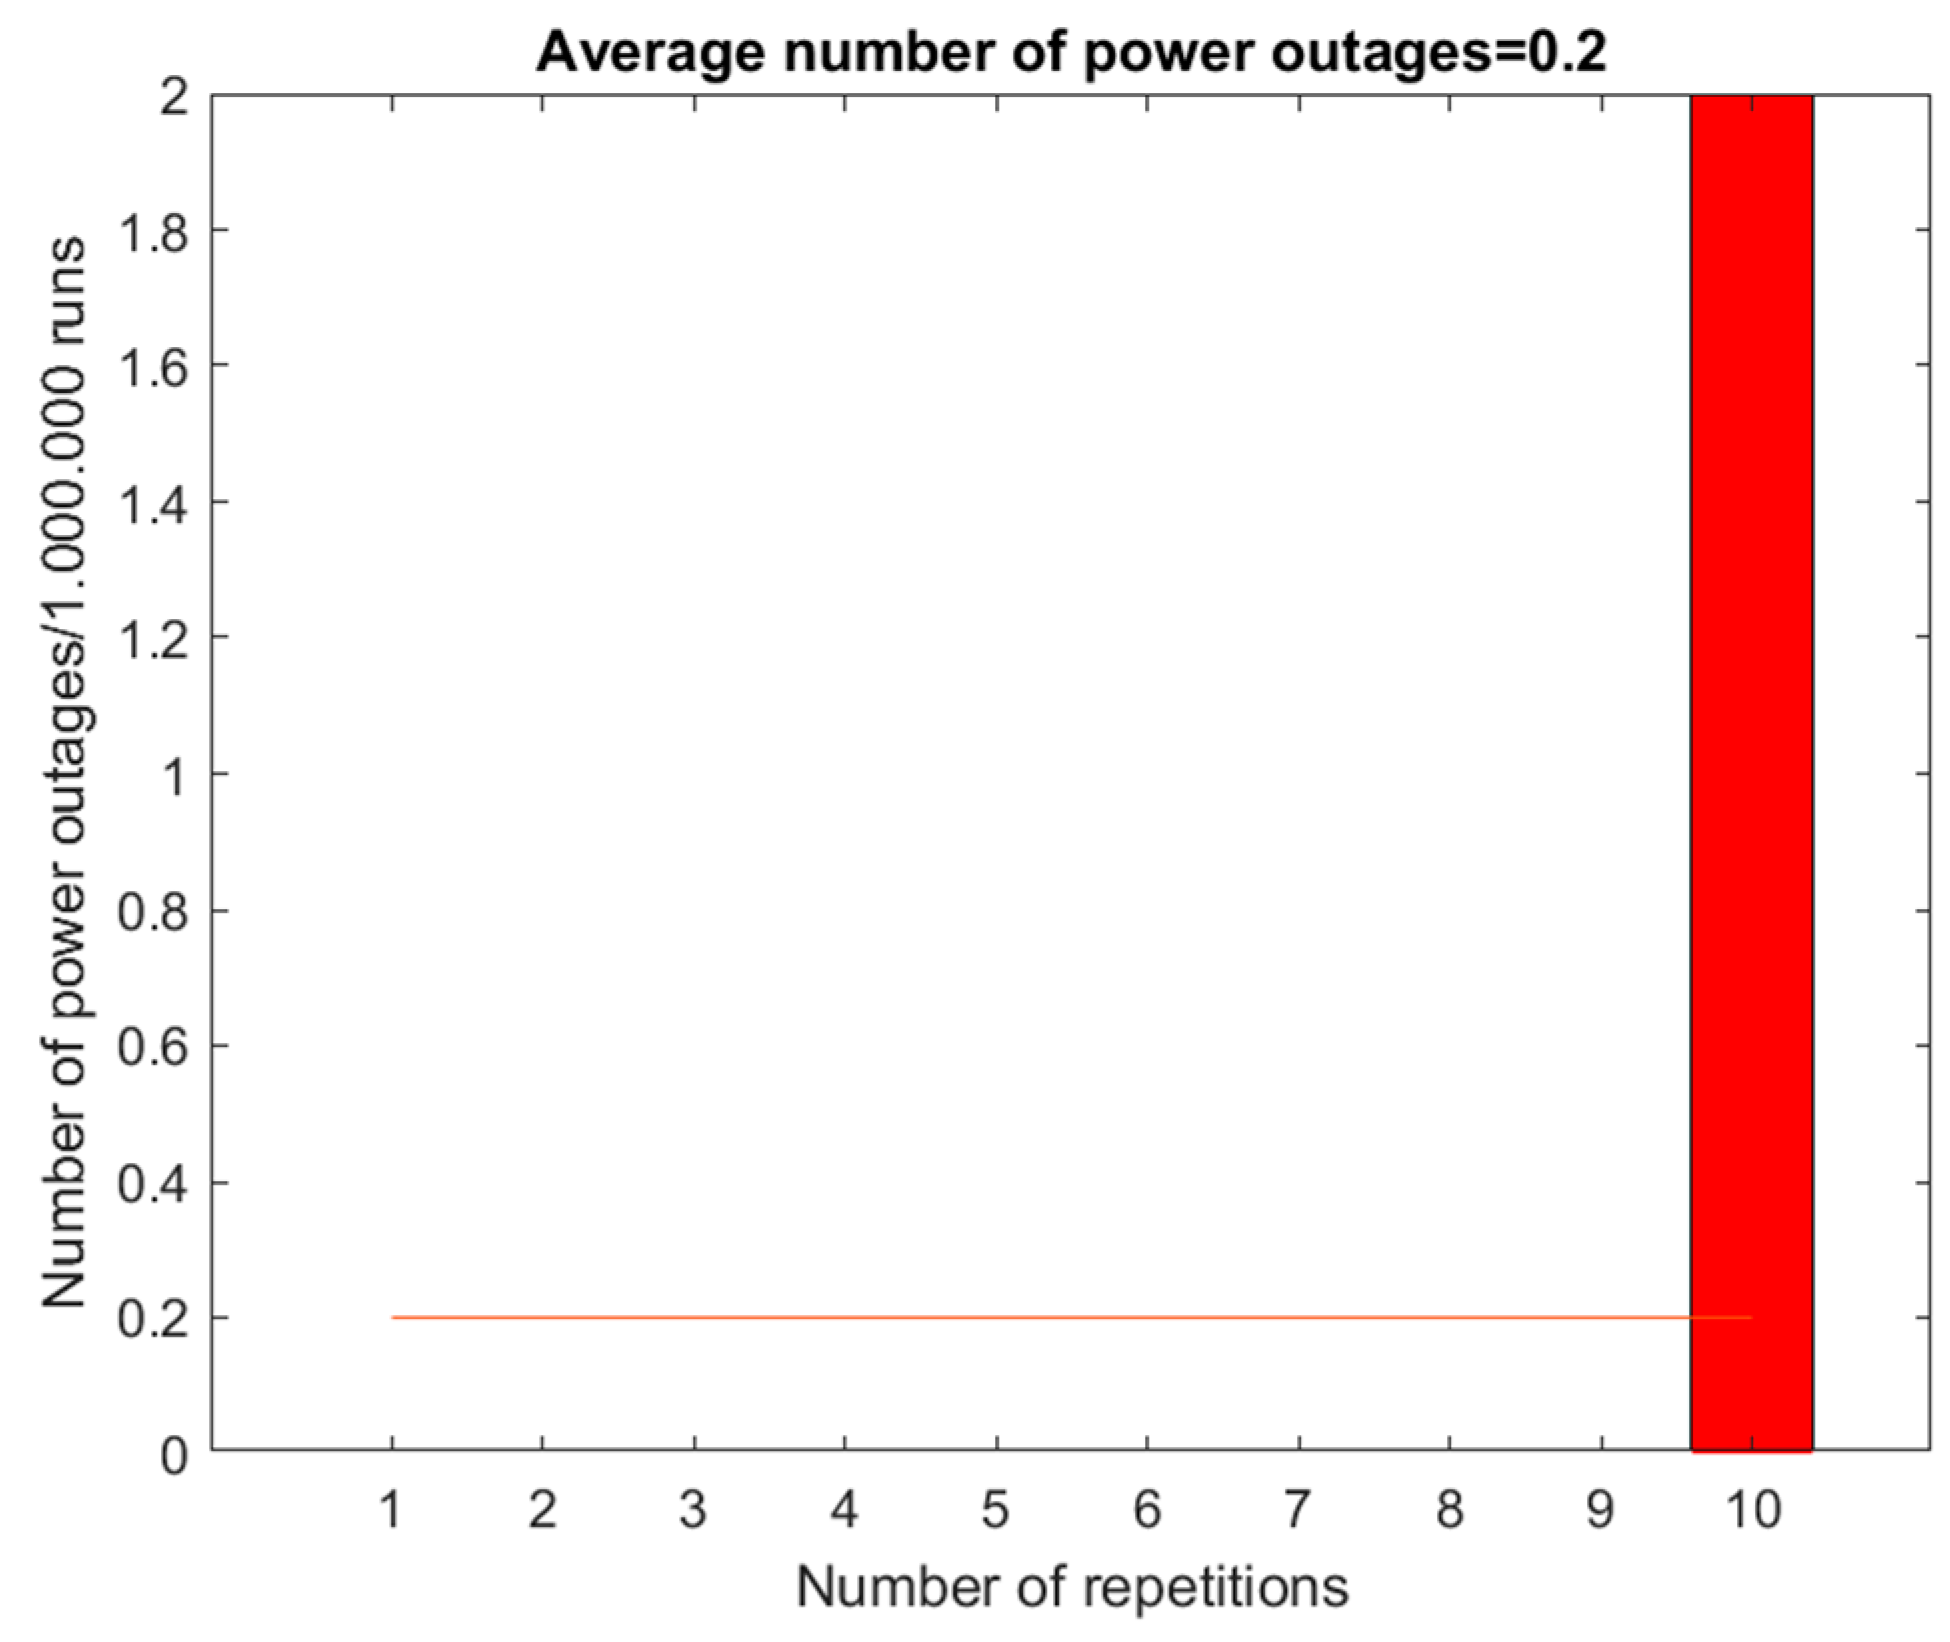
All figures (Figure 20, Figure 21, Figure 22, Figure 23, Figure 24, Figure 25, Figure 26, Figure 27, Figure 28, Figure 29, Figure 30, Figure 31, Figure 32, Figure 33, Figure 34, Figure 35 and Figure 36) contain 10 bars, representing the 10 repetitions of the Monte Carlo simulations, each with 1,000,000 iterations. These bars illustrate the distribution of the outcomes, where each bar reflects the result of a single repetition. Additionally, a red line is superimposed on each figure, indicating the average value across all ten repetitions. This average value helps to highlight the central tendency of the simulation results, providing a clear point of reference for assessing the reliability and consistency of the switching substations under study.

4.1. Single-Busbar Systems

The basic single-busbar system exhibits an average of 380.4 outages, as depicted in Figure 20 (equivalent to 380.4 occurrences of fault intervals). However, a limitation of single-system configurations arises from the serial connection of switching elements, leading to a power outage whenever any element faults. Introducing an auxiliary bus to the single-busbar system improves operational reliability by enabling power supply through the auxiliary bus. This dual-system setup enhances reliability significantly; in case of a failure in one system, power can still be supplied through the other. Complete power outage occurs only if faults occur simultaneously in both systems. The results of the single-busbar system with an auxiliary bus are presented in Figure 21, showing that across all ten repetitions, only one power outage occurred.
Switchgears with single-busbar systems, featuring one active incoming and outgoing field, shares the limitations of conventional single-busbar systems. It experiences an average of 728.3 outages (as shown in Figure 22) due to the series connection of switching elements and their increased number.
Configurations with an auxiliary bus significantly increase reliability. For the same topology (one active incoming and outgoing field), incorporating an auxiliary bus resulted in only one complete power outage and a relatively higher count of partial power outages (averaging 724.9) due to the series connection of multiple switching elements, as depicted in Figure 23 and Figure 24, respectively.
Conversely, the switchgear with a single-busbar system and two active input and output fields demonstrates superior reliability, owing to the parallel connection of fields. Here, a power outage requires multiple element failures simultaneously, such as both incoming and outgoing fields failing together. Although bus failure could lead to a power outage, such failures are rare due to their minimal fault intervals. This configuration exhibits high operational reliability, with only a small number of power outages (averaging 3.5—Figure 25).
The single-busbar system with one active incoming and outgoing field with an auxiliary bus showcases exceptional operational reliability, experiencing only one power outage on average, occurring in the ninth calculation repetition. This minimal average indicates high reliability due to the possibility of power supply through the auxiliary bus.
For the single-busbar system with two active incoming and outgoing fields with an auxiliary bus, no power outages or partial power outages were calculated, underscoring its very high operational reliability.
Additionally, withdrawable circuit breakers offer a solution where visible isolation is unnecessary, replacing two disconnectors with a single circuit breaker. With a much smaller fault interval than other switchgear elements (except for buses), withdrawable circuit breakers demonstrate good or high operational reliability, with a significantly lower average number of power outages compared to traditional single-busbar systems (33.2 in Figure 26 versus 380.4 in Figure 20).
Figure 27 illustrates the power outages for the single-busbar system with withdrawable circuit breakers and one active incoming and outgoing field, averaging 65.3 outages. This is in stark contrast to the configuration without withdrawable circuit breakers, which experienced 728.3 power outages (as shown in Figure 22), indicating significantly higher reliability.
Figure 28 and Figure 29 show the results for the single-busbar system with withdrawable circuit breakers and two active incoming and outgoing fields. Here, only two complete power outages and 64.7 partial power outages were observed. Compared to the configuration without withdrawable circuit breakers, these figures demonstrate a higher degree of reliability (3.6 complete power outages and 724.9 partial power outages).
For the purpose of easier comparison, Table 2 summarizes the results for single-busbar systems. Among the single-busbar systems, the implementation with two active incoming and outgoing fields with an auxiliary bus exhibits the highest operational reliability, evidenced by its absence of power outages or partial power outages in any attempts. This reliability is attributed to the auxiliary bus, ensuring power supply even in the event of other element failures.

4.2. Double-Busbar Systems

Figure 30, Figure 31, Figure 32, Figure 33, Figure 34, Figure 35 and Figure 36 illustrate the occurrences of power and partial power outages across all double-busbar systems, while Table 3 provides a comparative overview of the results.
Double-busbar systems are integral to the reliability of electrical substations, as the results show.
Figure 30 presents data for the basic double-busbar system, which exhibited 222.6 power outages per million attempts, indicating stable performance with no partial power outages observed.
In Figure 31, the double-busbar system with an auxiliary bus demonstrated improved reliability, recording 76.8 power outages per million attempts. This configuration, benefiting from the auxiliary bus, effectively mitigates interruptions by enabling alternative power supply routes without any partial power outages.
Figure 32 illustrates the performance of the double-busbar system with one active incoming and outgoing field, reporting 447.4 power outages per million attempts. Despite its simplicity, this setup maintained reliability without partial power outages.
The configuration with two active incoming and outgoing fields, shown in Figure 33, emerged as the most reliable among the examined systems. It recorded zero complete power outages and only 0.1 partial power outages per million attempts. This high reliability is attributed to the redundancy provided by dual active fields, ensuring continuous power supply even under challenging conditions.
Figure 34 highlights the results for the double-busbar system with withdrawable circuit breakers, which experienced 31.3 power outages per million attempts, with no partial power outages observed.
Figure 35 and Figure 36 delve into configurations of the double-busbar system with withdrawable circuit breakers, detailing 64.8 power outages for one incoming and outgoing field in Figure 35 and minimal partial power outages (0.1) for two incoming and outgoing fields in Figure 36.
Notably, configurations utilizing the bypass disconnector in double-busbar systems completely eliminated both power outages and partial power outages.
In summary, configurations featuring two active incoming and outgoing fields generally exhibited the highest operational reliability. When coupled with auxiliary buses or withdrawable circuit breakers, these configurations minimized or eliminated power interruptions, underscoring their robustness in ensuring continuous power supply under diverse operational scenarios. The results are summarized in Table 3.

4.3. Switchgear with Ring-Type Power Supply

A reliable option for ensuring uninterrupted power supply is the utilization of looped power supply circuits, specifically ring-type power supply. Systems connected in parallel offer elevated operational reliability due to the minimal probability of simultaneous failures occurring in two parallel systems.
Table 4 provides a comparative overview of the results, while Figure 37 illustrates the occurrences of power outages in the switchgear with a ring-type power supply with one active incoming and outgoing field, and Figure 38 shows the occurrences of partial power outages in the switchgear with a ring-type power supply with two active incoming and outgoing fields.
The switchgear with a ring-type power supply featuring two active incoming and outgoing fields exhibits exceptionally high operational reliability, as evidenced by the absence of any calculated power outages in the program. This confirms the consistent provision of uninterrupted power supply.
While there were a few instances of partial power outages, their occurrence was minimal, with an average of only 0.3 partial power outages observed. This indicates a negligible impact on overall system reliability.
The comparative table (Table 4) highlights that all implementations of switchgear with looped supply demonstrate high operational reliability. Among these configurations, the implementation with two active input and output fields stands out for its exceptional reliability, as evidenced by the absence of any recorded power outages.
From the comparative table, it is evident that all implementations of switchgears with looped supply boast high operational reliability. However, the implementation featuring two active input and output fields particularly stands out for its exceptional operational reliability, as it recorded no power outages

5. Conclusions

In this study, we investigated the operational reliability of different types of switching substations using the Monte Carlo method. Our aim was to evaluate, based on the obtained results for individual types of switching substation, which implementation is the most reliable or has a higher probability of energy transfer. To facilitate comparison, we conducted 10 repetitions of the calculation for each implementation.
Our findings highlight the significant influence of the number of switching elements and their connection on the operational reliability of switching substations. Each element within the substation has its own failure interval, determined by maintenance time per year and the duration of failures, based on statistical data on device reliability.
Using a developed program, we generated random numbers to hit the failure interval, simulating a one-year time frame. Power outages occurred upon hitting specific combinations of intervals, dependent on the substation type. Graphical representations of simulation results displayed the number of power outages for each repetition and their average value, with fewer outages indicating greater reliability.
Our analysis revealed that a greater number of busbars and fewer switching elements contribute to enhanced operational reliability. Additionally, the parallel connection of switching elements was found to increase reliability.
Overall, these simulations aimed to inform decision-making when constructing new switching substations, ensuring stable operation within the power system.

Author Contributions

Conceptualization, F.P.; methodology, F.P.; software, F.P.; validation, F.P.; formal analysis, F.P.; investigation, F.P.; resources, F.P.; data curation, F.P.; writing—original draft preparation, F.P.; writing—review and editing, F.P.; visualization, F.P.; supervision, P.V. All authors have read and agreed to the published version of the manuscript.

Funding

This research received no external funding.

Data Availability Statement

The data presented in this study are available on request from the corresponding author.

Conflicts of Interest

The authors declare no conflict of interest.

References

  1. Zhou, N.; Xu, Y. A Multi-Evidence Fusion Based Integrated Method for Health Assessment of Medium Voltage Switchgears in Power Grid. IEEE Trans. Power Deliv. 2023, 38, 1406–1415. [Google Scholar] [CrossRef]
  2. Iliev, A.; Dimitrov, D.; Dimishkovska, N. Evaluation of Reliability of Power Substations Considering the Uncertainty of the Distributed Generation. In Proceedings of the 2020 55th International Scientific Conference on Information, Communication and Energy Systems and Technologies (ICEST), Niš, Serbia, 10–12 September 2020; pp. 123–126. [Google Scholar] [CrossRef]
  3. Zhou, N.; Xu, Y. A Prioritization Method for Switchgear Maintenance Based on Equipment Failure Mode Analysis and Integrated Risk Assessment. IEEE Trans. Power Deliv. 2024, 39, 728–739. [Google Scholar] [CrossRef]
  4. Abud, T.P.; Augusto, A.A.; Fortes, M.Z.; Maciel, R.S.; Borba, B.S.M.C. State of the Art Monte Carlo Method Applied to Power System Analysis with Distributed Generation. Energies 2023, 16, 394. [Google Scholar] [CrossRef]
  5. Li, Z.; Wu, W.; Tai, X.; Zhang, B. Optimization model-based reliability assessment for distribution networks considering detailed placement of circuit breakers and switches. IEEE Trans. Power Syst. 2020, 35, 3991–4004. [Google Scholar] [CrossRef]
  6. Zhou, N.; Xu, Y.; Cho, S.; Wee, C.T. A Systematic Review for Switchgear Asset Management in Power Grids: Condition Monitoring, Health Assessment, and Maintenance Strategy. IEEE Trans. Power Deliv. 2023, 38, 3296–3311. [Google Scholar] [CrossRef]
  7. Khoddam, M.; Sadeh, J.; Pourmohamadiyan, P. Performance evaluation of circuit breaker electrical contact based on dynamic resistance signature and using health index. IEEE Trans. Compon. Packag. Manuf. Technol. 2016, 6, 1505–1512. [Google Scholar] [CrossRef]
  8. Xiong, Q.; Zhao, J.; Guo, Z.; Feng, X.; Liu, H.; Zhu, L.; Ji, S. Mechanical defects diagnosis for gas insulated switchgear using acoustic imaging approach. Appl. Acoust. 2021, 174, 107784. [Google Scholar] [CrossRef]
  9. Yan, Y.; Ren, S.; Lu, Y.; Yang, S.; Zhao, K.; Li, H. Efficient and low-cost PD monitoring and locating system for MV switchgears using TEV detectors. IEEE Trans. Power Deliv. 2021, 36, 3266–3269. [Google Scholar] [CrossRef]
  10. Xiao, X.; Guo, J.; Yang, J.; Fang, X.; Shi, M.; Liu, Y.; Guo, M.; Yang, Z.; Wu, Z. A novel switchgear state assessment framework based on improved fuzzy C-means clustering method with deep belief network. Front. Energy Res. 2023, 11, 1335184. [Google Scholar] [CrossRef]
  11. Urgun, D.; Singh, C. Power System Reliability Evaluation using Monte Carlo Simulation and Multi Label Classifier. In Proceedings of the 2018 20th National Power Systems Conference (NPSC), Tiruchirappalli, India, 14–16 December 2018; pp. 1–6. [Google Scholar] [CrossRef]
  12. Hasan, K.N.; Preece, R.; Milanović, J.V. Existing Approaches and Trends in Uncertainty Modelling and Probabilistic Stability Analysis of Power Systems with Renewable Generation. Renew. Sustain. Energy Rev. 2019, 101, 168–180. [Google Scholar] [CrossRef]
  13. Kalos, M.H.; Whitlock, P.A. Monte Carlo Methods; Wiley-VCH: Weinheim, Germany, 1986. [Google Scholar]
  14. Available online: https://www.eles.si/Portals/0/Documents/porocila/letna-porocila/Porocilo%20o%20obratovanju%202023.pdf (accessed on 20 March 2024).
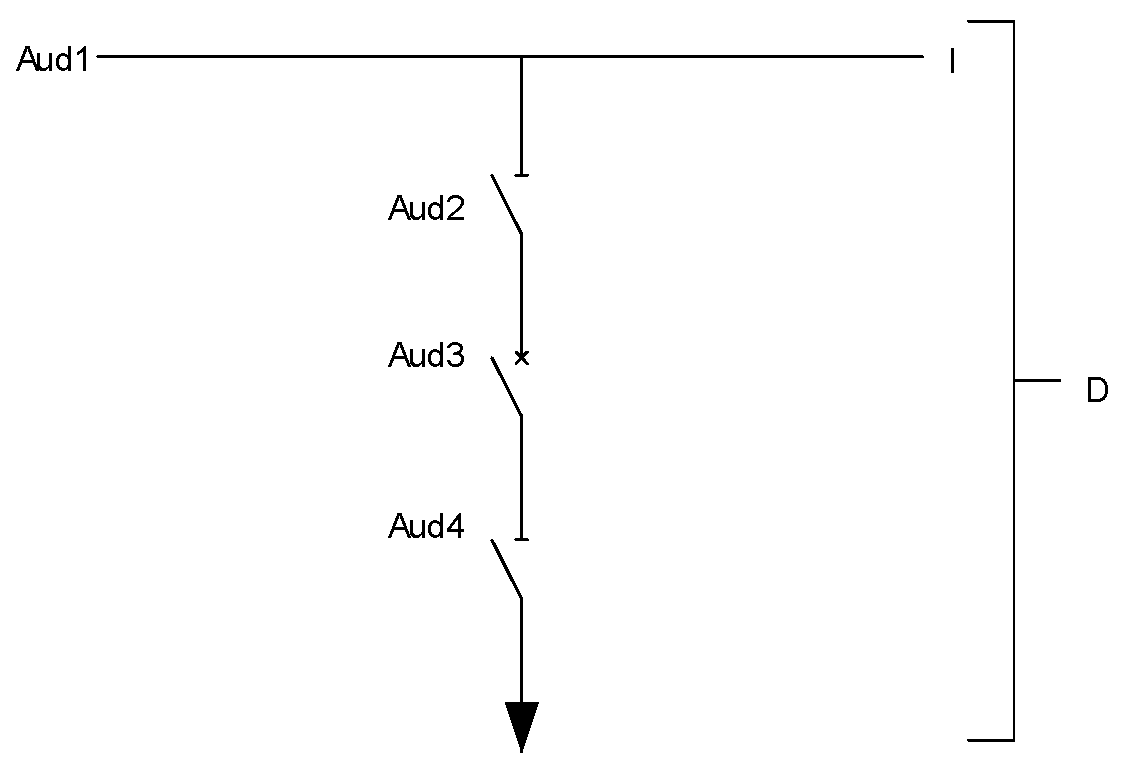
Figure 1. Single-busbar system.
Energies 17 03142 g001
Figure 2. Single-busbar system: (a) one active input and output field, (b) two active input and output fields.
Energies 17 03142 g002
Figure 3. Single-busbar system with one active incoming and outgoing field with an auxiliary bus.
Energies 17 03142 g003
Figure 4. Single-busbar system with two active incoming and outgoing fields with an auxiliary bus.
Energies 17 03142 g004
Figure 5. Single-busbar system with withdrawable circuit breaker.
Energies 17 03142 g005
Figure 6. Single-busbar system with withdrawable circuit breaker: (a) one active input and output field, (b) two active input and output fields.
Energies 17 03142 g006
Figure 7. Double-busbar system.
Energies 17 03142 g007
Figure 8. Double-busbar system with auxiliary bus.
Energies 17 03142 g008
Figure 9. Double-busbar system with one active incoming and outgoing field.
Energies 17 03142 g009
Figure 10. Double-busbar system with two active incoming and outgoing fields.
Energies 17 03142 g010
Figure 11. Double-busbar system with withdrawable circuit breaker.
Energies 17 03142 g011
Figure 12. Double-busbar system with withdrawable circuit breaker with one active incoming and outgoing field.
Energies 17 03142 g012
Figure 13. Double-busbar system with withdrawable circuit breaker with two active incoming and outgoing fields.
Energies 17 03142 g013
Figure 14. Double-busbar system with bypass disconnector.
Energies 17 03142 g014
Figure 15. Double-busbar system with bypass disconnector with one active field.
Energies 17 03142 g015
Figure 16. Double-busbar system with bypass disconnector with two active fields.
Energies 17 03142 g016
Figure 17. Switchgear with ring-type power supply.
Energies 17 03142 g017
Figure 18. Switchgear with ring-type power supply with one active incoming and outgoing field.
Energies 17 03142 g018
Figure 19. Switchgear with ring-type power supply with two active incoming and outgoing fields.
Energies 17 03142 g019
Figure 20. Power outage in single-busbar system.
Energies 17 03142 g020
Figure 21. Power outage in single-busbar system with an auxiliary bus.
Energies 17 03142 g021
Figure 22. Power outage in single-busbar system with one active incoming and outgoing field.
Energies 17 03142 g022
Figure 23. Power outage in single-busbar system with one active incoming and outgoing field with an auxiliary bus.
Energies 17 03142 g023
Figure 24. Partial power outage in single-busbar system with one active incoming and outgoing field with an auxiliary bus.
Energies 17 03142 g024
Figure 25. Power outage in single-busbar system with an auxiliary bus with two active incoming and outgoing fields.
Energies 17 03142 g025
Figure 26. Power outage in single-busbar system with withdrawable circuit breaker.
Energies 17 03142 g026
Figure 27. Power outage in single-busbar system—withdrawable circuit breaker with one active incoming and outgoing field.
Energies 17 03142 g027
Figure 28. Power outage in single-busbar system—withdrawable circuit breaker with two active incoming and outgoing fields.
Energies 17 03142 g028
Figure 29. Partial power outage in single-busbar system—withdrawable circuit breaker with two active incoming and outgoing fields.
Energies 17 03142 g029
Figure 30. Power outage in double-busbar system.
Energies 17 03142 g030
Figure 31. Power outage in double-busbar system with an auxiliary bus.
Energies 17 03142 g031
Figure 32. Power outage in double-busbar system—one active incoming and outgoing field.
Energies 17 03142 g032
Figure 33. Power outage in double-busbar system with an auxiliary bus with two active incoming and outgoing fields.
Energies 17 03142 g033
Figure 34. Power outage in double-busbar system with withdrawable circuit breaker.
Energies 17 03142 g034
Figure 35. Power outage in double-busbar system—withdrawable circuit breaker with one active incoming and outgoing field.
Energies 17 03142 g035
Figure 36. Partial power outage in double-busbar system—withdrawable circuit breaker—two active incoming and outgoing fields.
Energies 17 03142 g036
Figure 37. Power outage in switchgear with ring-type power supply—one active incoming and outgoing field.
Energies 17 03142 g037
Figure 38. Partial power outages of switchgear with ring-type power supply with two active incoming and outgoing fields.
Energies 17 03142 g038
Table 1. Statistical data of high-voltage switchgear failures [14].
DeviceEventAverage Outage Frequency
(Per year)
Average Outage Duration (hours)Average Device
Unavailability (hours/year)
Circuit breakerStochastic fault/error2500300.012
Planned
maintenance
15100.667
DisconnectorStochastic fault/error614320.052
Planned
maintenance
561.2
Withdrawable circuit breakerStochastic fault/error2500150.006
Planned
maintenance
1540.267
Time of separation of the withdrawable circuit breaker from the busbars0.1
Time of separation of the circuit breaker from the busbars4
Table 2. Comparative table for single-busbar systems.
ConfigurationPower Outages/1,000,000 AttemptsPartial Power Outages/1,000,000 Attempts
Single-busbar system380.4/
Single-busbar system—auxiliary bus0.1/
Single-busbar system—one active incoming and outgoing field728.3/
Single-busbar system with two active incoming and outgoing fields3.6724.9
Single-busbar system with one active incoming and outgoing field with an auxiliary bus0.1/
Single-busbar system with two active incoming and outgoing fields with an auxiliary bus00
Single-busbar system with withdrawable circuit breaker33.2/
Single-busbar system with withdrawable circuit breaker with one active incoming and outgoing field65.3/
Single-busbar system with withdrawable circuit breaker with two active incoming and outgoing fields264.7
Table 3. Comparative table for double-busbar systems.
ConfigurationPower Outages/1,000,000 AttemptsPartial Power Outages/1,000,000 Attempts
Double-busbar system222.6/
Double-busbar system with auxiliary bus76.8/
Double-busbar system—one active incoming and outgoing field447.4/
Double-busbar system—two active incoming and outgoing fields00.1
Double-busbar system—withdrawable circuit breaker31.3/
Double-busbar system—withdrawable circuit breaker with one active incoming and outgoing field64.8/
Double-busbar system—withdrawable circuit breaker with two active incoming and outgoing fields00.1
Double-busbar system—bypass disconnector (all configurations)00
Table 4. Comparative table with type power supply.
ConfigurationPower Outages/1,000,000 AttemptsPartial Power Outages/1,000,000 Attempts
Switchgear with ring-type power supply0/
Switchgear with ring-type power supply with one active incoming and outgoing field0.2/
Switchgear with ring-type power supply with two active incoming and outgoing fields00.3
Disclaimer/Publisher’s Note: The statements, opinions and data contained in all publications are solely those of the individual author(s) and contributor(s) and not of MDPI and/or the editor(s). MDPI and/or the editor(s) disclaim responsibility for any injury to people or property resulting from any ideas, methods, instructions or products referred to in the content.