Remaining-Useful-Life Prediction for Li-Ion Batteries


Abstract
1. Introduction
2. Properties of Li-Ion Batteries
2.1. State of Charge
2.2. Methods of Battery Charging
2.2.1. Constant-Current Method (CC)
2.2.2. Constant-Voltage Method (CV)
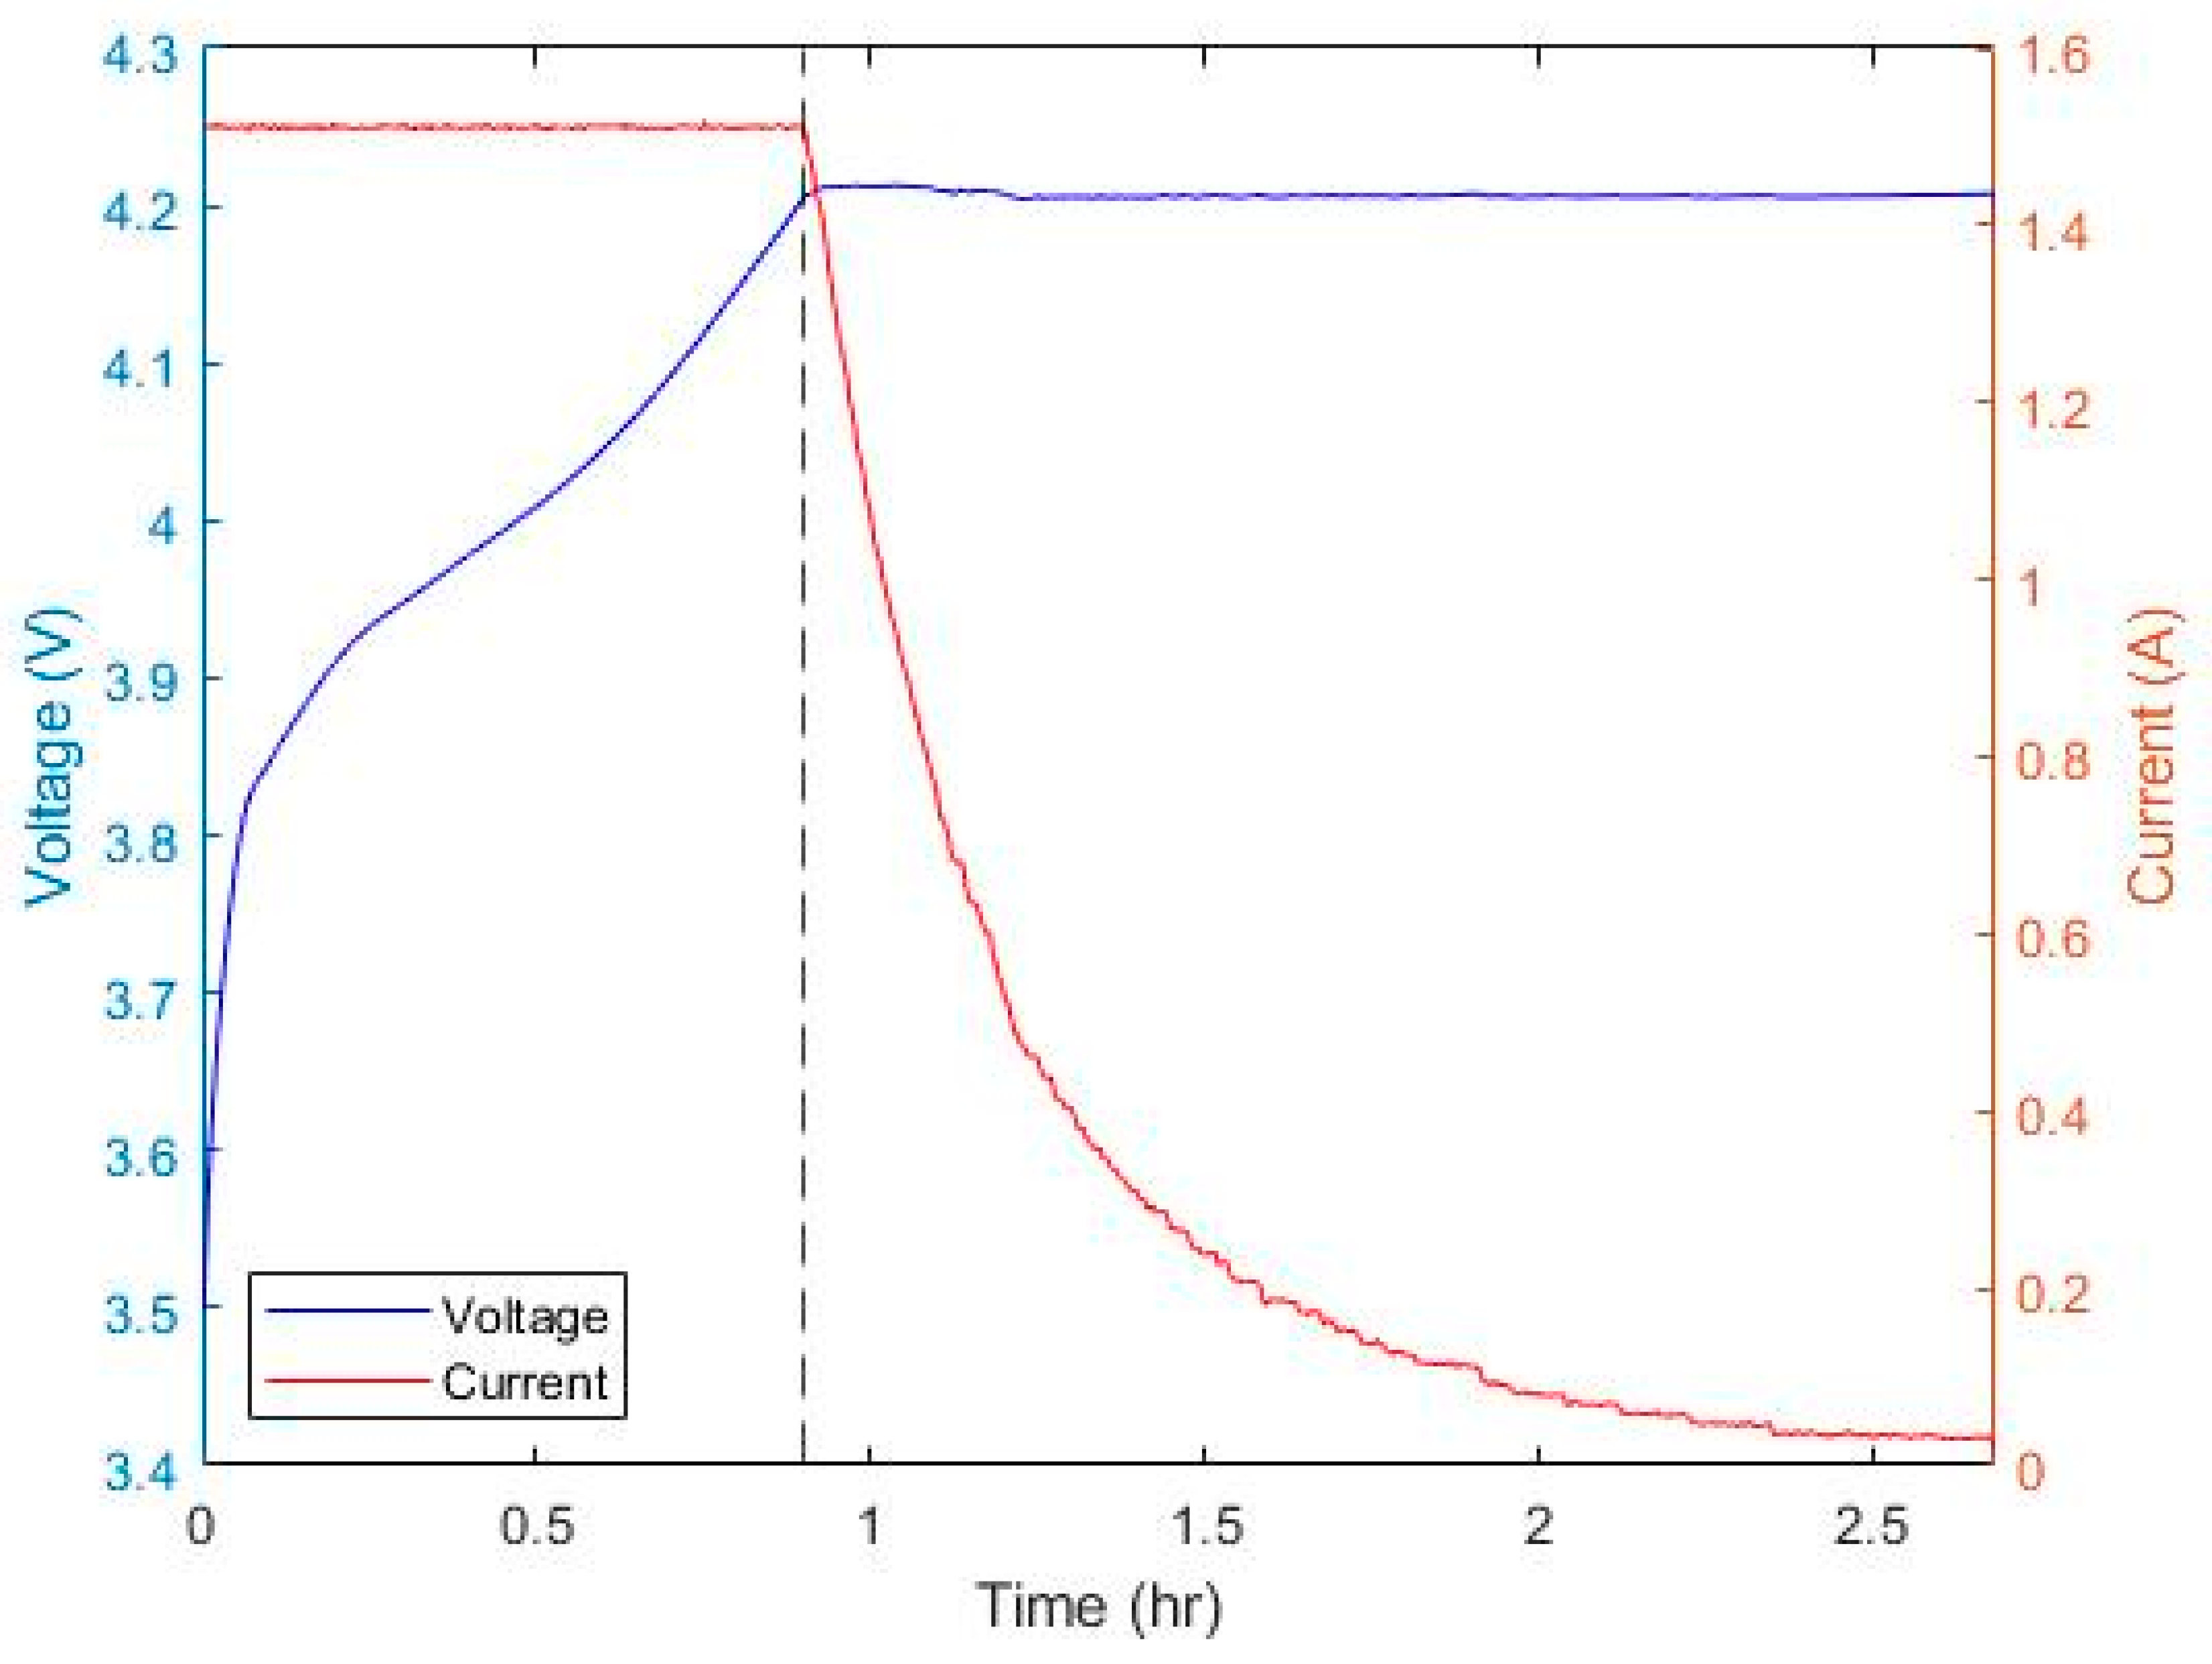
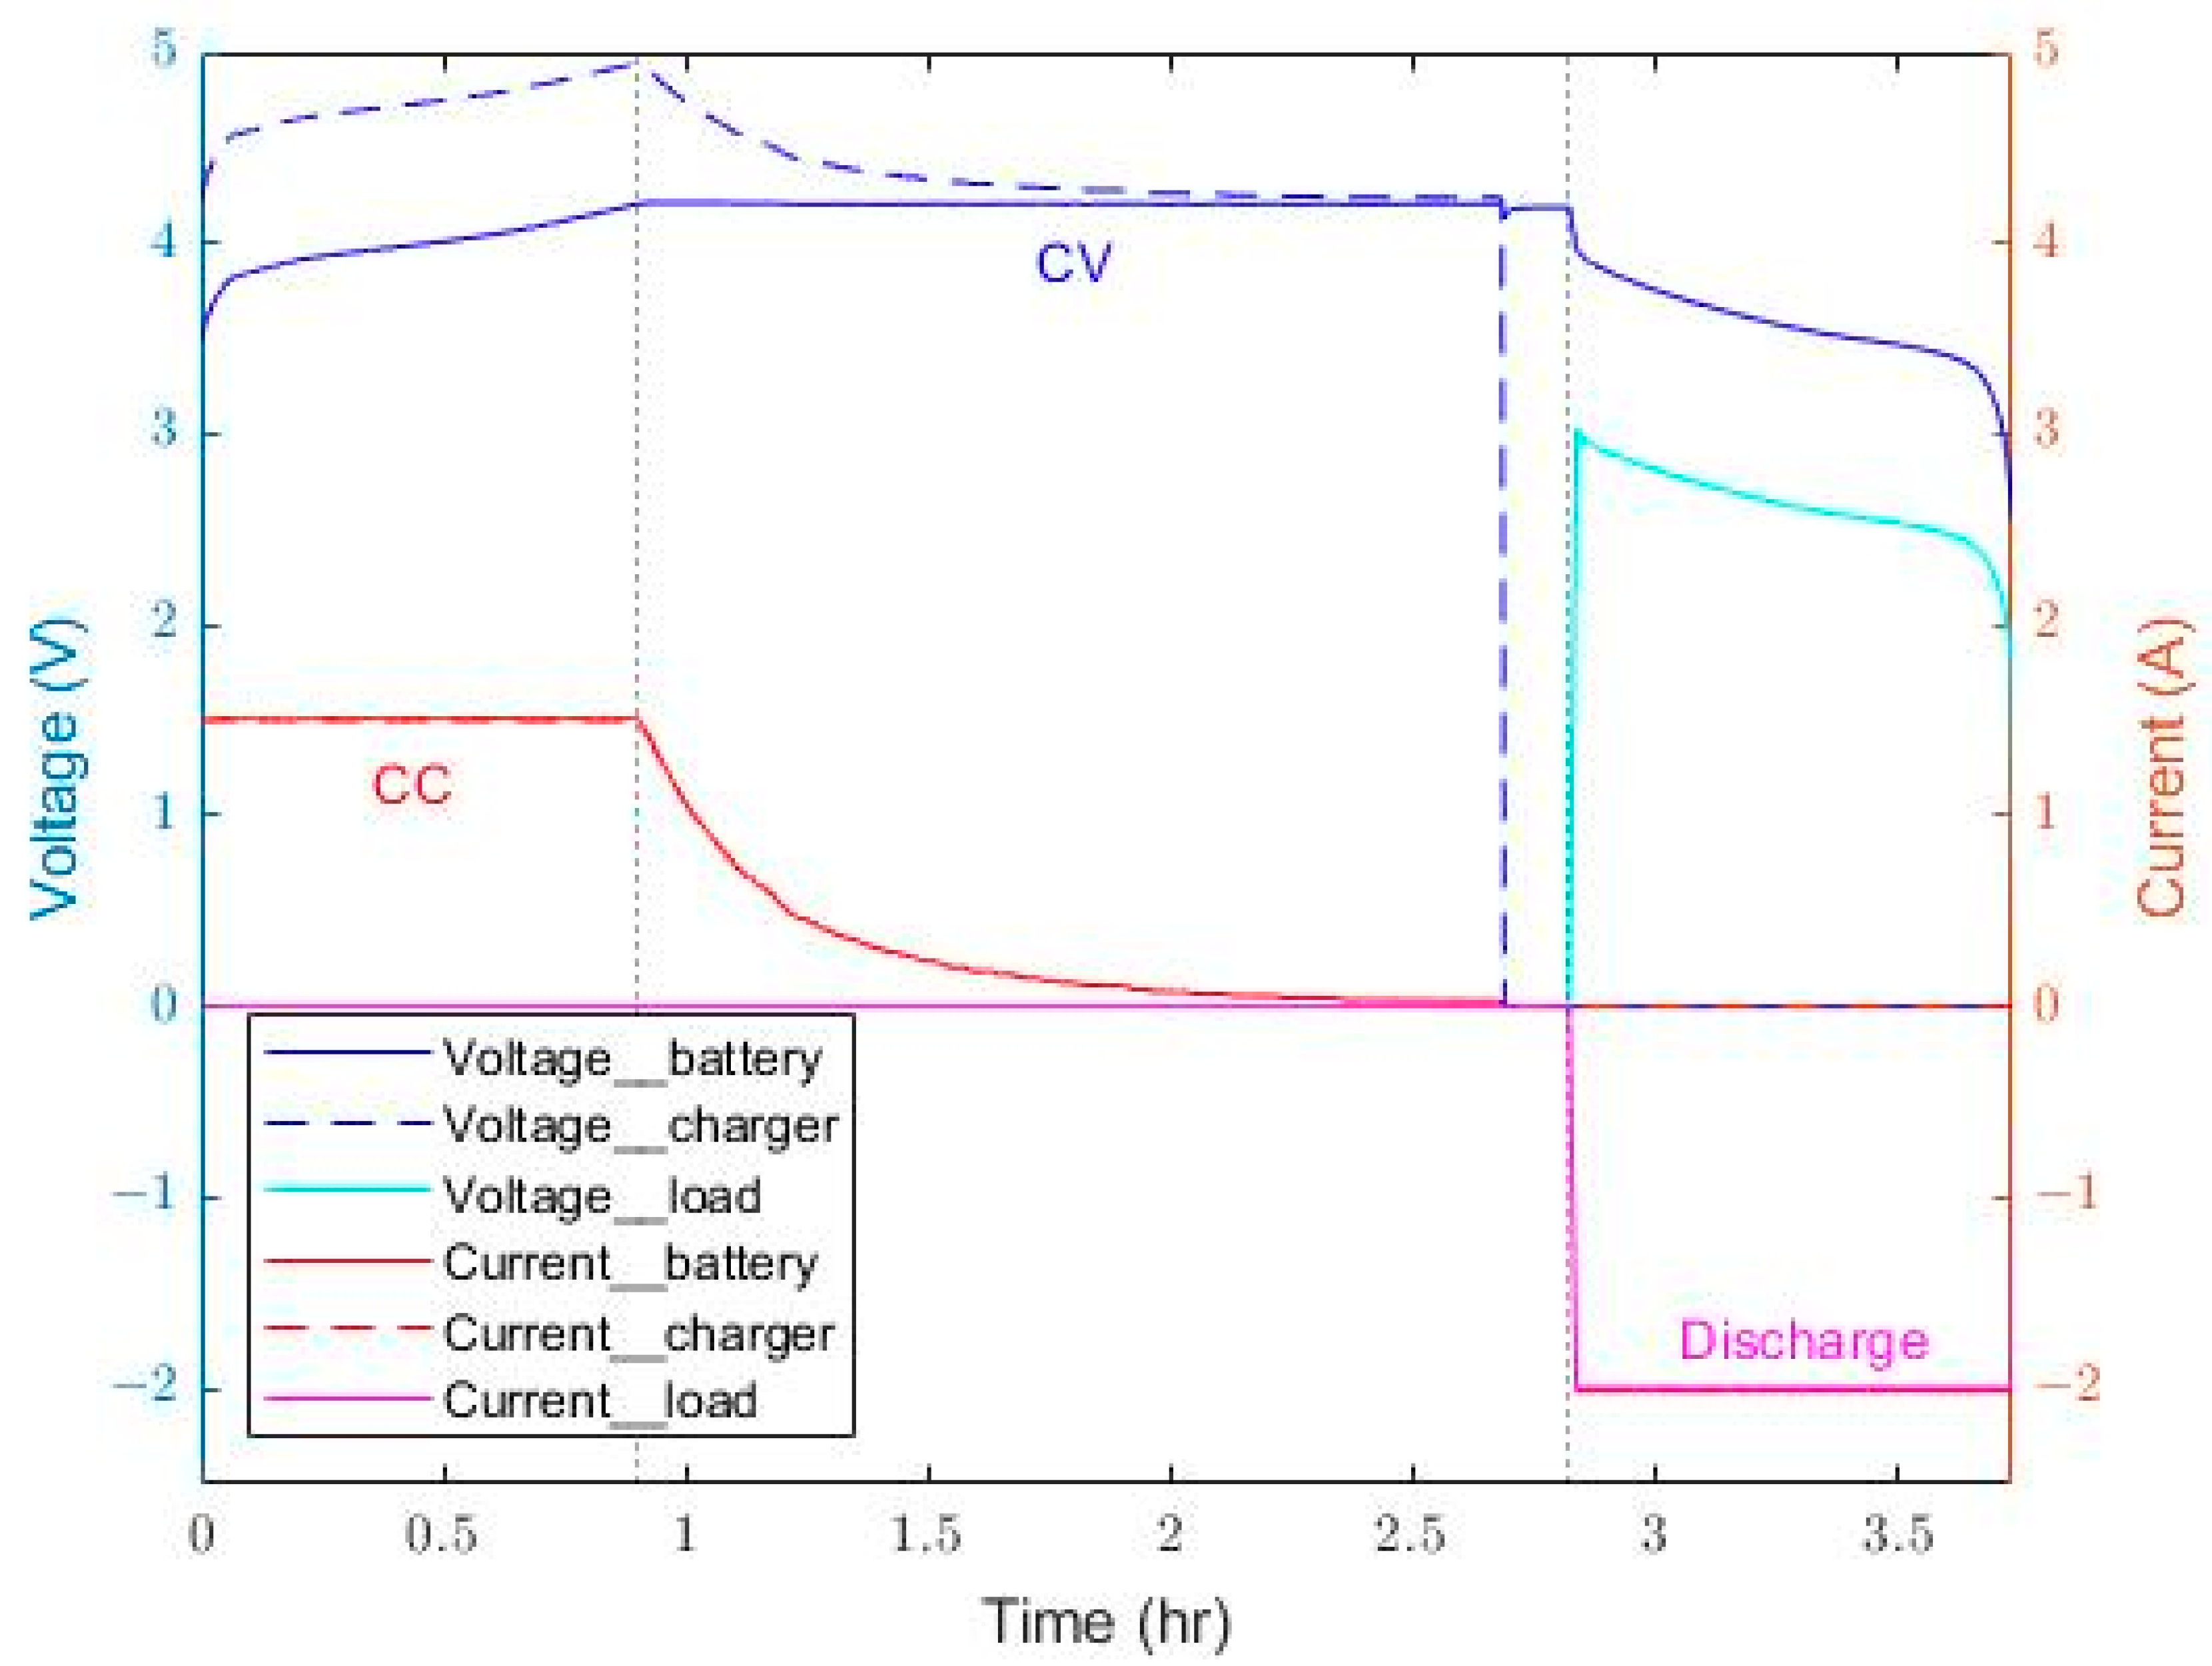
2.2.3. Constant-Current and Constant-Voltage Method (CC-CV)
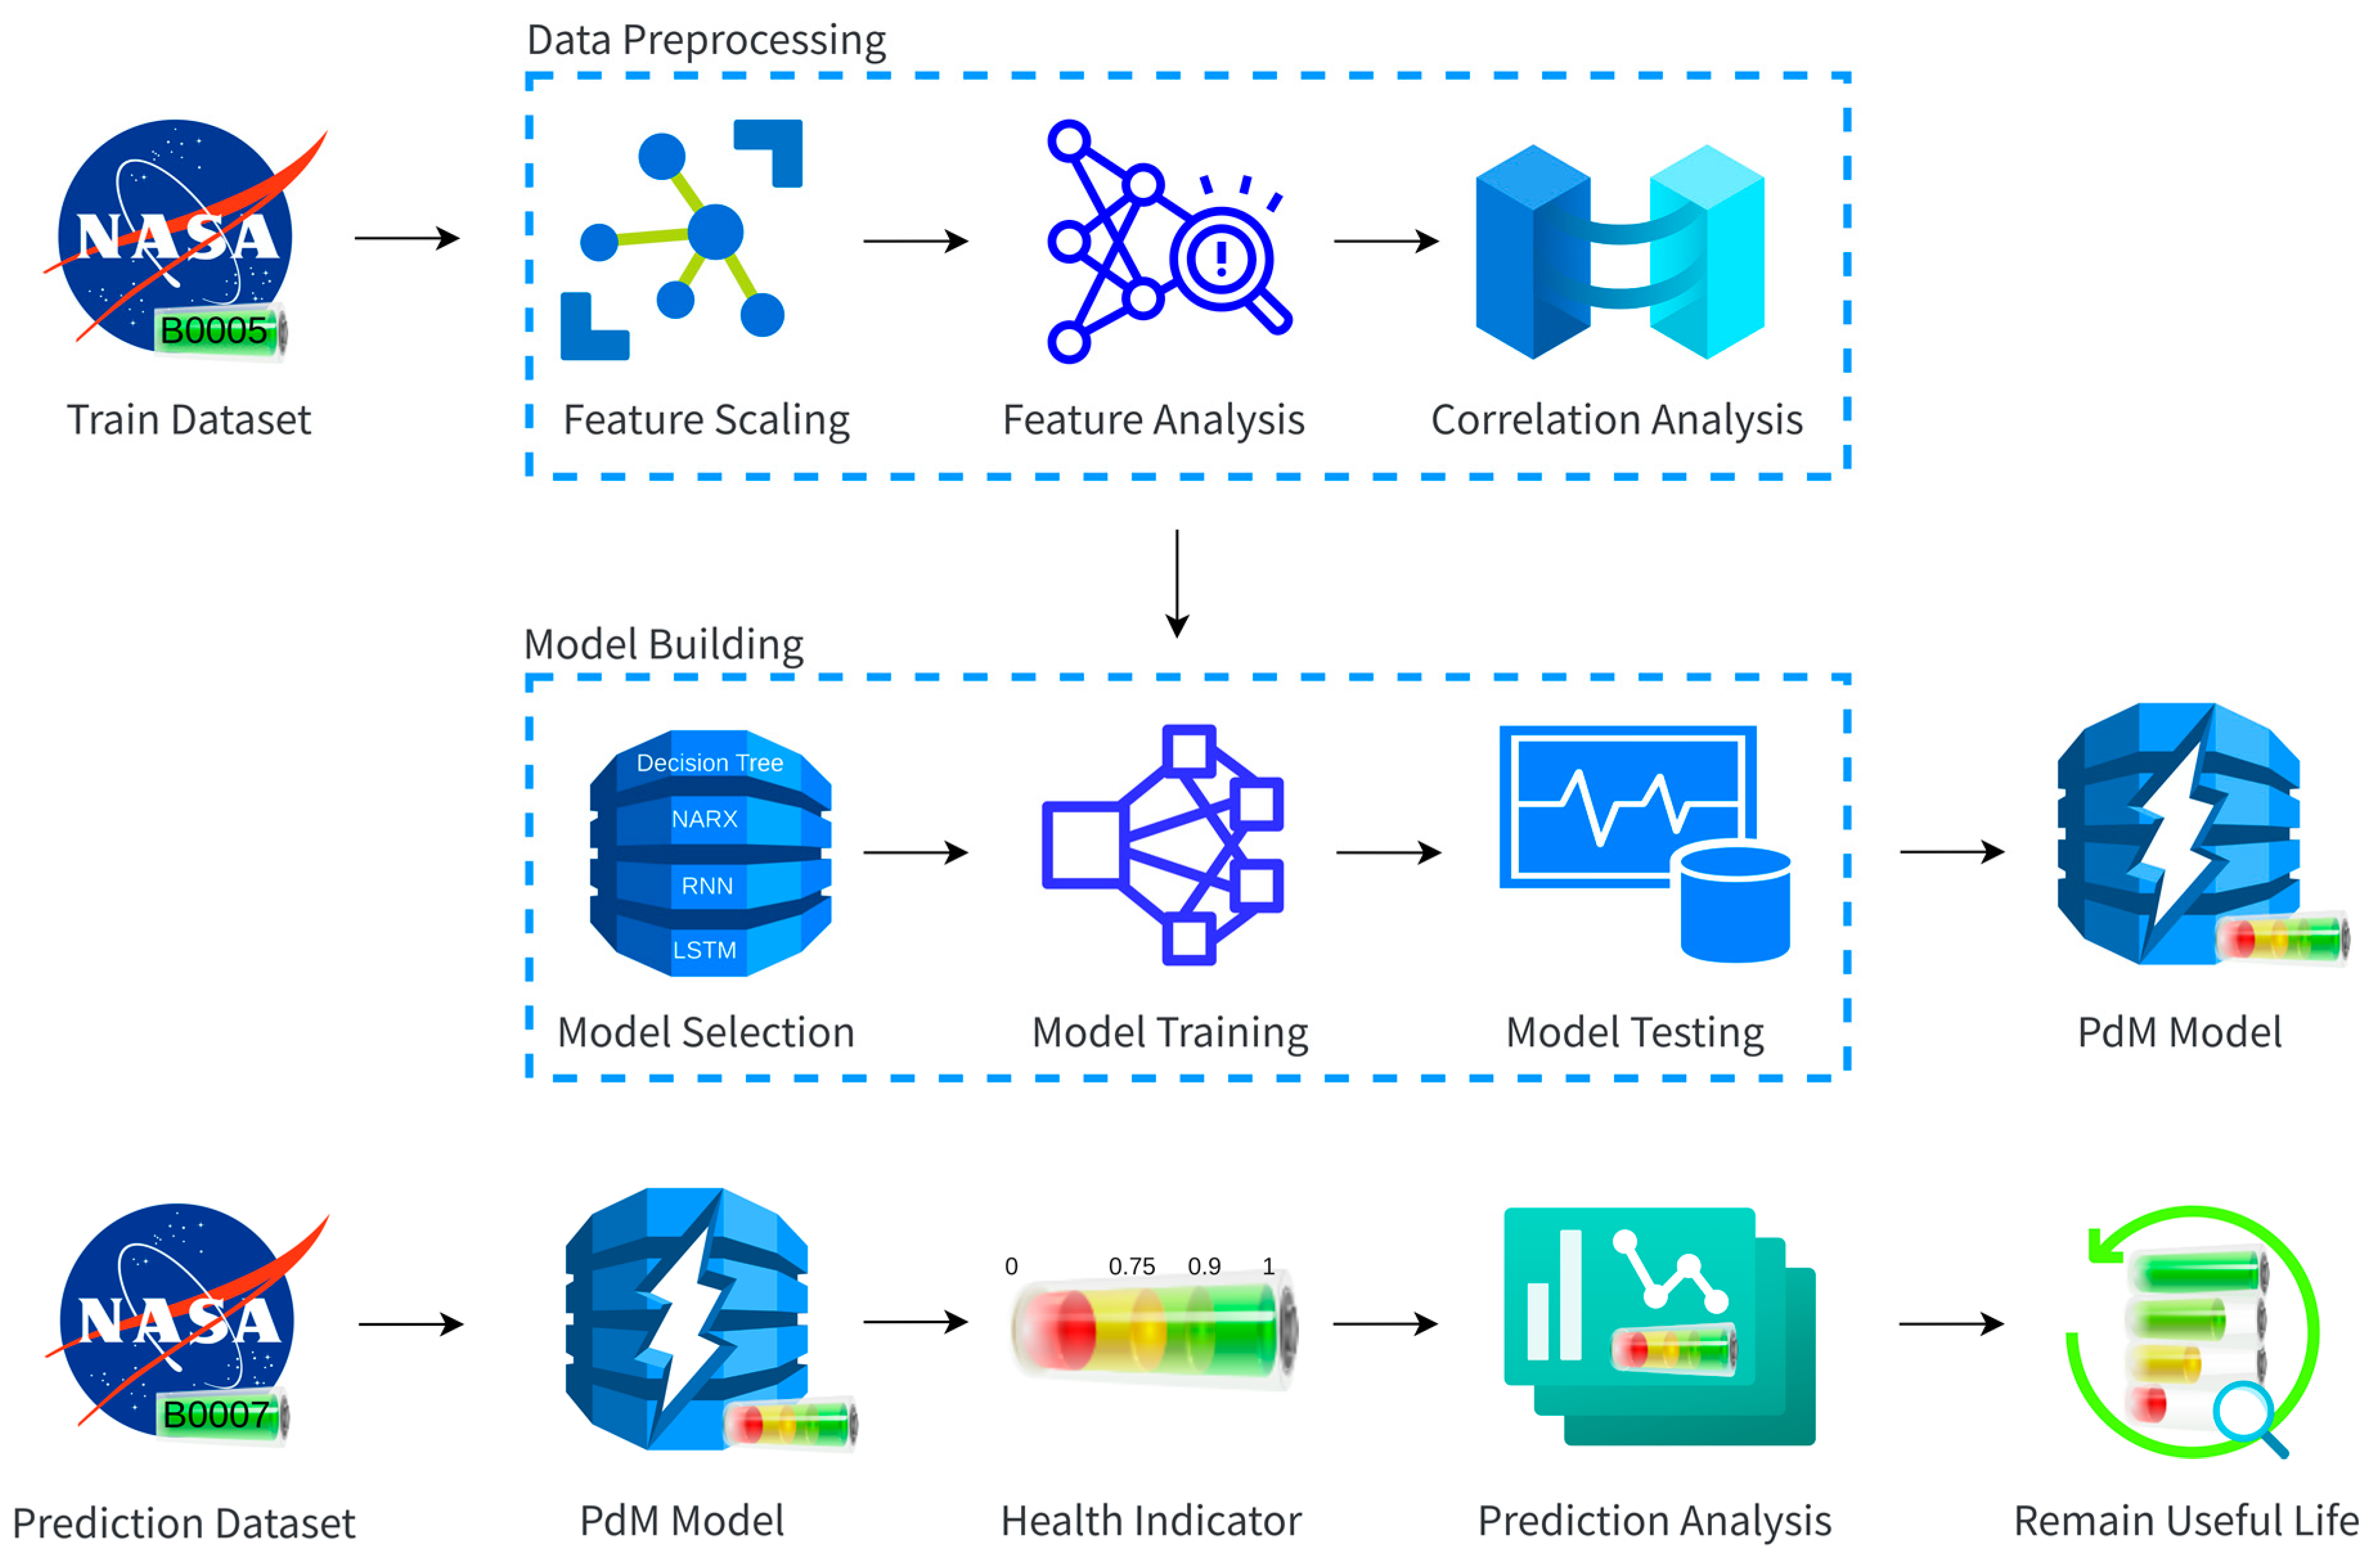
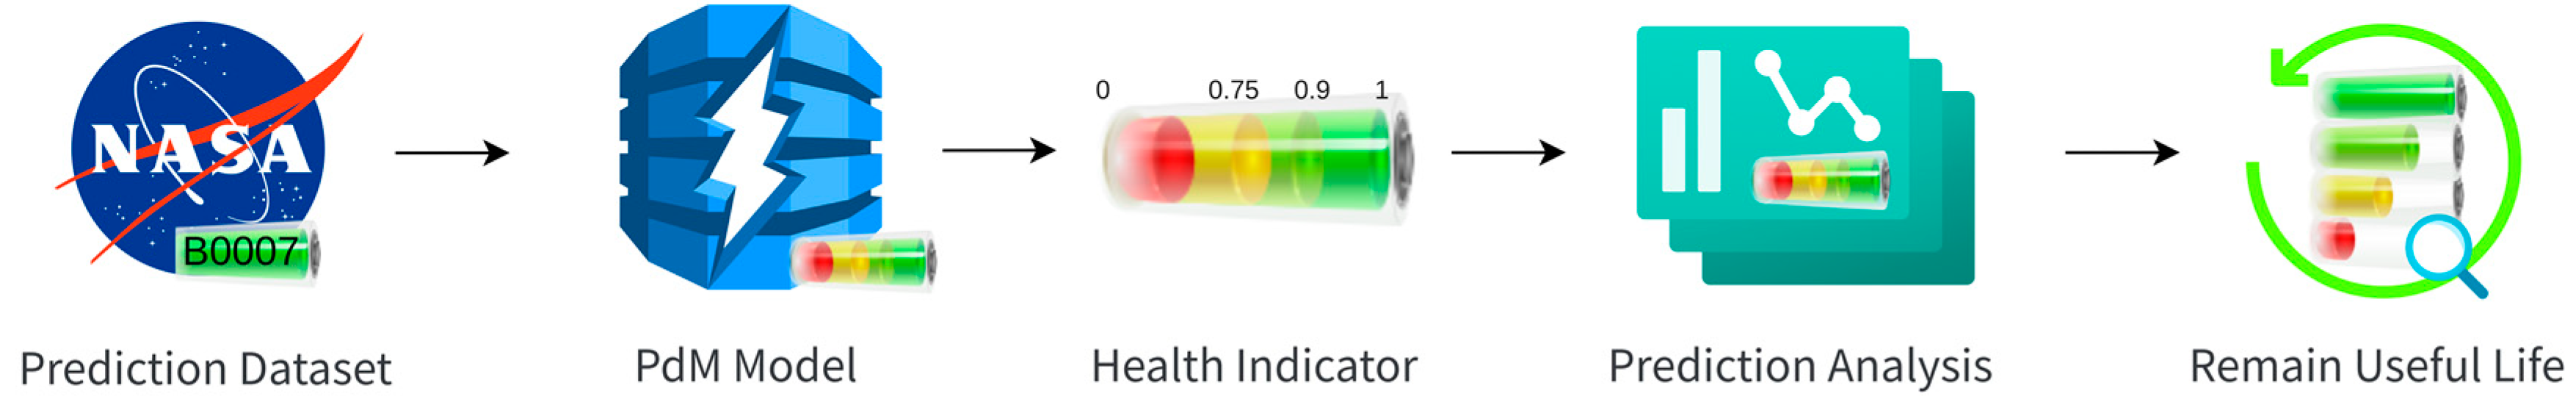
3. Framework for Predictive Maintenance
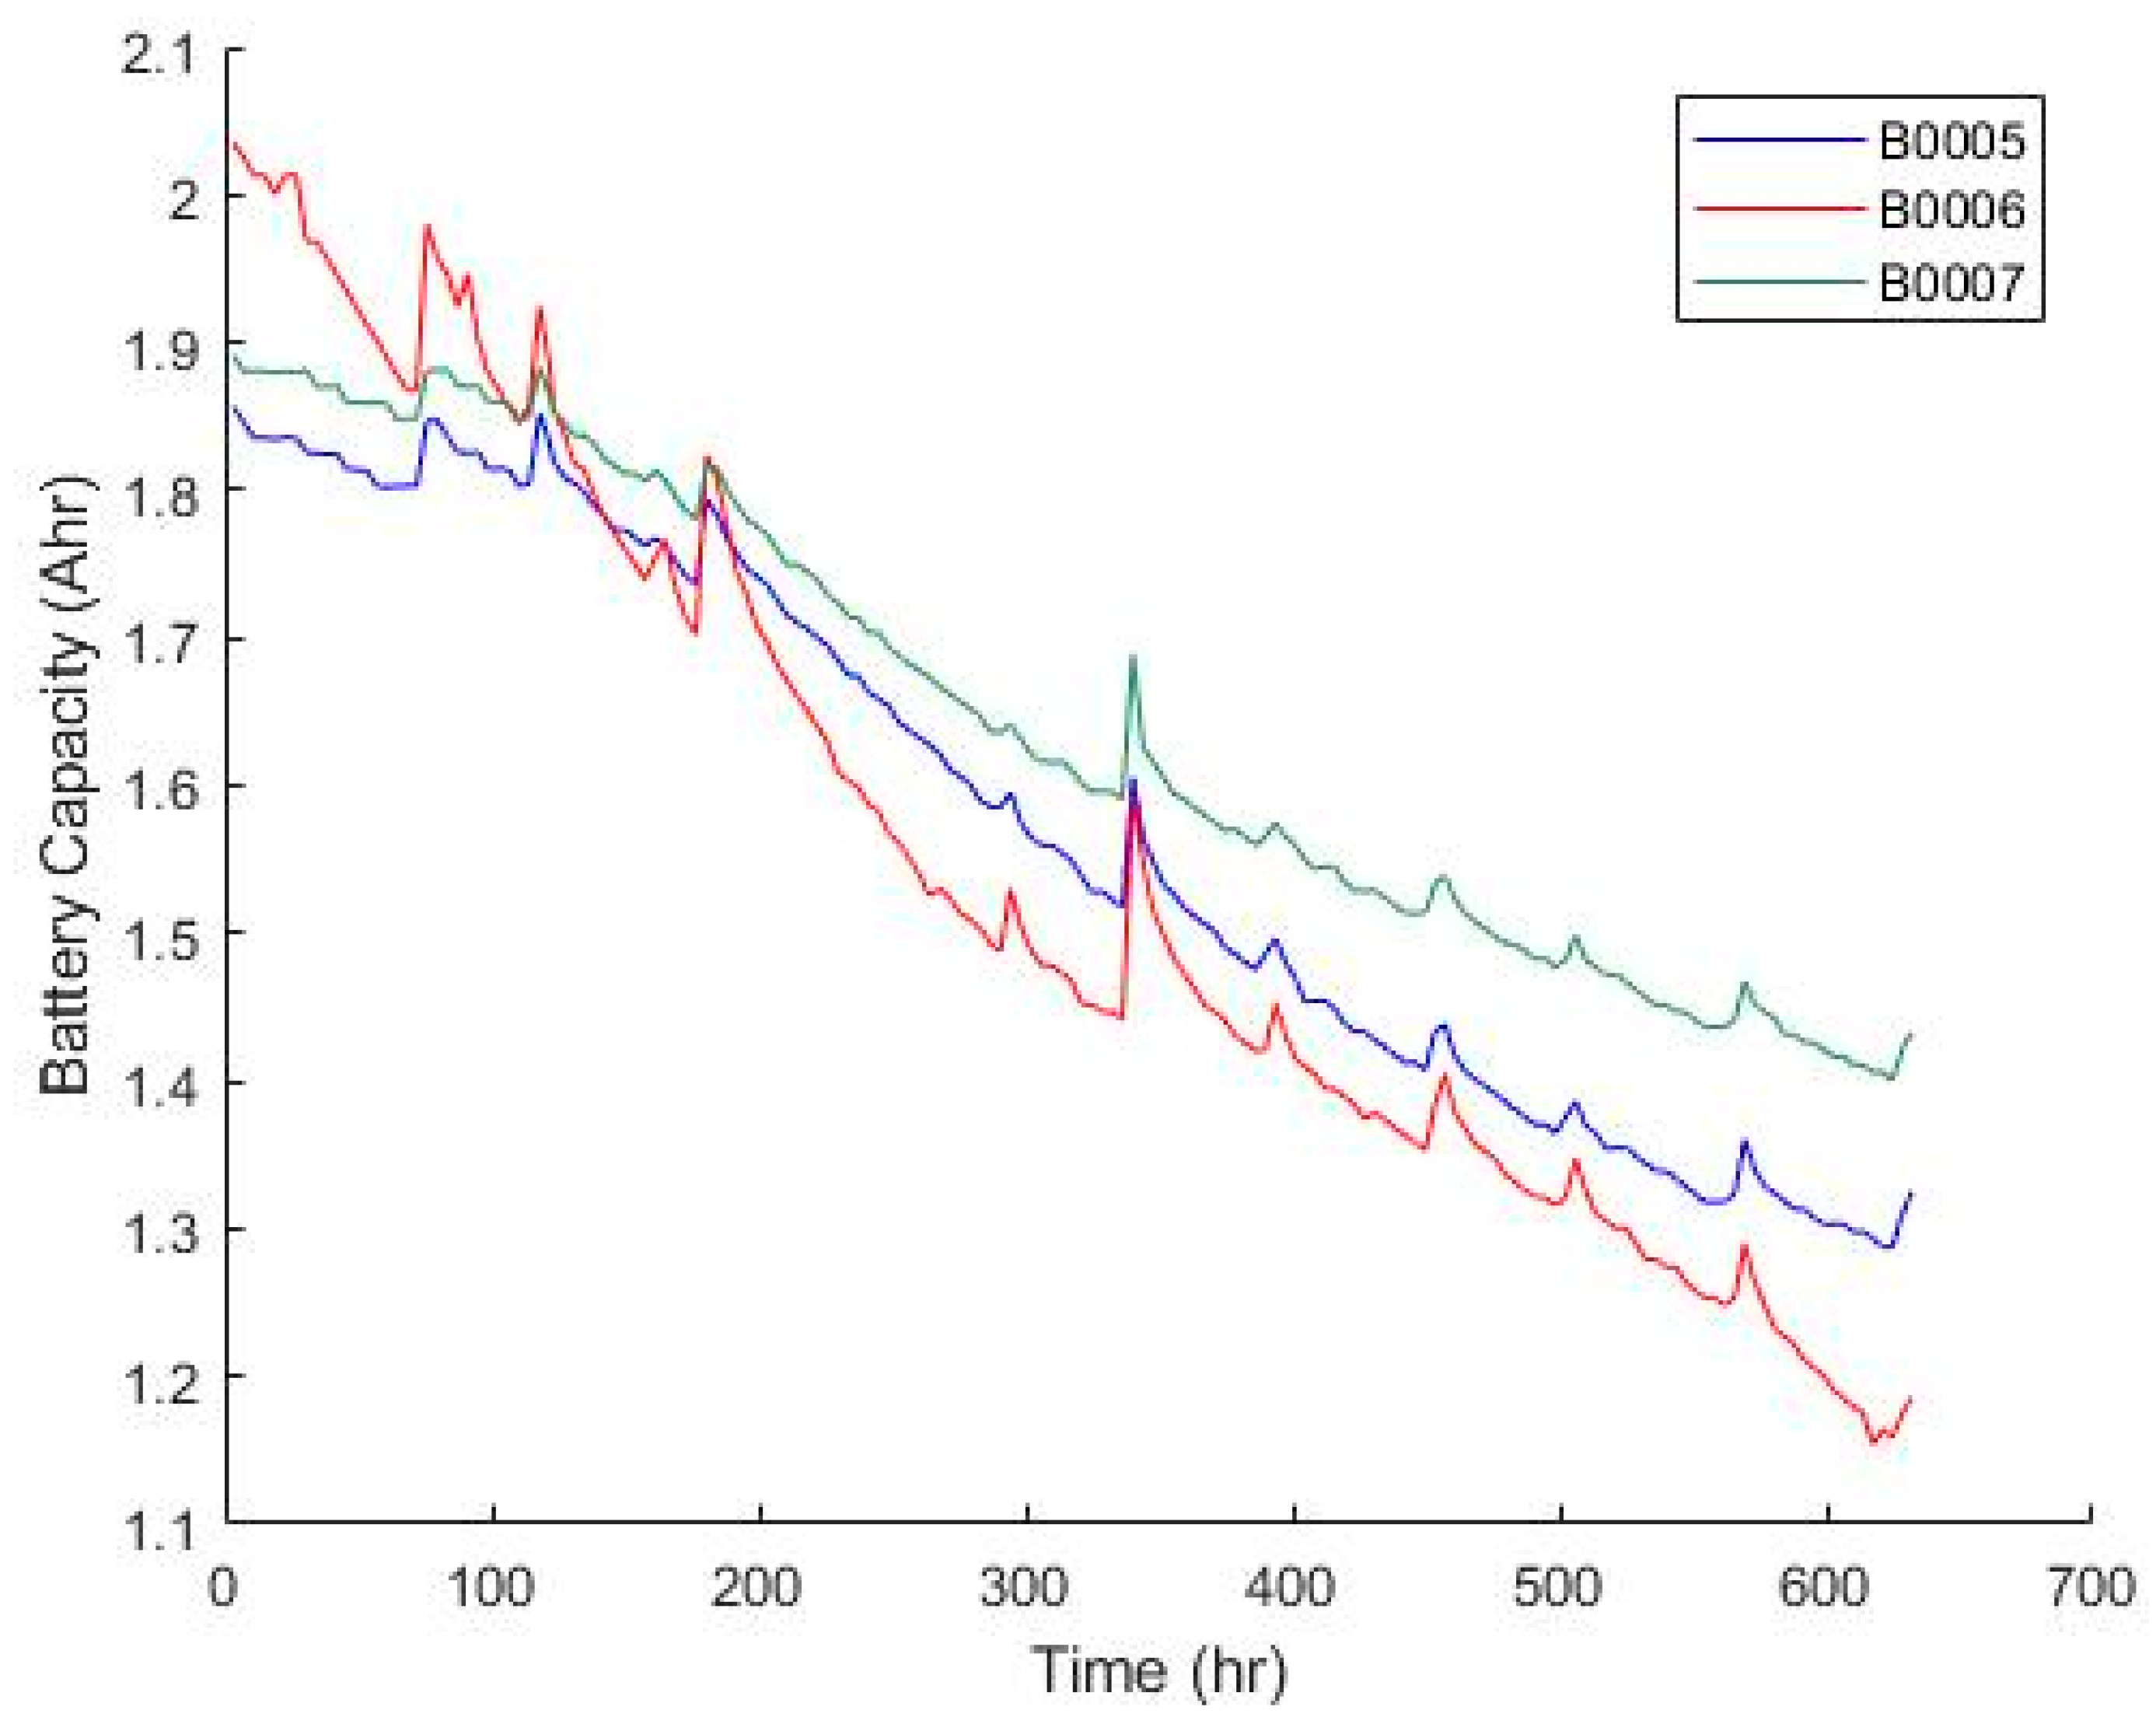
3.1. Dataset
3.2. Data Preprocessing
3.2.1. Feature Scaling
3.2.2. Feature Analysis
3.2.3. Correlation Analysis
3.3. Model Building
3.3.1. Model Selection
3.3.2. Model Training
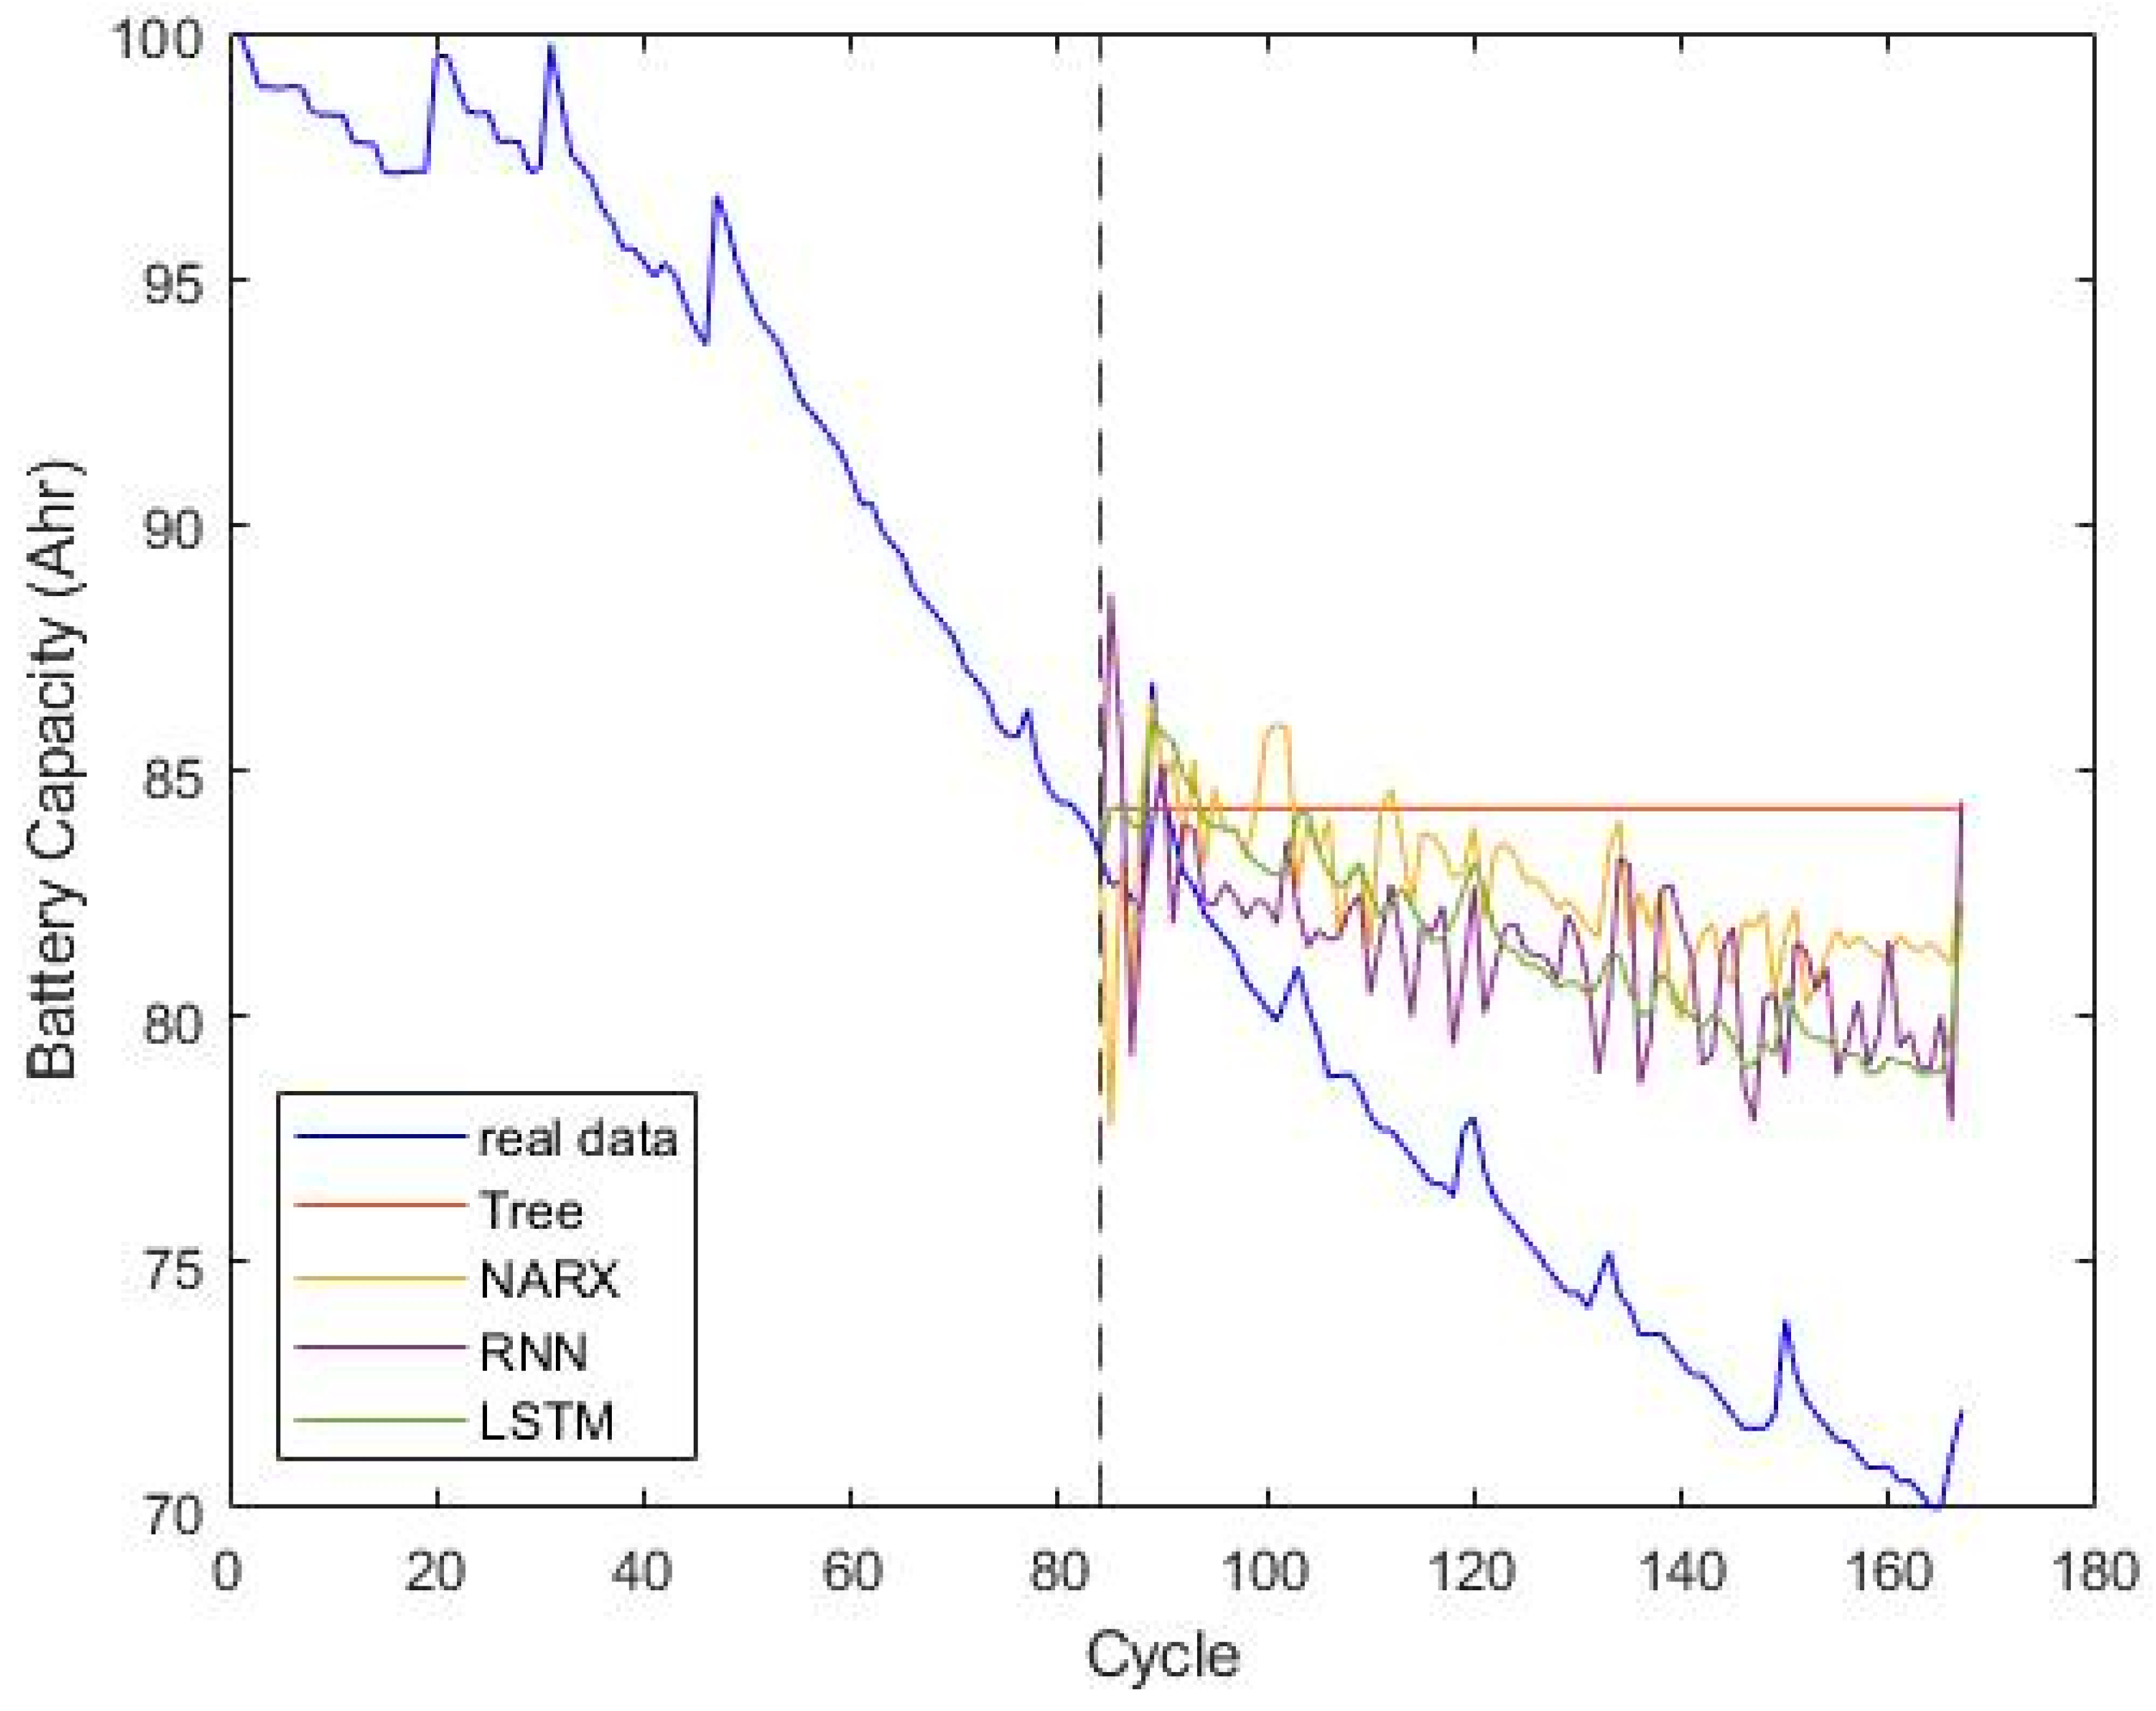
3.3.3. Model Testing
4. Prediction of Remain Useful Life
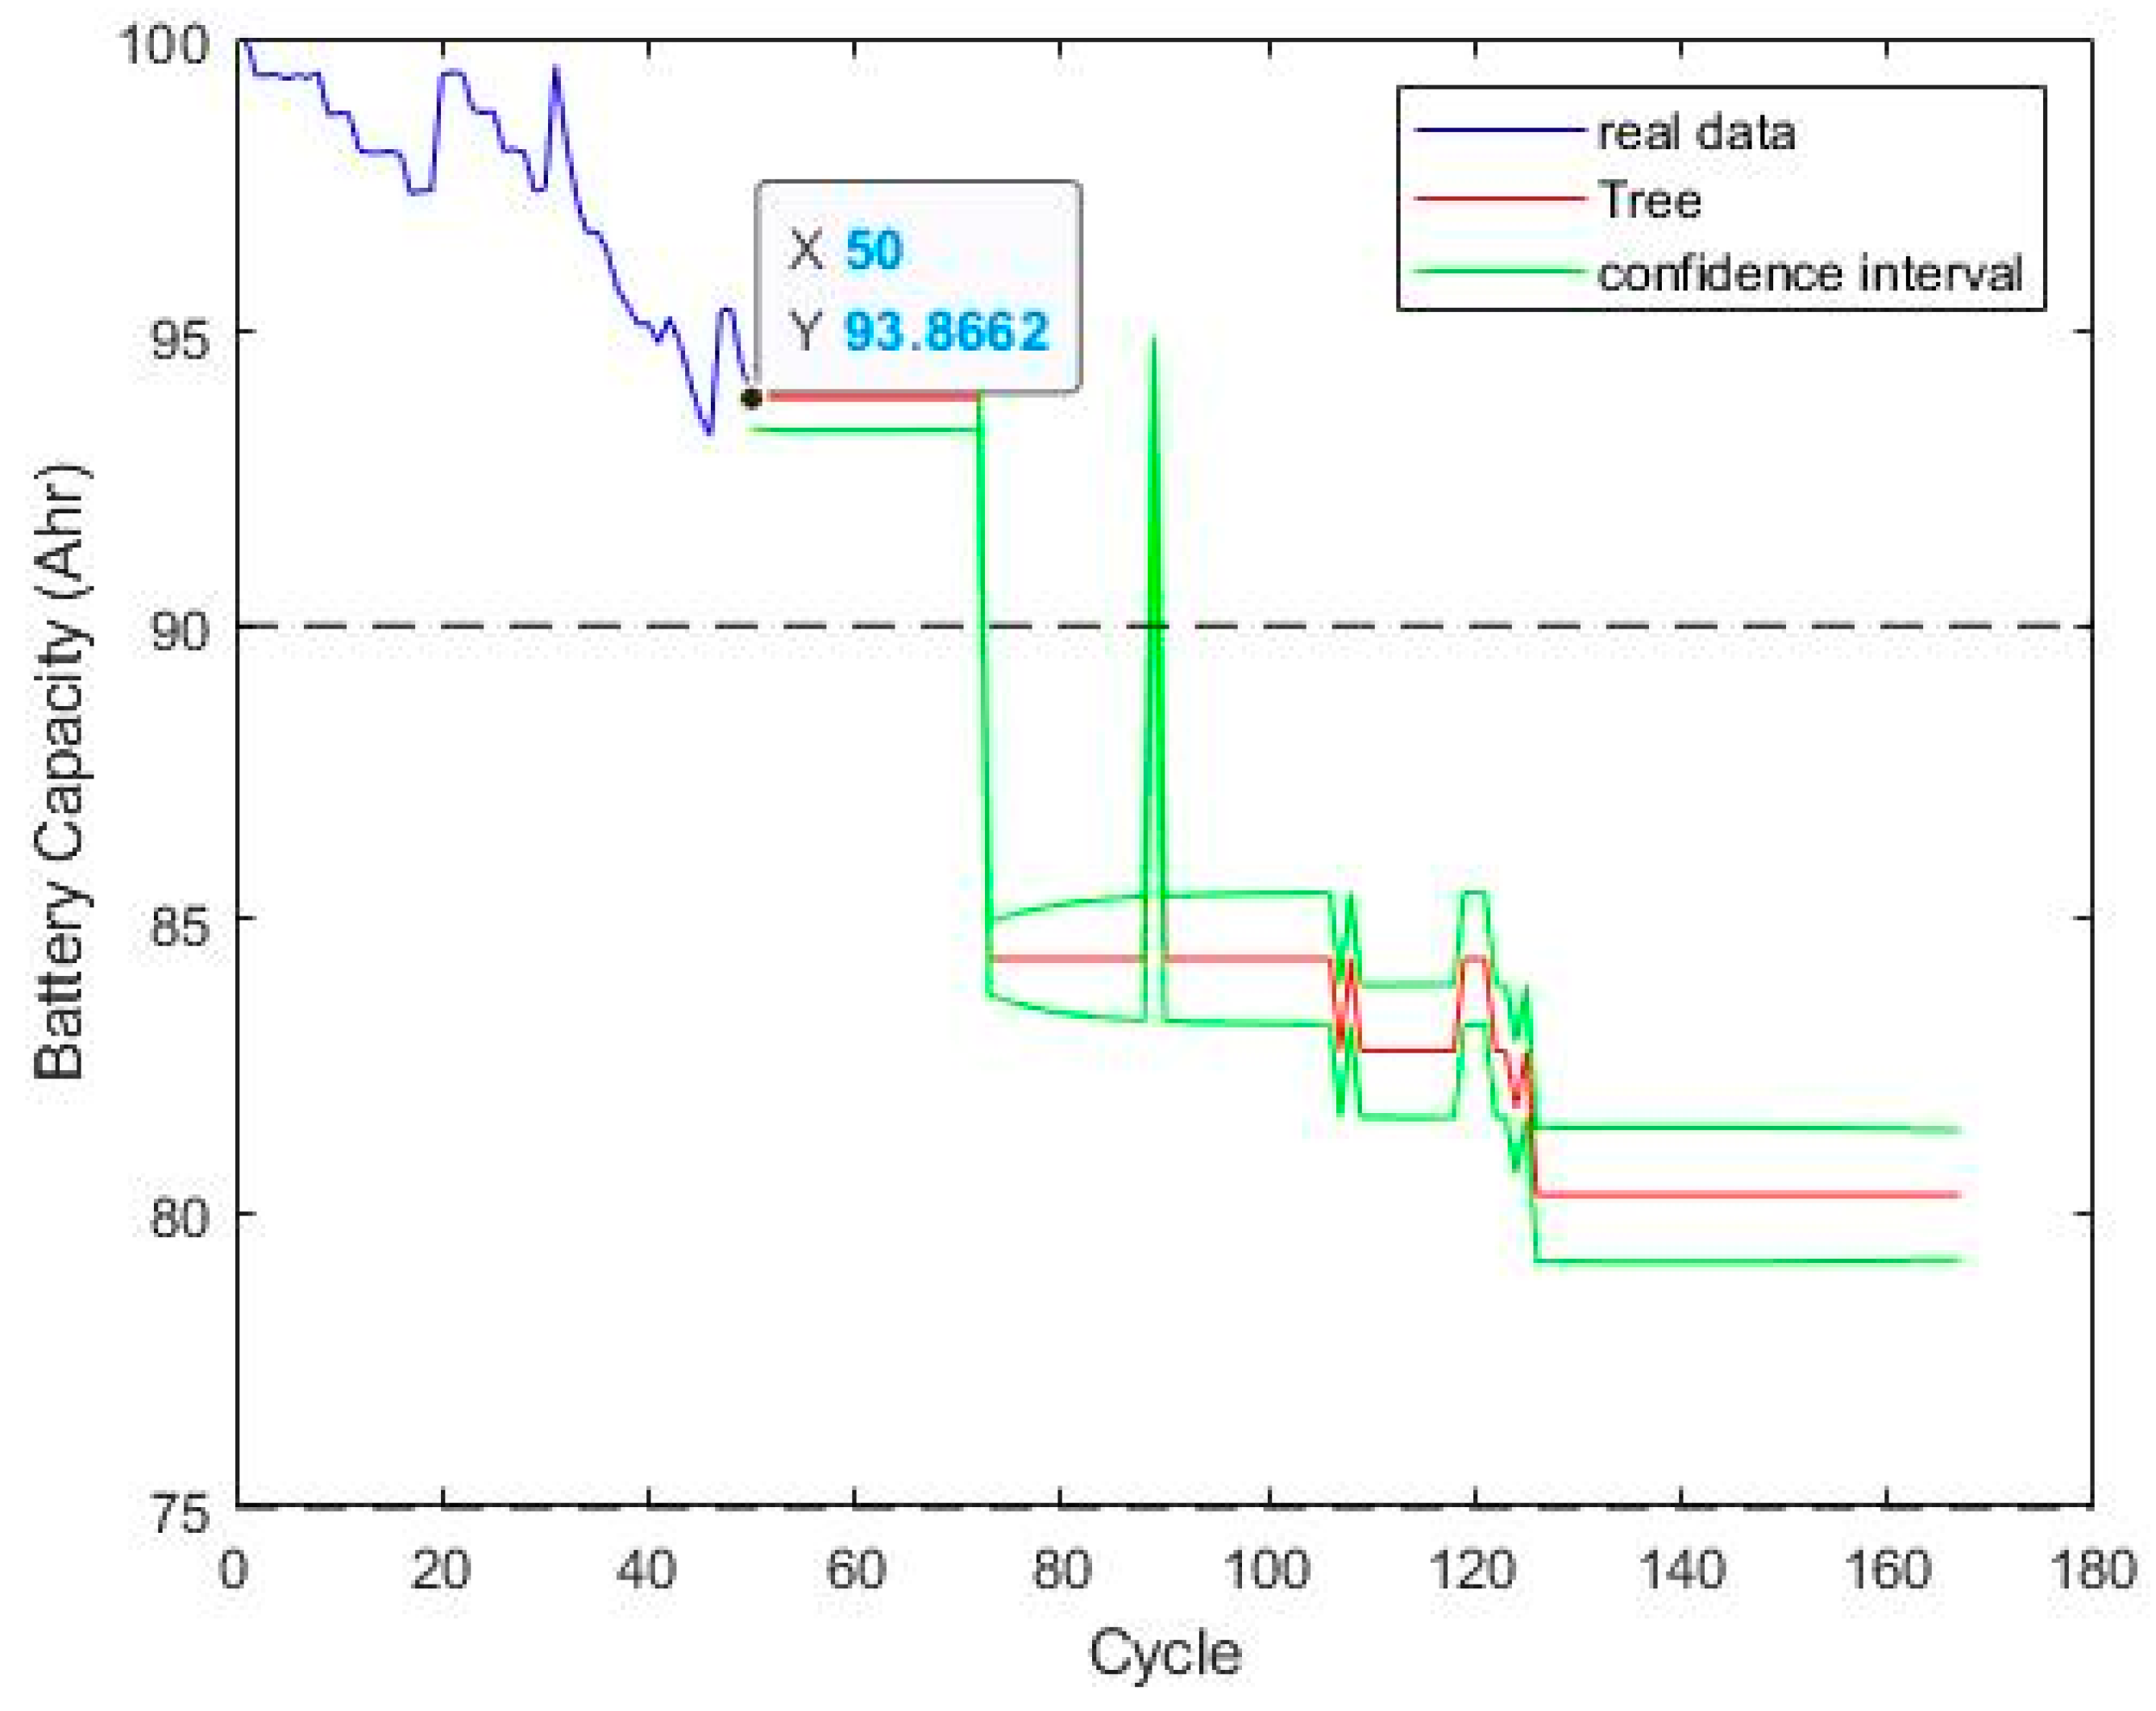
4.1. Health Indicator
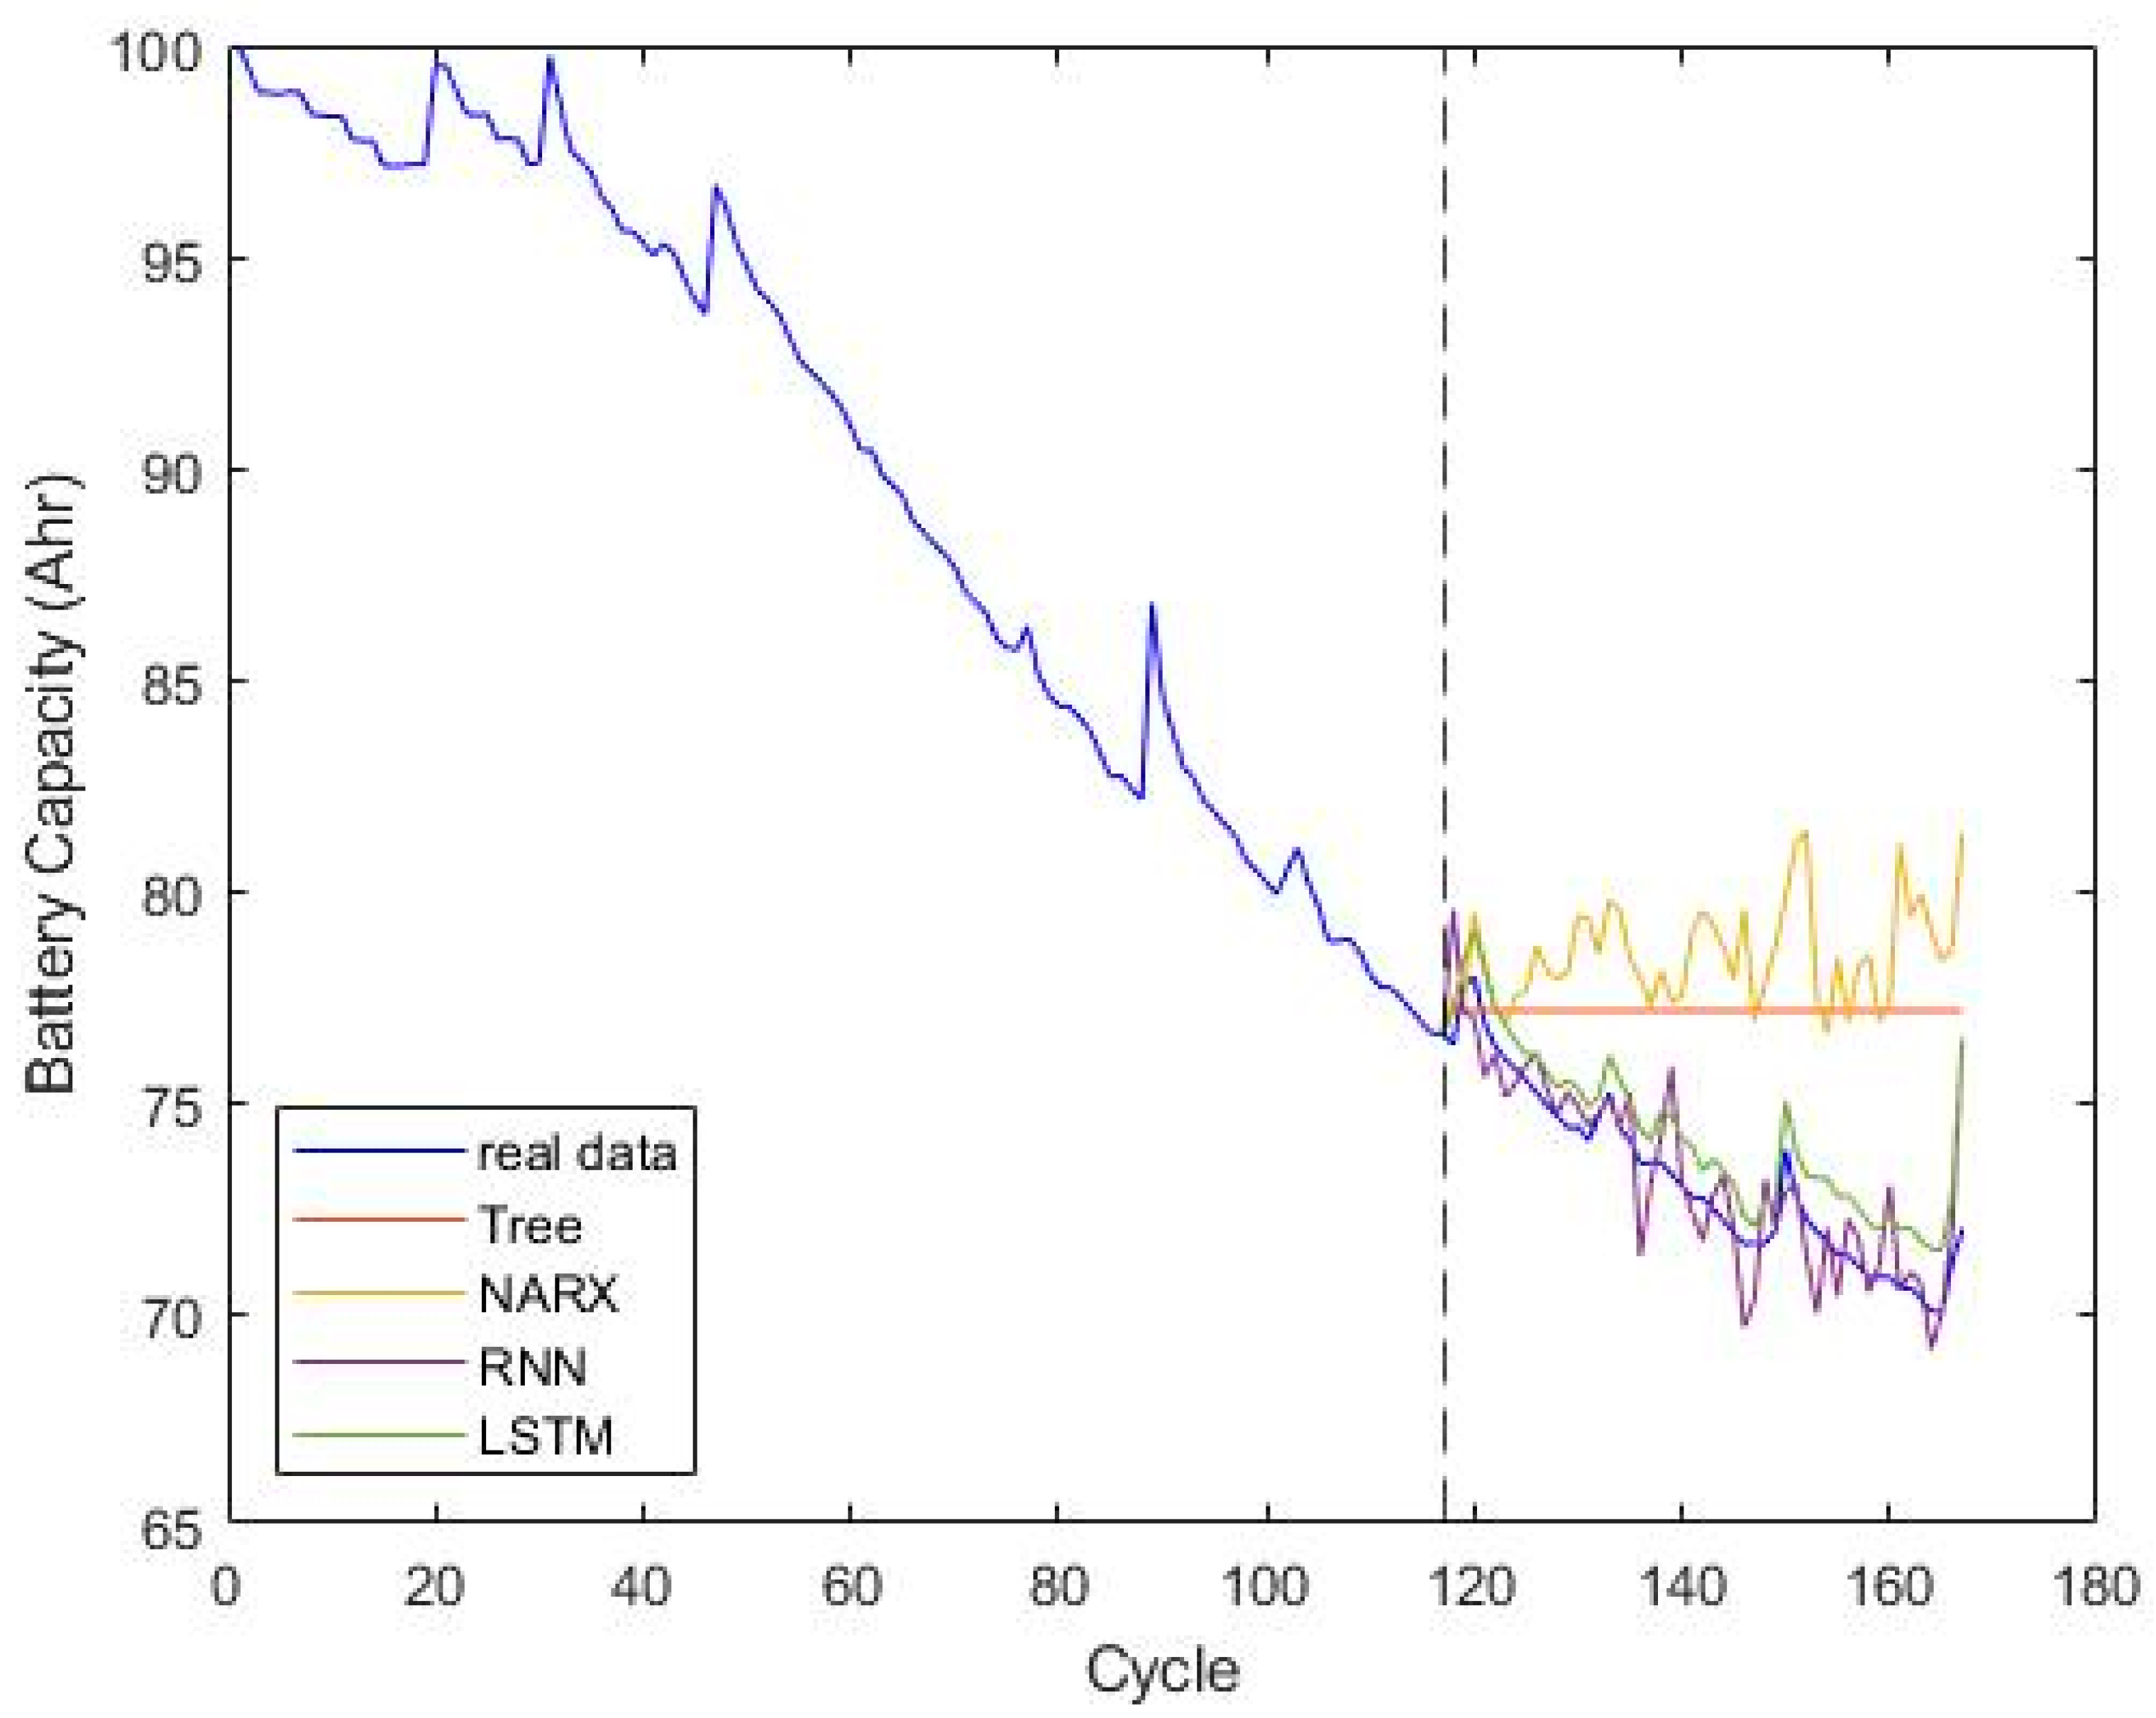
4.2. Prediction Analysis
5. Discussion
6. Conclusions
Author Contributions
Funding
Data Availability Statement
Conflicts of Interest
References
- Mujib, A.A.; Djatna, T. Ensemble Learning for Predictive Maintenance on Wafer Stick Machine Using IoT Sensor Data. In Proceedings of the 2020 International Conference on Computer Science and Its Application in Agriculture, Bogor, Indonesia, 17 September 2020; pp. 1–5. [Google Scholar]
- Umeda, S.S.; Tamaki, K.; Sumiya, M.; Kamaji, Y. Planned Maintenance Schedule Update Method for Predictive Maintenance of Semiconductor Plasma Etcher. In Proceedings of the 2020 International Symposium on Semiconductor Manufacturing, Tokyo, Japan, 12–13 December 2020; pp. 1–4. [Google Scholar]
- Poor, P.; Basl, J.; Zenisek, D. Predictive Maintenance 4.0 as Next Evolution Step in Industrial Maintenance Development. In Proceedings of the 2019 International Research Conference on Smart Computing and Systems Engineering, Colombo, Sri Lanka, 28 March 2019; pp. 245–253. [Google Scholar]
- Liu, Q.; Hu, Y.; Yu, X.; Qin, Y.; Meng, T.; Hu, X. The Pursuit of Commercial Silicon-based Microparticle Anodes for Advanced Lithium-ion Batteries: A Review. Nano Res. Energy 2022, 1, e9120037. [Google Scholar] [CrossRef]
- Eshetu, G.G.; Zhang, H.; Judez, X.; Adenusi, H.; Armand, M.; Passerini, S.; Figgemeie, E. Production of High-Energy Li-ion Batteries Comprising Silicon-containing Anodes and Insertion-type Cathodes. Nat. Commun. 2021, 12, 5459. [Google Scholar] [CrossRef] [PubMed]
- Meng, L.; Wang, G.; See, K.W.; Wang, Y.; Zhang, Y.; Zang, C.; Zhou, R.; Xie, B. Large-Scale Li-Ion Battery Research and Application in Mining Industry. Energies 2022, 15, 3884. [Google Scholar] [CrossRef]
- Han, X.; Lu, L.; Zheng, Y.; Feng, X.; Li, Z.; Li, J.; Ouyang, M. A review on the key issues of the lithium-ion battery degradation among the whole life cycle. eTransportation 2019, 1, 100005. [Google Scholar] [CrossRef]
- Gomez, J.; Nelson, R.; Kalu, E.E.; Weatherspoon, M.H.; Zheng, J.P. Equivalent Circuit Model Parameters of a High-power Li-ion Battery: Thermal and State of Charge Effects. J. Power Sources 2011, 196, 4826–4831. [Google Scholar] [CrossRef]
- Suresh, P.; Shukla, A.K.; Munichandraiah, N. Temperature dependence studies of a.c. impedance of lithium-ion cells. J. Appl. Electrochem. 2002, 32, 267–273. [Google Scholar] [CrossRef]
- Seo, M.; Song, Y.; Park, S.; Kim, S.W. Capacity Estimation of Lithium-ion Batteries under Various Temperatures using Two Aging Indicators. In Proceedings of the 2021 21st International Conference on Control, Automation and Systems, Jeju, Republic of Korea, 12–15 October 2021; pp. 457–461. [Google Scholar]
- Lefkowitz, R.J. Identification of adenylate cyclase-coupled betaadrenergic receptors with radiolabeled beta-adrenergic antagonists. Biochem. Pharmacol. 1975, 24, 1651–1658. [Google Scholar] [CrossRef]
- Zhang, R.; Pan, Z. Model Identification of Lithium-Ion Batteries Considering Current-Rate Effects on battery impedance. In Proceedings of the 2019 4th International Conference on Power and Renewable Energy, Chengdu, China, 21–23 September 2019; pp. 305–309. [Google Scholar]
- Du, J.; Sun, Y. The Influence of High Power Charging on the Lithium Battery Based on Constant and Pulse Current Charging Strategies. In Proceedings of the 2020 IEEE Vehicle Power and Propulsion Conference, Gijon, Spain, 18 November 2020; pp. 1–7. [Google Scholar]
- Al Rasyid, A.Z.J.; Firmansyah, E.; Wijaya, F.D. Modeling of Temperature Effect on SoC of Lithium-Ion Battery Pack. In Proceedings of the 2021 3rd International Symposium on Material and Electrical Engineering Conference, Bandung, Indonesia, 10–11 November 2021; pp. 299–303. [Google Scholar]
- Shen, S.; Liu, B.; Zhang, K.; Ci, S. Toward Fast and Accurate SOH Prediction for Lithium-Ion Batteries. IEEE Trans. Energy Convers. 2021, 36, 2036–2046. [Google Scholar] [CrossRef]
- Tong, S.; Klein, M.P.; Park, J.W. On-line optimization of battery open circuit voltage for improved state-of-charge and state-of-health estimation. J. Power Sources 2015, 293, 416–428. [Google Scholar] [CrossRef]
- Islam, S.M.R.; Park, S.-Y. Precise Online Electrochemical Impedance Spectroscopy Strategies for Li-Ion Batteries. IEEE Trans. Ind. Appl. 2020, 56, 1661–1669. [Google Scholar] [CrossRef]
- Li, Z.; Wu, X.; Guo, B.; Jia, H.; Bai, F. Lithium Battery Health Status Assessment Method Based on Failure Physical Model. In Proceedings of the 2021 IEEE 4th International Conference on Electronics Technology, Chengdu, China, 7–10 May 2021; pp. 394–399. [Google Scholar]
- Hu, X.; Yuan, H.; Zou, C.; Li, Z.; Zhang, L. Co-Estimation of State of Charge and State of Health for Lithium-Ion Batteries Based on Fractional-Order Calculus. IEEE Trans. Veh. Technol. 2018, 67, 10319–10329. [Google Scholar] [CrossRef]
- Cacciato, M.; Nobile, G.; Scarcella, G.; Scelba, G. Real-time modelbased estimation of SOC and SOH for energy storage systems. In Proceedings of the 2015 IEEE 6th International Symposium on Power Electronics for Distributed Generation Systems, Aachen, Germany, 22–25 June 2015; pp. 1–8. [Google Scholar]
- Wu, J.; Wang, Y.; Zhang, X.; Chen, Z. A Novel State of Health Estimation Method of Li-ion Battery using Group Method of Data Handling. J. Power Sources 2016, 327, 457–464. [Google Scholar] [CrossRef]
- Chaoui, H.; Ibe-Ekeocha, C.C. State of Charge and State of Health Estimation for Lithium Batteries Using Recurrent Neural Networks. IEEE Trans. Veh. Technol. 2017, 66, 8773–8783. [Google Scholar] [CrossRef]
- Liu, D.; Zhou, J.; Liao, H.; Peng, Y.; Peng, X. A Health Indicator Extraction and Optimization Framework for Lithium-ion Battery Degradation Modeling and Prognostics. IEEE Trans. Syst. Man Cybern. Syst. 2015, 45, 915–928. [Google Scholar]
- McCall, J.J. Maintenance Policies for Stochastically Failing Equipment: A Survey. Manag. Sci. 1965, 11, 493–524. [Google Scholar] [CrossRef]
- Shin, J.-H.; Jun, H.-B. On Condition based Maintenance Policy. J. Comput. Des. Eng. 2015, 2, 119–127. [Google Scholar] [CrossRef]
- Zhang, W.; Yang, D.; Wang, H. Data-Driven Methods for Predictive Maintenance of Industrial Equipment: A Survey. IEEE Syst. J. 2019, 13, 2213–2227. [Google Scholar] [CrossRef]
- Ahmad, R.; Kamaruddin, S. An Overview of Time-based and Condition-based Maintenance in Industrial Application. Comput. Ind. Eng. 2012, 63, 135–149. [Google Scholar] [CrossRef]
- Huynh, K.T.; Grall, A.; Berenguer, C. A Parametric Predictive Maintenance Decision-Making Framework Considering Improved System Health Prognosis Precision. IEEE Trans. Reliab. 2019, 68, 375–396. [Google Scholar] [CrossRef]
- Jardine, A.K.S.; Lin, D.; Banjevic, D. A Review on Machinery Diagnostics and Prognostics Implementing Condition-based Maintenance. Mech. Syst. Signal Process. 2006, 20, 1483–1510. [Google Scholar] [CrossRef]
- Sanchez-Silva, M.; Frangopol, D.; Padgett, J.; Soliman, M. Maintenance and Operation of Infrastructure Systems: Review. J. Struct. Eng. 2016, 142, F4016004. [Google Scholar] [CrossRef]
- Xiong, R.; Zhang, Y.; Wang, J.; He, H.; Peng, S.; Pecht, M. LithiumIon Battery Health Prognosis Based on a Real Battery Management System Used in Electric Vehicles. IEEE Trans. Veh. Technol. 2019, 68, 4110–4121. [Google Scholar] [CrossRef]
- Hu, Z.; Bin, J.; Yin, L.; Chen, X. Predictive maintenance strategy of variable period of power rransformer based on reliability and cost. In Proceedings of the 2013 25th Chinese Control and Decision Conference, Guiyang, China, 25–27 May 2013; pp. 4803–4807. [Google Scholar]
- Chang, W.-Y. The State of Charge Estimating Methods for Battery: A Review. ISRN Appl. Math. 2013, 2013, 953792. [Google Scholar] [CrossRef]
- Yu, Z.; Chen, X.; Zhou, Y. The Influence of Coupling of Charge/Discharge Rate and Short Term Cycle on the Battery Capacity of Li-ion Batteries. In Proceedings of the 2019 3rd International Conference on Electronic Information Technology and Computer Engineering, Xiamen, China, 18–20 October 2019; pp. 469–473. [Google Scholar]
- Fatullah, M.A.; Rahardjo, A.; Husnayain, F. Analysis of Discharge Rate and Ambient Temperature Effects on Lead Acid Battery Capacity. In Proceedings of the 2019 IEEE International Conference on Innovative Research and Development, Jakarta, Indonesia, 28–30 June 2019; pp. 1–5. [Google Scholar]
- Redondo-Iglesias, E.; Venet, P.; Pelissier, S. Measuring Reversible and Irreversible Capacity Losses on Lithium-Ion Batteries. In Proceedings of the 2016 IEEE Vehicle Power and Propulsion Conference, Hangzhou, China, 17–20 October 2016; pp. 1–5. [Google Scholar]
- Hasib, S.A.; Islam, S.; Chakrabortty, R.K.; Ryan, M.J.; Saha, D.K.; Ahamed, M.H.; Moyeen, S.I.; Das, S.K.; Ali, M.F.; Islam, M.R.; et al. A Comprehensive Review of Available Battery Datasets, RUL Prediction Approaches, and Advanced Battery Management. IEEE Access 2021, 9, 86166–86193. [Google Scholar] [CrossRef]
- Audin, P.; Jorge, I.; Mesbahi, T.; Samet, A.; De Beuvron, F.D.B.; Boné, R. Auto-encoder LSTM for Li-ion SOH prediction: A comparative study on various benchmark datasets. In Proceedings of the 2021 20th IEEE International Conference on Machine Learning and Applications, Pasadena, CA, USA, 13–16 December 2021; pp. 1529–1536. [Google Scholar]
- NASA’s Open Data Portal. Li-Ion Battery Aging Datasets. Available online: https://data.nasa.gov/dataset/Li-ion-Battery-Aging-Datasets/uj5r-zjdb (accessed on 10 October 2021).
- Dodge, Y. The Oxford Dictionary of Statistical Terms; Oxford University Press Inc.: New York, NY, USA, 2006. [Google Scholar]
- Hamnett, A.; Vielstich, W. Electrochemistry. Russ. J. Electrochem. 2000, 36, 342–343. [Google Scholar]
- Lehman, A.; O’Rourke, N.; Hatcher, L.; Stepanski, E. JMP for Basic Univariate and Multivariate Statistics: Methods for Researchers and Social Scientists, 2nd ed.; SAS Institute Inc.: Cary, NC, USA, 2013. [Google Scholar]
- Udo, W.; Muhammad, Y. Data-Driven Predictive Maintenance of Wind Turbine Based on SCADA Data. IEEE Access 2021, 9, 162370–162388. [Google Scholar] [CrossRef]
- Li, Y.; Liu, K.; Foley, A.M.; Zülke, A.; Berecibar, M.; Nanini-Maury, E.; Van Mierlo, J.; Hoster, H.E. Data-driven Health Estimation and Lifetime Prediction of Lithium-ion Batteries: A review. Renew. Sustain. Energy Rev. 2019, 113, 109254. [Google Scholar] [CrossRef]


| Cut-Off Voltage (V) | Current (A) | Capacity (Ahr) | |||
|---|---|---|---|---|---|
| Charging | Discharging | Charging | Discharging | Rated | Lower Bound |
| 4.2 | 2.7 | 1.5 | 2 | 2 | 1.4 |
| Features | Description |
|---|---|
| Voltage_b | The battery voltage in the charging stage |
| Current_b | The battery current in the charging stage |
| Voltage_c | The charger voltage in the charging stage |
| Current_c | The charger current in the charging stage |
| Voltage_l | The load voltage in the discharging stage |
| Current_l | The load current in the discharging stage |
| Temperature | The battery temperature in the charging and discharging stages |
| Capacity | The capacity after charging and discharging cycles |
| Time | The time stamp including date, hour, minute, second |
| Item | Formula |
|---|---|
| Skewness | |
| Kurtosis | |
| Shape factor | |
| Crest factor | |
| Impulse factor | |
| Margin factor |
| Item | Description | Correlation |
|---|---|---|
| 1 | time interval of CC charging | ● |
| 2 | time interval of CV charging | ● |
| 3 | battery temperature after charging | |
| 4 | skewness of temperature in charging | |
| 5 | kurtosis of temperature in charging | |
| 6 | waveform factor of temperature in charging | ● |
| 7 | crest factor of temperature in charging | ● |
| 8 | impulse factor of temperature in charging | ● |
| 9 | margin factor of temperature in charging | ● |
| 10 | skewness of battery voltage in charging | ● |
| 11 | kurtosis of battery voltage in charging | |
| 12 | waveform factor of battery voltage in charging | ● |
| 13 | crest factor of battery voltage in charging | ● |
| 14 | impulse factor of battery voltage in charging | ● |
| 15 | margin factor of battery voltage in charging | ● |
| 16 | skewness of charger voltage in charging | |
| 17 | kurtosis of charger voltage in charging | |
| 18 | waveform factor of charger voltage in charging | |
| 19 | crest factor of charger voltage in charging | |
| 20 | impulse factor of charger voltage in charging | |
| 21 | margin factor of charger voltage in charging | |
| 22 | skewness of battery current in charging | |
| 23 | kurtosis of battery current in charging | |
| 24 | waveform factor of battery current in charging | |
| 25 | crest factor of battery current in charging | |
| 26 | impulse factor of battery current in charging | |
| 27 | margin factor of battery current in charging | |
| 28 | skewness of battery voltage in discharging | ● |
| 29 | kurtosis of battery voltage in discharging | ● |
| 30 | waveform factor of battery voltage in discharging | ● |
| 31 | crest factor of battery voltage in discharging | |
| 32 | impulse factor of battery voltage in discharging | |
| 33 | margin factor of battery voltage in discharging | ● |
| 34 | skewness of load voltage in discharging | ● |
| 35 | crest factor of load voltage in discharging | ● |
| 36 | waveform factor of load voltage in discharging | ● |
| 37 | crest factor of load voltage in discharging | ● |
| 38 | impulse factor of load voltage in discharging | ● |
| 39 | margin factor of load voltage in discharging | ● |
| 40 | time interval of discharging | ● |
| 41 | battery temperature after discharging | |
| 42 | skewness of temperature in discharging | ● |
| 43 | kurtosis of temperature in discharging | ● |
| 44 | waveform factor of temperature in discharging | ● |
| 45 | crest factor of temperature in discharging | ● |
| 46 | impulse factor of temperature in discharging | ● |
| 47 | margin factor of temperature in discharging | ● |
| 48 | capacity | ● |
| Strength | Positive Correlation | Negative Correlation |
|---|---|---|
| Strong | 0.5–1 | −1–0.5 |
| Moderate | 0.3–0.5 | −0.5–0.3 |
| Weak | 0.1–0.3 | −0.3–0.1 |
| Negligible | <0.1 | −0.1–0 |
| Model | RSME | IAE | ISE |
|---|---|---|---|
| Tree | 0.138 | 6.082 | 10.919 |
| NARX | 0.185 | 8.202 | 13.171 |
| RNN | 0.045 | 1.641 | 6.433 |
| LSTM | 0.038 | 1.423 | 4.593 |
| Model | HI | Status |
|---|---|---|
| Tree | 93.87% | good |
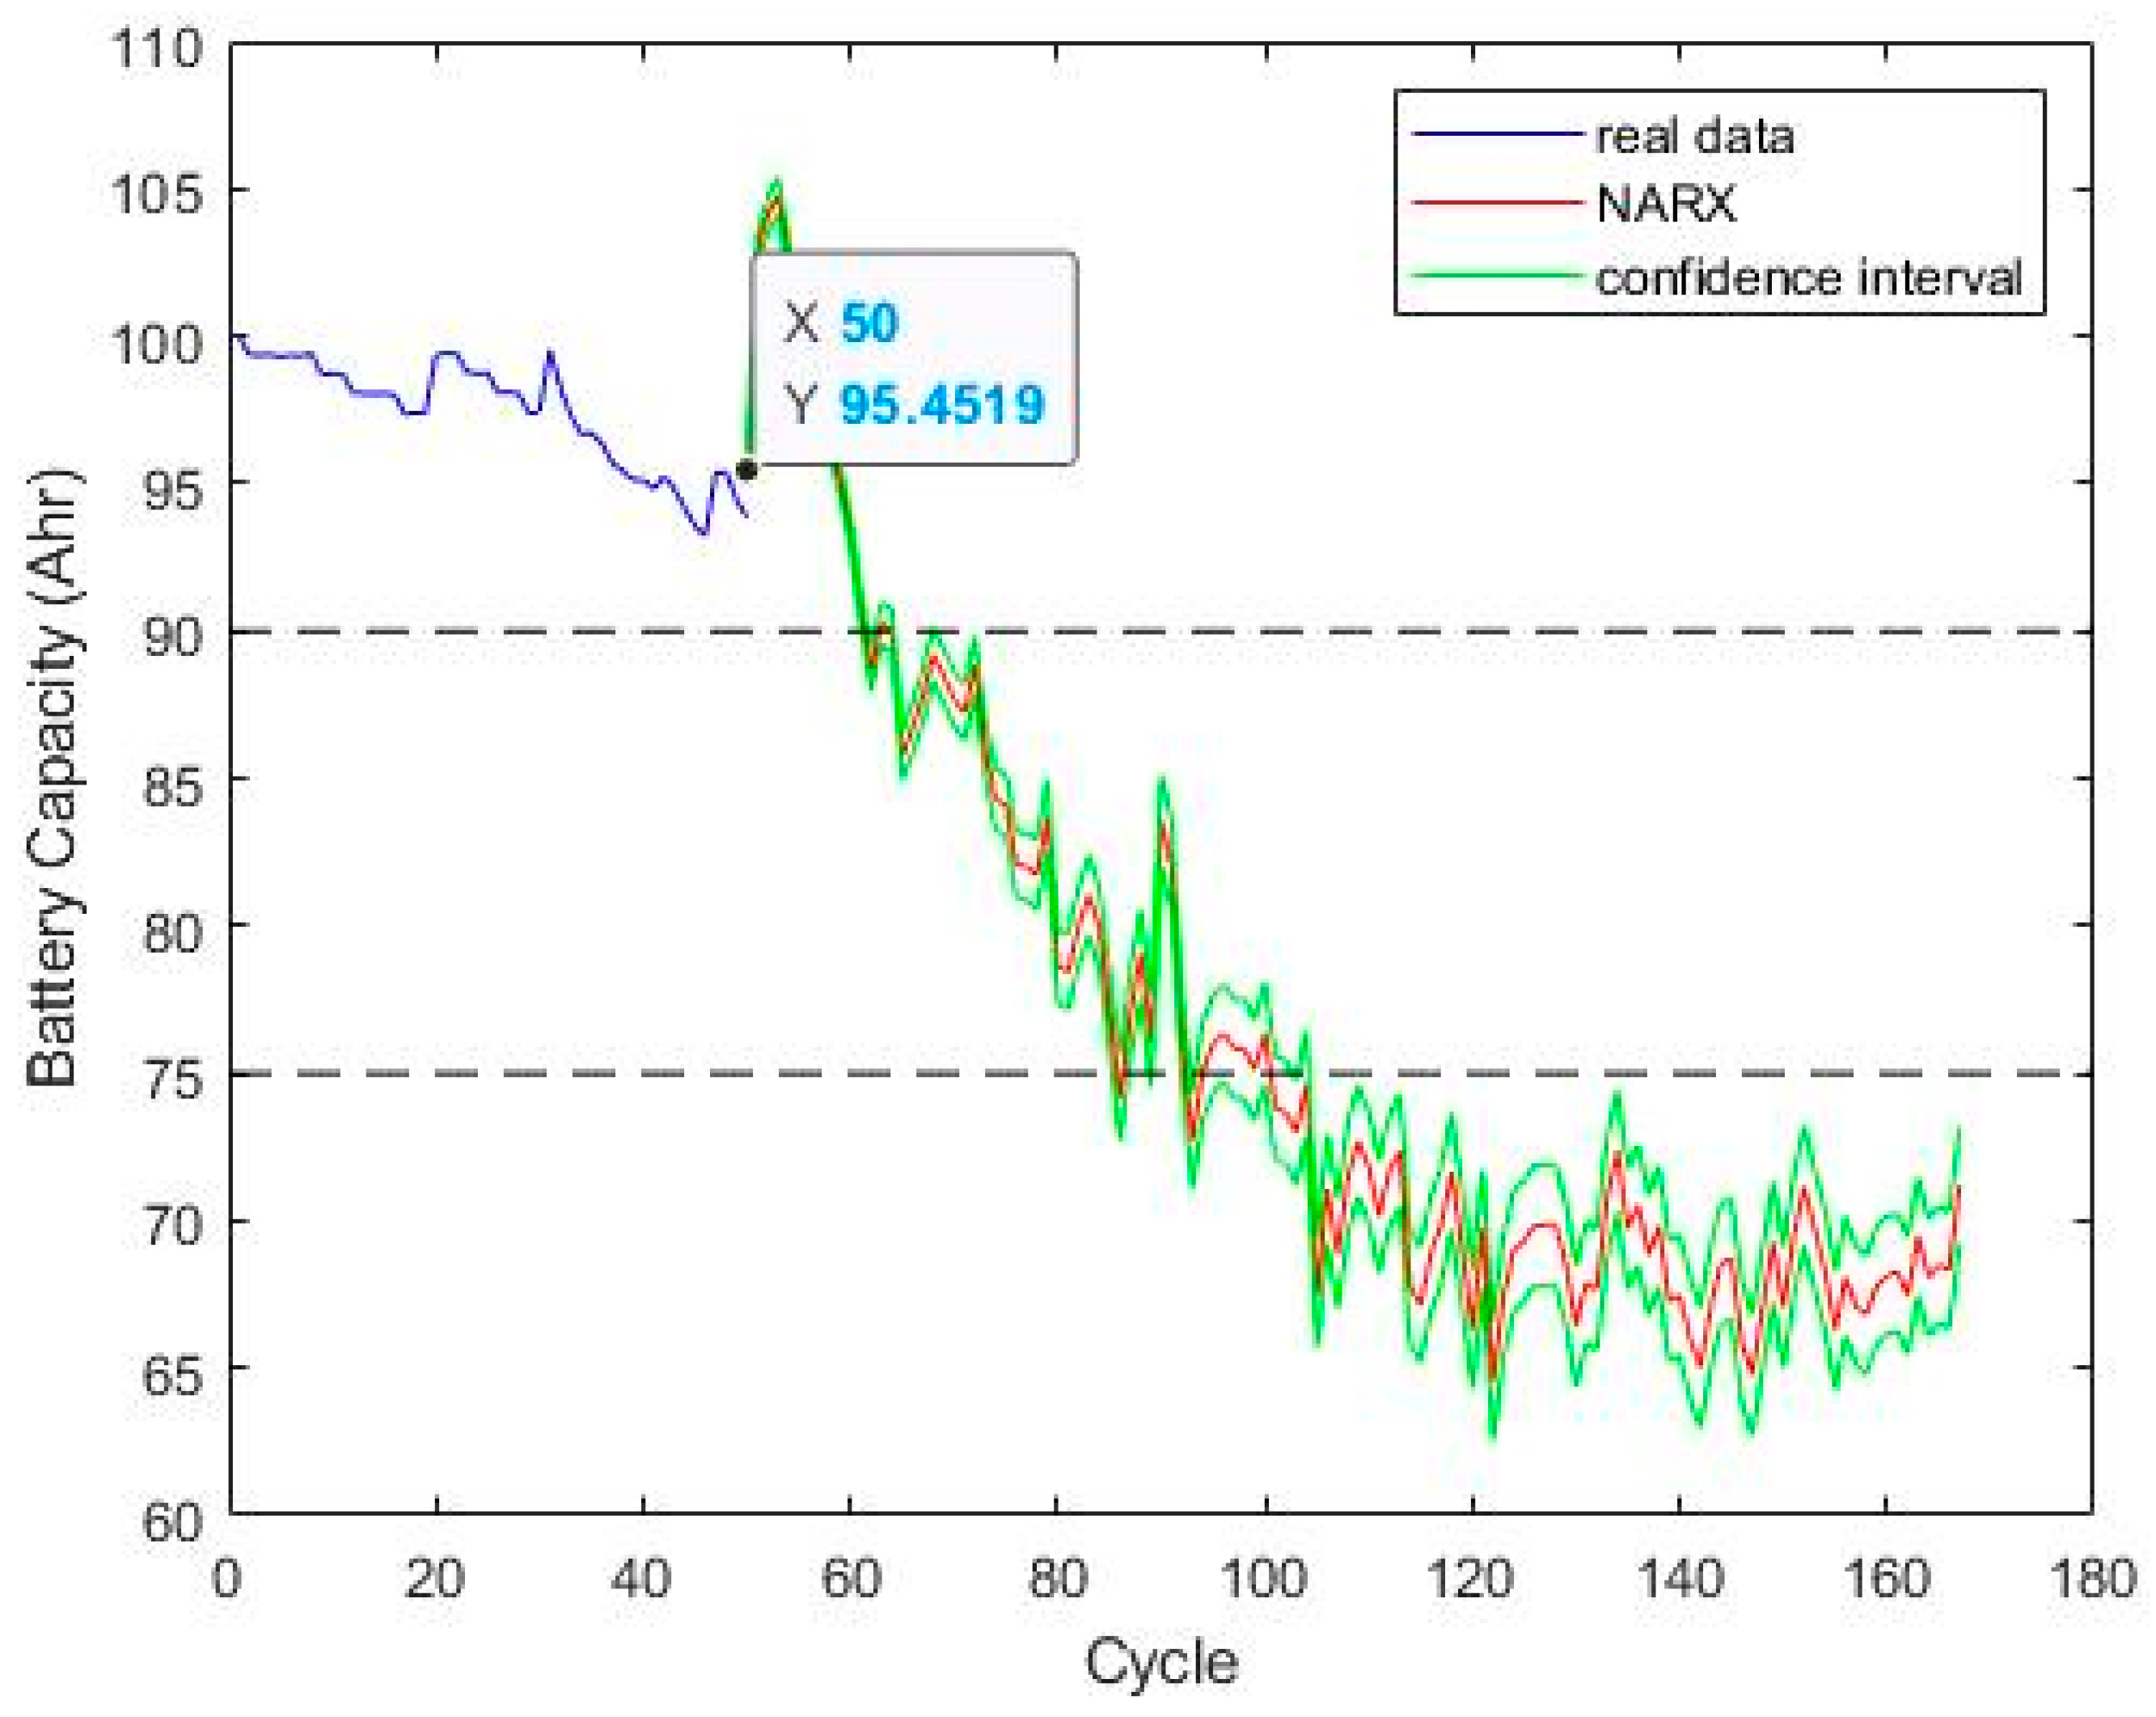
| NARX | 95.45% | good |
| RNN | 90.05% | good |
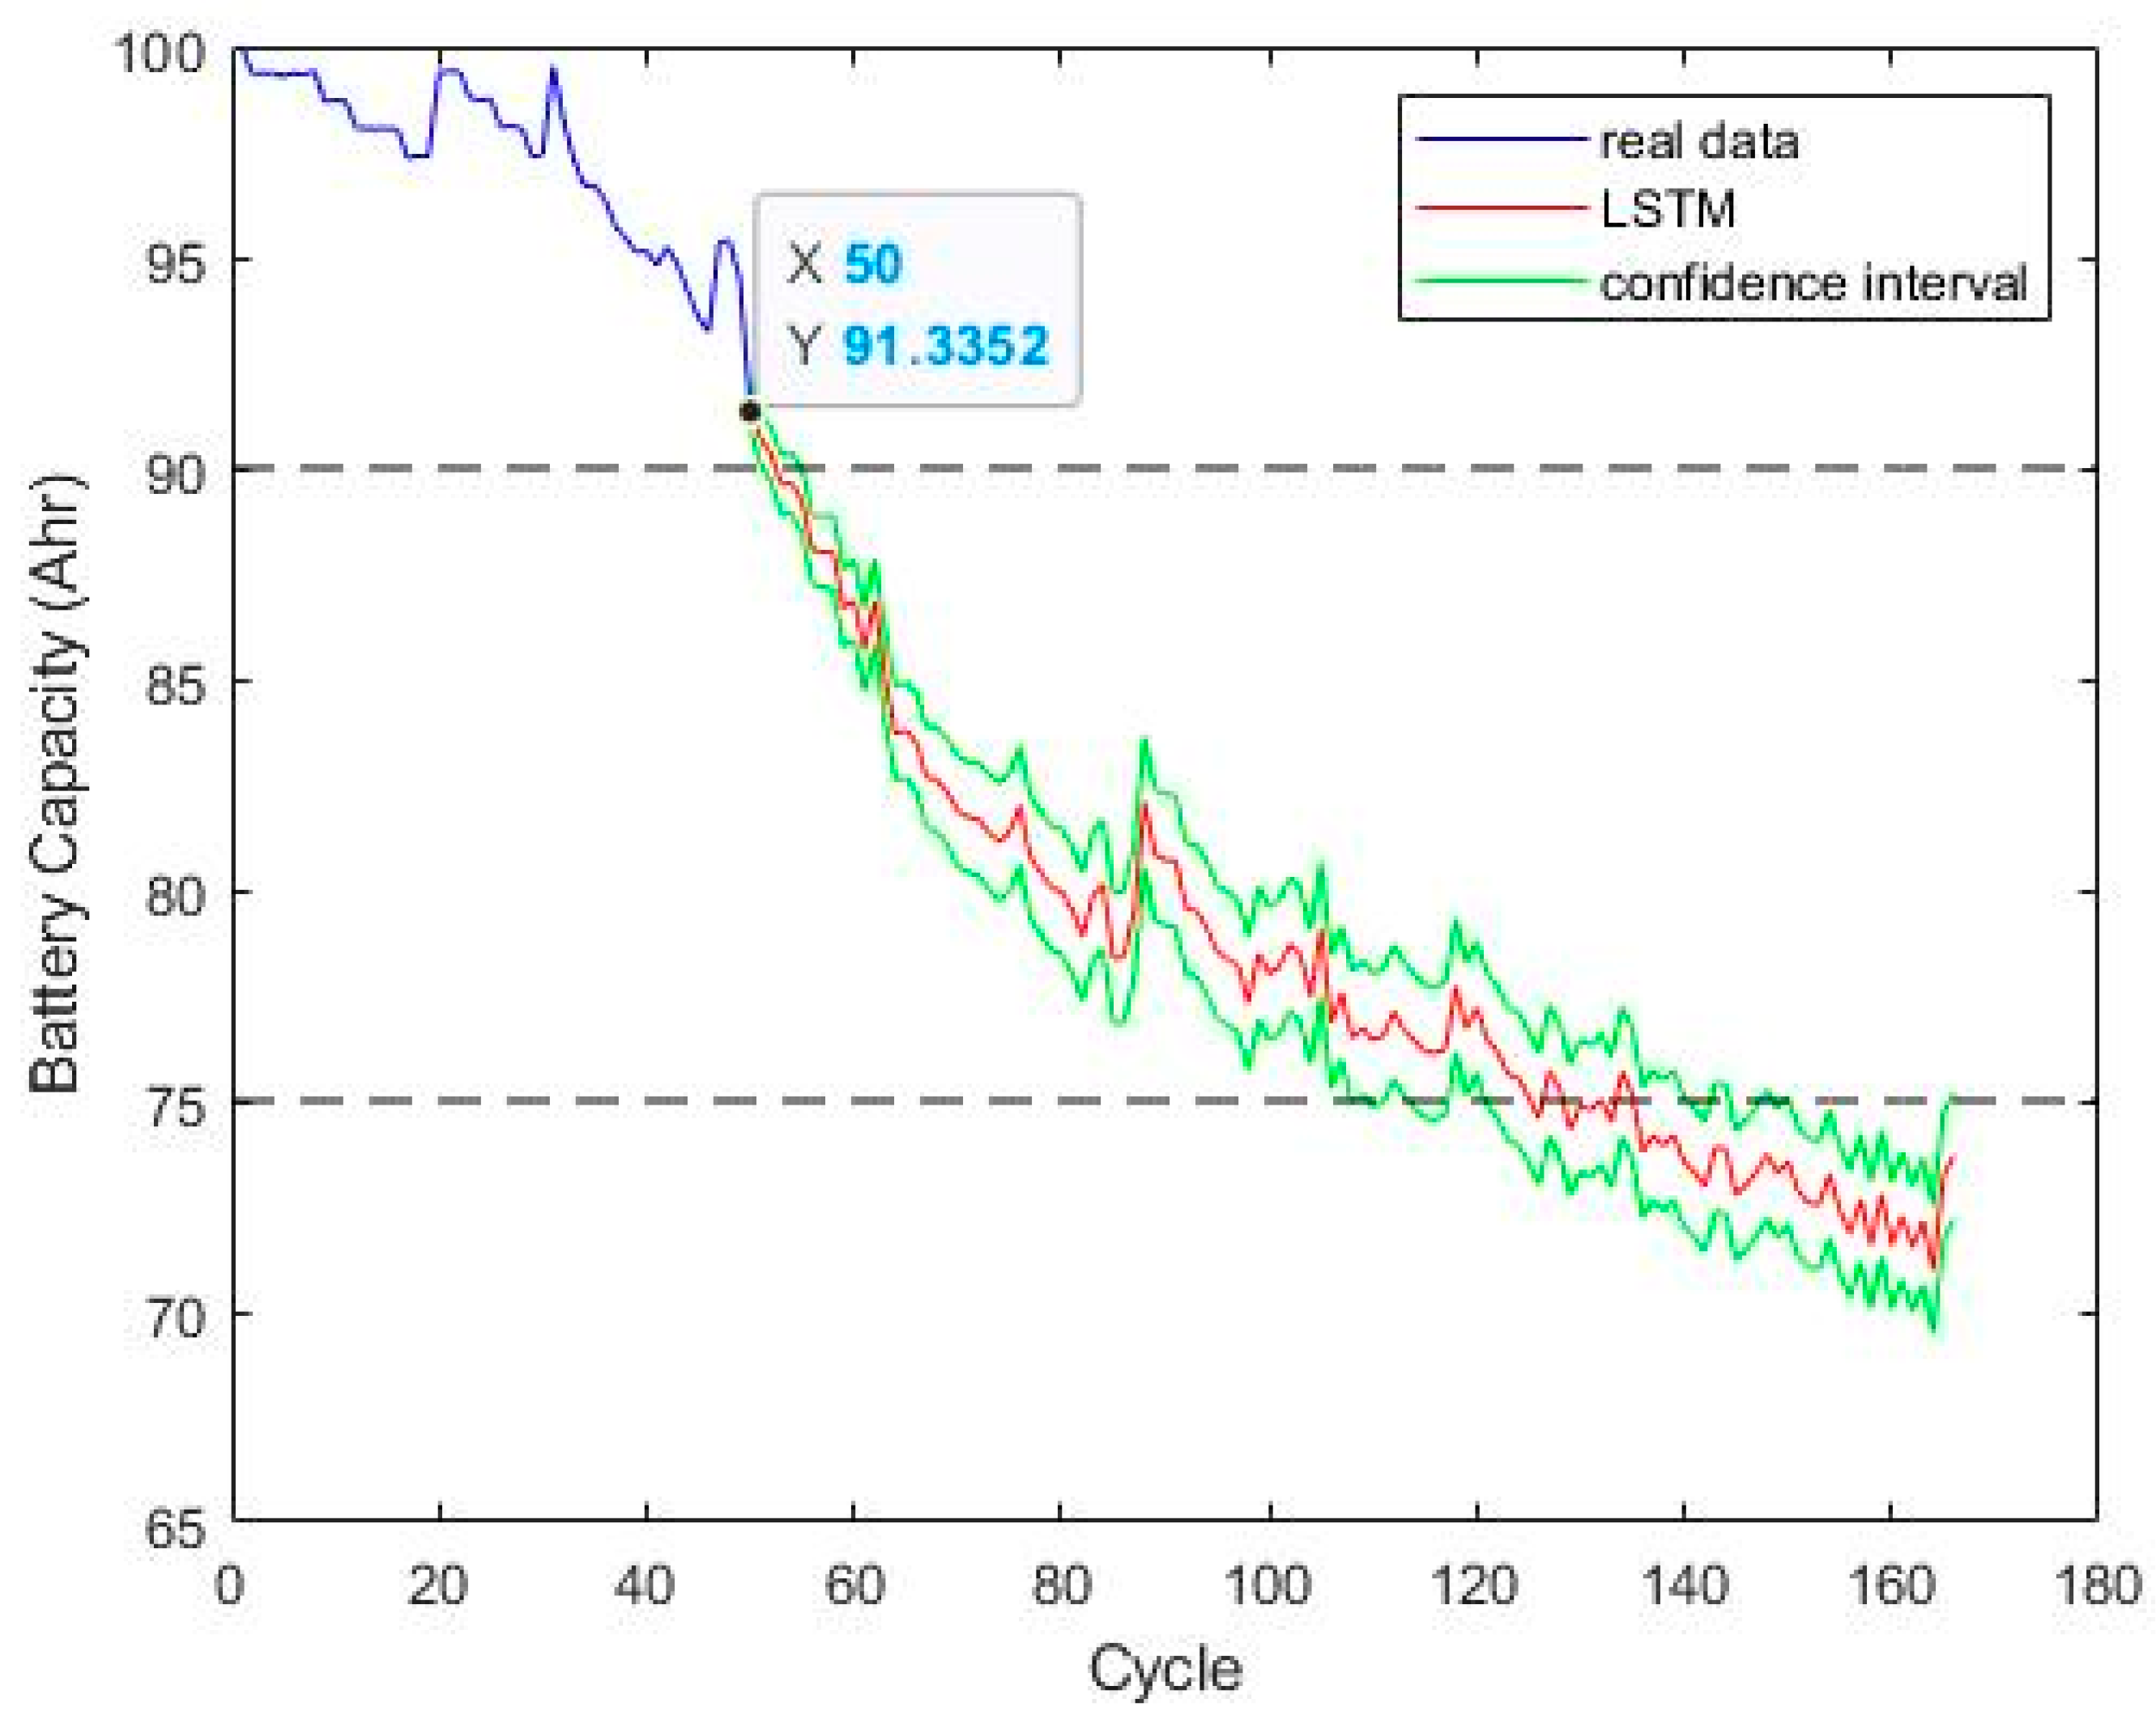
| LSTM | 91.34% | good |
| Real value | 93.84% | good |
| Model | HI < 75% (cycle) | RUL (Cycle) | Error Index | ||
|---|---|---|---|---|---|
| RMSE | IAE | ISE | |||
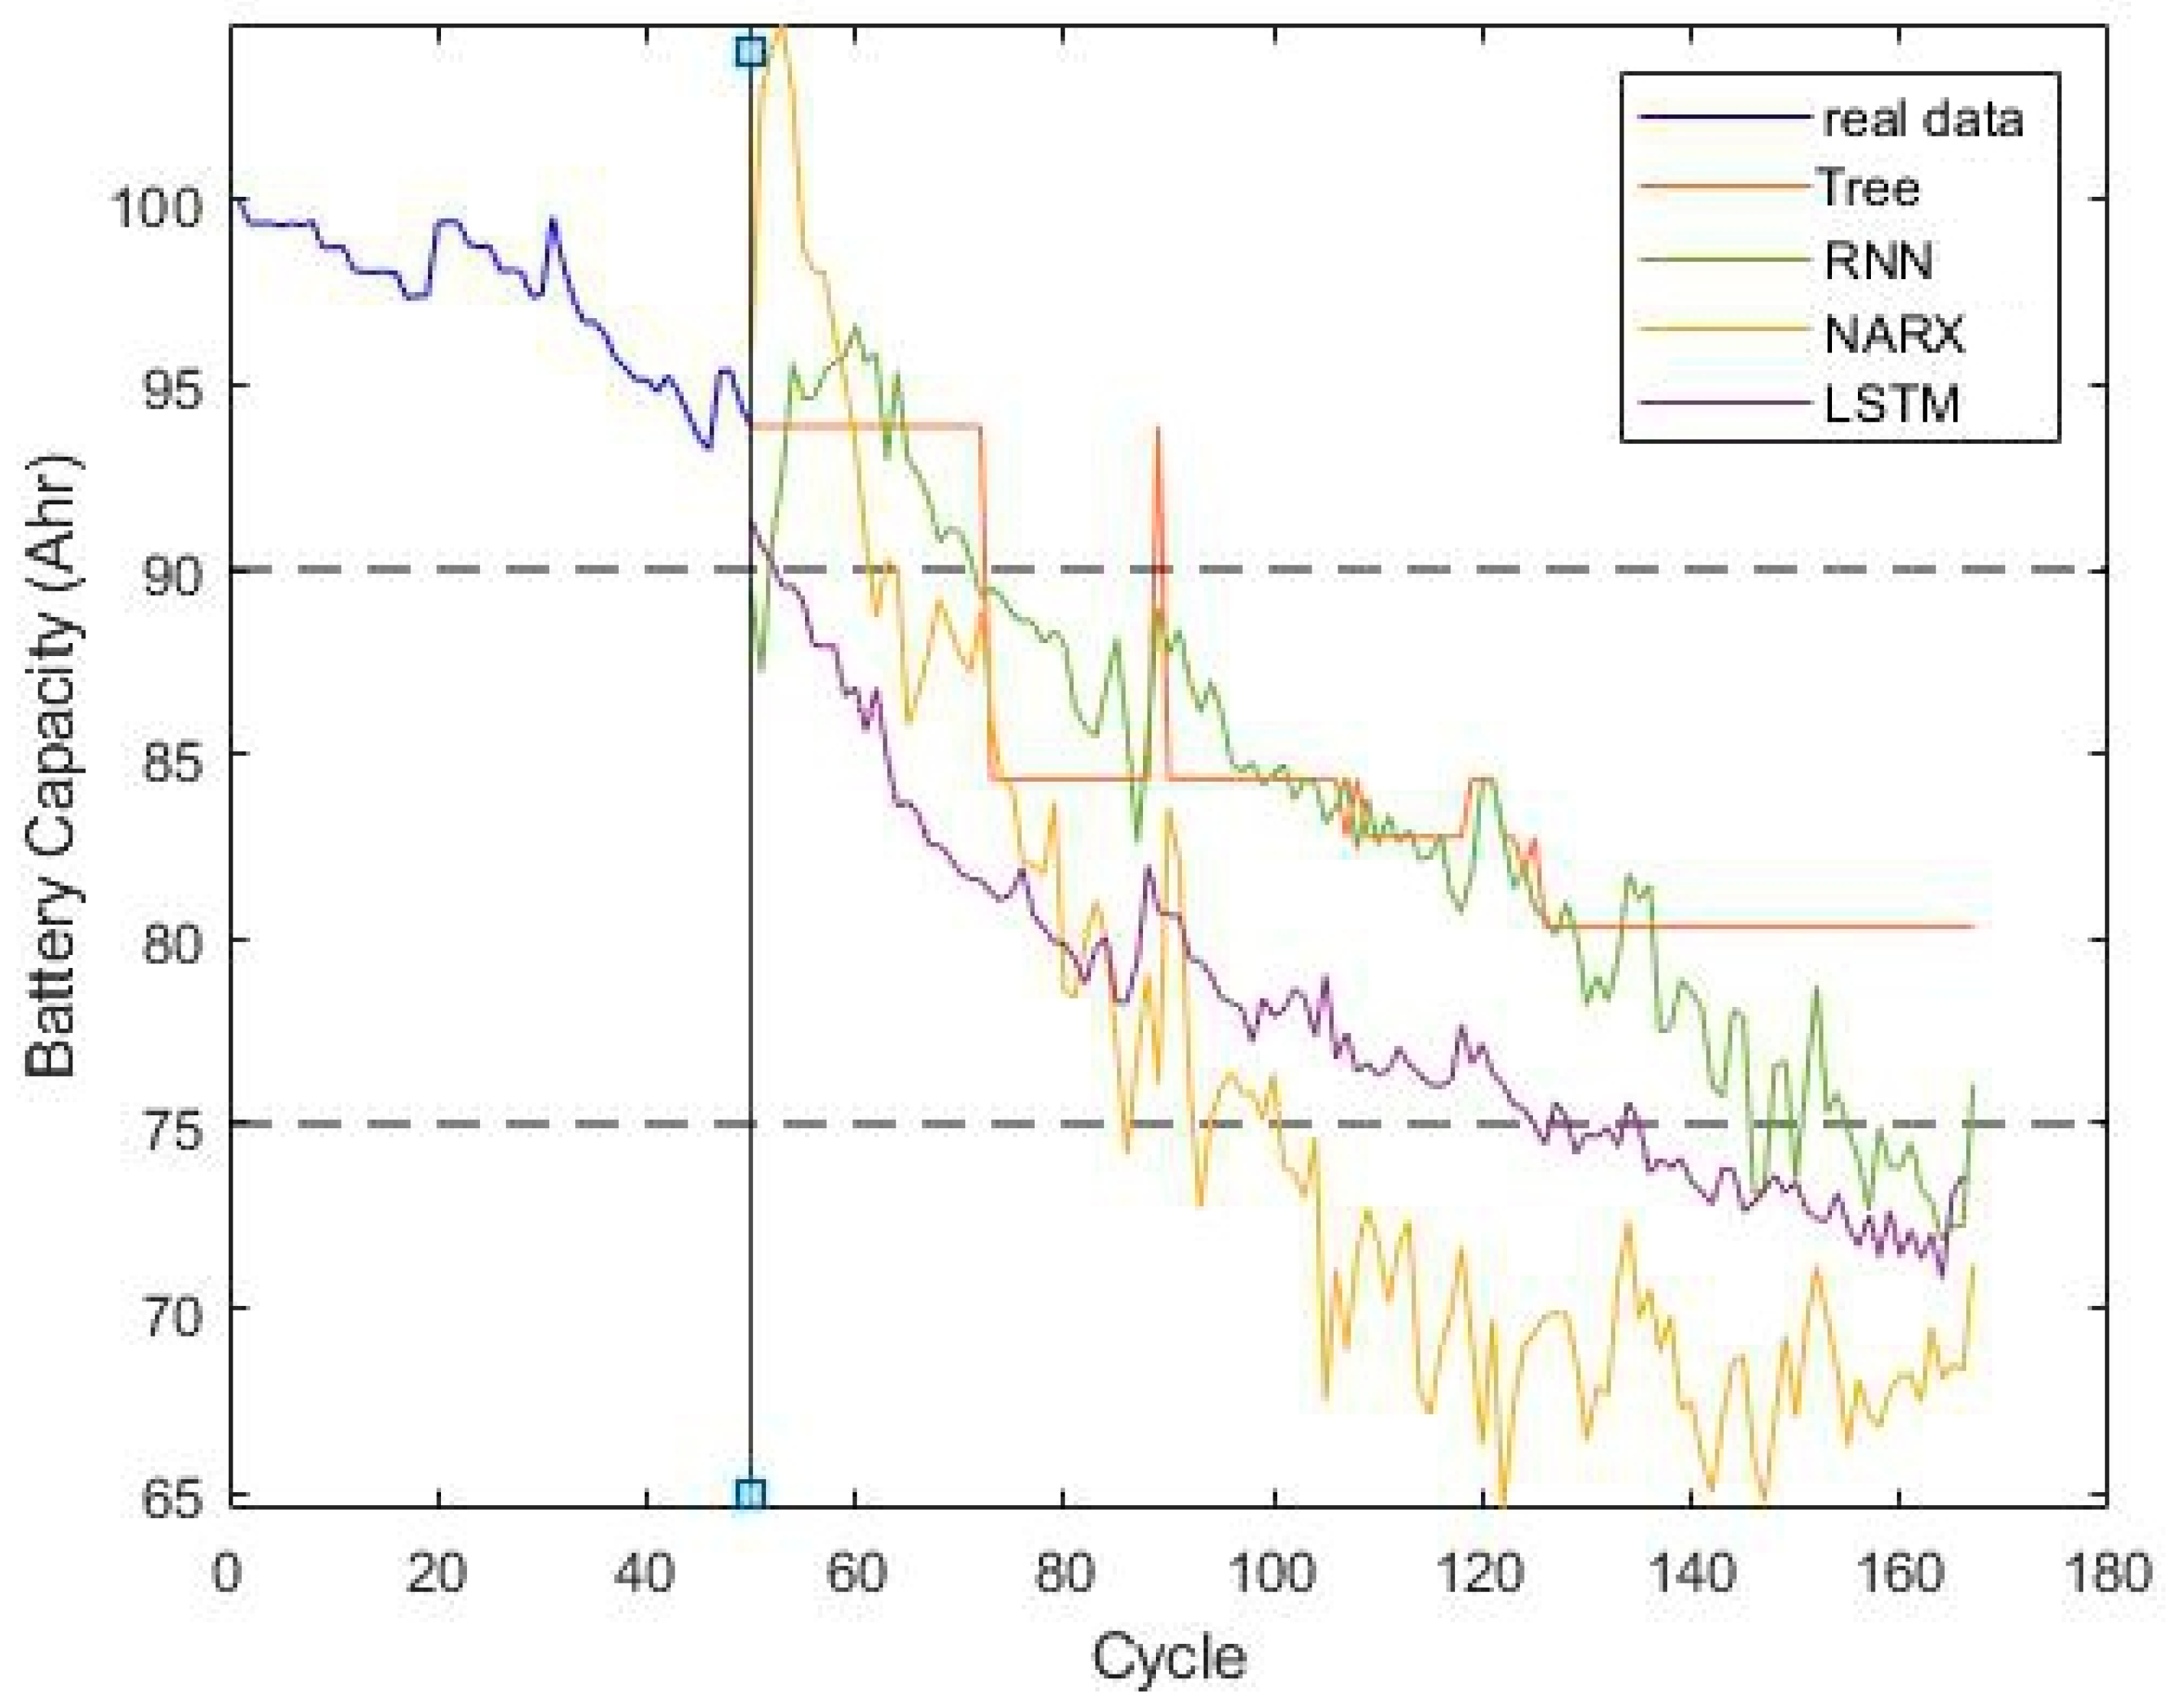
| Tree | na | na | 0.164 | 20.521 | 44.001 |
| NARX | 84 | 34 | 0.276 | 35.113 | 30.918 |
| RNN | 146 | 96 | 0.129 | 16.869 | 39.781 |
| LSTM | 126 | 76 | 0.063 | 7.130 | 18.249 |
| Real value | 136 | 84 | |||
Disclaimer/Publisher’s Note: The statements, opinions and data contained in all publications are solely those of the individual author(s) and contributor(s) and not of MDPI and/or the editor(s). MDPI and/or the editor(s) disclaim responsibility for any injury to people or property resulting from any ideas, methods, instructions or products referred to in the content. |
© 2023 by the authors. Licensee MDPI, Basel, Switzerland. This article is an open access article distributed under the terms and conditions of the Creative Commons Attribution (CC BY) license (https://creativecommons.org/licenses/by/4.0/).
Share and Cite
Chang, Y.-H.; Hsieh, Y.-C.; Chai, Y.-H.; Lin, H.-W. Remaining-Useful-Life Prediction for Li-Ion Batteries. Energies 2023, 16, 3096. https://doi.org/10.3390/en16073096
Chang Y-H, Hsieh Y-C, Chai Y-H, Lin H-W. Remaining-Useful-Life Prediction for Li-Ion Batteries. Energies. 2023; 16(7):3096. https://doi.org/10.3390/en16073096
Chicago/Turabian StyleChang, Yeong-Hwa, Yu-Chen Hsieh, Yu-Hsiang Chai, and Hung-Wei Lin. 2023. "Remaining-Useful-Life Prediction for Li-Ion Batteries" Energies 16, no. 7: 3096. https://doi.org/10.3390/en16073096
APA StyleChang, Y.-H., Hsieh, Y.-C., Chai, Y.-H., & Lin, H.-W. (2023). Remaining-Useful-Life Prediction for Li-Ion Batteries. Energies, 16(7), 3096. https://doi.org/10.3390/en16073096