Article

Deep Learning for Modeling an Offshore Hybrid Wind–Wave Energy System

1
Department of Mechanical Engineering, K. N. Toosi University of Technology, Tehran 1999143344, Iran
2
Faculty of Informatics, Selye University, 94501 Komarom, Slovakia
3
Department of Electrical and Computer Engineering, University of Waterloo, Waterloo, ON N2L 3G1, Canada
4
Waterloo Institute for Sustainable Energy (WISE), University of Waterloo, Waterloo, ON N2L 3G1, Canada
5
German Research Center for Artificial Intelligence, 26129 Oldenburg, Germany
6
Institute of Information Engineering, Automation and Mathematics, Slovak University of Technology in Bratislava, 81243 Bratislava, Slovakia
7
Biomatics and Applied Artificial Intelligence Institution, John von Neumann Faculty of Informatics, Obuda University, 1034 Budapest, Hungary
8
Physiological Controls Research Center, Obuda University, 1034 Budapest, Hungary
*
Authors to whom correspondence should be addressed.
Energies 2022, 15(24), 9484; https://doi.org/10.3390/en15249484
Submission received: 30 September 2022 / Revised: 9 November 2022 / Accepted: 23 November 2022 / Published: 14 December 2022
(This article belongs to the Special Issue Wind and Wave Energy Resource Assessment and Combined Utilization)

Abstract

:
The combination of an offshore wind turbine and a wave energy converter on an integrated platform is an economical solution for the electrical power demand in coastal countries. Due to the expensive installation cost, a prediction should be used to investigate whether the location is suitable for these sites. For this purpose, this research presents the feasibility of installing a combined hybrid site in the desired coastal location by predicting the net produced power due to the environmental parameters. For combining these two systems, an optimized array includes ten turbines and ten wave energy converters. The mathematical equations of the net force on the two introduced systems and the produced power of the wind turbines are proposed. The turbines’ maximum forces are 4 kN, and for the wave energy converters are 6 kN, respectively. Furthermore, the comparison is conducted in order to find the optimum system. The comparison shows that the most effective system of desired environmental condition is introduced. A number of machine learning and deep learning methods are used to predict key parameters after collecting the dataset. Moreover, a comparative analysis is conducted to find a suitable model. The models’ performance has been well studied through generating the confusion matrix and the receiver operating characteristic (ROC) curve of the hybrid site. The deep learning model outperformed other models, with an approximate accuracy of 0.96.

1. Introduction

In recent years, a significant part of the energy conversion mechanism in renewable energy systems (RES) has utilized the ocean’s waves energy. Energy harvesting from the oceans was an efficient and clean way of producing electricity [1]. This relatively new energy resource can significantly reduce the pressure on fossil fuel power plants and positively contribute to reducing carbon dioxide emissions and further pollutants [2]. Recently, there has been a great deal of progress in advancing the energy conversion mechanisms for renewable energy systems (RESs) [3,4]. Hybrid RESs, e.g., wave–wind combined systems, have also emerged to improve efficiency and performance [5,6]. Rony and Karmakar investigated the integrated system’s responses to understand the effects of the wave energy converter (WEC) in the various operating conditions on the wind turbine under regular and irregular waves. This study presents a suitable array of these systems in a hybrid RES site [7]. Another research is implemented on the other aspect of these kinds of sites. Si et al. studied the dynamic response and output power of the float wind turbine and wave energy converter. As a result, the optimum array of these systems and their best control design are introduced [8]. In order to use a specific area to generate optimum electricity, researchers have found a way to combine RESs that can simultaneously generate optimized electricity from multiple energy sources. They found that the ocean environment could cause a significant amount of electricity from a combination of wind turbines and wave energy converters due to sufficient wind currents and naturally occurring waves in these environments [9,10]. It has been well studied that optimal use of offshore wave–wind energy reduces the emitted amount of CO2 into the atmosphere and contributes to the region’s economic growth and development [11,12]. Today, the simultaneous use of wind and ocean waves can be considered a well-established practice and essential for developing the new generation of offshore energy farms [13,14,15]. The wind–wave hybrid system has also been regarded as a sustainable RES [16] for the optimal use of clean and free energy sources [17] and low-cost production [18,19] with lower environmental impacts [20,21]. Related to the importance of increasing the demand rates of these sites, this study contributes to the optimal design and advancement of a wave–wind system using a data-driven method [7,22]. Consequently, in this proposed research, hybrid bladeless wind turbines and wave energy converters, the simultaneous use of wind and wave energy, is considered as the hybrid site of the bladeless wind turbine and the wave energy converter (HBWTWEC) [23]. Despite the high installation costs of these sites, the construction procedure can have many benefits for private and nonprivate investors, such as reducing construction costs through electrical energy transfer, storage systems, common infrastructure [24], and increasing the amount of produced energy in the specified area [25,26]. Hence, it is clear that power plants must have specific guidelines for operation due to the inherent characteristics of the systems and their performance in the harsh conditions of oceans [27]. For the mentioned reasons, the main factor for the technological progress of these sites can be referred to as the global development of numerical simulations and appropriate cost-effective models [28]. These models can provide appropriate facilities for evaluating these sites according to the installation area. The recent studies on hybrid RES can be observed in Table 1.
Among the industrial tools for data-driven modeling, different machine learning (ML) and deep learning (DL) algorithms, such as various types of artificial neural networks (ANN), in addition to the Internet of Things (IOT) technologies, are found to be efficient for modeling and forecasting offering an alternative way to solve complex problems [33,34,35]. In particular, DL algorithms can be trained with the datasets obtained from numerical simulations by various computational fluid dynamics (CFD) methods, as well as experimental data from laboratories [36]. Deep learning algorithms have been used to predict essential parameters and achieve gradual and more accurate performance. Furthermore, they are considered to be an excellent tool for predicting energy systems whose inputs are variable in nature. The atmospheric parameters are unstable, which can affect the system’s output [37,38,39,40]. Among the applications of this method in wind energy systems, we can mention research on rapid and accurate forecasting of wind speed during a day, month, and even over several years as a climate change model [37,39]. These prediction methods were also mentioned in analyzing the output power of different wave energy converters. Many studies have been conducted in this field, which is evidence of how artificial intelligence can present wave height as a function of wind speed and predict the efficiency of these converters [41,42]. Similarly, ML-based prediction methods have been used in further hybrid renewable energy systems, and it is expected that the complex characteristics of the hybrid sites can be easier predicted and improved. Therefore, this study proposes a novel concept for a hybrid wind-wave energy converter, where the Searaser is considered for the WEC sub-system integrated with a novel vortex bladeless turbine. Mousavi et al. [41] investigated the numerical solution model using experimental data and predict the amount of production power using the LSTM method. Moreover, Dehghan et al. [42] simulated the prototype turbine built experimentally in laboratory conditions and estimated its production power. The research gap is the urge for more evaluations in the real case scenario of a hybrid wind-wave energy in a marine power plant. This study comprehensively compares the efficiency of two energy systems with a specific input, which is the experimental data used to tackle the first part of the development of the hybrid system. Furthermore, two systems are integrated into an offshore power plant for a specific location. The data-driven methods are used to predict the power generation of the two cases, which have a vital role in simultaneously harvesting energy from wind and wave and alleviating investment risk.
Due to the remote coastal location of the experimental test and climate change modeling, it is essential to use wind turbines and wave energy converters due to the potential renewable energy resources of these regions. Alternative renewable energy systems, e.g., solar cannot perform efficiently in the region. This study brings novelty by investigating the combination of a special kind of wind turbine and wave energy converter, namely vortex bladeless wind turbine (VBT) and Searaser. Numerical simulation was selected as an input in the case of a prerequisite for providing data, beginning with selecting a location where the experimental data were collected. For this purpose, the results and experimental test values are used as the ML method’s input. The main aim is to utilize different ML methods to accurately predict desired parameters by the most common RES. They are recurrent neural networks (RNNs), long short-term memory (LSTM), random forest, and support vector machine (SVM), which were applied to the same input. Hence, the training procedure of these algorithms requires appropriate data. Moreover, their forecasting performance is compared between these different algorithms. In addition, the output power for each system in a hybrid power plant is calculated and compared, and finally, the output power of the hybrid site is calculated, respectively.

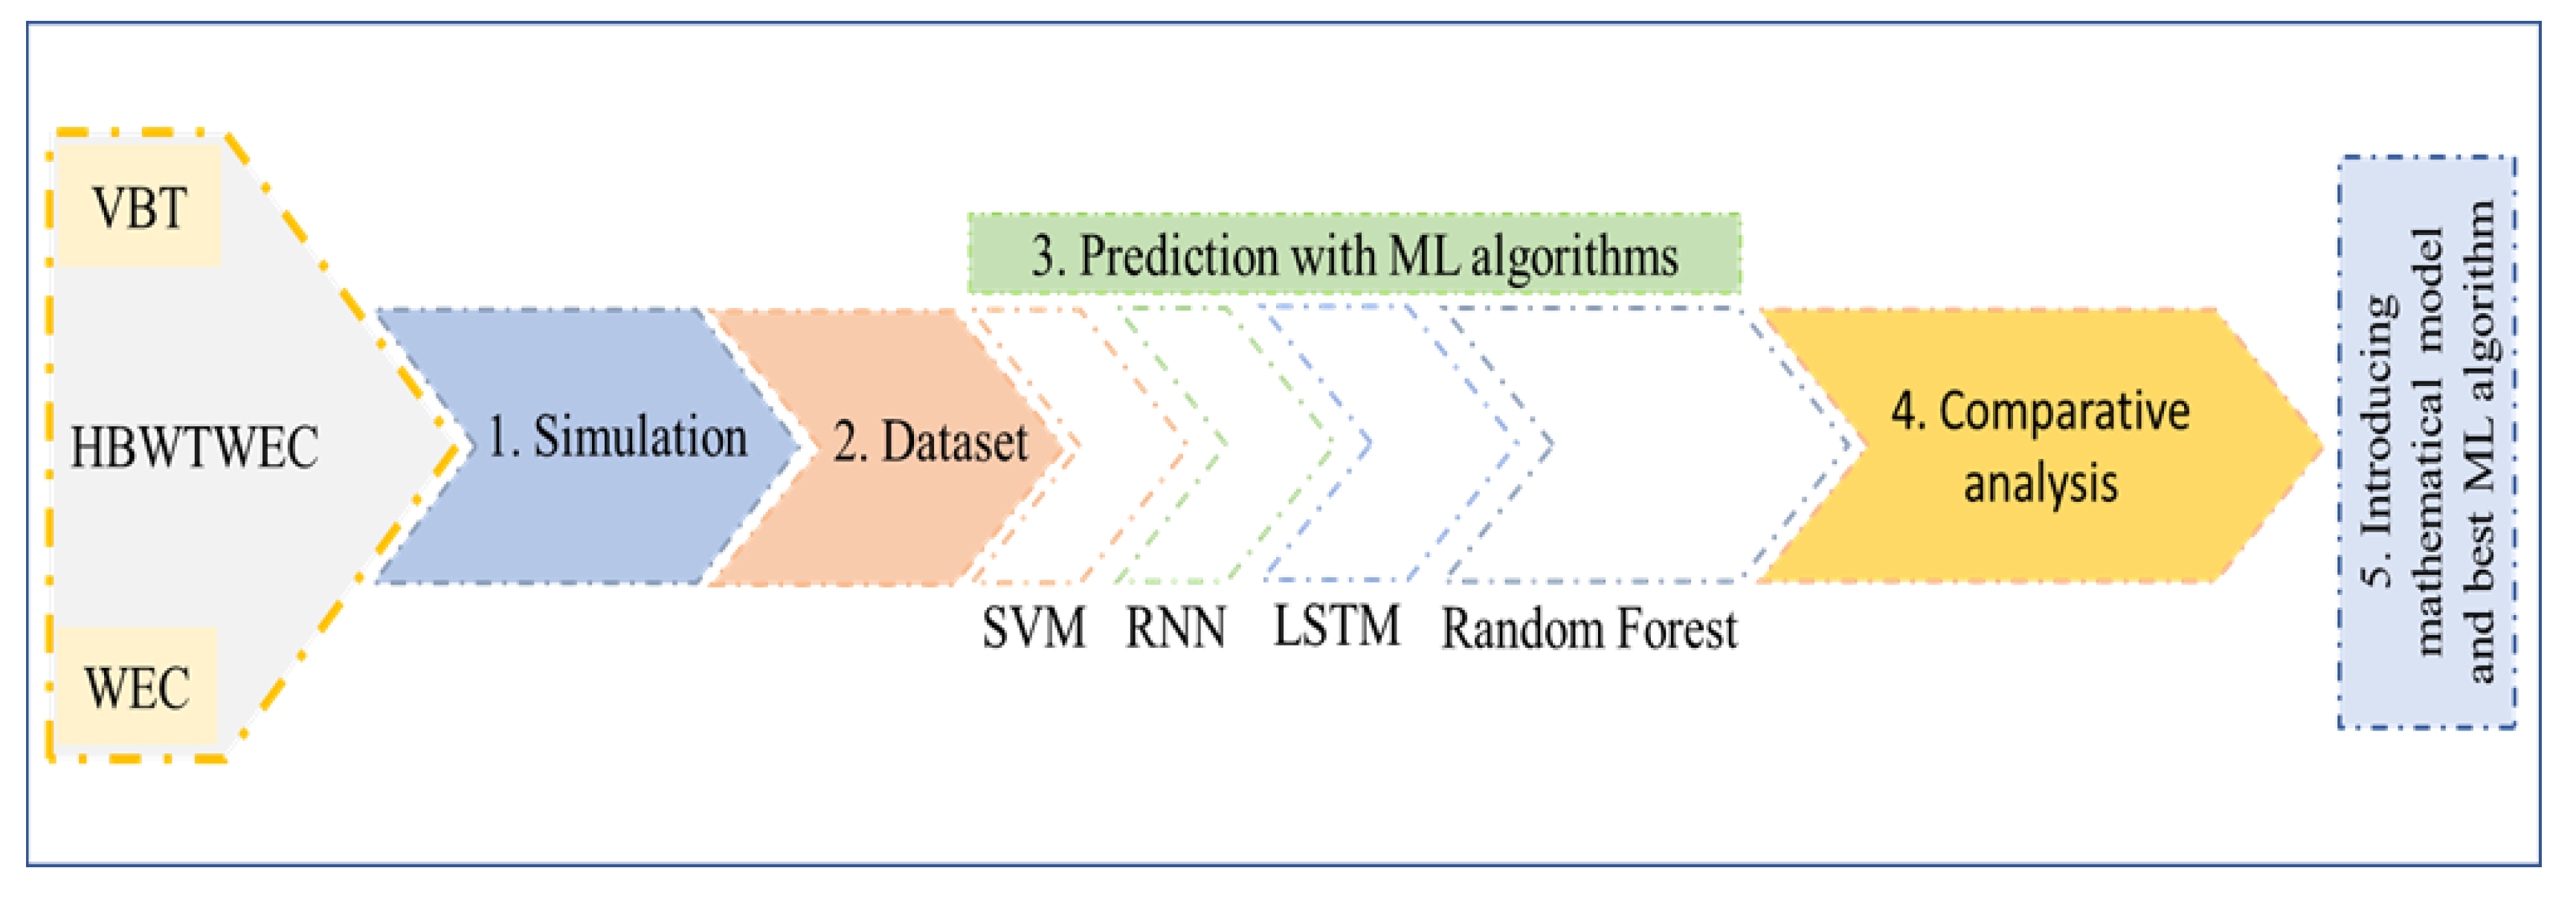
2. Materials and Methods

In this section, the introduced hybrid site includes the array of two popular RESs: a wind turbine and wave energy converter. Due to the importance of solving real-world problems, the dataset is collected from the experimental test. Then, by utilizing the input dataset from environmental conditions, different ANN algorithms are developed to predict the net produced power of the hybrid site. Figure 1 presents the different steps of this study.

2.1. HBWTWEC Description

The hybrid site includes a combination of offshore wind and wave energy systems. The proposed wind turbine of this research is a vortex bladeless wind turbine (VBT), and the wave energy converter is a Searaser. Using a large number of these systems, the offshore site can be built to generate a significant amount of electrical energy. In this research, it consists of ten VBTs and ten Searasers. In the following, the forecasting models are studied and compared, along with finding the best system among the two proposed RESs in terms of power generation.

2.2. Experimental Data

In order to make the results more realistic, the experimental data from a climate change model [43] were used as the ML algorithm’s input to simulate and solve the governing equations numerically. For this purpose, the proposed parameters are defined as wind speed and wave height as input conditions. The data variate abruptly because of their fluctuated nature, which changes with the local weather [43].

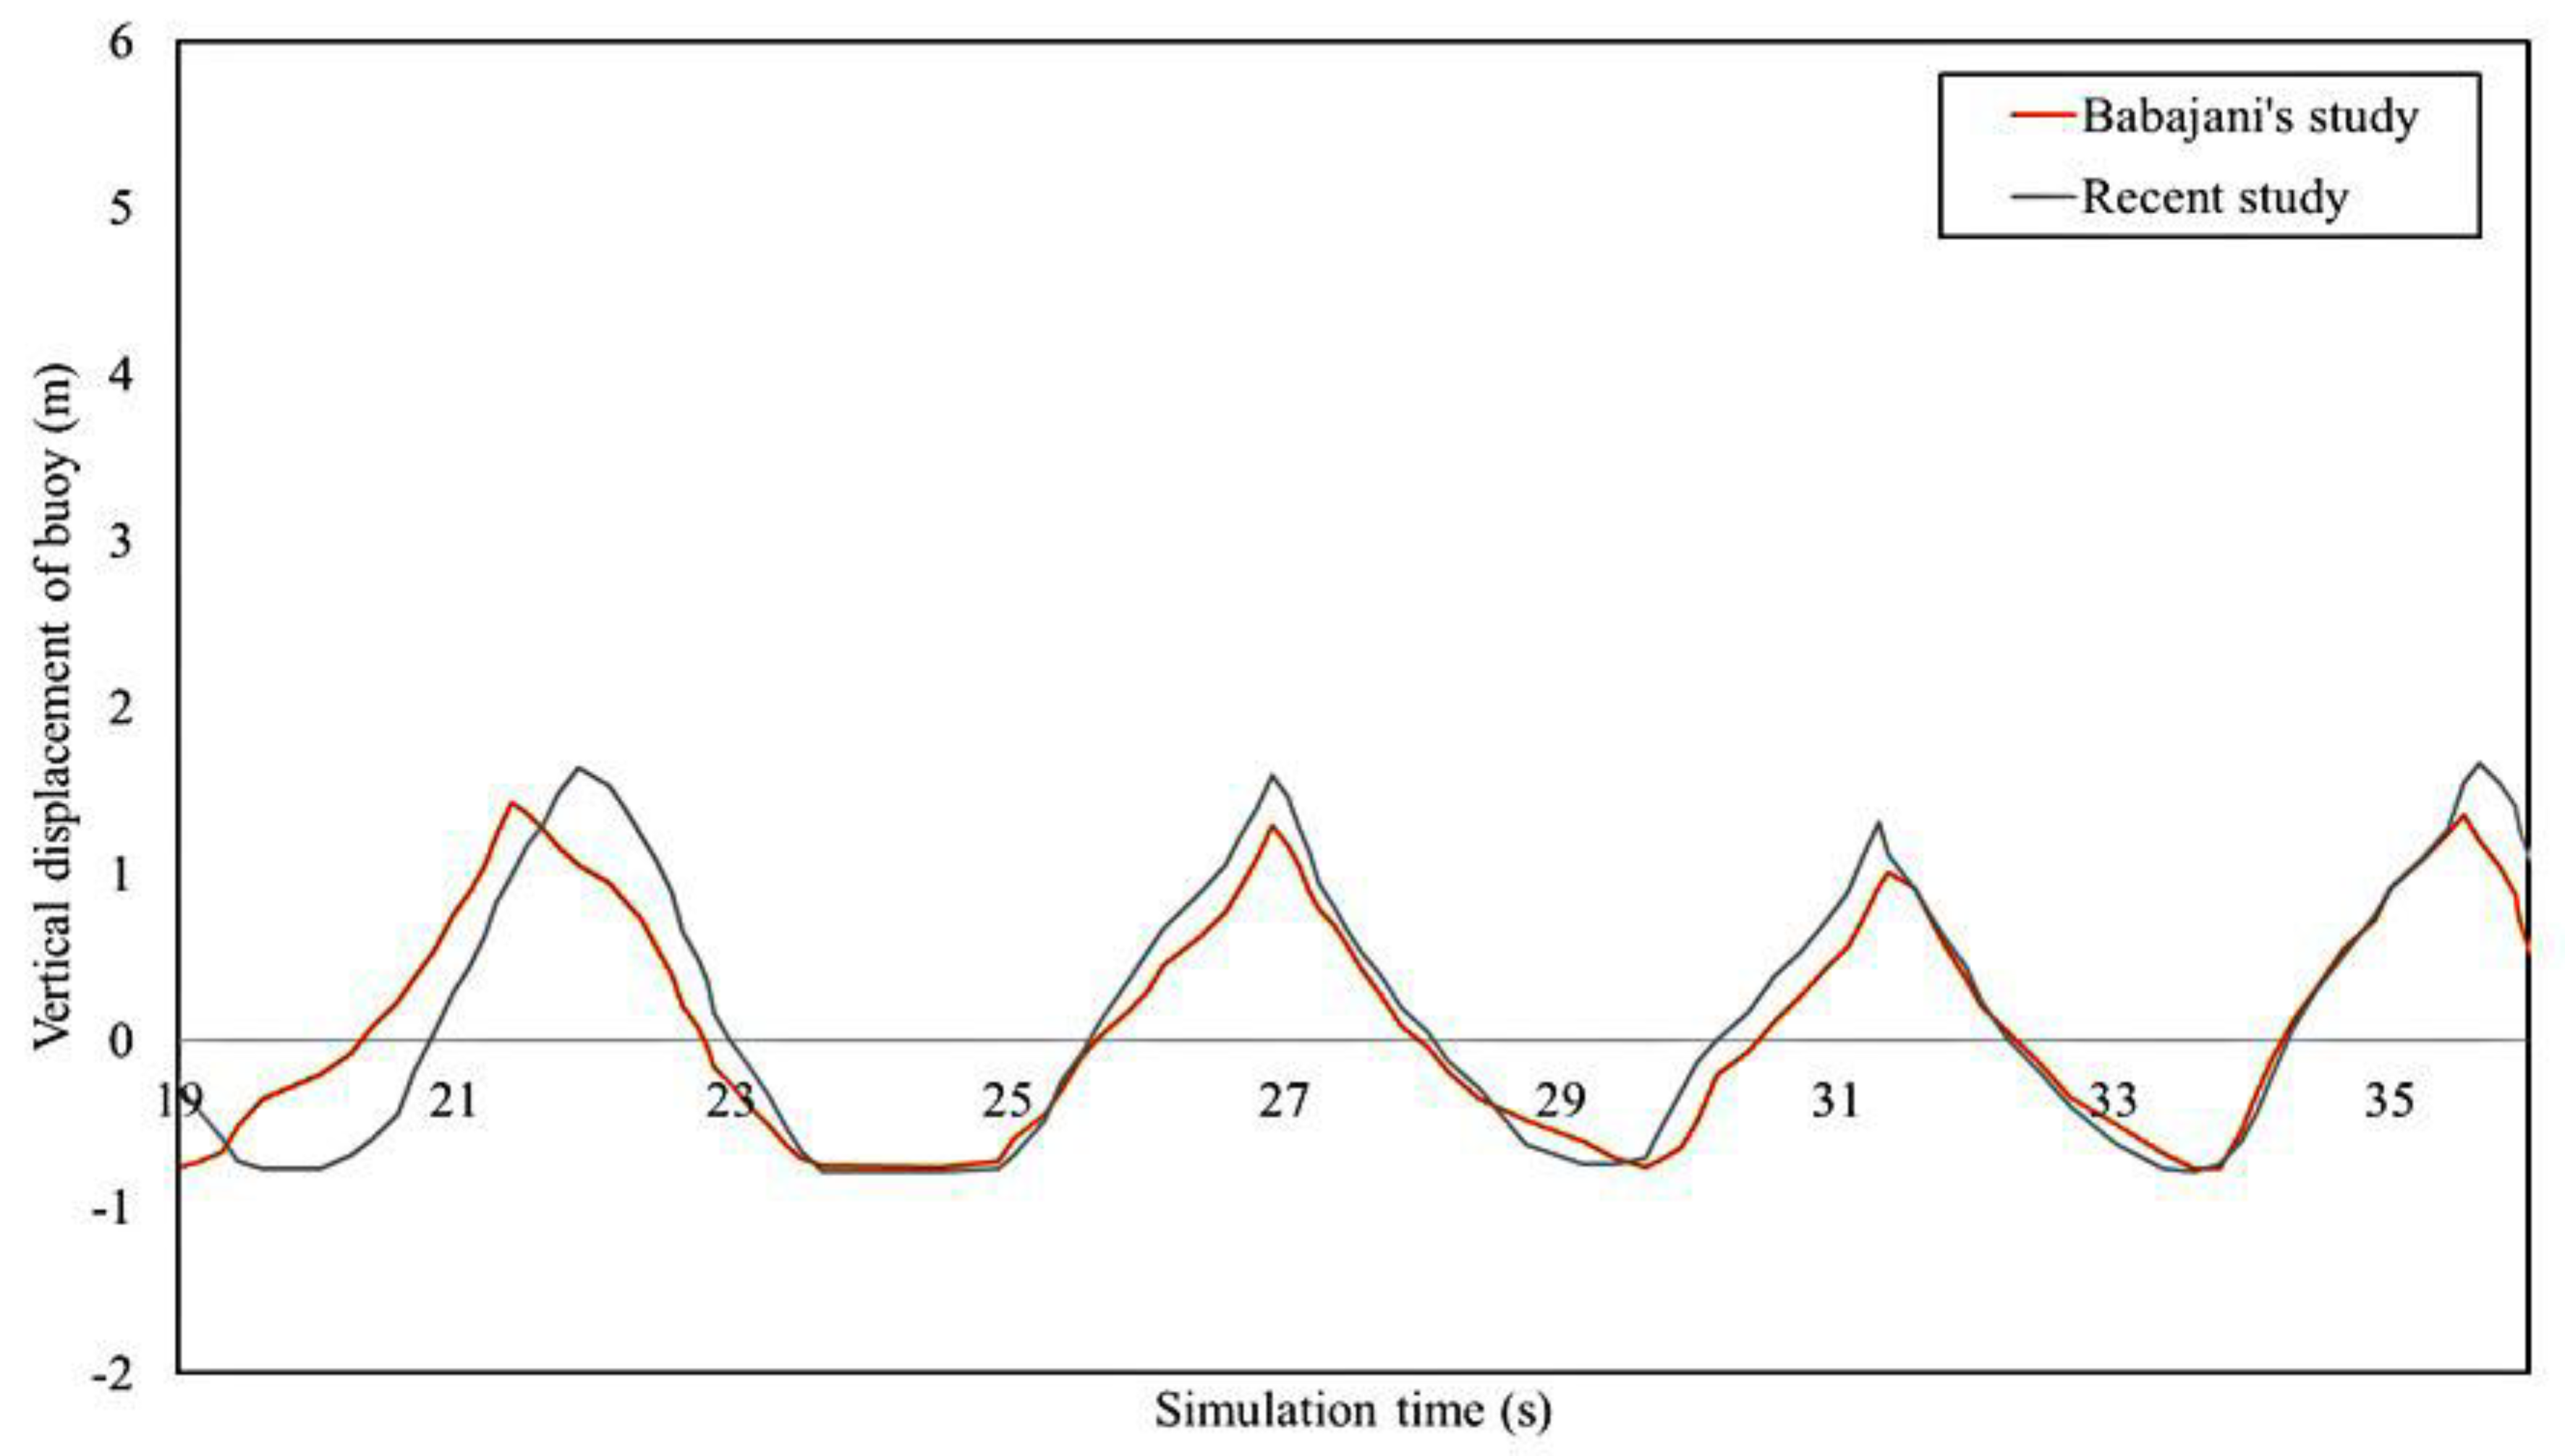
2.3. Numerical Simulations

One of the most important points, in order to have accurate artificial intelligence (AI) prediction modeling, is to have a rich dataset. Two critical parameters are collected from an experimental test. However, for hybrid site modeling, more input features are required. In this case, it is necessary to have numerical modeling first.

Governing Equations

To simulate HBWTWEC, numerical solution software (FLOW-3D) was used to analyze solid and fluid interactions between the structure of a VBT and airflow, as well as Searaser and ocean waves. This software utilizes the volume fraction technique as a computational cell to calculate the ratio of open volume to total in a computational volume [44]. The study is classified into two different systems, where the involved fluids are different, respectively.
A.
Searaser and ocean waves interaction equations.
The exerted force from the buoy which makes a torque is explained by Equation (1) [41].
F = m d v G d t
where m is the mass of the buoy and d v G d t   represents the acceleration of the buoy, which is derived from the velocity of the buoy relative to time (t). V indicates the speed at which the buoy moves along the proportional axis to the ocean’s surface (z). The torque helps to produce mechanical power. This motivates a special generator to convert this power to electrical power [41].
P = 1 64 π ρ s g 2 H s 2 T
where ρ s   is the density of seawater and g is the acceleration of the Earth’s gravity. Hs is the wave height passed from the Searaser, and T is the torque of the buoy’s rotational movement.
B.
Interaction equations of bladeless wind turbine and airflow.
The equation of drag force exerted on the body of the VBT and the generated power were solved to produce a related dataset. Other governing equations are given in detail in [43]. Equations (3) and (4) show these two important parameters in this research.
F f l u i d ( x . y . t ) = 1 2 ρ u 2 ( D l ) C d ( x . y ) sin ( ω t + φ ) i ^ + 1 2 ρ v 2 ( D l ) C d ( x . y ) sin ( ω t + φ ) j ^
where ρ is the air density, u is the wind speed, D is the diameter of the turbine oscillator, and l is the body’s height. The drag coefficient ( C d ) depends on the x and y axes, and sin ( ω t + φ )   is the sine oscillating with angular velocity ω and phase difference φ [43]. This equation indicates that this converted force is a special drag force which is directly related to the VBT geometry and the flow properties.
P = η 1 2 ρ U 3 ( 2 y + D ) l
Since η   represents the energy conversion factor of VBT and y is the amplitude of VBT oscillation, that should be considered as a variable in further calculations. The produced power of VBT has a drag force nature, too. It highly depends on the flow velocity (wind speed) and properties and also the VBT geometry, respectively. Unlike the interaction of these two systems on each other, which has been investigated, this study has neglected this interaction. Conventional offshore wind turbines not only move the surrounding air with a rotational movement of blades but also affect the sea waves. As a result, they will affect the performance of the wave energy converter. On the other hand, VBT has not affected Searaser performance due to vibrational movement, with only very small amplitudes that can be ignored at that scale.

2.4. Dataset Preparation

Due to the database nature of ML methods, it is necessary to provide a database for the algorithms to predict the required parameters. Therefore, to give a large amount of data, we use simulation and numerical solutions of governing equations and use their output as a dataset needed for training. The type of experimental training data is segmented by the splitting method, and its ratio is 90 to 10. The 5% of the dataset is randomly selected for the evaluation.

2.5. Machine Learning Algorithms

In this study, in addition to examining HBWTWEC and comparing the bladeless wind turbine with Searaser in the case of production capacity, a comparative analysis using different ML methods was conducted to find the best method. The best one with the highest efficiency predicts the total produced power in an RES site in a specific area. The utilized methods can be LSTM, RNN, random forest, and SVM, which are examined in the following governing equations of each algorithm.

2.5.1. RNN and LSTM

The Recurrent neural network (RNN) is often used to model the data for identifying each sample as dependent on previous samples, and the convolution layers extend the neighborhood to the desired pixels. Despite its advantages, it has problems with gradients disappearing and exploding during calculations, and the process of teaching this algorithm is a bit more complicated than other algorithms. Moreover, during processing, if one of the “tanh” or “Relu” activation functions is used, it can no longer perform sequential processing [45]. The optimized LSTM algorithms are a type of recurring neural network that facilitates the storage of data in memory. On the other hand, this algorithm solves the problem of gradient disappearance in the RNN algorithm. It should be noted that this algorithm has excellent performance for different stages of classifying, processing, and predicting time series.
  • The first gate, as expected, is the input gate, which decides how many inputs should be used for the algorithm’s memory change operation. The activation function in these two algorithms is the Sigmoid function, which decides which values to pass according to the two choices of 0.1. In addition, the “tanh” function is used to weight the input values, and this function’s output range varies from −1 to 1.
  • The second gateway in this algorithm is the forget-me-not gateway, which argues which data should be removed from this process within each block and how this gateway works like an input valve with a sigmoid function. This gateway compares the data of the previous state and the data recently entered into the block and shows the number 1 or 0 for each datum in that cell. The zero indicates that the data should be forgotten there. Additionally, 1 means that the data should be stored and used to continue the process.
  • The last gate, as expected, is the exit gate. Like the other two gates, the Sigmoid function decides which values to pass through 0.1. Additionally, the tanh function, like the input gate, weighs these values from −1 to 1.
The hyper parameters of RNN are 10 hidden layers, with Adam activation and 1 dense layer. The epoch size is 100 and the batch size is 20. Moreover, for the LSTM algorithm, the hyper parameters are the same as RNN in order to have a better comparison analysis between these two algorithms.

2.5.2. Random Forest

One ensemble method of ML can be introduced as random forests (RF) or random decision forests, which are often trained for regression and classification, which works by building a large number of decision trees during training. In this study, the regression prediction of this algorithm is considered more than its classification, and this is such that the average prediction of each tree in the whole forest, which is a set of decision trees, is returned. After several rounds of training, random decision forests accustom the existing trees according to the data and their change tags to perform better [46].

2.5.3. SVM

This algorithm is used to categorize and regress data. In this study, because the data are scattered and not necessarily linear, it is better to use this algorithm to predict values. In the algorithm, we plot each datum as a point in multidimensional space, the number of dimensions of which is equal to the number of properties in the problem under study. Then, the algorithm performs the classification by finding a surface that connects the two features well, and the abundance of data on that page is higher [47]. One of the most important equations in the study [38] is the equation of applied force to the buoy and the produced power of the Searaser. Equations (1) and (2) are used in order to achieve one of the goals [42].

3. Results

Since this study is conducted to promote the view of the ML application based on estimating the production capacity of a hypothetical power plant, the material presented as a simulation and numerical solution has been used in the previous two studies. Furthermore, valuation of results has been performed in previous articles. Figure 2 shows the evaluation and validation of the results by comparing the amount of buoyancy in the vertical axis. The value of the difference between the two graphs is due to the difference in the simulation input. In a former study by Babajani et al. [46], this value was a maximum of 0.75 m, but in this study, the maximum height of the input wave is 1 m.
As it is observed in Figure 2, results are so close to another study, which is evidence of verification. As a matter of fact, the vertical displacements of the buoy fluctuate 3 m. It is moved up to 2 m up and 1 m down from its origin. These periodic movements happen during simulation time. The periodic nature of buoy movement is because of the periodic behavior of inlet waves.

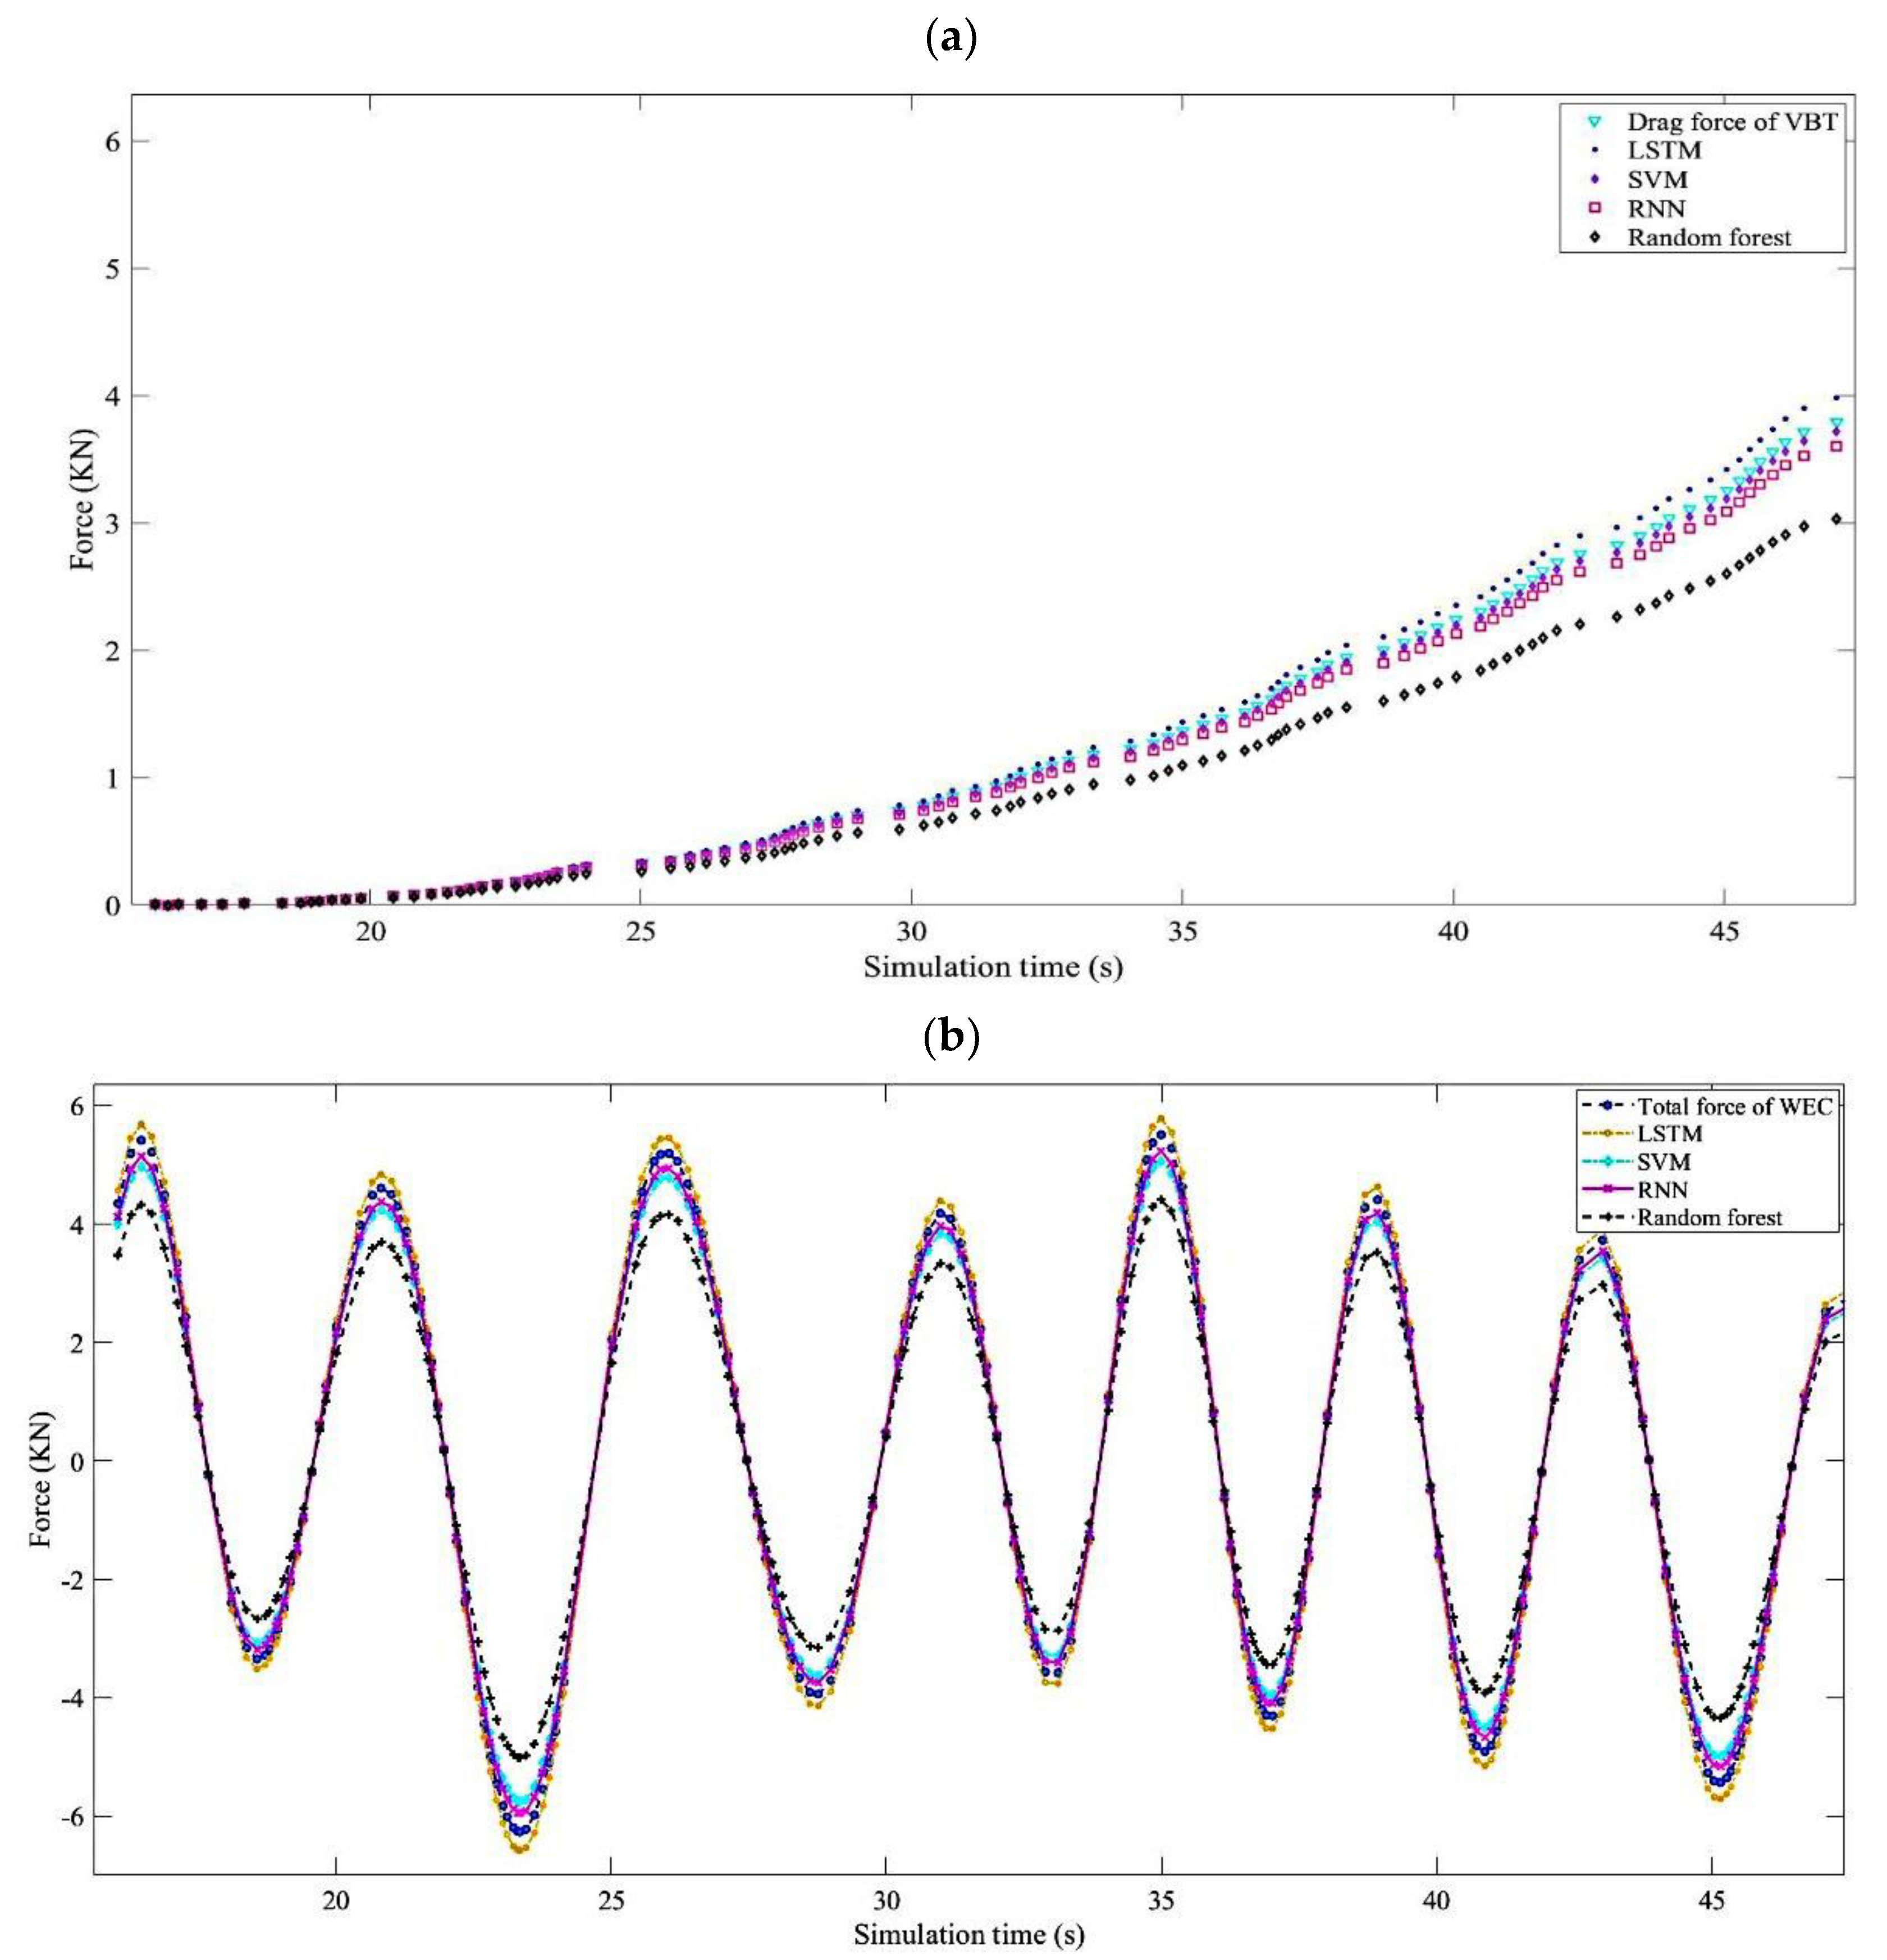
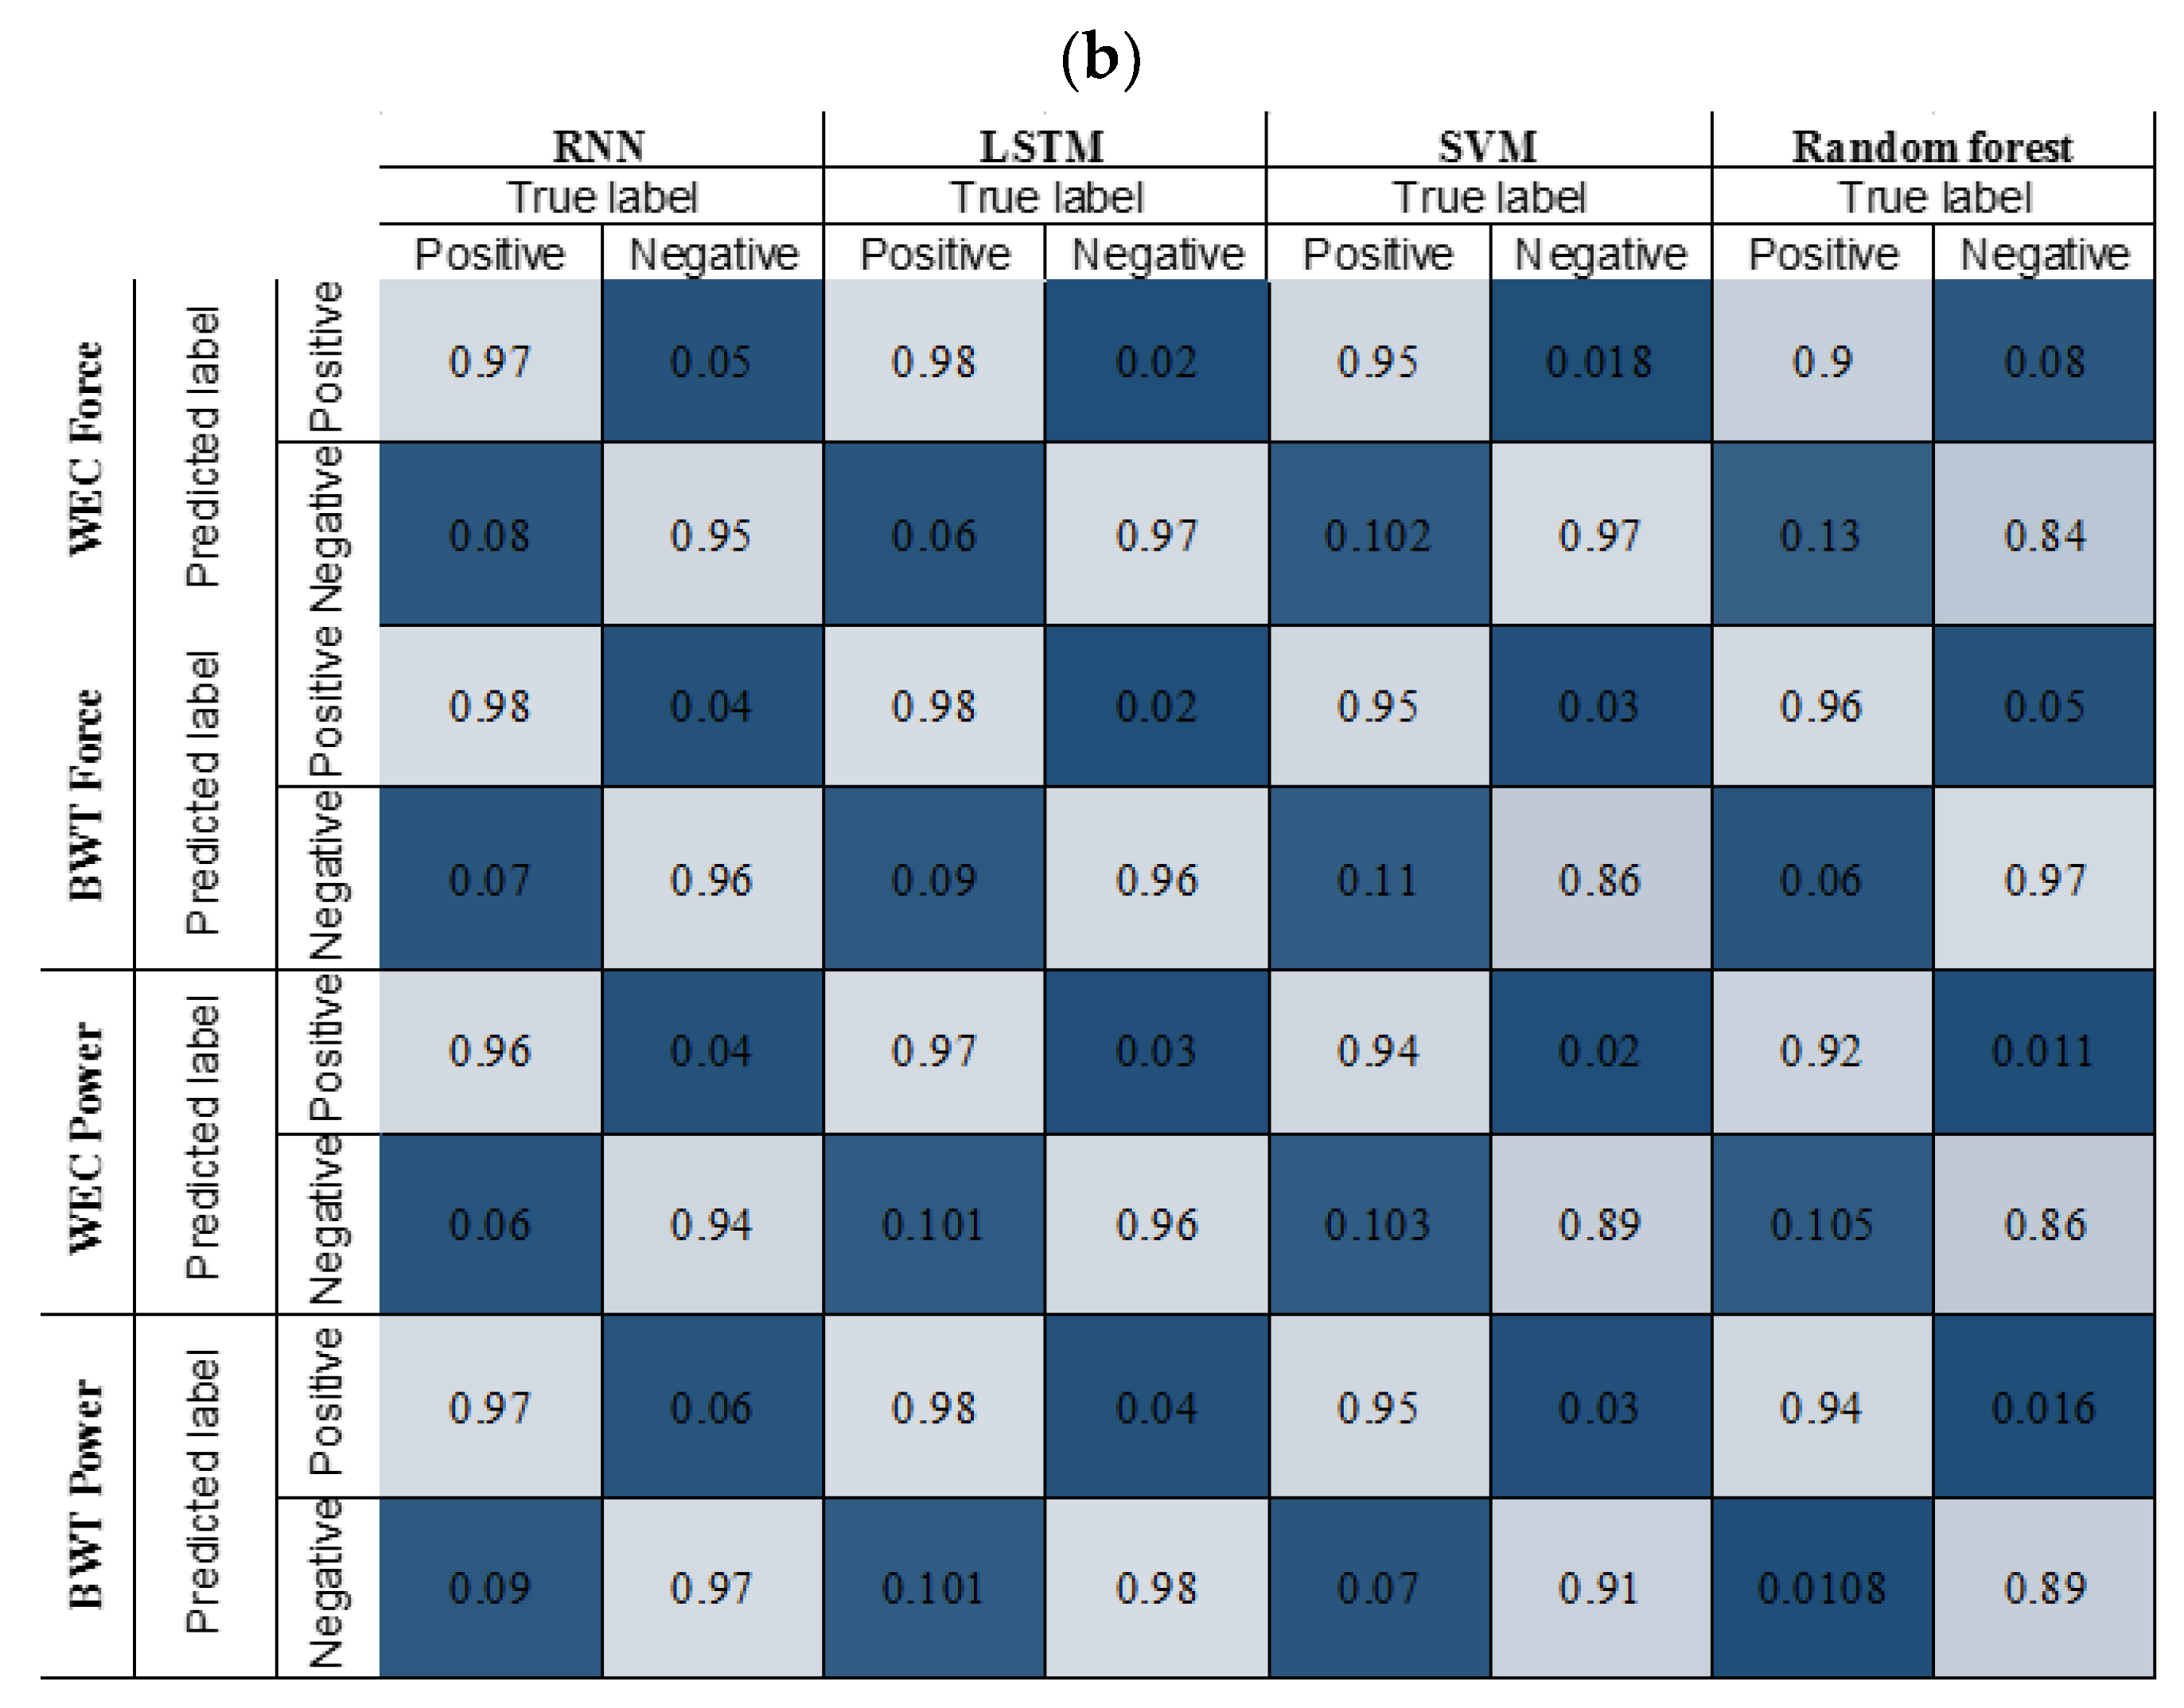
3.1. Comparative Analysis between Different Machine Learning Algorithms

Since one of the most important issues in the analysis of RESs for the construction of hybrid sites is to predict the amount of produced power of these systems, in this study, we have tried to find the best one among the four mentioned algorithms. Therefore, this study was conducted to find the best ML algorithm in the most practical parameters used in system analysis as key parameters in maintaining systems and selecting them to build an RES site, the force exerted on each of the systems, and their produced power. Figure 3 and Figure 4 show the ML algorithms predicted results for these two parameters.
Figure 3 presents the converted force of the VBT (Figure 4a) and WEC (Figure 4b). The nature of the exerted force in VBT is drag force. So, it varies with power law. However, WEC profiles fluctuated as a sine function because they are completely depended on ocean waves as an inlet of this system. The VBT maximum forces are 4 kN, and for the WEC are 6 kN, respectively. Moreover, the values predicted by various machine learning methods (LSTM, SVM, RNN, RF) are compared with the amount of exerted force on the bladeless wind turbine (a) and Searaser (b). It can obviously be seen that the best algorithms among them are LSTM and RNN, which have the closest prediction values to the simulation ones. Moreover, it shows that the mentioned algorithms are more reliable than others. However, it can be realized that the best one is the LSTM algorithm. The advantage of this method over RNN is expected to be the solution to the sudden disappearance problem of gradients during code execution.
Figure 4 also presents a comparative analysis, considering that the LSTM algorithm is the best way to predict the output power of these two systems. In these predictions, the only algorithm that did not work accurately is the random forest algorithm.

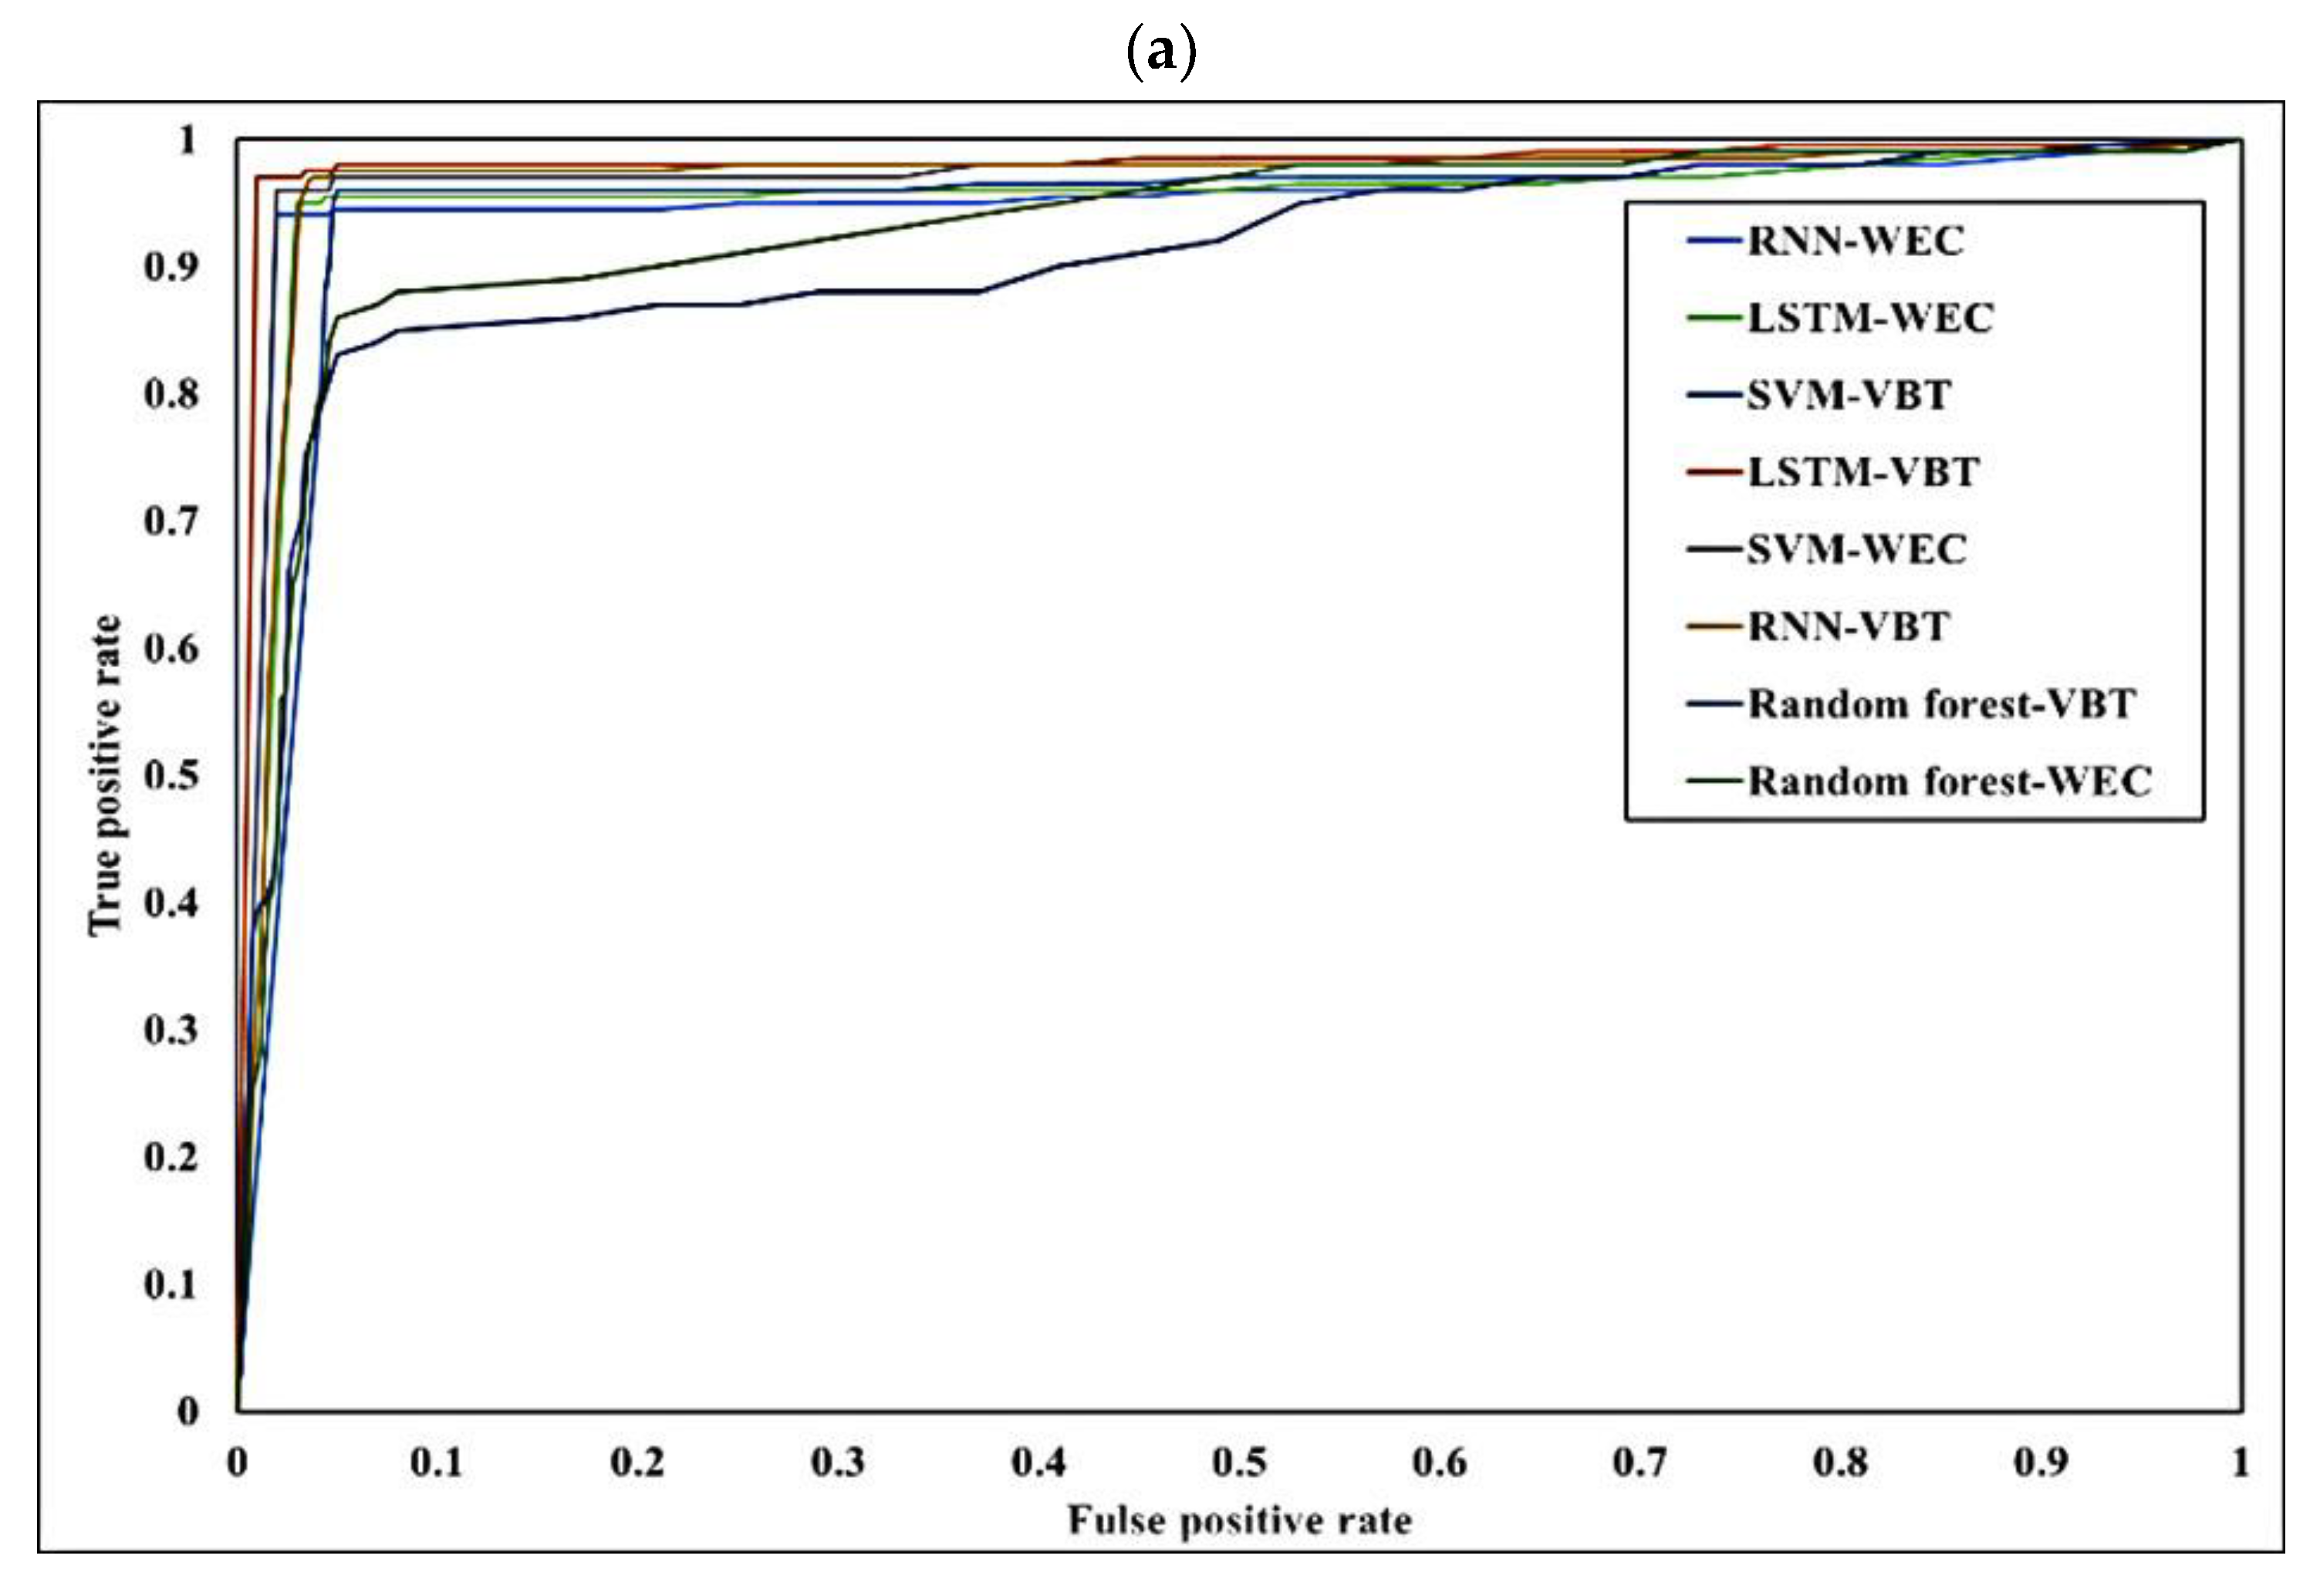
3.2. Statistical Analysis for Evaluating Model Performance

One of the most important things in ML implementation is to evaluate these algorithms with the ROC curve. Furthermore, it is another tool to examine the accuracy of their performance. Three commonly utilized ML algorithms for estimating the power and also converted force were assessed, and the model performances are reported in Table 2. Statistical analysis was then assessed using mean absolute error (MAE), root mean square error (RMSE), ACC, FPR, TPR, PPV, and TNR. Furthermore, ROC curves and the confusion matrix of different values related to each parameter are shown in Figure 5.
Figure 5 shows that the most accurate algorithm, as it can be considered, is LSTM. When tested for four proposed ML algorithms, the significant accuracy is for the LSTM algorithm in four measured parameters. The true positive rates of this algorithm are in the highest level in power and exerted forces for both proposed renewable energy systems. Moreover, the false negative rates are the least in predicting these desired parameters. However, RNN is another accurate algorithm for predicting these parameters, but related to this study’s aim, the most accurate one should be introduced.

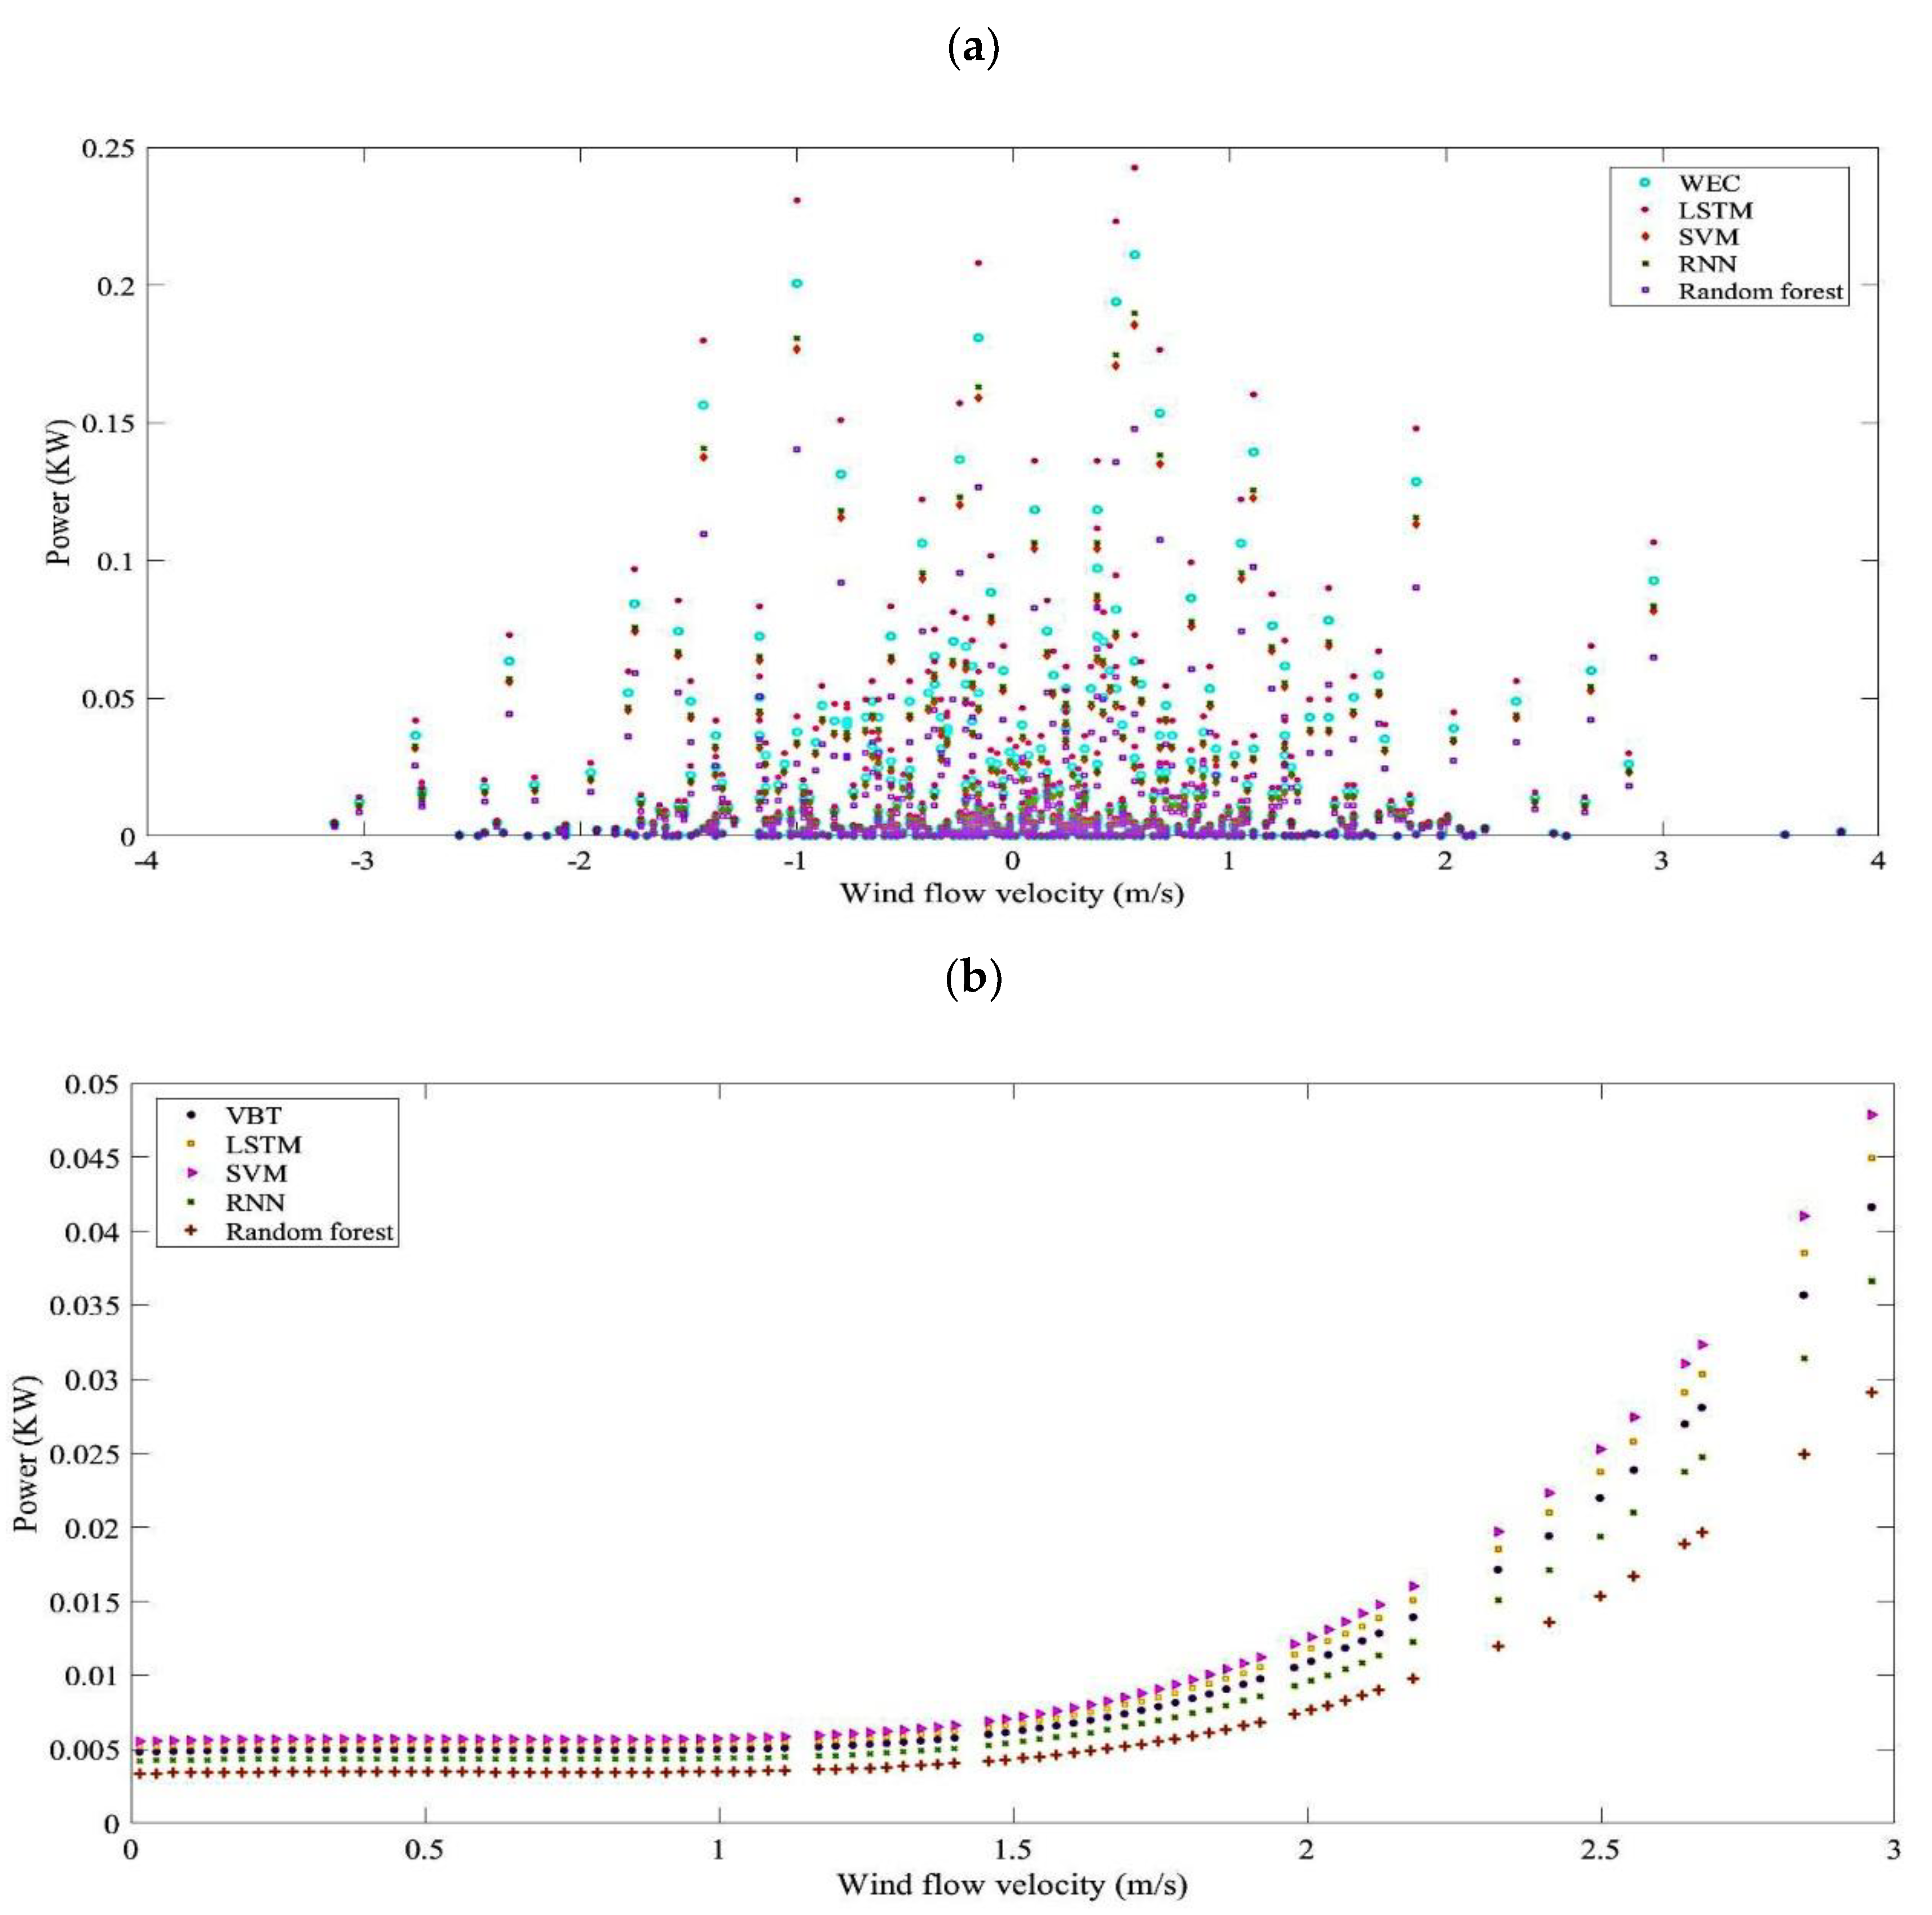
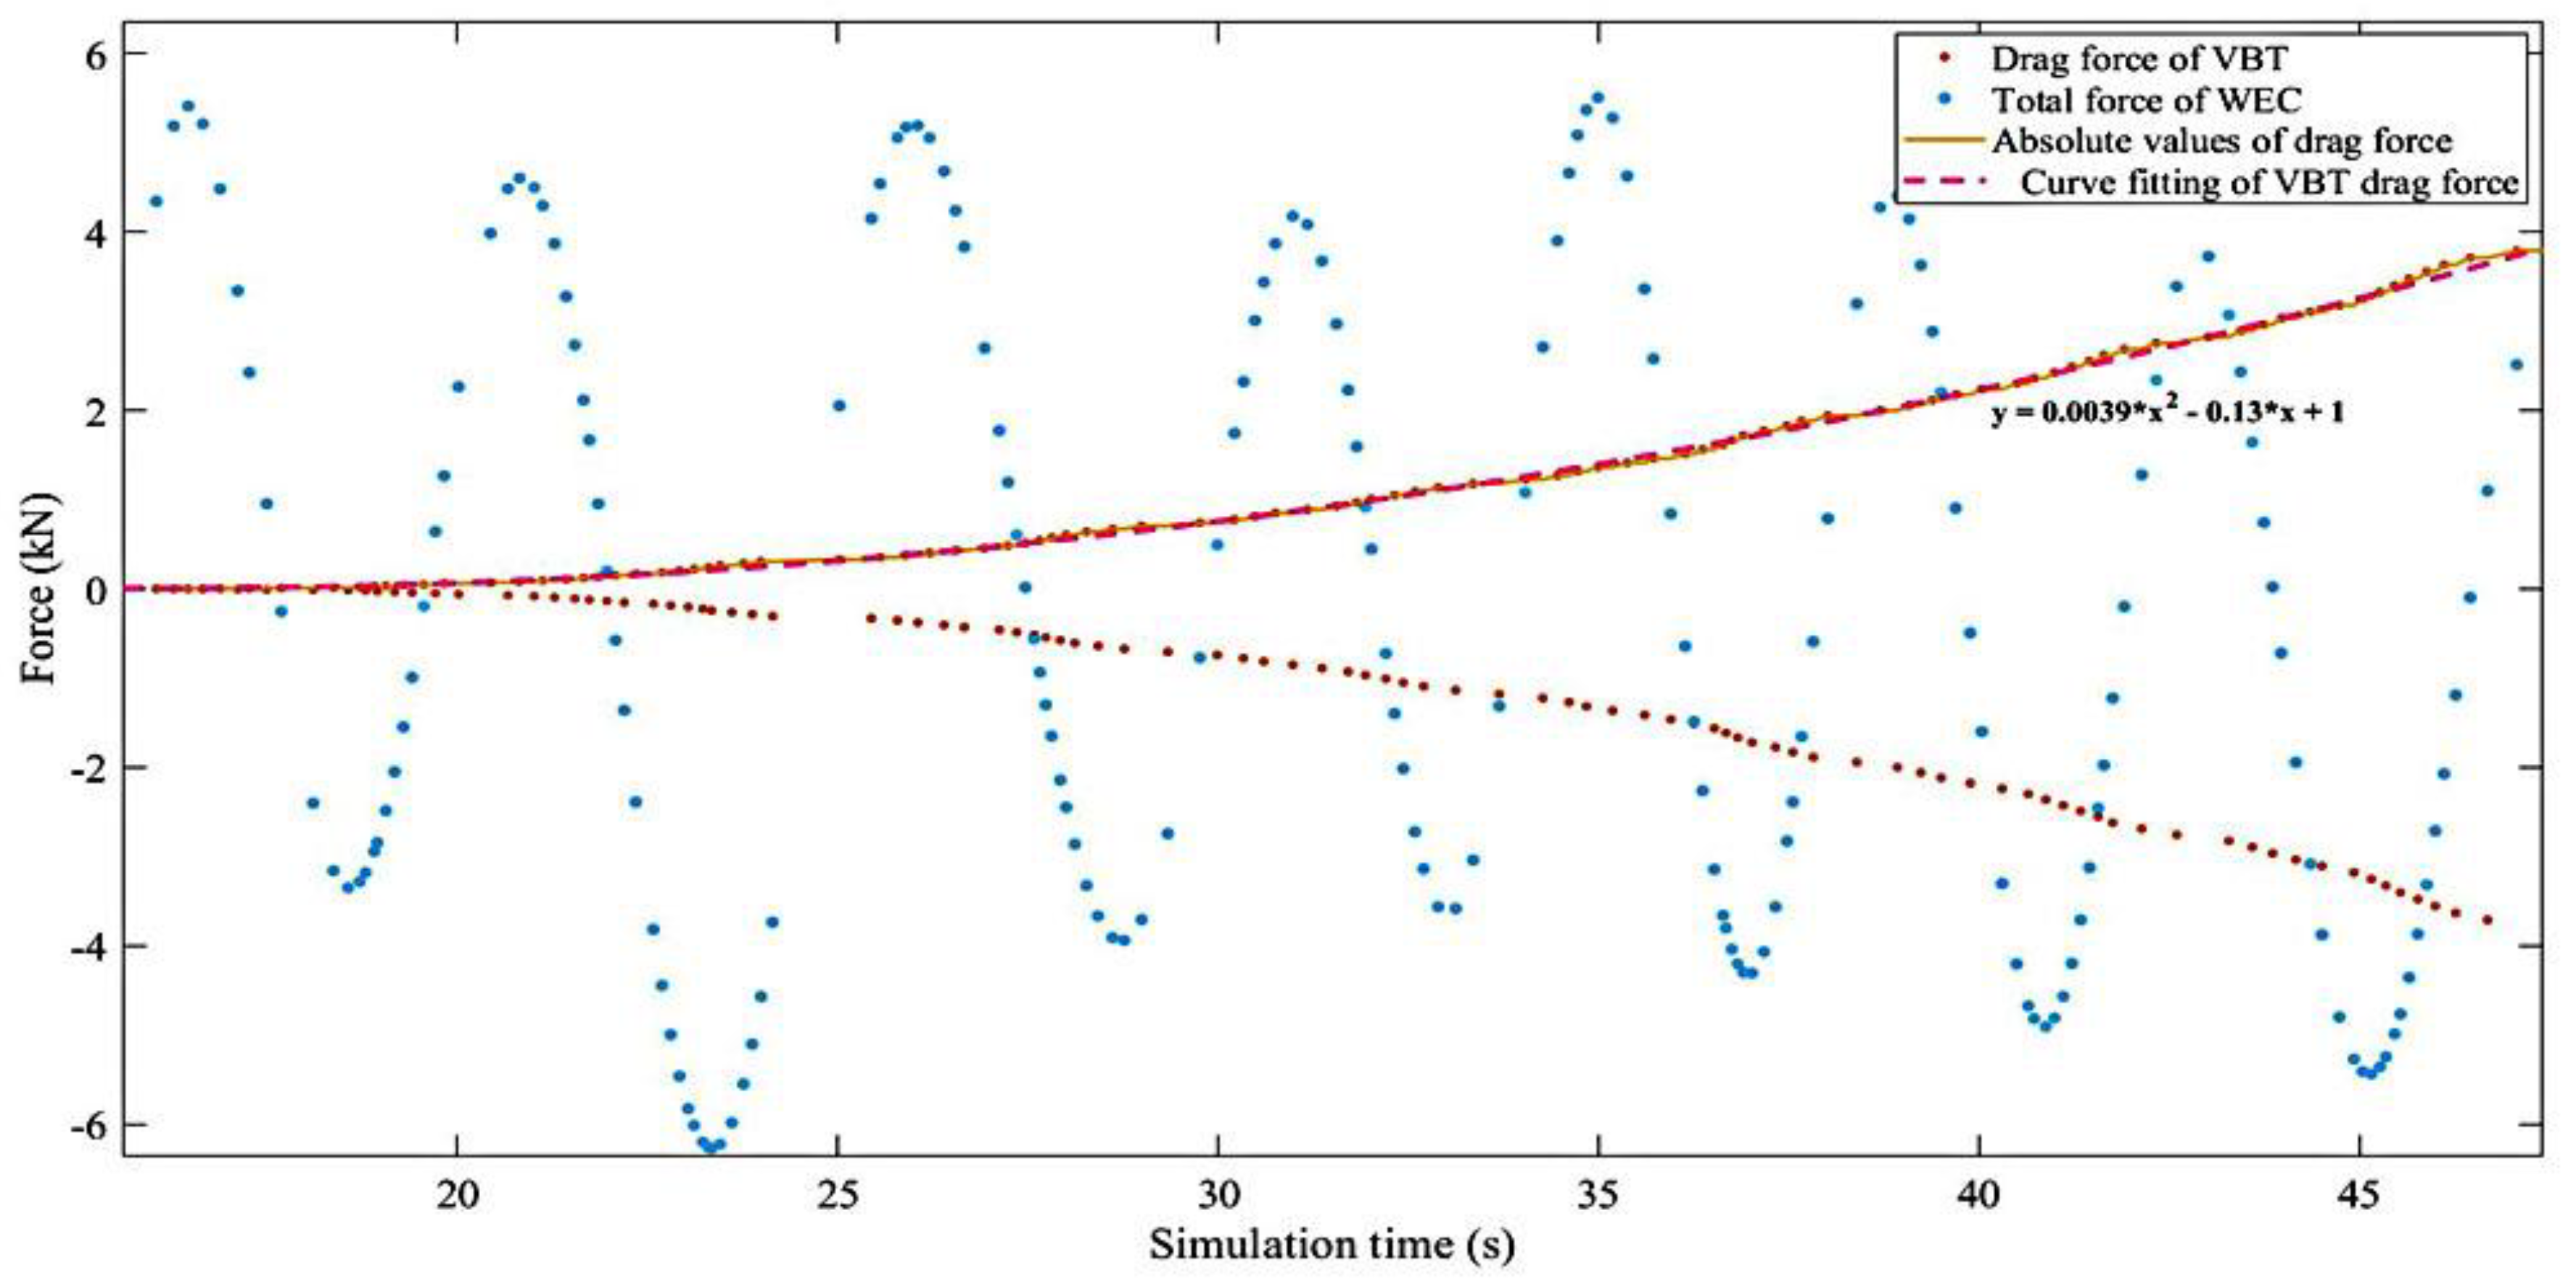
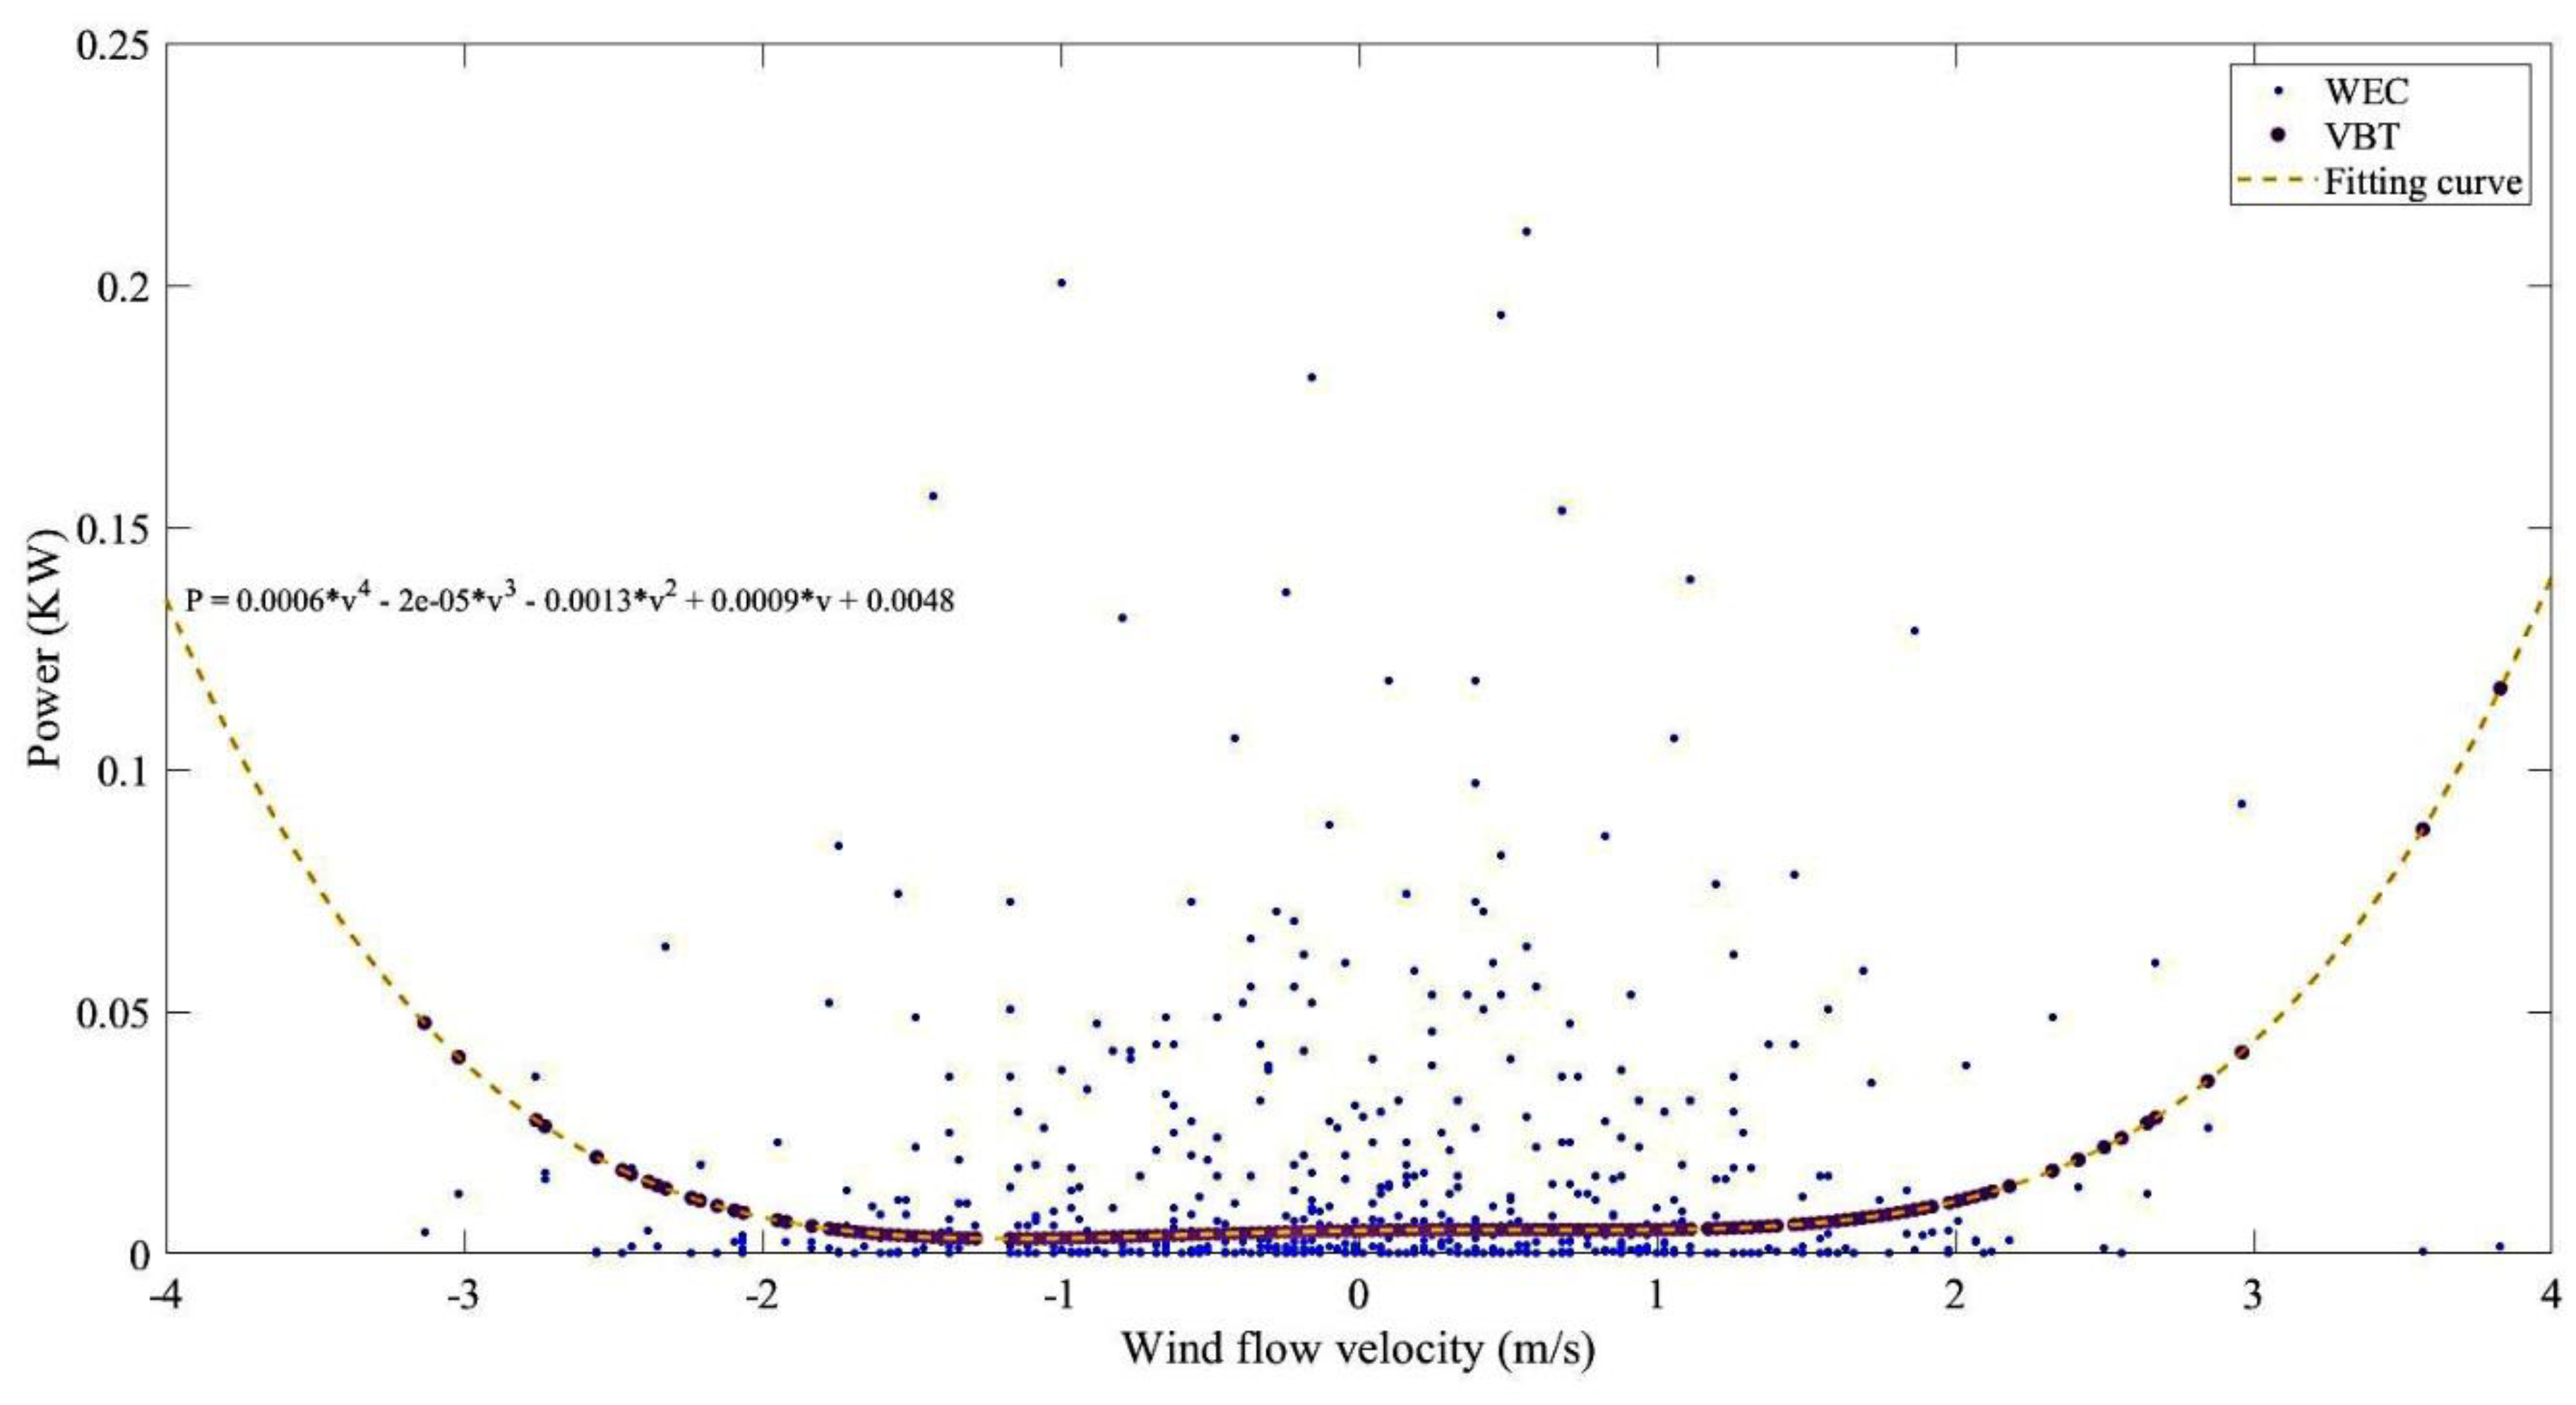
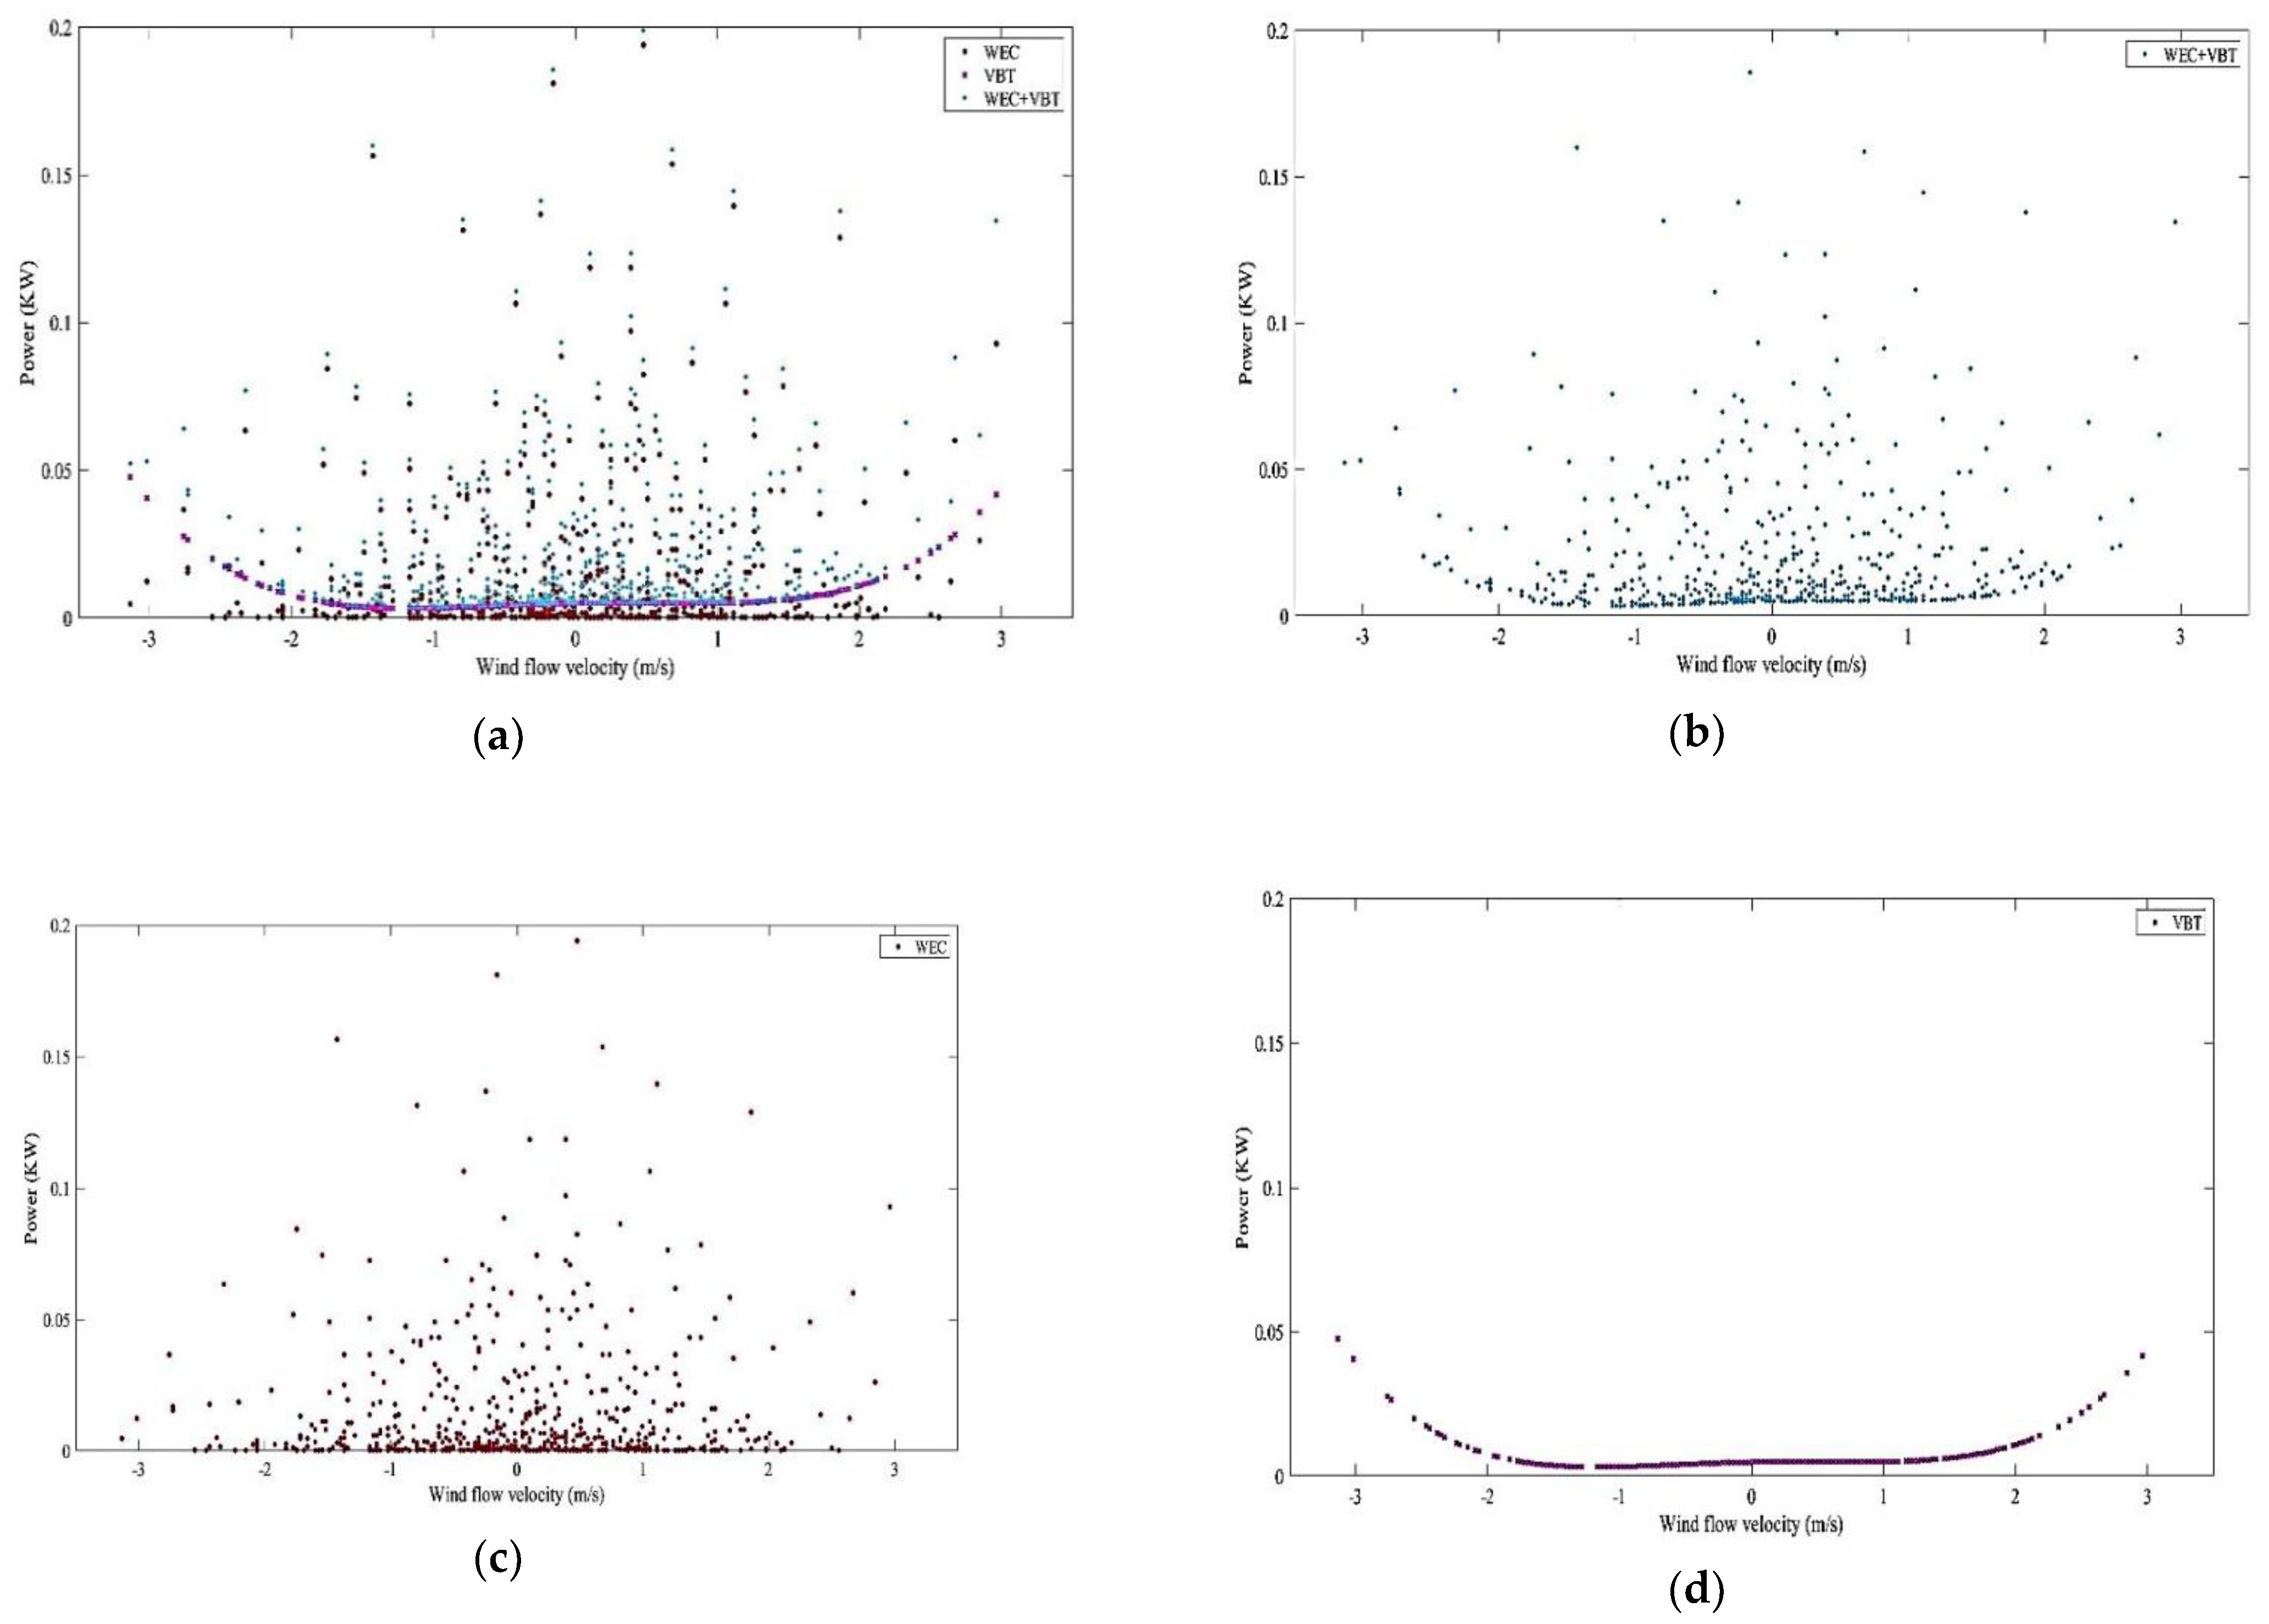
3.3. Comparison between WEC and BWT

Another purpose of this study is to conduct analyses in order to select the best energy system from VBT and WEC in specific locations with proposed geographical conditions. Analyses include measuring the amount of applied force to each system and their output electrical power. Figure 6 compares the force from the waves with the WEC and the ocean airflow with the VBT.
Figure 6 shows the diagram of drag force from the airflow to the moving part of the VBT and the total force on the Searaser during the simulation time. Moreover, by fitting the curves of both graphs, the force on each system can be estimated separately. The drag force can be introduced as a quadratic function (Equation (5)), but the exerted force on the Searaser can be the summation of five sine functions (Equation (6)). Equations (5) and (6) represent the equation obtained from the curve fitting.
y = 0.0039 x 2 0.13 x + 1
f ( x ) = a 1 sin ( b 1 x + c 1 ) + a 2 sin ( b 2 x + c 2 ) + a 3 sin ( b 3 x + c 3 ) + a 4 sin ( b 4 x + c 4 ) + a 5 sin ( b 5 x + c 5 )
Different parameters of Equation (6) are shown in Table 3.
Another investigation is to find the related mathematical equations of the proposed RES-produced power. Figure 7 presents the generated electrical power in each RES, respectively.
Moreover, Figure 7 shows the electrical power of each system with respect to energy conversion. For this diagram, curve fitting was performed to provide relationships to estimate their production power in terms of wind speed. The difference between the two diagrams in Figure 6 is due to the nature of the points drawn in the figure, no relation can be introduced to Searser’s productivity. Equation (7) presents the produced power of VBT.
P = 0.0006 v 4 0.00002 v 3 0.0013 v 2 + 0.0009 v + 0.0048

3.4. Total Energy of HBWTWEC

Another important goal of this study is to obtain the total produced power in an HBWTWEC. Due to the nature of the generated electrical power of Searaser in terms of wind speed, a definite mathematical equation cannot be provided. Figure 8 shows the production capacity for each system, as well as the total produced power of HBWTWEC in a considered location.
This diagram helps to estimate the desired values completely, which can be used in order to construct a hybrid site according to the wind speed from upstream of the ocean (Figure 8a). Due to the scatter values of Searaser-produced power (Figure 8c), when it is summed by the VBT-produced power (Figure 8d), which has a specific equation (Figure 8b), it cannot be introduced as an obvious mathematical equation for modeling. For having a comparison between two RESs, it can be noticed that the highest value of power belongs to the Searaser. On the other hand, the minimum order of produced power is related to the VBT. For the future research, exploring the applications of the metaheuristics and further deep learning e.g., [47,48,49] methods are proposed.

4. Conclusions

In this study, HBWTWEC simulations consisting of ten VBTs and ten Searasers during the FETCH experiment are performed by Flow-3D software. Partial climate change models are used to simulate the region’s local climate as an input of mathematical solution of governing equations. Then, not only the force on each system and the produced power are calculated separately but, also, they are compared to select the most suitable one according to the weather conditions of the selected region. The maximum and minimum values of the produced power belong to the Searaser and VBT, respectively. One of this study’s most significant achievements is introducing a mathematical equation for two essential variables: the exerted force and produced power of introduced systems. These are measured by best fitting the output graphs from the numerical simulations. The drag force, which is exerted by the wind blowing across the VBT, is introduced as a quadratic function, and the total exerted force from the ocean’s waves on Searaser is modeled as a summation of five sinusoidal functions. However, there has not been any known function for the produced power of HBWTWEC due to the scattered nature of Searaser’s output power. Since the most important issue in the hybrid site development is the estimation of produced power by RESs installed in that area, high-precision algorithms must be evaluated in order to introduce the best of them. The most accurate algorithm can be introduced as LSTM. However, RNN is another accurate algorithm, but related to the significant goal of the study, the most accurate one is presented. These key predictions in the hybrid site’s industry include the two parts of measuring the forces exerting on systems and their produced power, which are carried out by methods based on ML. Due to the instability of this type of system, ML methods are used because the input of these systems are the weather conditions in the selected region. Due to their dependence on climate change, they have variable values and are not steady parameters. The utilized methods, like other extensive studies in estimating the produced power of RESs, have a reliable assessment of the stability. The most noticeable limitation of this study is the uncertainty of the VBT results. It is the most novel type of wind turbine, and its commercial versions are not used yet. So, the results are compared with the demo version. Furthermore, numerical solution and ML prediction are performed for comparison; in future studies, we will provide methods in order to estimate a produced power for the next few years as a climate change modeling.

Author Contributions

M.D.M., M.S. and A.M.—conceptualization; M.D.M., M.M. and M.S.—simulation; M.D.M., M.M. and A.M.—methodology; M.M. and A.M.—software; M.D.M., L.K., A.M. and M.S.—supervision; M.D.M., A.M. and L.K.—writing and review; M.M., M.S., A.M. and L.K.—administration; A.M.—funding acquisition. All authors have read and agreed to the published version of the manuscript.

Funding

The project no. 2019–1.3.1-KK-2019-00007 was implemented with support from the National Research, Development and Innovation Fund of Hungary, financed under the 2019–1.2.1-KK funding scheme. L.K. was supported in addition by the Eötvös Lóránd Research Network Secretariat under grant agreement no. ELKH KÖ-40-2020 (Development of cyber-medical systems based on AI and hybrid cloud methods).

Data Availability Statement

The data is available through the corresponding author.

Acknowledgments

Amir Mosavi wishes to acknowledge the support of H2020, the European Union’s Horizon 2020 Research and Innovation Programme under the Programme SASPRO 2 COFUND Marie Sklodowska-Curie grant agreement No. 945478.

Conflicts of Interest

The authors declare that they have no known competing financial interests or personal relationships that could have appeared to influence the work reported in this paper.

Abbreviations

AbbreviationsDescription
ACCAccuracy
AIArtificial intelligence
ANNArtificial neural network
CFDComputational fluid dynamics
CO2Carbon dioxide
FPRFalse positive rate
HBWTWECHybrid site of the bladeless wind turbine and the wave energy converter
IOTInternet of things
LSTMLong-short term memory
MAEMean absolute error
MLMachine learning
PPVPositive predictive value
RESsRenewable energy systems
RMSERoot mean squared error
RNNsRecurrent neural network
ROCReceiver operating characteristic
SVMSupported vector machine
TNRTrue negative rate
TPRTrue positive rate
VBTVortex bladeless turbine

References

  1. Chakraborty, S.; Dwivedi, P.; Gupta, R.; Das, S. An Overview of Ocean Energy Policies Across the World. Water Energy Int. 2021, 64, 38–46. [Google Scholar]
  2. Zandalinas, S.I.; Fritschi, F.B.; Mittler, R. Global warming, climate change, and environmental pollution: Recipe for a multifactorial stress combination disaster. Trends Plant Sci. 2021, 26, 588–599. [Google Scholar] [CrossRef] [PubMed]
  3. Dincer, I.; Rosen, M.A. Exergy: Energy, Environment and Sustainable Development, 3rd ed.; Elsevier: Oxford, UK, 2021. [Google Scholar]
  4. Olabi, A.G.; Abdelkareem, M.A. Renewable energy and climate change. Renew. Sustain. Energy Rev. 2022, 158, 112111. [Google Scholar] [CrossRef]
  5. Gernaat, D.E.; de Boer, H.S.; Daioglou, V.; Yalew, S.G.; Müller, C.; van Vuuren, D.P. Climate change impacts on renewable energy supply. Nat. Clim. Change 2021, 11, 119–125. [Google Scholar] [CrossRef]
  6. Fell, H.; Gilbert, A.; Jenkins, J.D.; Mildenberger, M. Nuclear power and renewable energy are both associated with national decarbonization. Nat. Energy 2022, 7, 25–29. [Google Scholar] [CrossRef]
  7. Rony, J.S.; Karmakar, D. Coupled Dynamic Analysis of Hybrid Offshore Wind Turbine and Wave Energy Converter. J. Offshore Mech. Arct. Eng. 2022, 144, 032002. [Google Scholar] [CrossRef]
  8. Si, Y.; Chen, Z.; Zeng, W.; Sun, J.; Zhang, D.; Ma, X.; Qian, P. The influence of power-take-off control on the dynamic response and power output of combined semi-submersible floating wind turbine and point-absorber wave energy converters. Ocean Eng. 2021, 227, 108835. [Google Scholar] [CrossRef]
  9. Skene, D.M.; Sergiienko, N.; Ding, B.; Cazzolato, B. The Prospect of Combining a Point Absorber Wave Energy Converter with a Floating Offshore Wind Turbine. Energies 2021, 14, 7385. [Google Scholar] [CrossRef]
  10. Cheng, Z.; Wen, T.R.; Ong, M.C.; Wang, K. Power performance and dynamic responses of a combined floating vertical axis wind turbine and wave energy converter concept. Energy 2019, 171, 190–204. [Google Scholar] [CrossRef]
  11. Dong, C.; Huang, G.G.; Cheng, G. Offshore wind can power Canada. Energy 2021, 236, 121422. [Google Scholar] [CrossRef]
  12. Dehghani-Sanij, A.R.; Al-Haq, A.; Bastian, J.; Luehr, G.; Nathwani, J.; Dusseault, M.B.; Leonenko, Y. Assessment of current developments and future prospects of wind energy in Canada. Sustain. Energy Technol. Assess. 2022, 50, 101819. [Google Scholar] [CrossRef]
  13. Robertson, B.; Dunkle, G.; Gadasi, J.; Garcia-Medina, G.; Yang, Z. Holistic marine energy resource assessments: A wave and offshore wind perspective of metocean conditions. Renew. Energy 2021, 170, 286–301. [Google Scholar] [CrossRef]
  14. Sadorsky, P. Wind energy for sustainable development: Driving factors and future outlook. J. Clean. Prod. 2021, 289, 125779. [Google Scholar] [CrossRef]
  15. Latif, A.; Hussain, S.S.; Das, D.C.; Ustun, T.S. Double stage controller optimization for load frequency stabilization in hybrid wind-ocean wave energy based maritime microgrid system. Appl. Energy 2021, 282, 116171. [Google Scholar] [CrossRef]
  16. Dawoud, S.M. Developing different hybrid renewable sources of residential loads as a reliable method to realize energy sustainability. Alex. Eng. J. 2021, 60, 2435–2445. [Google Scholar] [CrossRef]
  17. Ammari, C.; Belatrache, D.; Touhami, B.; Makhloufi, S. Sizing, optimization, control and energy management of hybrid renewable energy system—A review. Energy Built Environ. 2021, 3, 399–411. [Google Scholar] [CrossRef]
  18. Luderer, G.; Madeddu, S.; Merfort, L.; Ueckerdt, F.; Pehl, M.; Pietzcker, R.; Rottoli, M.; Schreyer, F.; Bauer, N.; Baumstark, L.; et al. Impact of declining renewable energy costs on electrification in low-emission scenarios. Nat. Energy 2022, 7, 32–42. [Google Scholar] [CrossRef]
  19. Curto, D.; Franzitta, V.; Guercio, A. Sea Wave Energy. A Review of the Current Technologies and Perspectives. Energies 2021, 14, 6604. [Google Scholar] [CrossRef]
  20. Rodrigues, C.; Ramos, M.; Esteves, R.; Correia, J.; Clemente, D.; Gonçalves, F.; Mathias, N.; Gomes, M.; Silva, J.; Duarte, C.; et al. Integrated study of triboelectric nanogenerator for ocean wave energy harvesting: Performance assessment in realistic sea conditions. Nano Energy 2021, 84, 105890. [Google Scholar] [CrossRef]
  21. Choupin, O.; Andutta, F.P.; Etemad-Shahidi, A.; Tomlinson, R. A decision-making process for wave energy converter and location pairing. Renew. Sustain. Energy Rev. 2021, 147, 111225. [Google Scholar] [CrossRef]
  22. Band, S.S.; Ardabili, S.; Mosavi, A.; Jun, C.; Khoshkam, H.; Moslehpour, M. Feasibility of soft computing techniques for estimating the long-term mean monthly wind speed. Energy Rep. 2022, 8, 638–648. [Google Scholar] [CrossRef]
  23. Luo, H.; Cao, S.; Lu, V.L. The techno-economic feasibility of a coastal zero-energy hotel building supported by the hybrid wind-wave energy system. Sustain. Energy Grids Netw. 2022, 30, 100650. [Google Scholar] [CrossRef]
  24. Kamarlouei, M.; Gaspar, J.F.; Calvario, M.; Hallak, T.S.; Mendes, M.J.; Thiebaut, F.; Soares, C.G. Experimental study of wave energy converter arrays adapted to a semi-submersible wind platform. Renew. Energy 2022, 188, 145–163. [Google Scholar] [CrossRef]
  25. Wang, B.; Deng, Z.; Zhang, B. Simulation of a novel wind–wave hybrid power generation system with hydraulic transmission. Energy 2022, 238, 121833. [Google Scholar] [CrossRef]
  26. Chennaif, M.; Maaouane, M.; Zahboune, H.; Elhafyani, M.; Zouggar, S. Tri-objective techno-economic sizing optimization of Off-grid and On-grid renewable energy systems using Electric system Cascade Extended analysis and system Advisor Model. Appl. Energy 2022, 305, 117844. [Google Scholar] [CrossRef]
  27. Akorede, M.F. Design and performance analysis of off-grid hybrid renewable energy systems. In Hybrid Technologies for Power Generation; Academic Press: Cambridge, MA, USA, 2022; pp. 35–68. [Google Scholar]
  28. Pravin, P.S.; Luo, Z.; Li, L.; Wang, X. Learning-based Scheduling of Industrial Hybrid Renewable Energy Systems. Comput. Chem. Eng. 2022, 159, 107665. [Google Scholar] [CrossRef]
  29. Jahangir, M.H.; Shahsavari, A.; Rad, M.A. Feasibility study of a zero emission PV/Wind turbine/Wave energy converter hybrid system for stand-alone power supply: A case study. J. Clean. Prod. 2020, 262, 121250. [Google Scholar] [CrossRef]
  30. Zhou, Y.; Ning, D.; Shi, W.; Johanning, L.; Liang, D. Hydrodynamic investigation on an OWC wave energy converter integrated into an offshore wind turbine monopile. Coast. Eng. 2020, 162, 103731. [Google Scholar] [CrossRef]
  31. Aazami, R.; Heydari, O.; Tavoosi, J.; Shirkhani, M.; Mohammadzadeh, A. Optimal Control of an Energy-Storage System in a Microgrid for Reducing Wind-Power Fluctuations. Sustainability 2022, 14, 6183. [Google Scholar] [CrossRef]
  32. Weerakoon, A.S.; Kim, B.H.; Cho, Y.J.; Prasad, D.D.; Ahmed, M.R.; Lee, Y.H. Design optimization of a novel vertical augmentation channel housing a cross-flow turbine and performance evaluation as a wave energy converter. Renew. Energy 2021, 180, 1300–1314. [Google Scholar] [CrossRef]
  33. Chaurasia, K.; Kamath, H.R. Artificial Intelligence and Machine Learning Based: Advances in Demand-Side Response of Renewable Energy-Integrated Smart Grid. In Smart Systems: Innovations in Computing; Springer: Singapore, 2022; pp. 195–207. [Google Scholar]
  34. Musbah, H.; Ali, G.; Aly, H.H.; Little, T.A. Energy management using multi-criteria decision making and machine learning classification algorithms for intelligent system. Electr. Power Syst. Res. 2022, 203, 107645. [Google Scholar] [CrossRef]
  35. Hernandez, D.; Denis, Y. Energy Management System Industrialization for Off-Grids Power Systems Based on Data-Driven Machine Learning Models. Available online: https://ssrn.com/abstract=4003926 (accessed on 17 June 2021).
  36. Patel, A.; Swathika, O.V.; Subramaniam, U.; Babu, T.S.; Tripathi, A.; Nag, S.; Karthick, A.; Muhibbullah, M. A Practical Approach for Predicting Power in a Small-Scale Off-Grid Photovoltaic System using Machine Learning Algorithms. Int. J. Photoenergy 2022, 2022, 9194537. [Google Scholar] [CrossRef]
  37. Abualigah, L.; Zitar, R.A.; Almotairi, K.H.; Hussein, A.M.; Abd Elaziz, M.; Nikoo, M.R.; Gandomi, A.H. Wind, Solar, and Photovoltaic Renewable Energy Systems with and without Energy Storage Optimization: A Survey of Advanced Machine Learning and Deep Learning Techniques. Energies 2022, 15, 578. [Google Scholar] [CrossRef]
  38. Buster, G.; Bannister, M.; Habte, A.; Hettinger, D.; Maclaurin, G.; Rossol, M.; Sengupta, M.; Xie, Y. Physics-guided machine learning for improved accuracy of the National Solar Radiation Database. Sol. Energy 2022, 232, 483–492. [Google Scholar] [CrossRef]
  39. Zou, S.; Zhou, X.; Khan, I.; Weaver, W.W.; Rahman, S. Optimization of the electricity generation of a wave energy converter using deep reinforcement learning. Ocean Eng. 2022, 244, 110363. [Google Scholar] [CrossRef]
  40. Al-Othman, A.; Tawalbeh, M.; Martis, R.; Dhou, S.; Orhan, M.; Qasim, M.; Olabi, A.G. Artificial intelligence and numerical models in hybrid renewable energy systems with fuel cells: Advances and prospects. Energy Convers. Manag. 2022, 253, 115154. [Google Scholar] [CrossRef]
  41. Mousavi, S.M.; Ghasemi, M.; Dehghan Manshadi, M.; Mosavi, A. Deep learning for wave energy converter modeling using long short-term memory. Mathematics 2021, 9, 871. [Google Scholar] [CrossRef]
  42. Dehghan Manshadi, M.; Ghassemi, M.; Mousavi, S.M.; Mosavi, A.H.; Kovacs, L. Predicting the Parameters of Vortex Bladeless Wind Turbine Using Deep Learning Method of Long Short-Term Memory. Energies 2021, 14, 4867. [Google Scholar] [CrossRef]
  43. He, J. Coherence and cross-spectral density matrix analysis of random wind and wave in deep water. Ocean Eng. 2020, 197, 106930. [Google Scholar] [CrossRef]
  44. Eltohamy, I. Effect of Vertical Screen on Energy Dissipation and Water Surface Profile Using Flow 3D. Egypt. Int. J. Eng. Sci. Technol. 2022, 38, 20–25. [Google Scholar]
  45. Narasimhan, A. Support Vector Machine Based Forecasting for Renewable Energy Systems. In Renewable Energy Optimization, Planning and Control 2022; Springer: Singapore, 2022; pp. 149–157. [Google Scholar]
  46. Babajani, A. Hydrodynamic performance of a novel ocean wave energy converter. Am. J. Fluid Dyn. 2018, 8, 73–83. [Google Scholar]
  47. Farah, S.; Humaira, N.; Aneela, Z.; Steffen, E. Short-term multi-hour ahead country-wide wind power prediction for Germany using gated recurrent unit deep learning. Renew. Sustain. Energy Rev. 2022, 167, 112700. [Google Scholar] [CrossRef]
  48. Neshat, M.; Nezhad, M.M.; Abbasnejad, E.; Mirjalili, S.; Groppi, D.; Heydari, A.; Wagner, M. Wind turbine power output prediction using a new hybrid neuro-evolutionary method. Energy 2021, 229, 120617. [Google Scholar] [CrossRef]
  49. Lu, P.; Ye, L.; Zhao, Y.; Dai, B.; Pei, M.; Tang, Y. Review of meta-heuristic algorithms for wind power prediction: Methodologies, applications and challenges. Appl. Energy 2021, 301, 117446. [Google Scholar] [CrossRef]
Figure 1. Overview of the proposed study.
Energies 15 09484 g001
Figure 2. Validation of recent work with the former study.
Energies 15 09484 g002
Figure 3. Forces over 50 s of simulation for (a) VBT and (b) WEC.
Energies 15 09484 g003
Figure 4. Power produced over 50 s of simulation for (a) VBT and (b) WEC.
Energies 15 09484 g004
Figure 5. ROC curve (a) and confusion matrix (b) of different utilized algorithms in predicting VBT and WEC values.
Energies 15 09484 g005aEnergies 15 09484 g005b
Figure 6. Drag and total force exerted on a VBT.
Energies 15 09484 g006
Figure 7. Generated power of WEC and VBT by the curve fitting.
Energies 15 09484 g007
Figure 8. (a) Illustration of the energy generated by WEC and VBT, individually and combined: (b) Combined generated power of VBT and WEC (c) Generated power of WEC (d) Generated power of VBT.
Energies 15 09484 g008
Table 1. Recent studies on hybrid RES sites by combining wave energy converter and wind turbine.
AuthorsConceptYearMethodDescription
1Mohammad Hossein Jahangir, et al. [29]Zero-emission PV/Wind turbine/Wave energy converter2020A techno-economic and environmental analysis for a hybrid renewable energy systemFeasibility study of wave energy hybridization with solar, wind, and storage systems
2Yu Zhou, et al. [30]Wave energy converter integrated monopile2020Hydrodynamic investigation of hybrid renewable energy systemsThe hydrodynamic efficiency of the OWC device decreases with the wave nonlinearity
3Yulin Si, et al. [31]Semi-submersible floating wind turbine and point-absorber wave energy converter2021Power take-off controls are implemented for hybrid renewable energy systemA novel hybrid floating wind and wave power generation platform is proposed
4A.H. SamithaWeerakoon, et al. [32]Vertical augmentation crossflow turbine2021ANSYS-CFX optimized and evaluated both experimentally and computationally.A novel vertical augmentation channel, with nozzles on both sides of the turbine, was designed, and an optimized configuration was obtained and evaluated as a wave energy converter.
Table 2. Evaluation of machine learning parameters.
ParameterMethodTNRPPVTPRFPRACCRMSEMAE
WEC ForceRNN0.9500.9510.9240.0500.93732.0570.066
LSTM0.9780.9800.9420.0220.95916.4220.064
SVM0.9800.9810.9030.0200.93825.8740.069
RF0.9130.9180.8740.0870.89231.9840.067
BWT ForceRNN0.9600.9610.9330.0400.94624.8850.032
LSTM0.9800.9800.9160.0200.94637.5260.068
SVM0.9660.9690.8960.0340.92815.4250.071
RF0.9510.9500.9410.0490.94627.3440.036
WEC PowerRNN0.9590.9600.9410.0410.95015.5350.032
LSTM0.9700.9700.9060.0300.93616.4220.064
SVM0.9780.9790.9010.0220.93715.8740.069
RF0.9870.9880.8980.0130.93931.9840.067
BWT PowerRNN0.9420.9420.9150.0580.92824.8850.032
LSTM0.9610.9610.9070.0390.93337.5230.068
SVM0.9680.9690.9310.0320.94915.4200.071
RF0.9820.9830.8970.0180.93727.3400.036
Table 3. Values of curve fitting parameters related to Equation (6).
ParameterValue
a13921
a22063
a31585
a42061
a51779
b11.418
b21.255
b30.9509
b41.643
b50.8553
c12.8888
c2−0.2617
c39.099
c40.2676
c52.915
Publisher’s Note: MDPI stays neutral with regard to jurisdictional claims in published maps and institutional affiliations.

