Abstract
A hydrodynamic wind–wave combined power generation system is a new type of energy device that uses wind and ocean current energy to generate electricity. In this paper, the hydrodynamics of a wind–wave combined power generation system was simulated in Fluent. The fluid–structure coupling simulation of the vortex vibration of the cylindrical oscillator was realized using UDF and dynamic mesh technology. The Vortex-Induced Vibration (VIV) characteristics of the cylindrical oscillator were analyzed, and the reliability of the numerical simulation method was verified by comparing the amplitude and trajectory of the eddy-excited vibration with the classic experiments of Jauvtis and Williamson. The VIV characteristics of cylindrical oscillators with different mass ratios were studied in terms of vibration response, motion trajectory, and the streamwise equilibrium position. The effect of the mass ratio on the hydrodynamics of a wind–wave combined power generation system was simulated using spring damping, achieving the goal of carrying out preliminary research work simulating the wind–wave combined power generation device. Some useful conclusions were obtained through calculation, which provided data support for the corresponding platform device. This study shows that in cylindrical oscillators with different mass ratios, the overall trend at the same reduced velocity is that the larger the mass ratio, the smaller the crossflow amplitude. The cylindrical oscillators with mass ratios of one and two appear in the upper branch, while cylindrical oscillators with mass ratios of three and four do not appear, and with the increase in the mass ratio, the frequency ratio in the lower branch tends toward one. At the same reduced velocity, the lower the mass ratio, the larger the corresponding downstream equilibrium position, and the higher the energy acquisition efficiency.
1. Introduction
Marine renewable energy sources mainly include offshore wind, wave, and tidal energy. Among them, wind energy is generally regarded as the best alternative to fossil energy due to its abundant resources and the fact that it is renewable and does not produce greenhouse gases. Offshore wind energy resources are extremely abundant, and the large-scale development of offshore wind power is an important means to prevent and control air pollution. In addition, as a kind of renewable green energy, ocean current energy has the characteristics of high sustainability, high energy density, and abundant reserves, it has broad development prospects [1,2].
At present, the main types of equipment for the development of ocean current energy are the parachute type and magnetic flow type. However, this type of energy generation requires a high velocity, so it is difficult to apply it in waters with large water depths and low velocity. The use of vortex-induced vibration for power generation, which does not require high velocity and low cost, has become a research hotspot in the field of sea current energy generation in recent years [3]. At the same time, with the continuous construction of land-based wind farms, the limited development of land-based wind energy resources has become increasingly saturated. Offshore wind power generation is gradually being developed because of its unique advantages. Therefore, can the combination of the two power-generation devices produce more electricity for people to use?
Through this research, it was found that the wind–wave combined power generation system can take advantage of the volatility, intermittency, irregularity, and stability of offshore wind power, and wave energy is more stable compared to wind power [4]. Therefore, the combined power generation system of the two types of energy can reduce the number of hours it does not work, compared with a wind power system alone. The VIV power generation device can also absorb the wave energy near the offshore wind turbine platform, changing the local wave field, which can effectively protect the wind turbine from strong wave impacts under reasonable arrangement, reducing the fatigue of the wind power generation device, and increasing its service life.
The overall structure of a Spar-type floating wind turbine is a deep-draft slender cylinder, which mainly consists of two parts: a floating chamber and a ballast chamber [5]. The stability of this device is maintained by uniformly distributed mooring cables connected to the seabed, so this structure not only provides the wind turbine as a whole with a large recovery moment and high inertia resistance in both the transverse and longitudinal rocking directions, but also reduces the vertical swing motion, which greatly improves the floating wind turbine in terms of water anti-tilting stability. The research in this paper is mainly based on the wind–wave combined power generation system with a Spar-type wind turbine as the main structure. By installing a VIV power generation device on this device, both wind and wave energy can be utilized, and the cost can be reduced to improve the overall economic efficiency.
Based on the background described above, the first study was carried out to investigate the parametric influence of the VIV power generation device on the wind–wave combined power generation system (mainly the influence of the mass ratio on the energy gain efficiency of the device) as a prelude to the future study of the power generation efficiency of the wind–wave combined power generation system.
Cylindrical vortex-induced vibration is a complex fluid–solid coupling phenomenon involving fluid mechanics, vibration mechanics, structural mechanics, computational fluid mechanics, and other disciplines [6,7]. A vortex-induced vibration generator is an energy conversion device that captures the energy of sea currents by using the vortex vibration effect. When the water flows over the body vibration, under certain conditions, it will cause a body for VIV; this vibration can transform the mechanical energy of the current into the kinetic energy of the vibrating body, followed by the kinetic energy of the vibrator to the generator (generator stator and rotor). The conversion of kinetic energy of the vibrator into mechanical energy will then move the sub, cut the magnetic induction line, generate electricity, and then store the electricity.
The concept of Vortex-Induced Vibration for Aquatic Clean Energy (VIVACE) was first proposed by Professor Bernitsas’ team at the University of Michigan [8], and the experimental model of VIVACE was also developed by his team [9], and mainly consists of three parts: a cylindrical oscillator, a transmission, and a power generator.
Power generation can be divided into two types according to the different types of energy acquisition: piezoelectric and electromagnetic. The method of converting the mechanical energy of the cylindrical oscillator into electrical energy by the positive voltage effect of the piezoelectric polymer is called piezoelectric, and the representative devices include vertical moving cylindrical piezoelectric energy-harvesting devices and piezoelectric bluff body energy-harvesting devices. The method of converting the kinetic energy generated by the vibration of the vibrator into drive energy and driving the generator rotor to cut the magnetic field lines for energy conversion is called the electromagnetic type, and the representative device is the VIVACE device [10]. At present, the research on the piezoelectric VIV power generation device is still in the initial stages, mainly because of its low energy-acquisition efficiency, small energy-acquisition flow range, and poor energy-acquisition stability; meanwhile, the electromagnetic power generation device has greater energy acquisition, higher energy acquisition efficiency, and wider synchronous vibration range. Therefore, the electromagnetic power generation device is more suitable for practical engineering applications [8].
Many studies have been conducted to date on the parameterization of VIV generators, and some of them have been relatively well studied. There have also been some reviews discussing studies on the parameterization of vortex-induced vibration (e.g., Lin 2015; Huang 2007). Huang et al.’s study showed that when the mass ratio is greater than 3.5, there is little effect on the transverse amplitude, regardless of whether the flow direction motion is restricted, while the motion of two-way degrees of freedom can produce a larger transverse amplitude when the mass ratio is less than 3.5 [11]. Du et al. found that the mass ratio has a significant effect on the VIV of a double cylindrical structure connected in series, both with two degrees of freedom [12]. Bai and Chen found that with the gradual increase in the diameter ratio, the amplitude ratio of the columns of the series’ unequal-diameter cylindrical power generation system changes with the size of the columns; at the same time, the existence of a diameter ratio less than 0.7 makes the amplitude ratio of the large and small columns achieve the maximum value; when the spacing is relatively small, the change in the diameter ratio has a greater impact on the amplitude response [13]. Tan et al. found that under the analysis of energy utilization, in the upper part of the branch, the product of cylindrical oscillator amplitude and vibration frequency is the largest in the uniform flow motion, and its effective power is higher in uniform flow than in turbulent flow [14]. Khalak and Williamson found that under low mass and damping conditions, three corresponding branches exist, namely the initial branch (the 2S mode: two independent vortices are released per cycle), the upper branch (2P mode: a pair of vortices are released every half cycle), and the lower branch (also with 2P mode) [15]. Yang et al. found that with the increase in the mass ratio, the maximum amplitude in the transverse direction decreases at a small, reduced velocity. With the decrease in the mass ratio, the influence of the phase difference between the lift and the displacement on the amplitude of the downstream cylinder is more significant [16]. In addition, Han found that the downstream amplitudes of both rough and smooth cylindrical oscillators showed a trend of increasing and then decreasing. However, with the increase in the flow velocity, the smooth cylindrical oscillator no longer produces vortex resonance, and the amplitude and then the energy gain efficiency decrease rapidly; meanwhile, with the rough oscillator lift and motion direction, the vortex vibration moves into the galloping stage, and the amplitude is constantly rising [17]. Continuing research on the effect of the mass ratio on VIV can enrich this part, which is important for better promotion of clean and sustainable ocean energy in the future, and also has a deeper and broader significance for the development of new forms of power-generation devices.
The difference between this paper and previous work is that a parametric study was used for fluid–solid coupling and wind–wave combined power generation in this paper. In this study, the effect of the mass ratio on the hydrodynamics of the wind–wave combined power generation system of cylindrical oscillators was focused and analyzed using numerical simulations with the VIV energy acquisition efficiency formula. The reliability of the numerical simulation method is demonstrated by comparing it with the classic experiments of Jauvtis and Williamson in terms of response amplitude and motion trajectory, and the characteristics of cylindrical oscillators with different mass ratios in terms of VIV response, motion trajectory, motion frequency, and downstream equilibrium position are investigated.
2. Non-Dimensional Groups and Energy Acquisition Efficiency
Figure 1 shows the wind–wave combined power generation system with a Spar-type wind turbine as the main structure.
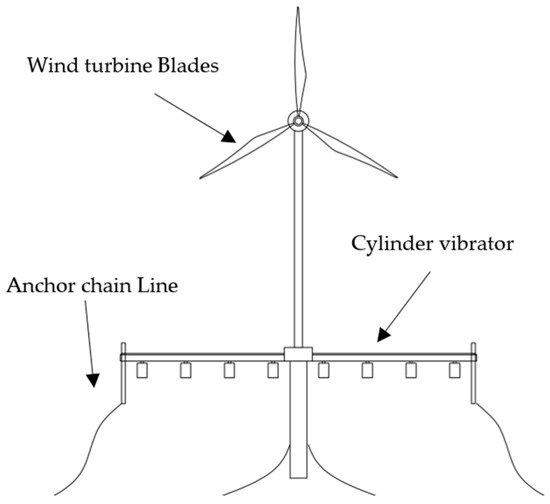
Figure 1.
The Hydrodynamics of a Wind–Wave Combined Power Generation System.
The relevant parameters involved are as follows:
In this formula, U is the incoming flow velocity; D is the diameter of the cylindrical oscillator; ρ is the density of the fluid; μ is the fluid dynamic coefficient; and ν is the fluid kinematic viscosity coefficient.
In this formula, is the vortex shedding frequency; U is the incoming flow velocity; and D is the diameter of the cylindrical oscillator.
In this formula, m is the mass of the cylindrical oscillator per unit length; ρ is the density of the fluid; and D is the diameter of the cylindrical oscillator. The is the ratio of the mass of the cylindrical oscillator to the mass of the fluid displaced.
In this formula, U is the incoming flow velocity; is the natural frequency of the vibration system; and D is the diameter of the cylindrical oscillator. The is the ratio of the length of water flowing through a self-oscillation cycle of the structure in the water to the characteristic size of the cylindrical oscillator.
In the formula: is the amplitude; D is the diameter of the cylindrical oscillator; is the maximum amplitude, and is the minimum amplitude. Among them, the is the ratio of the amplitude of the cylindrical oscillator to the diameter of the cylindrical oscillator.
The energy conversion efficiency ƞ is dimensionless, which is defined as the ratio of captured energy to the fluid energy [13].
In this formula, is the energy of a VIV cylinder in a unit period; is a uniform flow of energy over a period; is the system damping coefficient; is the angular frequency; and and are the amplitudes in the corresponding direction of the cylinder.
Through the derivation of the equation, the energy acquisition efficiency formula of VIV can be finally obtained as follows:
In this formula, is the fluid-added mass coefficient of the cylinder, and is the system damping ratio coefficient.
Through analysis, we can show that the main parameters affecting the energy conversion efficiency are the mass ratio, Strouhal number, dimensionless displacements x and y, and the damping ratio coefficient, which are all proportional to the energy conversion efficiency [14,18]. Meanwhile, the energy conversion efficiency is inversely proportional to the deceleration rate. To address the issue of parameters affecting the energy conversion rate, this paper mainly compares the effects of different mass ratios on VIV.
3. Numerical Model of Vortex-Induced Vibration
Fluent software and UDF programming are used to simulate the flow field around the cylindrical oscillator, simplify the experimental model of the VIV generator, and combine the dynamic mesh technology to realize the fluid–structure coupling of the cylindrical oscillator of the vortex-induced vibration power generation device.
In this paper, the experimental model of the vortex-induced vibration generator is simplified into the following physical model, as shown in Figure 2.
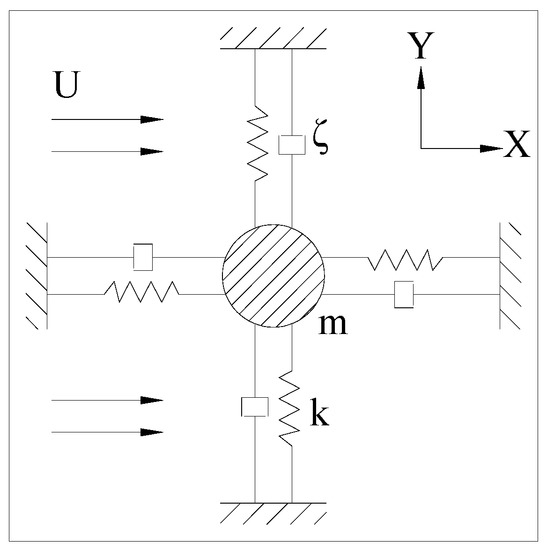
Figure 2.
Vortex-induced vibration model of cylindrical vibrator.
The SST k-ω model used in the numerical simulations in this paper belongs to the Reynolds averaging method. The SST k-ω model has good results in both near-wall and far-field calculations. Compared with the standard k-ω model, the SST k-ω model takes into account the shear stress transport mode, changes the turbulence constant in the model, and performs better in solving the negative pressure gradient in turbulent flow problems. The above features give the SST k-ω model a wider range of applications.
The SST k-ω equation is:
In these equations, and are the effective diffusion terms of and ; is the turbulent kinetic energy generation terms of ; is the generic term of ; is the dissipation terms of ; is the dissipation term of ; is the cross-diffusion term; and and are the custom source terms.
After the mass force is omitted, the N-S equation can be simplified as follows:
In these formulas, are the instantaneous values of velocity and pressure, respectively.
In uniform flow, the governing equation of cylindrical vortex-induced motion is
In these formulas, is the time; is the mass; and are the damping coefficients of the forward and crossflow motions, respectively, where is the damping ratio; and are the system stiffnesses in the forward and crossflow directions, respectively; and are the forward-flow directions, and crossflow VIV displacement, respectively; is resistance; and is lift.
In Jauvtis and Williamson’s experiment, the cylindrical oscillator has a mass ratio of 2.6, the intrinsic frequency = 0.4 Hz, and the reduced velocity ranges from 2.2 to 13.5 [8]. Therefore, the working conditions shown in Table 1 were chosen.

Table 1.
Data table of calculation conditions.
4. Computational Domain and Numerical Simulation Reliability Verification
4.1. Computational Domain
In this paper, we ignore the subsidiary structures of the vortex-excited vibration power generator in the numerical simulation and only investigate the cylindrical oscillator.
Figure 3 and Figure 4, for the two-dimensional cylindrical oscillator vortex-induced vibration of the schematic diagram and the flow field grid computing area, respectively, show a cylindrical stator D = 0.1 m diameter, an area calculation of 20 D × 40 D, a speed entrance D from the center position for 10 D from the center of the circle pressure exits for 30 D, the upper and lower boundary sliding types from the center of the circle to 10 D, and a cylinder for the non-sliding mode surface boundary. To consider the application of a dynamic grid in the numerical simulation of vortex-induced vibration, a random grid with a diameter of 7D is set around the cylindrical oscillator. The random grid is structured, and the other areas are unstructured. In the near-wall treatment, ten layers of boundary layers are set, and the mesh height of the first layer corresponds to one, as shown in Figure 4b. Since the dynamic grid technology is used in the numerical simulation, grid-independent verification is needed. In this paper, the vortex excited motion of a cylinder with a reduced velocity is 5, which was tested under the condition of = 2.6 and two-way natural frequency = = 0.38 Hz. Grid-irrelevance verification results are shown in Table 2. Grid B is selected as the optimal scheme through comparison.
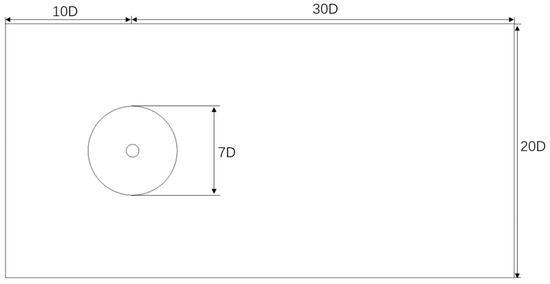
Figure 3.
Calculation area.
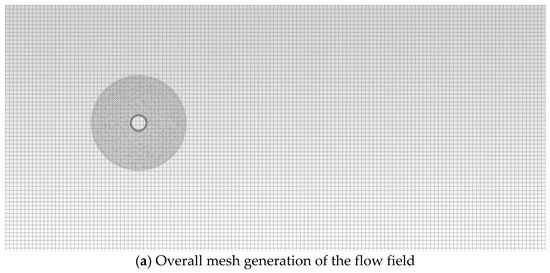
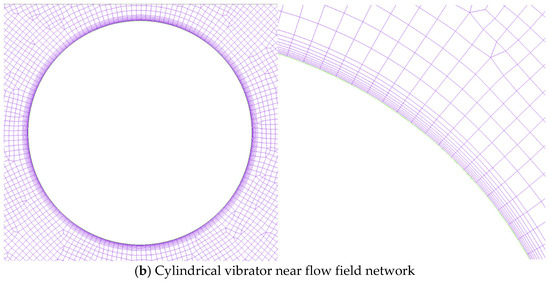
Figure 4.
Flow field mesh generation.
Table 2.
Grid-Irrelevance Verification Results.
4.2. Numerical Simulation Reliability Verification
In this paper, we ignore the subsidiary structures of the vortex-excited vibration power generator in the numerical simulation and only investigate the cylindrical oscillator.
In order to verify the reliability of the numerical simulation, the cylindrical oscillator with a mass ratio of 2.6 in Table 1 was selected and compared with the classical experiment of Jauvtis and Williamson from 2004 [9] in terms of vortex-induced vibration amplitude and trajectory.
Figure 5 compares the dimensionless amplitudes with the experimental results at different reduction speeds. As can be seen from Figure 5a, the variation trend of the curve of dimensionless transverse flow amplitude, obtained by numerical simulation, is the same as that obtained by experiment, showing the initial branch (I), upper branch (U), lower branch (L), and desynchronization (D).
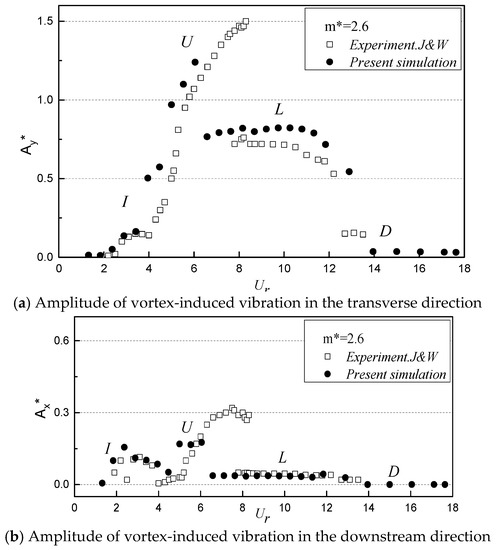
Figure 5.
Comparison of non-dimensional amplitude with experimental results under different reduced velocities.
As shown in Figure 5b, the trend of the dimensionless forward flow amplitude curve obtained by the numerical simulation is basically consistent with that obtained by the experiment, except that the forward-flow amplitude of the upper branch is somewhat underestimated. The reasons for this situation are as follows: in the upper branch, the vibration amplitude of the cylindrical oscillator is relatively large, which attenuates the axial correlation of the cylindrical oscillator. In the numerical simulation of two-dimensional cylindrical oscillators, it is assumed that their axial directions are completely correlated [11]. In addition, the numerical simulation uses the Reynolds averaging method, which does not account for the random disturbances in the flow field [19,20]. By comparison, it can be concluded that the application of numerical calculations can better simulate the VIV of cylindrical oscillators, but there is an underestimation in terms of the maximum amplitude peak.
Figure 6 shows a comparison of the trajectory of the cylindrical oscillator at different reduced velocities between the numerical simulation and the trajectory obtained from Jauvtis and Williamson’s experiment. The trajectories of the cylindrical oscillator obtained from the numerical simulation for the initial branch, the upper branch, and the lower branch are in good agreement with the experimental results, which again proves the reliability of the numerical simulation method.
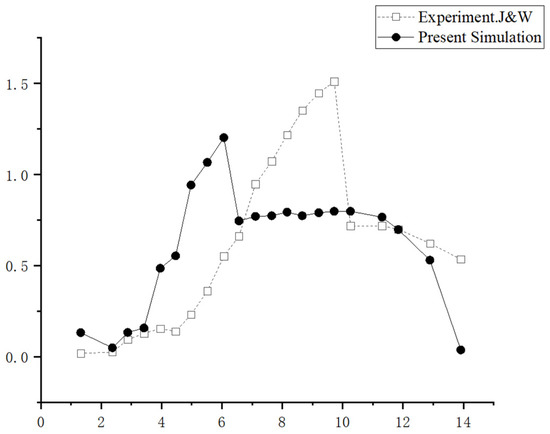
Figure 6.
The trajectory of the cylindrical oscillator at different reduced velocities.
5. Effect of Mass Ratio on Vortex-Induced Vibration of Cylindrical Oscillators
According to the working conditions listed in Table 2, the vortex-induced vibration characteristics of the cylindrical oscillator of the vortex vibration power generation device with mass ratios of one, two, three, and four are studied by numerical simulation methods. Additionally, the influence of the change in mass ratio on the vortex vibration characteristics of the cylindrical oscillator is analyzed in terms of vortex vibration response, motion trajectory, motion frequency, and downstream equilibrium position.
5.1. Vortex-Induced Vibration Response
Figure 7 gives the variation law of the dimensionless vortex vibration amplitude with the reduced velocity for cylindrical oscillators with different mass ratios. Compared with the four different mass ratios of cylindrical oscillators, the crossflow vortex-induced vibration amplitude shows a trend of increasing and then decreasing with the increase in the reduced velocity, while the crossflow amplitude responses of cylindrical oscillators all show the initial branch and the lower branch.
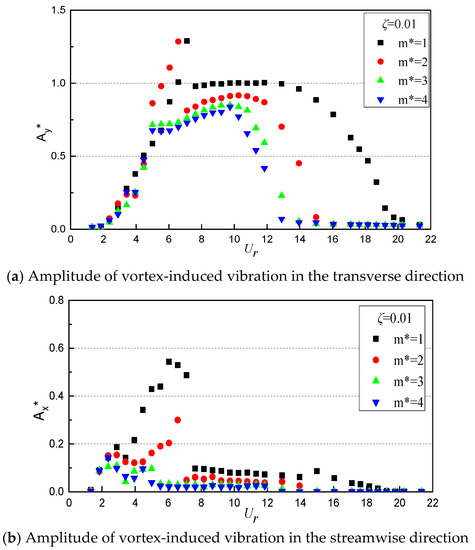
Figure 7.
The variation in the amplitude of the dimensionless vortex-induced motion of the cylindrical oscillator under different mass ratios with Ur.
When the mass ratios are one and two, the transverse amplitude also appears in the super-upper branch, the reduced velocities of the super-upper branch and the lower branch dividing point are both greater than six, and the transverse amplitudes are both greater than 1.25 D. When the mass ratios are three and four, the reduced velocities of the initial branch’s and the lower branch’s dividing point are five. In general, with the same reduced velocities, the larger the mass ratio of the cylindrical oscillator, the smaller the transverse amplitude, which is especially obvious in the initial branch and the first half of the lower branch [20,21].
In the upper branch, the transverse motion amplitude of the cylindrical oscillator with a mass ratio of two is larger than that of the cylindrical oscillator with a mass ratio of one for the same reduced velocity ( = 6.5). The reason for this phenomenon is that at this stage, the amplitude of the downstream motion for a mass ratio of one is significantly larger than that of the downstream motion for a mass ratio of two. It can be said that in the upper branch, the downstream vortex motion of the cylindrical oscillator “consumes” the energy of the cross-stream motion.
When the mass ratio is less than two, the amplitude of vortex-induced vibration in the streamwise direction also shows the above trend. When the mass ratio is greater than or equal to three, the variation in the lower branch of the amplitude in the streamwise direction is relatively stable and not affected by the reduction speed. When the mass ratio is one and two and the reduced velocity is between six and eight, the amplitude of the downstream direction corresponding to the transverse amplitude of the lower branch has a peak value; that is, the amplitude of the downstream direction increases, and the amplitude of the transverse direction decreases rapidly. With the increase in the reduced velocity, the down-flow and its amplitude decrease.
The vortex-induced vibration downstream amplitude also shows the above trend in the case of a mass ratio less than or equal to two, while the change in the downstream amplitude of the lower branch of the mass ratio greater than or equal to three is relatively smooth and is not greatly affected by the reduced velocity. When the mass ratio is one and two and the reduced velocity is between six and eight, the downstream amplitude corresponding to the lateral amplitude of the lower branch shows a peak, during which the downstream amplitude increases and the cross-stream amplitude decreases rapidly [22]; with the increase in the reduced velocity, both the downstream amplitude and the cross-stream amplitude decrease continuously.
The above analysis shows that a cylindrical oscillator with a low mass ratio will produce a larger crossflow amplitude than a cylindrical oscillator with a high mass ratio at the same reduced velocity, which can improve the power generation efficiency of the hydrodynamics of the wind–wave combined power generation system device to a certain extent.
5.2. Effect of Different Mass Ratios on Capacitation Efficiency
According to the energy-acquisition efficiency equation [13], a single cylindrical oscillator structure is used to ensure that the intrinsic frequency and diameter remain unchanged, and the mass ratio is changed by adjusting the length-to-diameter ratio to analyze the effect of the mass ratio on the energy acquisition efficiency. The cylindrical oscillator is simulated numerically, and the two-way coupling calculation is carried out at different flow rates (i.e., different deceleration velocities) to obtain the stable amplitude of the cylindrical vortex-induced vibration for dimensionless processing. The results are shown in Figure 8.
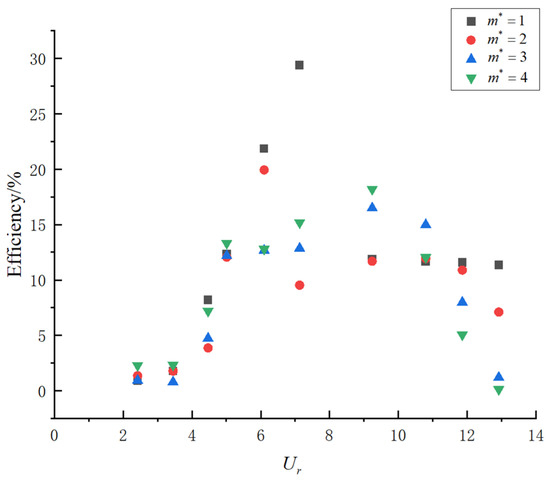
Figure 8.
The relationship between mass ratio and energy efficiency.
Figure 8 shows that the energy-acquisition efficiency of cylindrical oscillators with mass ratios of one and two increases with the increase in the reduced velocity, when the reduced velocity is less than seven, and it decreases otherwise. For cylindrical oscillators with mass ratios of three and four, the maximum energy acquisition efficiency appears in the range of reduced velocity from eight to ten. In general, the energy acquisition efficiency of cylindrical oscillators increases with the increase in reduced velocity and then decreases gradually. Under the condition of the same reduction speed, the smaller the mass ratio, the higher the capacitive efficiency.
5.3. Movement Trajectory
Table 3 shows the trajectories of cylindrical oscillators with mass ratios of one, two, three, and four at different reduced velocities; the horizontal coordinates in the figure are the causeless streamwise displacements, and the vertical coordinates are the causeless transverse displacements of the cylinder [21,23]. With the increase in the reduced velocity, the amplitude also starts to increase, and the periodicity of the downstream and transverse displacement time history curves is enhanced. When the mass ratio is two and the reduced velocity is 6.05, the frequency of the downstream vortex force generated by the vortex-induced vibration of the cylindrical oscillator without restricting the flow direction is twice the frequency of the transverse vibration [24], and a more classical “8”-shaped motion trajectory appears.
Table 3.
Motion trajectory of the cylindrical oscillator at different reduced velocities.
When the reduced velocity is small, the vortex-induced vibration of the cylindrical oscillator is in the initial branch, the transverse motion amplitude is small, the periodicity of the time history curve between the forward and lateral displacements is poor, the forward motion is dominant, and the “8”-shaped motion trajectory is not obvious, as shown in Table 2 when the reduced velocity is 2.37.
When the reduced velocity is small, the vortex-induced vibration of the cylindrical oscillator is in the initial branch, the amplitude of the transverse motion is small, the periodicity of the downstream displacement and the transverse displacement is poor, the downstream motion is dominant, and the “8”-shaped motion trajectory is not obvious, such as the motion trajectory when the reduced velocity is 2.37 [25]. This is shown in Table 3, in which X/D is the dimensionless displacement in the downstream direction and Y/D is the dimensionless displacement in the transverse direction.
As can be seen from Table 3, with the increase in the reduced velocity, the displacement in the down-flow and crossflow directions of the remaining three conditions, except for the mass ratio of one, decreases rapidly, showing a long and thin “8” shape. Furthermore, in the initial branch, with the reduced velocity of 2.37, the trajectory of the cylinder is not affected much by the Strouhal number and drag force; in the upper branch, with the reduced velocity of 6.05, the trajectory of the cylinder is more affected by the Strouhal number and drag force; in the lower branch, with the reduced velocity of 8.68, the trajectory of the cylinder is affected by the Strouhal number and drag force in approximately the same way as the upper branch.
5.4. Movement Frequency
Figure 9 shows the frequency ratio () of the crossflow motion frequency () to the structure’s hydrostatic intrinsic frequency () as a function of the reduced velocity. For comparison, the ranges of the reduced velocities corresponding to different response branches are marked in the figure.
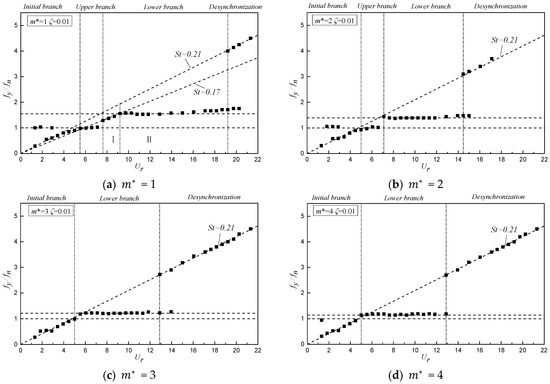
Figure 9.
The frequency ratio () of the cylindrical oscillator under different mass ratios changes with Ur.
Figure 9 shows that, in the initial branch, cylindrical oscillators with mass ratios of one and two have an upper branch and the corresponding is locked near one. However, cylindrical oscillators with mass ratios of three and four have only the initial branch and the lower branch, but no upper branch, and the corresponding is not locked near one [26]. For cylindrical oscillators with a mass ratio of one, a transition region appears between the upper branch and the lower branch, in which ≈ 0.17, as shown in Figure 9a. However, this transition region does not appear in the frequency ratio curves of cylindrical oscillators with other mass ratios. In the lower branch, different mass ratios correspond to different , and it tends toward one with the increase in mass ratio.
From Figure 9, it can be seen that in the initial branch, the cylindrical oscillator with mass ratios of one and two appears as the upper branch, and the corresponding is locked near one; meanwhile, the cylindrical oscillator with mass ratios of three and four has only the initial branch and the lower branch without the upper branch, and the corresponding is not locked near one. The cylindrical oscillator with a mass ratio of one has a transition region between the upper branch and the lower branch, and the Strouhal number in this region is 0.17, as Figure 9a shows. However, this transition region does not appear in the frequency ratio curves of other mass-ratio cylindrical oscillators. In the lower branch, the corresponding to different mass ratios is different and tends toward one as the mass ratio increases.
It can be seen that in the lower branch, the smaller the mass ratio of the cylindrical oscillator, the larger the corresponding value, and the cylindrical oscillators with mass ratios one and two will have higher transverse motion frequencies than the cylindrical oscillators with mass ratios of three and four.
5.5. Downstream Equilibrium Position
Figure 10 shows the variation in the equilibrium position of cylindrical oscillators with different mass ratios along the streamwise direction as a function of the reduced velocity. It can be seen from the figure that in the transition region between the upper branch and the lower branch of the cylindrical oscillator with a mass ratio of one, the equilibrium position in the streamwise direction suddenly decreases; it does not increase with the increase in the reduction speed but decreases initially and then increases. At the same reduction speed, the difference between the equilibrium positions with mass ratios of one and two is significantly larger than that with mass ratios of three and four, and this phenomenon is more obvious at higher reduction speeds. In the lower branch, the adventitial equilibrium position changes with the reduction speed [11].
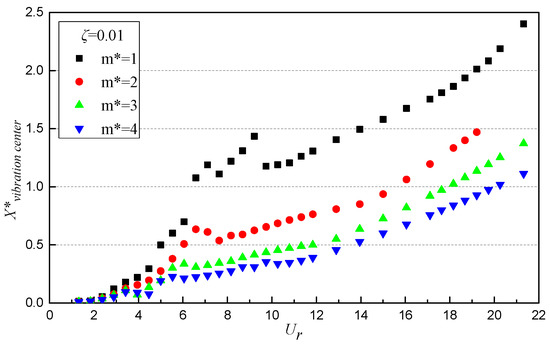
Figure 10.
Variation in Ur in streamwise direction equilibrium position with different mass ratios.
Figure 10 gives the variation law of the downstream equilibrium position of cylindrical oscillators with different mass ratios with reduced velocity. As can be seen from the figure, the equilibrium position of the cylindrical oscillator with a mass ratio of one in the transition region between the upper branch and the lower branch shows a sudden decrease in the downstream equilibrium position, which does not increase with the increase in the reduced velocity, but first decreases and then increases, and the difference between the equilibrium positions of the cylindrical oscillators with mass ratios of one and two is significantly larger than that between the equilibrium positions of the cylindrical oscillators with mass ratios of three and four at the same reduced velocity. This phenomenon is more obvious at the higher reduced velocity [27].
The downstream equilibrium position increases with the reduced velocity, and at the same reduced velocity, the lower the mass ratio, the greater the corresponding downstream equilibrium position.
6. Summary and Conclusions
In this paper, the CFD numerical simulation method was used, the Fluent solver was applied, the SST k-ω turbulence model was selected, the SIMPLEC algorithm for pressure–velocity coupling in the momentum equation was applied and combined with the dynamic grid technique to study the effect of different mass ratios on vortex-induced vibration characteristics of the cylindrical oscillator of the hydrodynamics of a wind–wave combined power-generation system. This study provides theoretical support and a factual basis for our future research on the wind power generation part of the wind–wave combined power-generation system, for example, on the effect of the cylinder’s roughness, the wind speed, or other parameters. Subsequent research will focus on the difference between 3D numerical models and 2D models of wind–wave combined power generation devices and on the cross-scale transfer of energy methods.
Additionally, the following conclusions are drawn after the study of the vortex-induced vibration power generation part of the wind–wave combined power generation system:
(1) Using the numerical simulation method compared with the classic experiment by Jauvtis and Williamson in 2004, the vortex-induced vibration of the cylindrical oscillator was well simulated, but the maximum amplitude was underestimated. The movement trajectories of the initial branch, the upper branch, and the lower branch are approximately the same as the experimental results. The reliability of the experiment is therefore verified.
(2) An analysis of the vortex vibration characteristics of cylindrical oscillators with mass ratios of one, two, three, and four reveals that with the increase in the reduced velocity, both the downstream amplitude and the transverse amplitude tend to decrease, and at the same reduced velocity, the overall trend is that the smaller the mass ratio, the larger the transverse amplitude, the more obvious the effect on the vortex vibration generator, and the higher the energy acquisition efficiency, but at the upper branch, the downstream vortex motion of the cylindrical oscillator is shown. However, in the upper branch, the crossflow vortex motion of the cylindrical oscillator “consumes” the energy of the crossflow vortex motion, and the mass ratio of one is significantly larger than the mass ratio of two, making the crossflow amplitude of the cylindrical oscillator with mass ratio one smaller than the mass ratio of two.
(3) In the frequency ratio curve, the cylindrical oscillator with a mass ratio of one has a transition region between the upper branch and the lower branch but not in other mass ratio cylindrical oscillators. For different mass ratio cylindrical oscillators, tends toward one continuously as the mass ratio increases, and in the lower branch, the downstream equilibrium position varies with the reduced velocity, and the lower the mass ratio, the larger the corresponding downstream equilibrium position at the same reduced velocity.
Author Contributions
Writing—original draft, H.S.; Writing—review & editing, J.W.; Supervision, H.L., G.H., Z.Z., B.G. and B.J. All authors have read and agreed to the published version of the manuscript.
Funding
This research was funded by the National Natural Science Foundation of China Youth Fund (grant number 51909148).
Conflicts of Interest
The authors declare no conflict of interest.
References
- Alam, M. Effects of mass and damping on flow-induced vibration of a cylinder interacting with the wake of another cylinder at high reduced velocities. Energies 2021, 14, 5148. [Google Scholar] [CrossRef]
- An, X.; Song, B.; Tian, W.; Ma, C. Design and CFD simulations of a vortex-induced piezoelectric energy converter (VIPEC) for underwater environment. Energies 2018, 11, 330. [Google Scholar] [CrossRef]
- Lv, Y.; Li, J.; Pan, S.; Wang, W. Vortex Induced Vibration Generator and Its Key Technology. Equip. Manuf. Technol. 2020, 1, 161–165. [Google Scholar]
- Zhou, B.; Hu, J.; Xie, B.; Ding, B.; Xia, Y.; Zheng, X.; Lin, Z.; Li, Y. Research Progress in Hydrodynamics of Wind-Wave Combined Power Generation System. Chin. J. Theor. Appl. Mech. 2019, 51, 1641–1649. [Google Scholar]
- Sun, H.; Huang, W.; Li, L.; Chang, S.; Hu, F. Experimental Study of Vertex Induced Motion of Spar-Type Floating Support Structure Forwind Turbine. Acta Energ. Sol. Sin. 2017, 38, 3412–3418. [Google Scholar]
- Li, L.; Tan, D.; Yin, Z.; Wang, T.; Fan, X.; Wang, R. Investigation on the multiphase vortex and its fluid-solid vibration characters for sustainability production. Renew. Energy 2021, 175, 887–909. [Google Scholar] [CrossRef]
- Yu, J.; Li, Z.; Yu, Y.; Hao, S.; Fu, Y.; Cui, Y.; Xu, L.; Wu, H. Design and Performance Assessment of Multi-Use Offshore Tension Leg Platform Equipped with an Embedded Wave Energy Converter System. Energies 2020, 13, 3991. [Google Scholar] [CrossRef]
- Bernitsas, M.M.; Raghavan, K.; Ben-Simon, Y.; Garcia, E.M.H. VIVACE (vortex induced vibration aquatic clean energy): A new concept in generation of clean and renewable energy from fluid flow. Int. Conf. Offshore Mech. Arct. Eng. 2006, 47470, 619–637. [Google Scholar]
- Jauvtis, N.; Williamson, C.H.K. The effect of two degrees of freedom on vortex-induced vibration at low mass and damping. J. Fluid Mech. 2004, 509, 23–62. [Google Scholar] [CrossRef]
- Feng, C.C. The Measurement of Vortex Induced Effects in Flow Past Stationary and Oscillating Circular and D-Section Cylinders. Doctoral Dissertation, University of British Columbia, Vancouver, BC, Canada, 1968. [Google Scholar]
- Huang, Z.; Pan, Z.; Cui, W. Numerical simulation of VIV of a circular cylinder with two degrees of freedom and low mass- ratio. J. Ship Mech. 2007, 11, 1–9. [Google Scholar]
- Du, X.; Tang, C.; Zhao, Y.; Wu, G.; Yang, X. Effects of mass ratio on the vortex-induced vibration of two types of tandem circular cylinders. J. Vib. Shock 2022, 41, 160–168. [Google Scholar]
- Bai, X. Analysis of the parameters influencing the ocean current energy harvesting efficiency of circular cylinder VIV. Renew. Energy Resour. 2017, 35, 784–790. [Google Scholar]
- Tan, J.; Wang, B.; Yuan, P.; Wang, S.; Chen, C.; Zheng, Z. Study on Turbulence Intensity Influence on Cylindrical Oscillator Response of VIV Tidal energy Conversion Device. Acta Energ. Sol. Sin. 2020, 41, 20–26. [Google Scholar]
- Khalak, A.; Willamson, C.H.K. Dynamics of a Hydroelastic Cylinder with Very Low Mass and Damping. J. Fluids Struct. 1996, 10, 455–472. [Google Scholar] [CrossRef]
- Yang, X.; Zhao, Y.; Du, X.; Wu, G. Effects of mass ratio on wake-induced vibration of two tandem circular cylinders and its mechanism. J. Vib. Eng. 2020, 33, 24–34. [Google Scholar]
- Han, C. Analysis and Prediction Reasearch on Energy Harvesting Effciency of Flow-Induced Vibration with Two Tandem Vibrators Containing Roughness. Master’s Thesis, Jiangsu University of Science and Tecnology, Zhenjiang, China, 2020. [Google Scholar]
- Shan, X.; Tian, H.; Cao, H.; Xie, T. Enhancing performance of a piezoelectric energy harvester system for concurrent flutter and vortex-induced vibration. Energies 2020, 13, 3101. [Google Scholar] [CrossRef]
- Pan, Z.Y.; Cui, W.C.; Miao, Q.M. Numerical simulation of vortex-induced vibration of a circular cylinder at low mass-damping using RANS code. J. Fluids Struct. 2007, 23, 23–37. [Google Scholar] [CrossRef]
- Gao, Y.; Zong, Z.; Zou, L.; Takagi, S.; Jiang, Z. Numerical simulation of vortex-induced vibration of a circular cylinder with different surface roughnesses. Mar. Struct. 2018, 57, 165–179. [Google Scholar] [CrossRef]
- Hao, W.; Dapeng, S. Study on suppresstion measures for Vortex-Induced Vibration of the Deep Water Riser. China Offshore Platf. 2009, 24, 1–8. [Google Scholar]
- Meneghini, J.R.; Saltara, F.; Fregonesi, R.A.; Yamamoto, C.T. Vortex-induced vibration on flexible cylinders. In Numerical Models in Fluid-Structure Interaction; WIT Transactions on State-of-the-art in Science and Engineering; WIT Press: Billerica MA, USA, 2005; Volume 18. [Google Scholar]
- Zhang, W.; Li, S.; Liu, Y.; Li, D.; He, Q. Optimal Control for Hydraulic Cylinder Tracking Displacement of Wave Energy Experimental Platform. Energies 2020, 13, 2876. [Google Scholar] [CrossRef]
- Gonçalves, R.T.; Rosetti, G.F.; Franzini, G.R.; Meneghini, J.R.; Fujarra, A.L.C. Two-degree-of-freedom vortex-induced vibration of circular cylinders with very low aspect ratio and small mass ratio. J. Fluids Struct. 2013, 39, 237–257. [Google Scholar] [CrossRef]
- Zdravkovich, M.M. Flow induced oscillations of two interfering circular cylinders. J. Sound Vib. 1985, 101, 511–521. [Google Scholar] [CrossRef]
- Gu, J.; Yang, C.; Zhu, X.; Wu, J. The influence of mass ratio on the vortex induced motion characteristics of circular cylinder. J. Vib. Shock 2016, 35, 134–140. [Google Scholar]
- Bai, X.; Han, C.; Cheng, Y. Parametric Analysis of an Energy-Harvesting Device for a Riser Based on Vortex-Induced Vibrations. Energies 2020, 13, 414. [Google Scholar] [CrossRef]


Publisher’s Note: MDPI stays neutral with regard to jurisdictional claims in published maps and institutional affiliations. |
© 2022 by the authors. Licensee MDPI, Basel, Switzerland. This article is an open access article distributed under the terms and conditions of the Creative Commons Attribution (CC BY) license (https://creativecommons.org/licenses/by/4.0/).