1. Introduction
In recent years, fire, explosion and other vicious accidents have occurred frequently due to medium corrosion and leakage of oil and gas station equipment. In 2006, the “1.20” large corrosion leakage event occurred at Fujia gas transmission station in Renshou Sichuan, resulting in 10 deaths and many wounded [
1]. In 2015, a leakage accident occurred in the atmospheric pressure unit of Gansu Qingyang Petrochemical Company, resulting in three deaths and four wounded [
2].
Due to the complexity of the technical process and process unit of the gathering and transportation station, the variation of composition of the transport medium, the harsh environment of the transportation and the difficulty of the processing operation, accidents are very likely to occur. Therefore, it is necessary to carry out the relevant research work on the risk assessment of the gathering and transportation station. Experts and scholars at home and abroad have done a series of research in this field, which can be divided into qualitative, semi quantitative and quantitative evaluation methods. The main difference lies in whether the database is used and whether the failure probability and consequence are determined by expert experience. For the accuracy of the evaluation results, the quantitative method is the best, followed by the semi quantitative method and, finally, the qualitative method. However, as far as the evaluation cost is concerned, the quantitative method is the highest, the semi quantitative method is the second and the qualitative method is the lowest. Most of the traditional risk assessment methods are qualitative and the evaluation results are highly subjective due to human factors. A quantitative risk assessment is the highest stage of risk assessment nowadays [
3]. It uses software simulation and data analysis to reduce the influence of human factors to a great extent.
A qualitative risk assessment is a qualitative analysis of the process, equipment, personnel, management and other aspects of the system based on the experience and intuitive judgment ability accumulated by risk assessment workers. This method does not need to establish mathematical models and algorithms and the whole evaluation process is relatively simple. However, this method relies too much on the subjective judgment of the evaluators and the evaluation results have a great relationship with the personal ability and professional knowledge of the evaluators. Qualitative risk assessment methods mainly include the safety inspection method, preliminary hazard analysis (PHA), the list inspection method, the hypothetical accident and consequence analysis method, the failure mode and effect analysis method (FMEA) and the hazard and hazard regulation study (HAZOP) [
4].
The semi quantitative risk assessment method is based on the indicators of a qualitative risk assessment. According to the importance of each indicator to the accident consequence and probability of occurrence, weight indicators are allocated and the accident probability and basic data are combined to form a decisive risk indicator with a certain amount of data. This method combines some characteristics of the quantitative method and the qualitative method, but the results are not as accurate as the quantitative method and the process is not as simple as the qualitative method. It includes the expert evaluation method, the Kent scoring method (MOND) and the risk assessment index matrix method (RAC) [
5,
6].
The quantitative risk assessment method is based on the failure probability in the failure database. By establishing a mathematical model and algorithm, the probability of an accident is calculated and the risk value of the event is obtained by combining the influence range and degree of the accident consequences. This method includes the Dow Chemical Fire Assessment Method, the Maunder Method of British Imperial Chemical Company, the six-stage safety assessment method of Japanese Ministry of Labor, the index assessment method, etc. In addition, a safety checklist (SCL), pre hazard analysis (PHA), failure mode and effects analysis (FMEA), fault tree analysis (FTA), event tree analysis (ETA), job hazard analysis (JHA) and a fish bone diagram can also be used in the risk assessment of oil and gas stations [
7].
In terms of the risk assessment of oil and gas gathering and transmission stations, the early research of experts and scholars mainly focused on a qualitative and semi quantitative risk assessment, and then gradually developed a full quantitative assessment method.
The API 1160 believes that the process of oil and gas stations is complex and that there is much equipment. Different to a single pipeline, the risk assessment of these stations should have its own characteristics. The API 353 provides an assessment method for the risk of equipment and oil tank leakage accidents in oil transmission stations. ASME B31.8S clearly points out that the integrity management of oil transmission stations is critical to the safety of the oil and gas industry. The Pipeline Risk Management Guide considers that there is a lot of equipment in oil and gas stations and they are interrelated. In order to conduct a more reasonable risk assessment of the stations, the stations need to be divided into several units for risk assessment.
Carl E. Jaske and Aida Lopez Garrity proposed the basic concept of the integrity management of oil and gas stations and formulated specific implementation steps based on the pipeline integrity management technology and the standard API 1160 [
8,
9]. Susan Urra has established a risk assessment model for the station based on human factors in the pipeline industry, mainly including design, construction, operation and maintenance [
10]. William V. Harper used a reliability-based approach to assess the risks of station facilities [
11].
Based on the quantitative analysis of equipment risks, the British Advantica company established a QRA system for the quantitative risk assessment of oil and gas stations [
12]. Det Norske Veritas (DNV) developed technologies such as RBI, RCM, SIL, QRA, RAM and RBM [
13]. In the early 1990s, the American Petroleum Institute (API) and Det Norske Veritas (DNV) introduced RBI technology into the detection of petrochemical equipment and successively issued the standard API 580 [
14] and API 581 [
15], which serve as implementation guides for RBI later.
Wang Mingfeng [
16] applied the FTA method to carry out a risk assessment on a natural gas gathering and transmission station and obtained the risk value of pipeline, buried facilities, pressure vessels and other equipment. Wang Yong [
17] took the Puguang Gas Transmission Station as an example to conduct a quantitative risk assessment of the station based on the failure probability and reliability analysis of API 581. Lu Lu [
18] conducted a risk assessment on gas transmission stations by SIL grading and SIL verification. Zhang Jie [
19] classified and ranked the risk index of oil and gas pipelines based on the principle of statistics. Ma Xiuyun [
20] evaluated the risks of equipment and facilities according to the basic principles of API 581 and RBI quantitative risk analysis and provided corresponding risk evaluation indicators. Li Xiaoming [
21] built the mathematical model and risk assessment system of the pipeline leakage diffusion in a gas transmission station through numerical simulation and theoretical analysis. Zhang Yuqian [
22] applied CFD technology, combined with quantitative risk assessment technology to establish a three-dimensional quantitative oil and gas station fire and explosion accident risk assessment model. Zhang Huijuan [
23] established a quantitative risk calculation model for long-distance transmission stations based on an AHP analytic hierarchy process. Chen Chuwei [
24] used PHAST software to calculate the failure probability and gas leakage consequences of gas storage and distribution stations under API 581 and developed a set of risk assessment software for the stations by MATLAB. Gao Ce [
25] improved the quantitative evaluation method of API 581 by using the data of the failure probability and consequence analysis of API 581 and the cluster analysis of the gas storage station equipment and the comprehensive risk assessment method of principal components.
After comprehensive analysis, it was found that among the numerical simulation software for a quantitative risk assessment, PHAST software [
26] is powerful, accurate, widely used and highly recognized in the market [
27]. The software has more than 1000 foreign users and more than 80 Chinese users. At the same time, it was recognized by the State Administration of Work Safety of China and listed in Appendix B of the 2003 edition of the Guidelines for Safety Pre evaluation as an excellent quantitative evaluation method [
28]. After a detailed comparative analysis of the software on sale in the market by the internationally renowned HANA report, it is concluded that DNV PHAST software is the most accurate.
In the existing research, quantitative evaluation methods are basically carried out with reference to the standard API 581 and mainly uses PHAST software as the numerical simulation software. The main research objects are mainly long-distance transmission stations or gas storage and distribution stations and there were few studies on crude oil gathering and transportation stations. Therefore, this paper adopts the theoretical calculation formula of the latest version of API 581-2016 and PHAST software for the simulation calculation, corrects the formulas after comparative analysis and finally proposes a correction formula for the influence range of fire and explosion.
2. Theoretical Calculation Materials and Methods
There is no unified definition of the connotation of risk in the academic circle. Due to different understanding and perspectives of risk, different scholars have different interpretations of the concept of risk, but they can be summarized as the following representative views. (1) Risk refers to the uncertainty of loss occurrence; (2) Risk refers to the combination of probability and degree of possible damage or harm to health under dangerous conditions; (3) Risk refers to the size and possibility of loss suffered by the actor due to the uncertainty of various results under certain conditions and in a certain period of time; (4) Risk refers to the possibility of the relevant actors to bear the corresponding risk results within a certain period of time, with the corresponding risk factors as the necessary conditions and the corresponding risk events as the sufficient conditions.
It can be seen from the above definitions that risk is a binary concept and risk is measured by two indicators: the size of loss and the probability of loss. In addition, risk includes three major factors, namely, risk factors, risk accidents and risk results. Risk factors refer to the conditions that can produce and increase the probability and degree of loss, which are the internal causes or indirect conditions that cause losses. Risk accidents refer to the accidental events that cause loss, which are the external causes or direct conditions of loss. Risk results refer to the unintentional, unplanned and unexpected reduction of economic value and harm to human health.
Since the risk includes these three factors, the risk assessment should also include these three corresponding parts. Among them, risk factors and risk events can only be qualitatively combed and analyzed one by one according to the field survey data and the indicators required are comprehensiveness and coverage. Only the risk results can be calculated quantitatively using the formula and its required indicator is accuracy. Therefore, the quantitative risk assessment of the oil industry refers to the process and method of quantitative calculation of risk results. It is mainly divided into two parts: the possibility of risk results, that is, the failure possibility, and the severity of risk results, that is, the severity of failure consequences.
Failure possibility analysis is used to calculate the accurate failure probability value of each piece of equipment in the station. We have published another article on this part. For details, please refer to reference [
29]. Failure consequence analysis is used to calculate the possible consequences of accidents, in which the first step and most difficult is to determine the impact area affected by the accident. Then, the second step is to calculate casualties and economic losses. The contents of the second step are highly uncertain, controversial and sensitive, so this paper will not explain them here and only introduces the quantitative calculation method of impact area. Therefore, the outcomes of this paper are the first step of the second part of quantitative risk assessment of risk results.
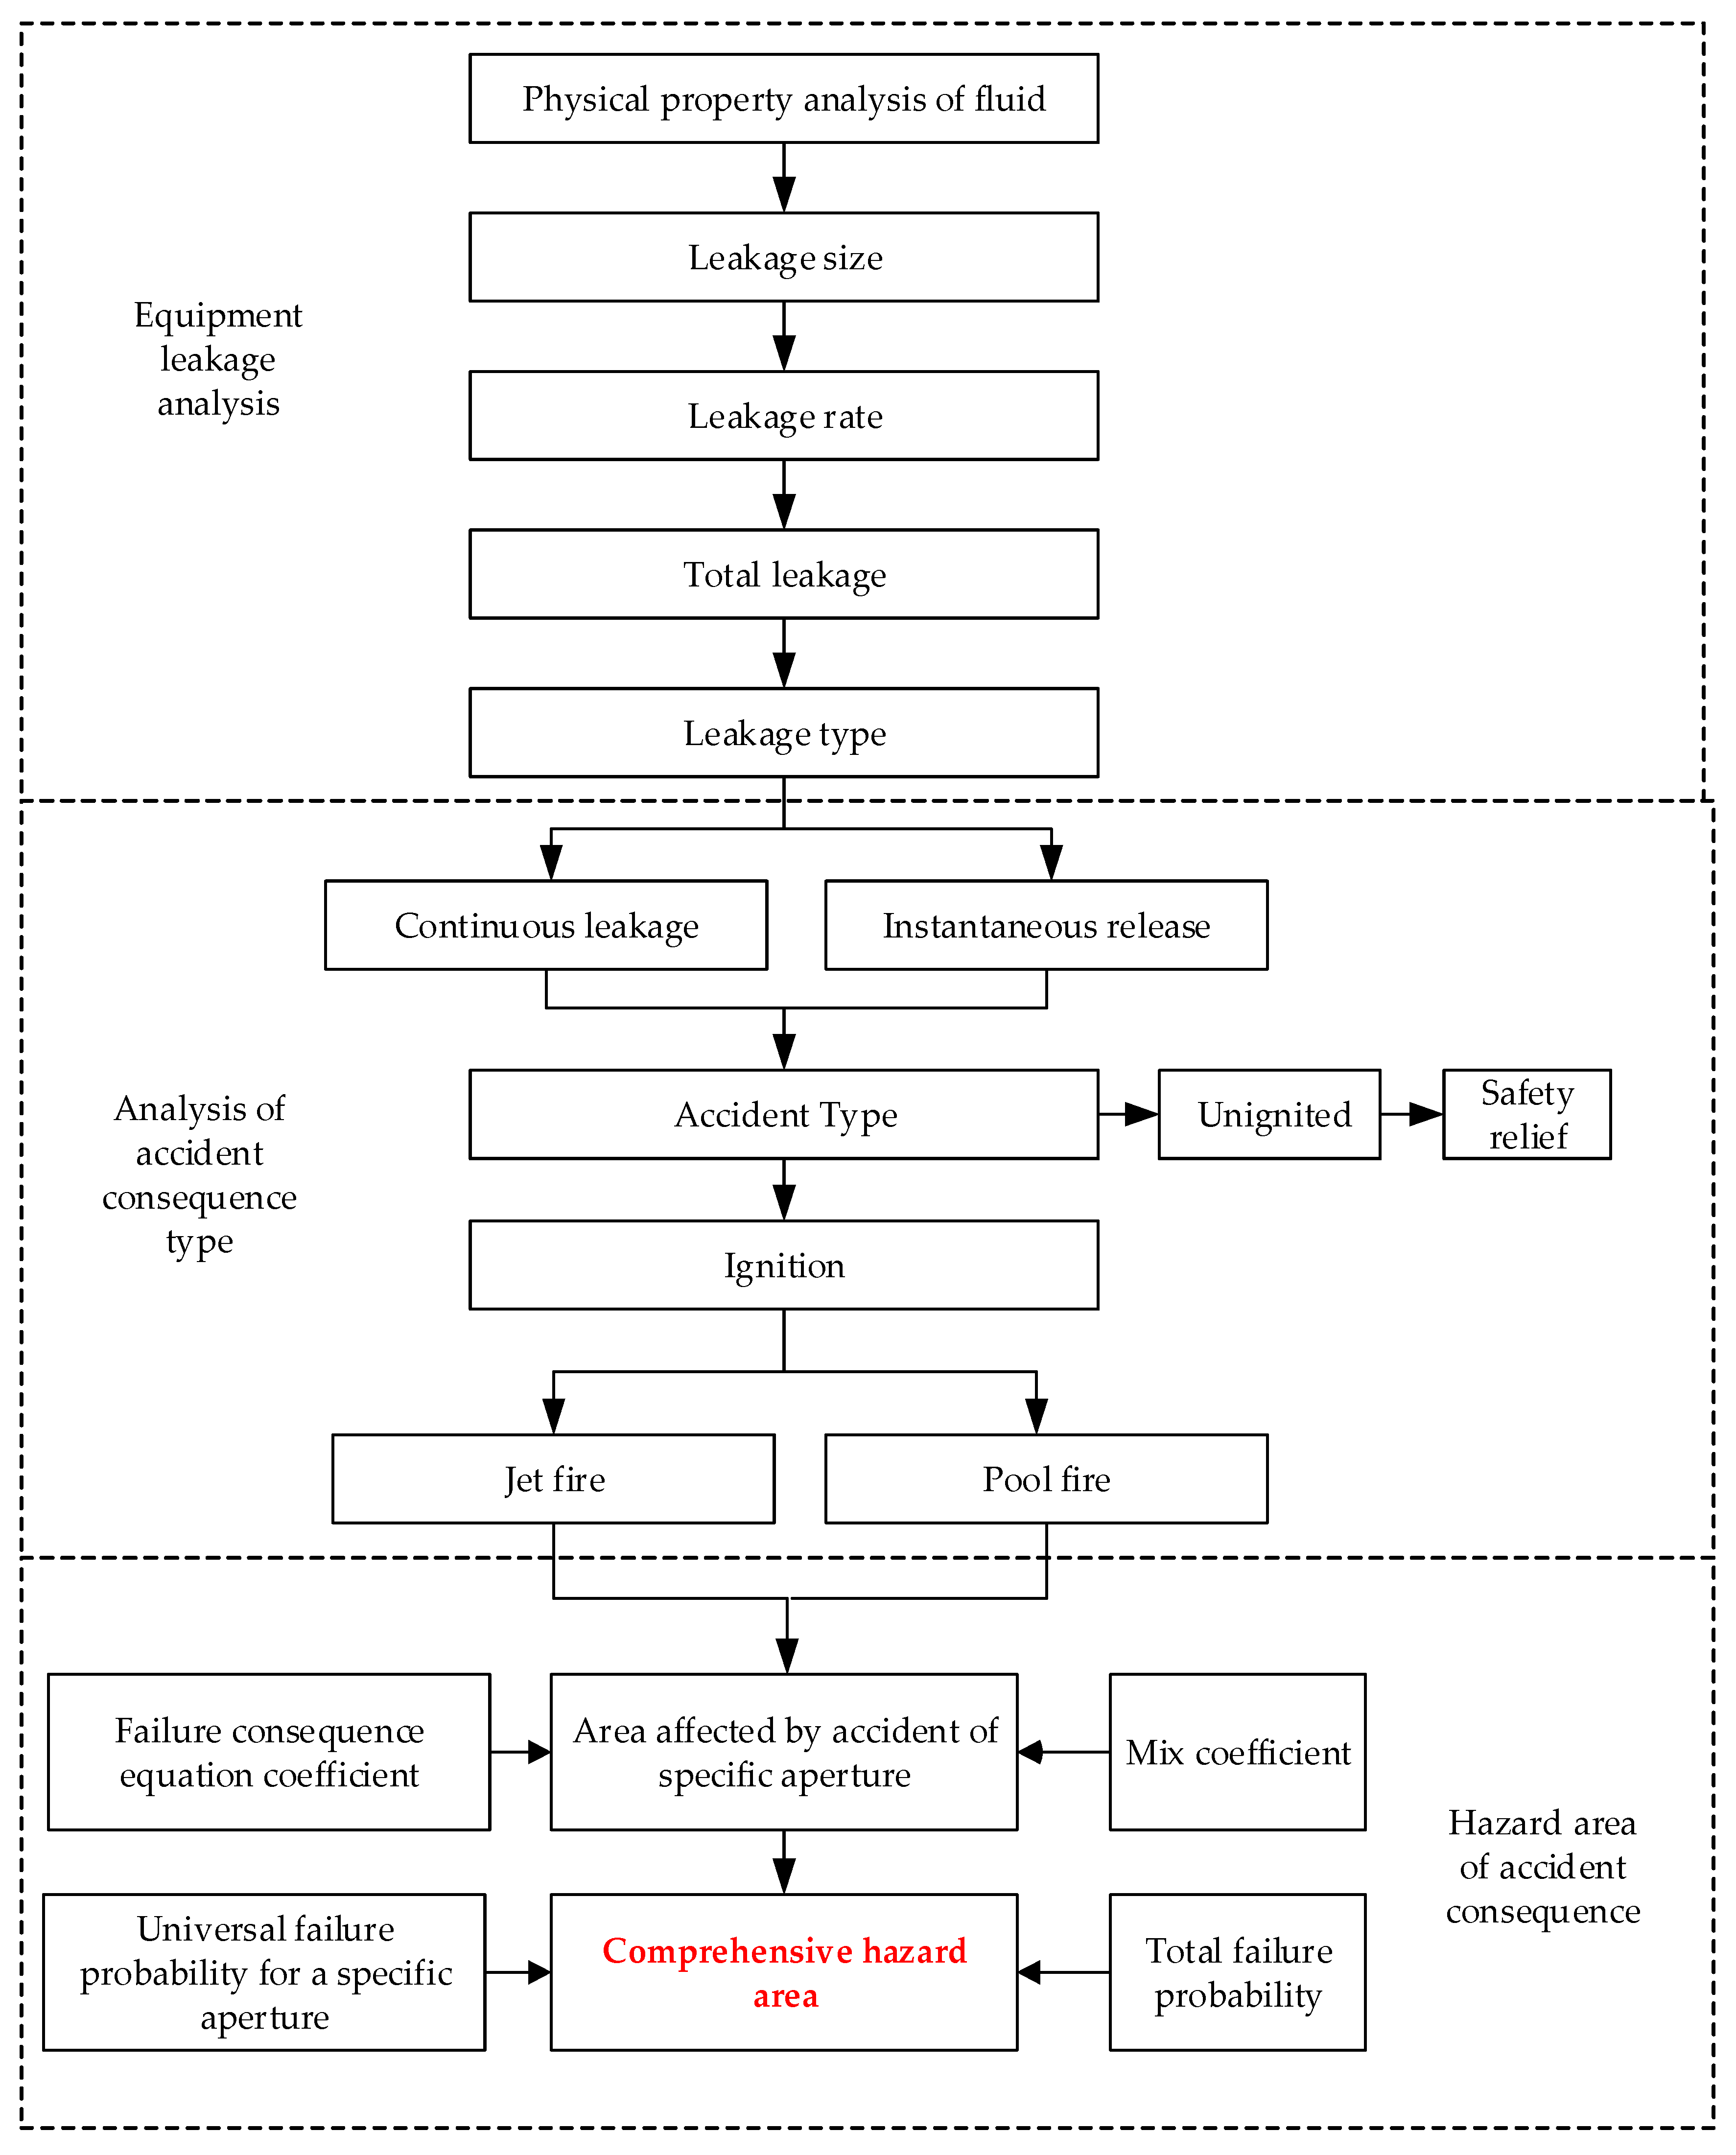
The calculation method of accident impact scope is divided into three parts, namely, the analysis of equipment leakage, the analysis of accident consequence type and the calculation of comprehensive hazard area. In the equipment leakage analysis, it is necessary to calculate the physical properties of stored fluid, leakage size, leakage rate, total leakage amount and leakage type in turn. The accident consequence type analysis needs to analyze the continuous leakage and instantaneous release, respectively, and then calculate the probability of ignition and non-ignition, the probability of jet fire, pool fire and safe release under different conditions. To calculate the hazard area of accident consequence, firstly, we need to calculate the accident-affected area of specific leakage aperture according to the mixing coefficient and equation coefficient, then multiply it by the general failure probability of specific leakage aperture and divide it by the total failure probability of the equipment to finally obtain the comprehensive hazard area of the equipment. The detailed calculation process is shown in
Figure 1.
2.1. Equipment Leakage
2.1.1. Physical Property Analysis of Storage Fluid
Since the process materials of the oil and gas station are rarely a single substance and are basically mixtures, the determination of the representative fluid is firstly the boiling point (NBP) and molecular weight (MW) and then the density. When these values are unknown, the properties of the mixture can be calculated using Equation (1). The fluid properties of representative fluids are shown in
Table 1.
2.1.2. Leakage Size
It is often difficult to accurately judge the leakage size of various equipment in the station, so the leakage size can be divided into four types, small, medium, large and broken, and finally, a group of discrete leakage aperture is selected to analyze the leakage consequences of the equipment. The specific definitions are shown in
Table 2, where D is the diameter of the hole.
2.1.3. Leakage Rate
The leakage rate in the equipment is related to the properties of the crude oil, the internal pressure of the equipment and the size of the leakage hole. The calculation method is shown in Formula (2) [
15].
In this formula:
is the liquid leakage rate, kg/s;
is the flow coefficient, normally in the range of 0.60~0.65, and 0.61 is recommended;
is the viscosity correction coefficient, which is recommended to be 1;
is the density of the liquid, kg/m3;
is the leakage area, mm2;
is the leakage area correction factor, the value is 31,623 mm2/m2;
is the acceleration of gravity;
is the operating pressure of the equipment, kPa;
is the atmospheric pressure, kPa.
2.1.4. Total Leakage Amount
The equipment in the oil and gas station does not exist independently. When evaluating a piece of equipment, its inventory will be combined with other related equipment or pipelines and they can be regarded as an equipment group during calculation and analysis. Therefore, the upper limit of leakage of station equipment is determined by two factors: the total amount of medium in the equipment group and the amount of equipment to be replenished when leakage occurs.
In this formula:
is the mass of available relieving capacity of the equipment group, kg, and some assumptions were made in
Table 3;
is the mass of available relieving capacity of the equipment, kg;
is the mass of fluid added to the equipment from other equipment, kg.
In this formula:
is the theoretical leakage rate related to leakage hole, kg/s;
is the maximum flow rate of the equipment group flowing into the equipment, kg/s.
2.1.5. Leakage Type
API 581 divides the consequences of equipment leakage into two types: instantaneous release and continuous leakage. Instantaneous release refers to the rapid discharge of fluid and continuous leakage is a long-lasting outward diffusion discharge. The judgment of the type of leakage depends on the size of the leak hole and the time taken to leak 4536 kg of liquid; the process is shown in
Figure 2.
2.2. Accident Consequence Type
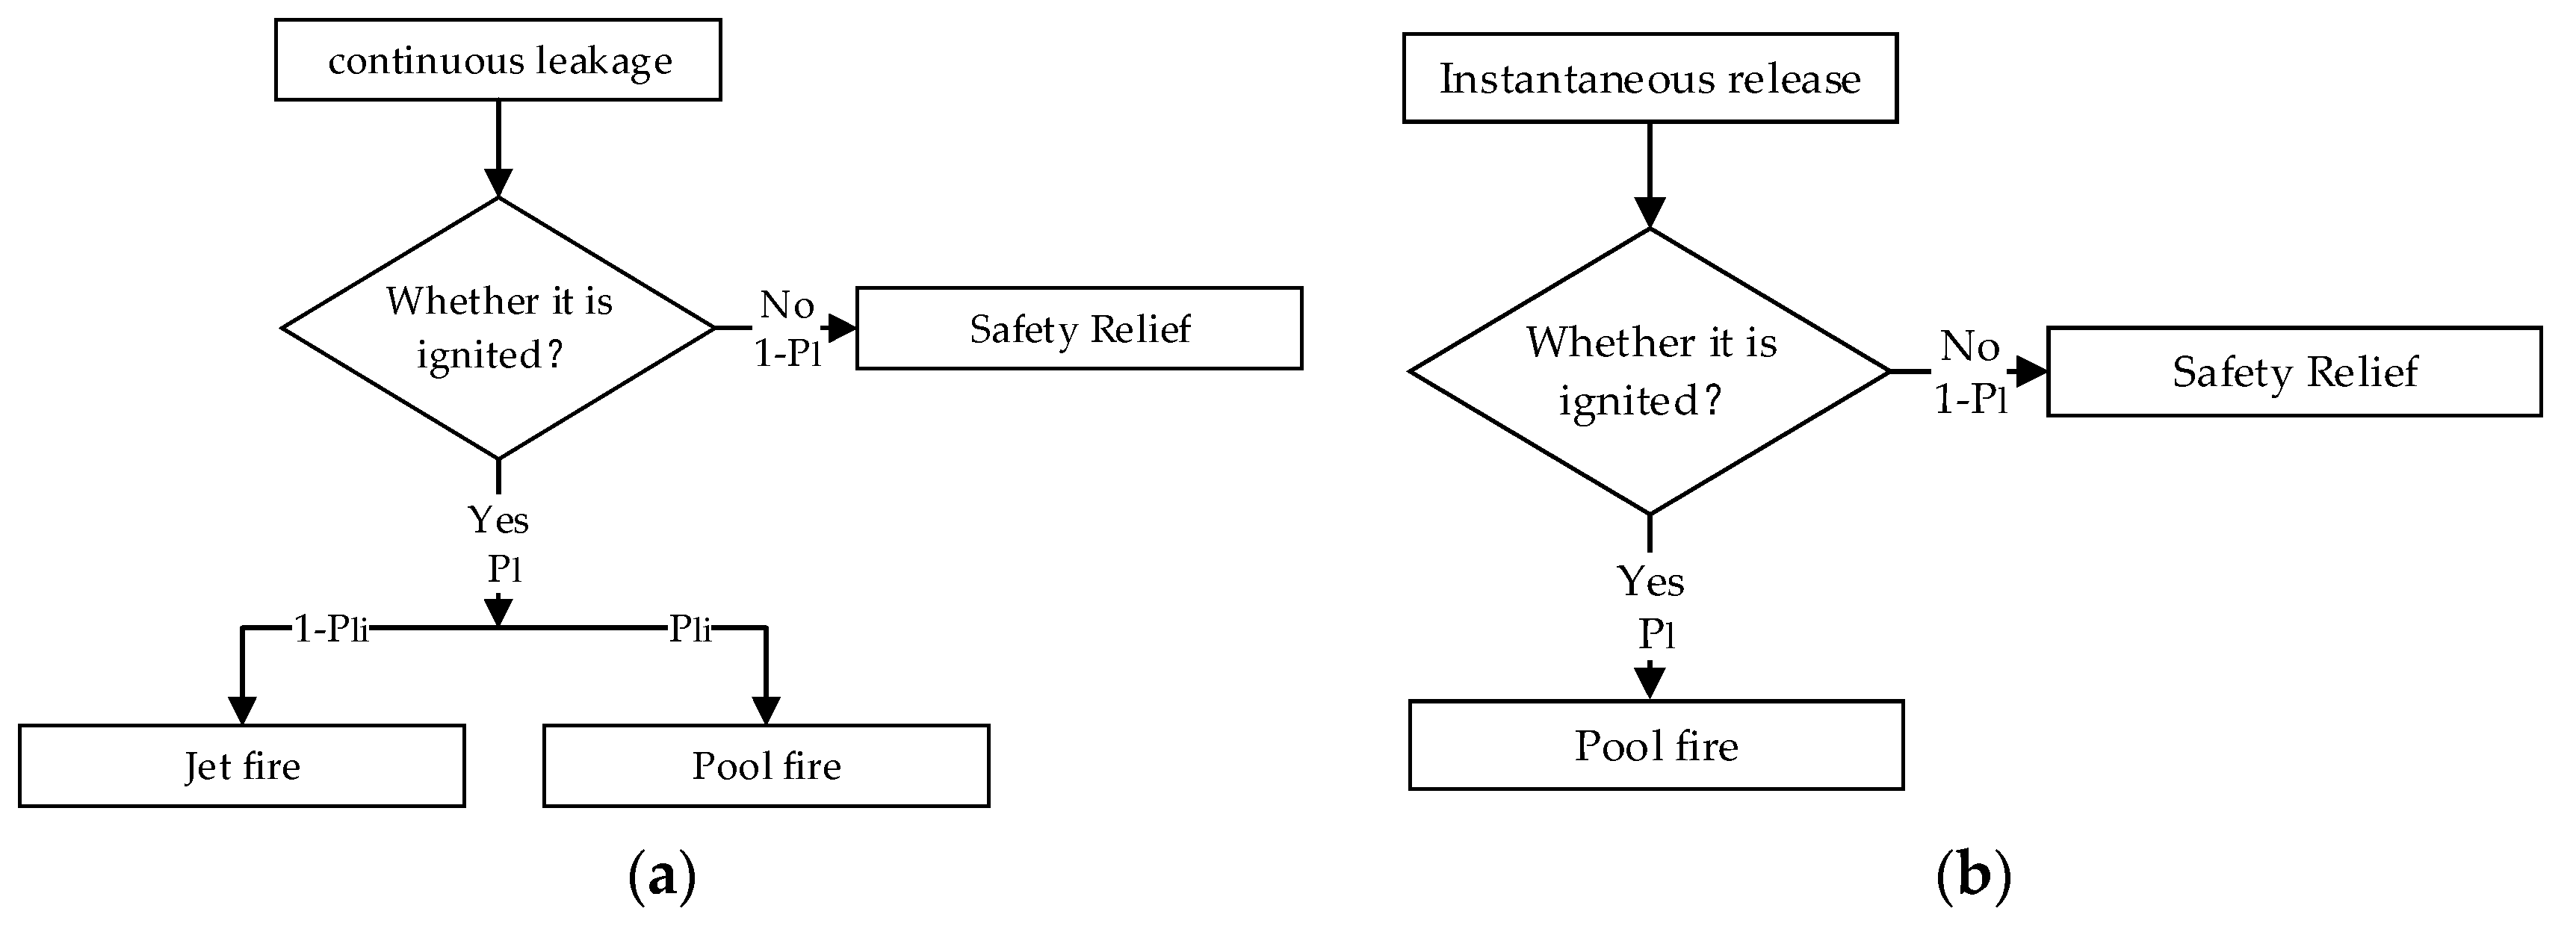
After the equipment leaks, the consequences of accidents caused by different leakage conditions and environments are different. If the crude oil is ignited after leakage, the liquid with low vapor pressure under ambient conditions will generate pool fire and the liquid with high vapor pressure will generate jet fire or pool fire. If the leaked crude oil is not ignited, it will only form toxic gas or asphyxiant air mass, which can be released safely in an open environment without causing too much harm generally.
Figure 3 shows the event tree analysis of station accident consequences. Wherein, P
l refers to the probability value of ignition after crude oil leakage and P
li refers to the probability value of pool fire after crude oil leakage. Specific values can be found in the accident consequence probability table in API 581 [
15], according to the crude oil composition.
2.3. Comprehensive Hazard Area
2.3.1. Influence Area of Accident Consequences of Specific Leakage Diameter
Each type of leakage hole corresponds to different areas of casualties and equipment damage and its influence range is related to the leakage type of equipment and the possibility of autoignition, as shown in Formulas (5) and (6) [
15].
In the above formulas:
is the equipment damage area caused by the combustion consequences under the specified leakage hole, m2;
is the casualty area of combustion consequences under the specified leakage hole, m2;
are failure consequence equation coefficients, as shown in
Table 4;
is the upper limit of the total leakage of the equipment for the specified leakage hole, kg;
is the equipment leakage rate of specified leakage hole, kg/s;
is mix coefficient, continuous leakage ; instantaneous release .
2.3.2. Comprehensive Influence Area
Each type of leakage hole corresponds to different areas of casualties and equipment damage. Therefore, the comprehensive hazard areas of 4 types of representative leakage hole that may occur in stations should be considered, that is, the leakage hole of 6.4 mm, 25 mm, 102 mm and rupture should be considered, respectively. The comprehensive influence area can be obtained by carrying out the probability weighted average calculation on them, as shown in Formulas (7) and (8). The final comprehensive hazard area takes the larger value of the two calculation results, as shown in Formula (9).
In the above formulas:
is the equipment damage area caused by combustion consequences, m2;
is the casualty area of combustion consequences, m2;
is the basic failure probability of the specified leakage hole;
is the total failure probability of the equipment;
is the final failure consequence area, m2.
2.3.3. Basic Failure Probability
Basic failure probabilities are given in API 581 [
15] and are shown in
Table 5. They are derived from the historical failure data of pressure vessels of 26 large petrochemical enterprises in Europe and the United States and are established according to statistical principles.
3. Numerical Simulation Methods and Materials
PHAST was developed by Det Norske Veritas (DNV) and is a software dedicated to hazard analysis and safety calculations in the oil, petrochemical and gas fields. It can quantitatively calculate the influence scope and degree of fire and explosion accidents that may occur in any petrochemical plant and the software simulation results have been verified many times.
The simulation calculation of the software mainly includes diffusion simulation analysis and impact simulation under each climate condition specified in the climate data. The distance from the fuel to the critical concentration is calculated by the diffusion model, which is the flammability limit of the fuel. The distances from explosion to the critical radiation level and explosion to the critical overpressure of pool fire, jet fire and vapor cloud were calculated by effect simulation. The main calculation formulas are as follows:
In Formula (10):
is the discharge rate through the hole, kg/s;
is the discharge coefficient;
is the area of the leakage hole, m2;
is the density of the material in the small hole, kg/m3;
is the liquid level difference before and after leakage, m.
- 2.
Evaporation rate of liquid discharge in tank:
In Formula (11):
is the liquid discharge evaporation rate, kg/s;
is the discharge rate through the hole, kg/s;
is the mass concentration of the vaporized liquid, kg/m3;
is the mass concentration of the expanded liquid, kg/m3.
- 3.
Radiation energy of pool fire surface:
In Formula (12):
is the surface radiation energy of pool fire, W/m2;
is the maximum surface radiation energy, W/m2;
is the measurement length of the radiation energy, m;
is the diameter of the pool fire, m.
- 4.
Radiation energy of jet flame:
In Formula (13):
is the radiant energy of the jet fire surface, W/m2;
is the melting change of the material, kJ/kg;
is the calorific value of the material, kJ/kg;
is the radiant heat coefficient.
In Formulas (14) and (15):
is a function of relative molecular mass;
is the chemical potential of the substance, kJ/kg.
- 5.
Radiation energy of vapor cloud explosion:
In Formulas (16) and (17):
is the saturated vapor pressure of the fuel, kPa;
is the mass of the substance, kg;
is the radius of the hole, m;
is the expansion time of the boiling liquid, s.
4. Case Study
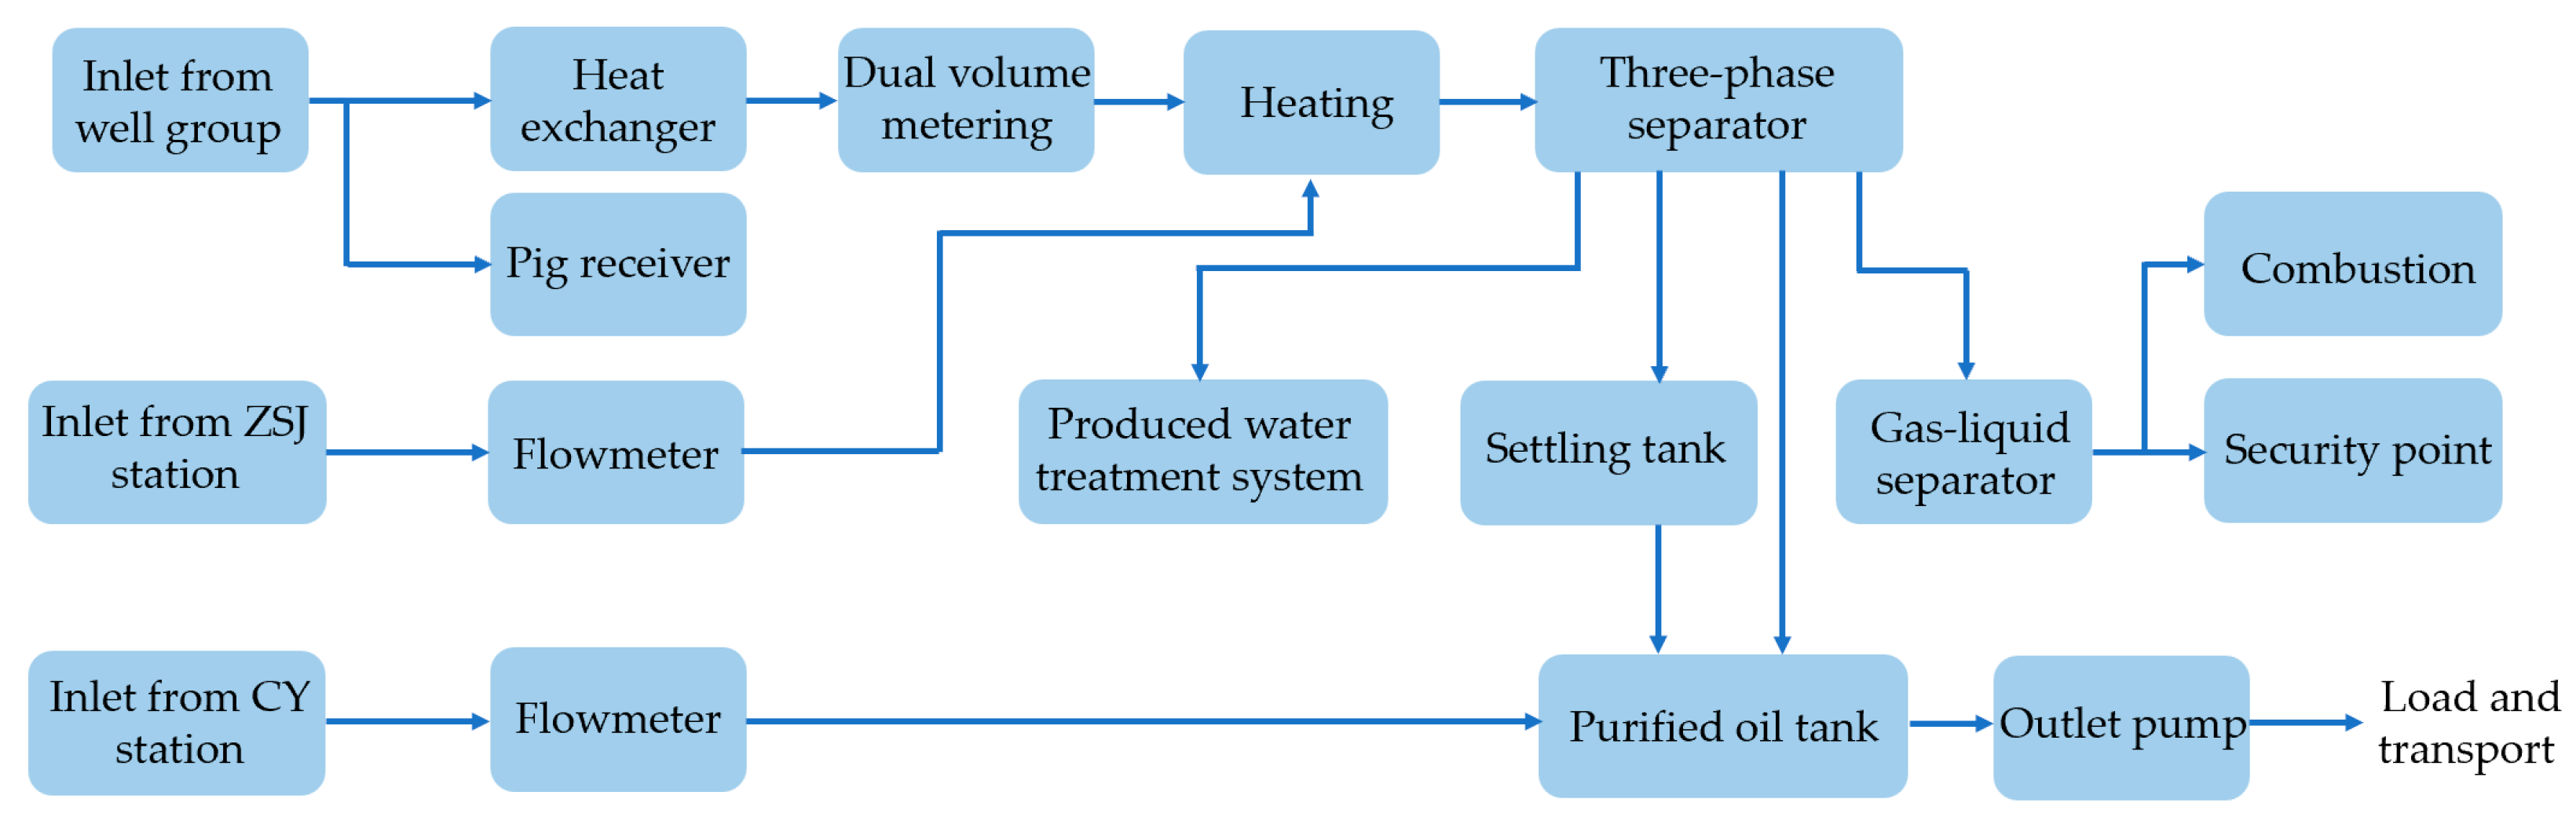
In order to apply and verify the calculation method of the accident influence range proposed, this paper selects the Laozhuang union station as an example for calculation and analysis. The main process flow of the station is shown in
Figure 4.
4.1. Process and Results of Theoretical Calculation
The oil processed by the Laozhuang union station belongs to light crude oil and the representative fluid properties are shown in
Table 6. The area affected by accident consequences of the equipment and pipelines can be calculated according to Formulas (1)–(9).
4.1.1. Leakage Rate and Total Leakage
As any part of the Laozhuang union station may leak, an accident may occur. To ensure its comprehensiveness and accuracy, the calculation method needs to include all of the equipment and represent the location of the leakage. According to Formulas (3) and (4), the leakage rate and total leakage of the equipment in Laozhuang union station can be calculated. The calculation results are shown in
Table 7.
4.1.2. Leakage Type
According to the leakage type determination process in
Figure 2, by calculating the time required for the equipment to discharge 4536 kg of crude oil at different leakage hole diameters, the leakage types of various equipment in Laozhuang union station can be determined. See
Table 8 for the calculation results.
4.1.3. Type and Probability of Failure Consequences
According to the relevant properties of the crude oil in Laozhuang union station, the API 581 accident consequence probability table can be checked to get the type and probability of the accident. See
Figure 5 for the event tree of the equipment failure consequences.
4.1.4. Mix Coefficient
The mix coefficient
is equal to
for a continuous leakage and equal to 1 for an instantaneous release. The calculation results are shown in
Table 9.
4.1.5. Impact Area of Accident Consequence under Specified Aperture
All of the equipment in Laozhuang union station is non-self-ignitable equipment. The area affected by the accident consequences of non-self-ignitable equipment under the specified aperture can be calculated using Formulas (5) and (6). The calculation results are shown in
Table 10.
4.1.6. Impact Area of Comprehensive Accident Consequence
According to Formulas (7)–(9), the comprehensive accident consequence influence area of the Laozhuang union station equipment can be calculated and the results are shown in
Table 11.
4.2. Simulation Process and Results of PHAST Software
According to the actual field investigation and experimental test parameters, the leakage accident consequences of each piece of equipment and the pipeline in the station were completely simulated by PHAST software and the influence range of the failure consequences of each piece of equipment and the pipeline can also be obtained. The initial parameters of the model are shown in
Table 12.
4.2.1. Accuracy Analysis of PHAST Software
Over the years, the accuracy of PHAST software has been verified by many experts, scholars and institutions at home and abroad [
30]. Johnson [
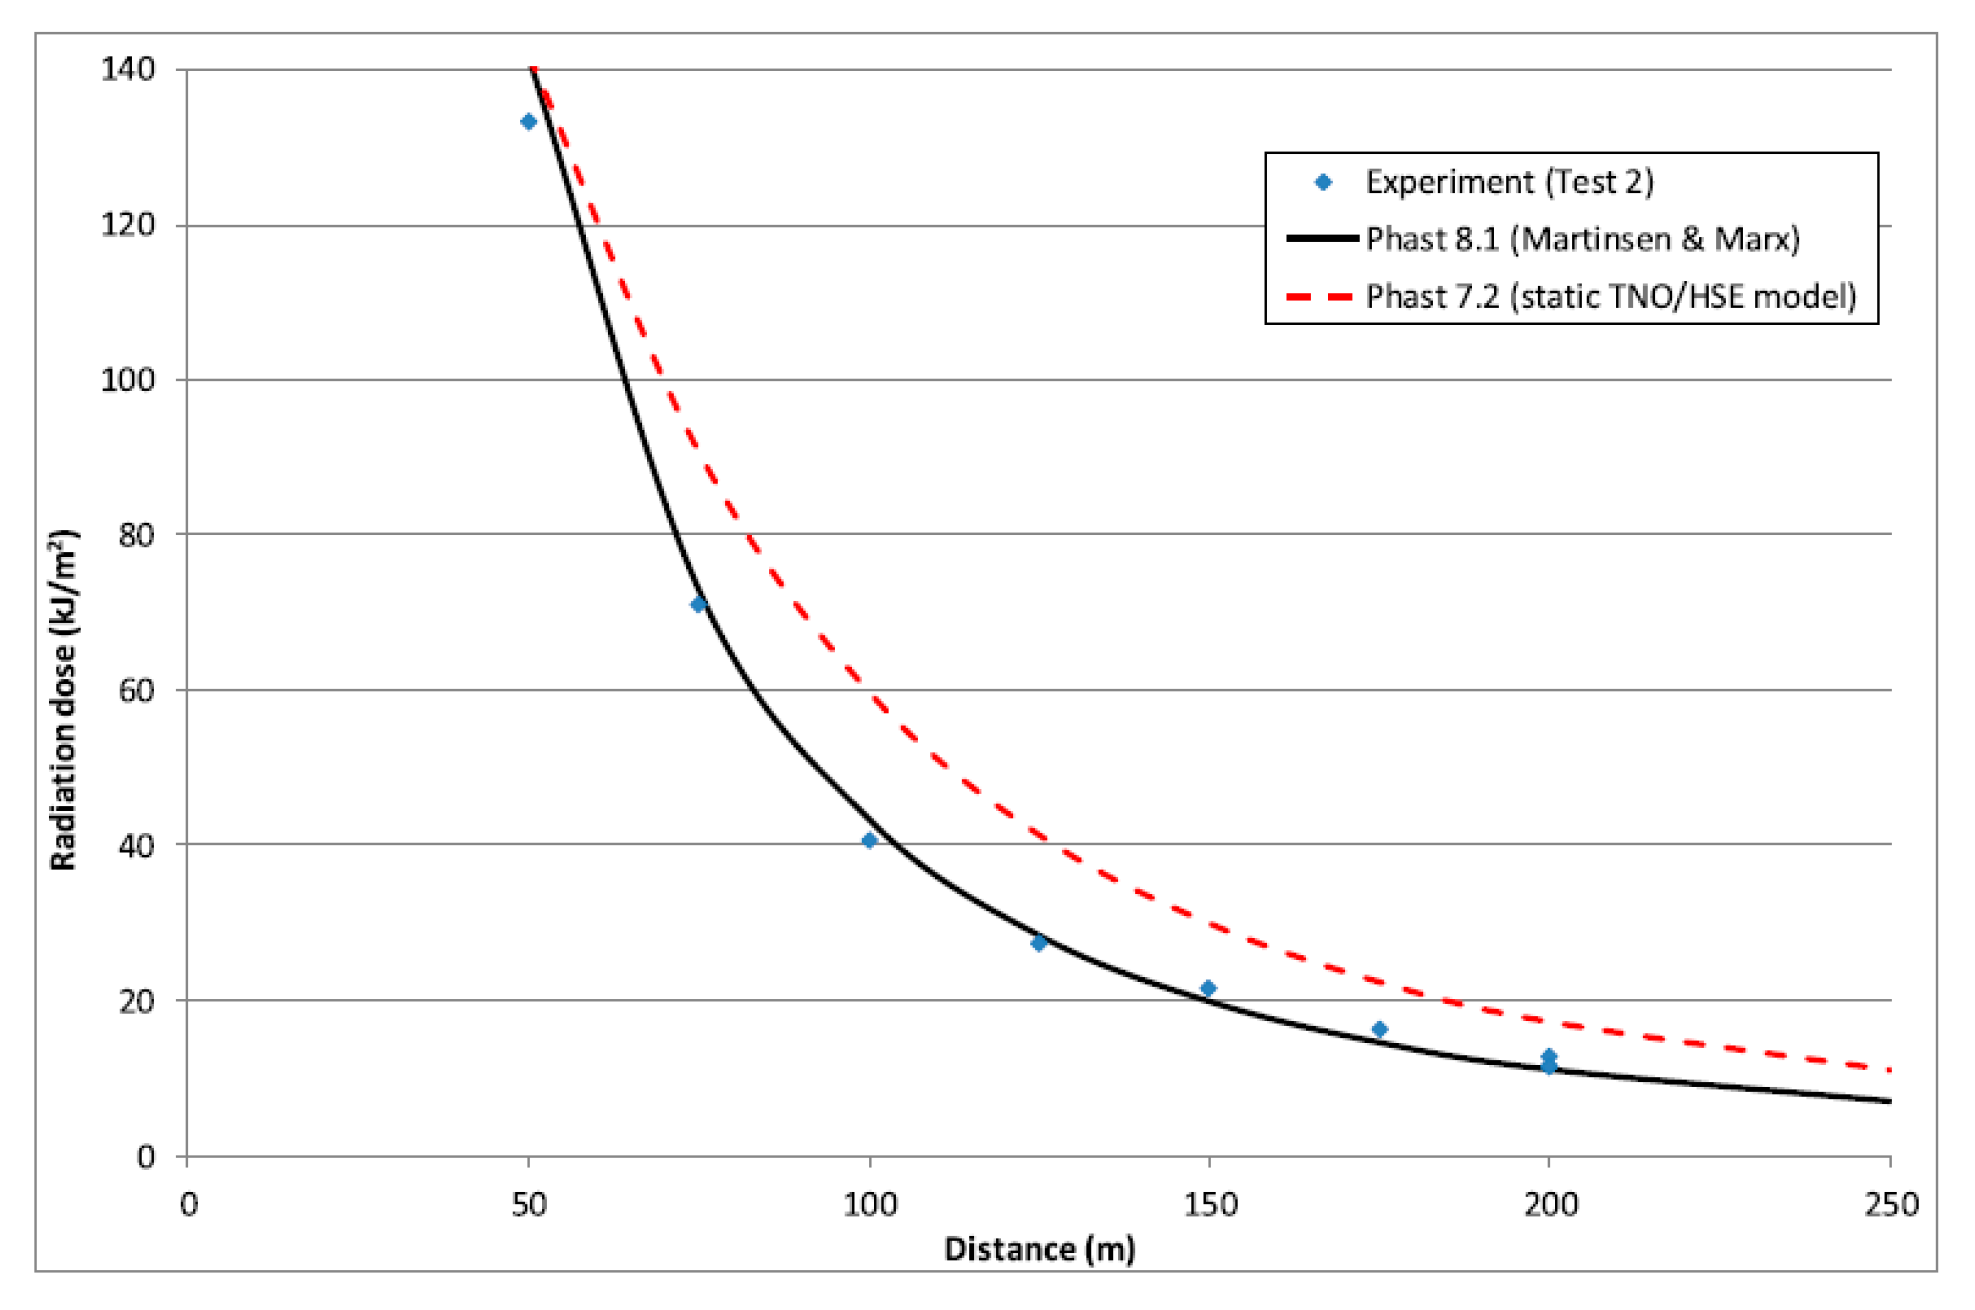
31] et al. used PHAST 7.2 and PHAST 8.1 to simulate and analyze the radiation dose of a butane fireball experiment and then compared the simulation results with the experimental data. As shown in
Figure 6, the results show that PHAST 8.1 is mostly consistent with the experimental results and the error is very small. Therefore, the simulation results of PHAST software in alkane oil are completely reliable and accurate. When there is no experimental equipment, the software simulation results can replace the experimental results to verify the theoretical calculation results.
4.2.2. Simulation Process
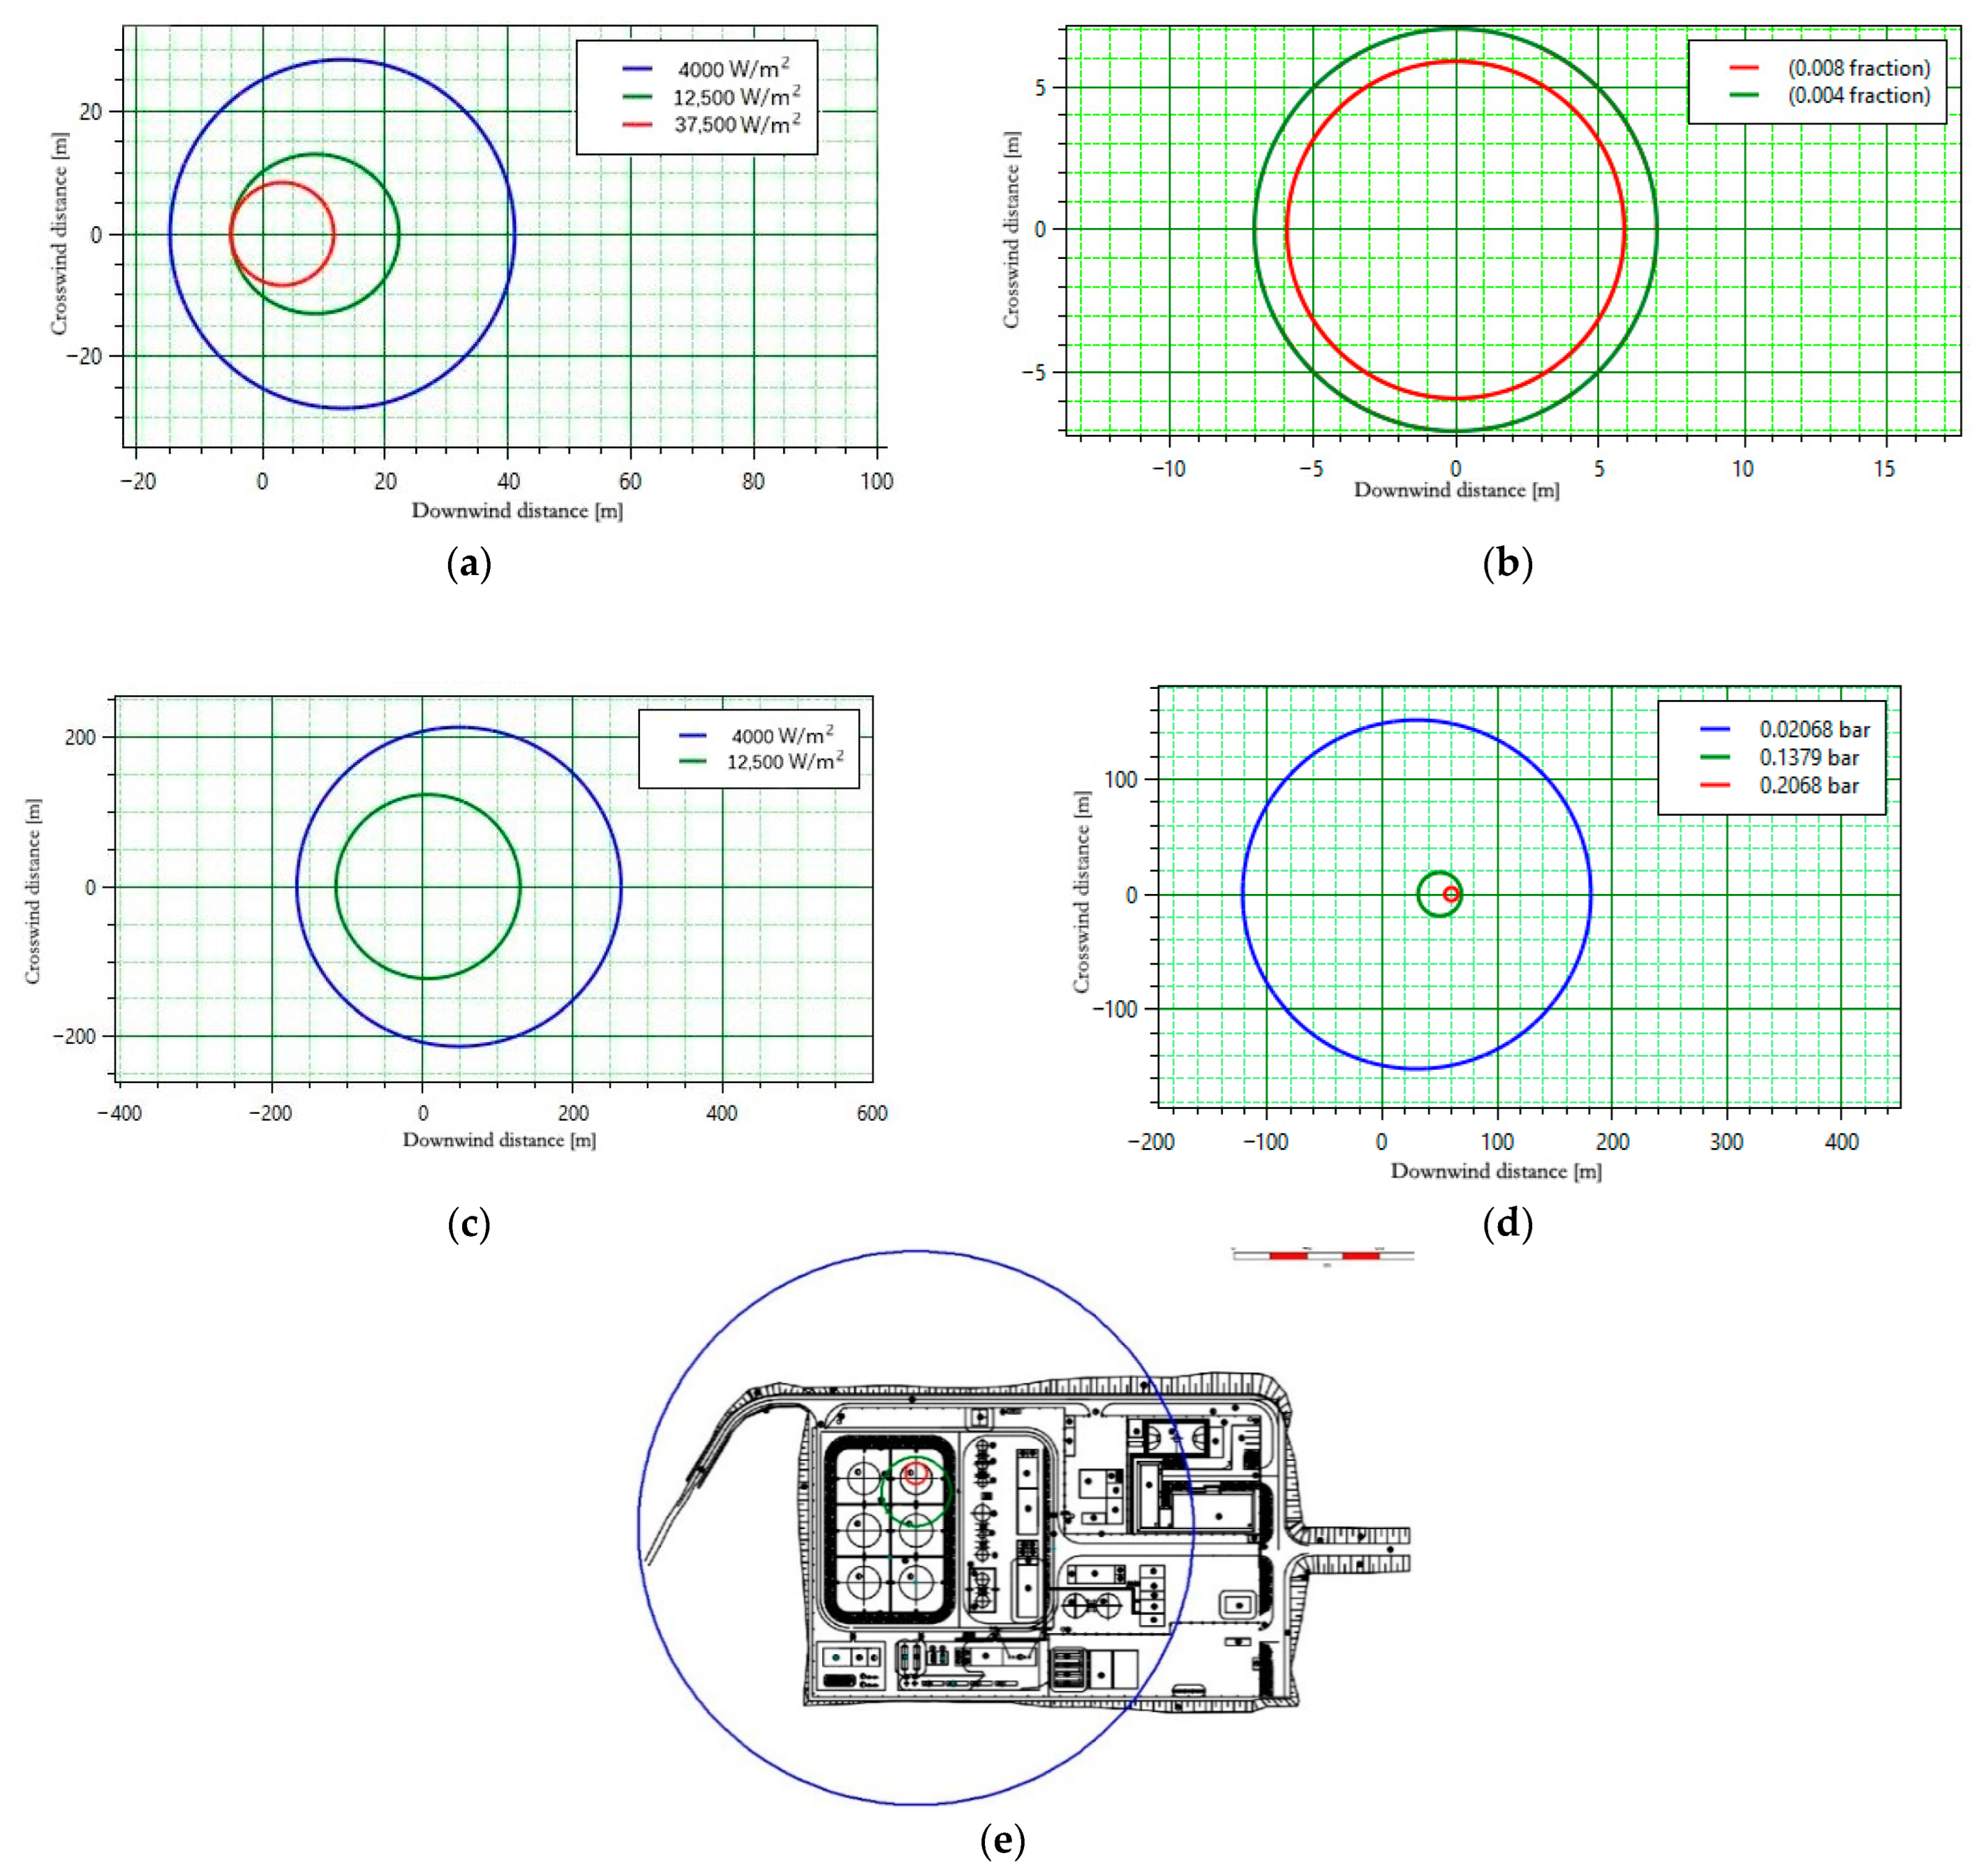
As the impact of oil tank cracking is the most serious, taking the No. 1 oil tank as an example, the simulated working conditions can be divided into four types: small hole leakage (D = 6.4 mm), medium hole leakage (D = 25 mm), large hole leakage (D = 102 mm) and complete fracture. Pool fires, flash fires and vapor cloud explosions may occur under the four working conditions. Due to the length of the article, only some typical simulation results are shown in
Figure 7.
The red area is the extremely dangerous area and there is a very high probability cause in this range. Moreover, the equipment in the range will be severely damaged due to the impact of shock wave overpressure;
The green area is the severely dangerous area and people who stay in this area will be seriously injured. The equipment in this range may not fail, but there will still be a certain degree of damage;
The blue area is a mildly dangerous area and people who stay in this area will be slightly injured. Most areas of the station are within this range, where the equipment would not be damaged, but 10% of the window glass would be broken and there would be a possibility that wall cracks may appear in the body.
It can be seen from
Figure 7 that the larger the fracture aperture is, the larger the accident influence range is. When not affected by a physical barrier, the influence range of a pool fire is the largest, while that of a flash fire is the smallest. The influence range of a pool fire and steam cloud will be affected by wind speed, resulting in center deviation, which is oval in shape. Under some working conditions, the impact scope of the accident would have already spread to the outside of the station, so large-scale settlements cannot be built near the station. This is to prevent the consequences of the accident from expanding. When an oil tank explodes, the adjacent oil tanks are very likely to have two or even more accidents due to the radiation energy. Therefore, when a safety accident occurs in the oil tank farm, in addition to fighting the accident tank, it is also necessary to take protective measures such as cooling and isolation for adjacent oil tanks in the first instance to prevent the accident from further expanding and causing greater casualties and economic losses.
4.2.3. Simulation Result
The affected area of each equipment failure consequence can be obtained through PHAST software simulation modeling and the results are shown in
Table 13.
4.3. Software Validation
The comparative analysis of the theoretical results and simulation results is shown in
Table 14.
The results of the theoretical calculation and simulation calculation were very similar, but there are still some differences, so they need to be compared and analyzed and the calculation formulas of the equipment damage area and casualty area under each leakage hole size need to be corrected. The correction factor is the ratio of the numerical simulation results and the theoretical calculation results.
In Formulas (18) and (19):
is the correction factor of the calculation formula of the equipment damage area under the specified hole size;
is the correction factor of the calculation formula of the casualty area under the specified hole size.
As there are various leakage hole diameters, the probability-weighted average of the formula correction factors under different hole sizes needs to be calculated. As the final theoretical formula correction factor, the calculation methods are shown in Formulas (20) and (21). The revised calculation methods of the equipment damage area and personnel casualty area are shown in Formulas (22) and (23).
In the above formulas:
A is the correction factor of the calculation formula of the equipment damage area;
B is the correction factor of the calculation formula of the casualty area.
4.3.1. Correction of the Calculation Formula of Equipment Damage Area
The calculation results of the total correction factor of the equipment damage area are shown in
Table 15. The average value of the correction factor of the equipment damage area calculation formula is 1.064 and the result is used to correct the equipment damage area calculation formula and the revised Formula (24) is obtained.
4.3.2. Correction of the Calculation Formula of Equipment Damage Area
The calculation results of the total correction factor of the casualty area are shown in
Table 16. The correction factor of the calculation formula of the casualty area is about 1.053. The result is used to correct the casualty area calculation formula and the revised Formula (25) is obtained.
Compared with the relevant literature data [
31], the calculation results and the impact scope of the accidents in this paper are slightly larger. This is mainly due to the greater difficulty of oil field exploitation in China, the poor quality of oil products produced, the high-water content of pipeline transmission medium, the poor surrounding meteorological environment and some mistakes in the initial design. Therefore, any theoretical formula should be improved and adjusted according to the actual situation in the field when it is applied.
The revised calculation formula can replace the original calculation formula in API 581 and be applied to other gathering stations in the same area. It can be used to obtain more accurate prediction results that are closer to the actual situation on site, without the need for secondary verification. At the same time, more comprehensive and detailed early warning measures, emergency plans, accident maintenance and repair plans can be formulated pertinently, according to the precise scope of the impact of accidents. The early warning and prevention of accidents shall be carried out as far as possible in advance to reduce the harm of accidents and ensure the safe and stable operation of on-site production.
5. Discussion
With the invention, use and continuous improvement of various types of professional software, numerical simulation has gradually become an important research method in scientific research. However, the purchase cost of professional numerical simulation software is very high and the process of learning, using and modeling software is often very complex, which also requires researchers to pay a lot of time and effort. Therefore, the oldest and most basic way of scientific research is still the derivation, calculation, analysis and constant updating and iteration of theoretical formulas. Each step of it is clear, each parameter involved is reasonable and the calculation and use process is relatively simple, which is more suitable for subsequent researchers to continuously verify and improve it and more suitable for engineering promotion and application.
The author has been committed to the research and promotion of quantitative theoretical calculation formulas and methods. On the basis of API 581, this paper integrates and combs out a set of quantitative theoretical calculation methods of accident impact scope that can be directly applied to oilfield gathering and transmission stations, combining with national standards, regulations, the literature and the actual situation of local oil products. At the same time, the simulation results of PHAST software are used as the basis for evaluating the accuracy of the calculation results. In a practical application, the first theoretical calculation result is very close to the software simulation result and the average error is only 5.2%, indicating that the method proposed in this paper for the first time is completely feasible and relatively accurate. In order to further improve the method, we added a correction factor to correct it. The second calculation result is more accurate, with the average relative error reduced to 0.4%, which fully meets the standards and requirements of engineering applications, indicating that our second correction is still very effective and necessary and can greatly improve the accuracy of theoretical calculation results.
Compared with the relevant literature of other researchers, the semi quantitative evaluation results in reference [
13] can only get a risk grade and risk matrix, while the quantitative evaluation results in this paper can get an accurate value. The calculation method in this paper is much more complex than that in reference [
17] and the corresponding calculation results are much more accurate. Meanwhile, the calculation result of the accident influence scope in this paper is larger than that of the natural gas station in reference [
32], which is determined by the different properties of a crude oil medium and natural gas medium. The calculation results in this paper are much smaller than those in the literature [
33], which is determined by the scale of the station. The larger the station is, the larger the impact scope of the accident will be. In addition, the calculated results in this paper are smaller than those in reference [
34], which is determined by the composition and water content of crude oil. The lighter the component is, the lower the water content is and the greater the impact scope of the accident will be. The calculation method in this paper is similar to that in reference [
35], but the calculation result is slightly larger because reference [
35] only considers the leakage of small, medium and large apertures and does not consider the case of complete rupture. By comprehensive comparison, the calculation methods and steps in this paper are the most detailed and the data of the calculation results will vary depending on the actual conditions of various stations. In addition, except for this paper, none of the above references have verified their calculation method and results by other means.
Different to the qualitative evaluation method and the semi quantitative evaluation method, the main research result of this paper is to propose a set of theoretical calculation methods that can be directly applied and fully quantitative for the accident influence range of oil field gathering and transmission stations, and give detailed steps and calculation methods for various parameters. The equipment in the gathering and transmission station also includes all types of equipment that may be used in various stations of the oilfield, giving an accurate value more comprehensively and intuitively. The calculation results are helpful to the planning and layout of the station equipment, the calculation and setting of the equipment safety distance, the planning and layout of the personnel concentrated activity areas, the proposal and modification of early warning measures and schemes, the rescue sequence and rescue methods after the accident and they provide a guarantee for the safe and stable production and operation of the station.
The calculation method and formula proposed in this paper have no significant difference from API 581 in their form except that the correction factor is added at the end. That is because, unlike the derivation and research of pure theoretical knowledge, this paper belongs to the engineering application. If we want to truly apply it to the engineering practice, we must meet the requirements of the relevant standards. We cannot propose a brand-new calculation method without any basis and verification, which will be unacceptable in an engineering application. However, it is unrealistic to directly apply the formula in the standard; in order to ensure the accuracy of the calculation results, it must conform to the actual situation on site. Therefore, although the form of the main formula has not changed much, we have adjusted and modified it according to the actual situation of the research station in the step-by-step calculation process and the selection and calculation of various parameters, given some suggestions on the value of parameters, and put forward some assumptions and suggestions. This not only meets the requirements of the standard, but also conforms to the actual situation on site and can also be more easily and simply applied and promoted.
Although the method proposed in this paper has many advantages, it also has some limitations. Compared with the qualitative evaluation method and semi quantitative evaluation method, the full quantitative evaluation method is still the most difficult and the evaluation cost is also the highest. The calculation steps are numerous and the process involves more parameters and requires more basic data. The accuracy of the parameters and basic data will directly determine the accuracy of the calculation results. Therefore, the evaluators need to have a certain understanding and mastery of various types of basic theoretical knowledge and principles and also fully combine that with the actual situation on site. In addition, the parameter values and correction factors in the method proposed in this paper are only applicable to the gathering and transmission stations with the same oil properties in the same oil field in this area. Other stations still need to adjust and modify this method according to the actual situation of the site as it cannot be mechanically handled and applied directly.
Moreover, the method proposed in this paper only involves the quantitative calculation method of the impact scope and the final accident consequences need to be supplemented with the calculation of the specific casualties and economic losses. The contents of these two parts are highly uncertain, controversial and sensitive, so this paper will not explain them here. In addition, the full set of quantitative risk assessment methods also need to calculate the failure probability in detail. Since all the content is too long to explain clearly in one article, the specific calculation methods and steps can refer to the author’s other article [
29]. All contents can be combined to form a set of quantitative risk assessment methods applicable to oilfield gathering and transmission stations.


