Abstract
The use of waste incineration with energy recovery is a matured waste-to-energy (WtE) technology. Waste incineration can reduce the volume and mass of municipal solid waste significantly. However, the generation of high volumes of polluting flue gases is one of the major drawbacks of this technology. Acidic gases are constituents in the flue gas stream which are deemed detrimental to the environment. The wet flue gas desulphurization (FGD) method is widely employed to clean acidic gases from flue gas streams, due to its high efficiency. A major setback of the wet FGD technology is the production of wastewater, which must be treated before reuse or release into the environment. Treating the wastewater from the wet FGD presents challenges owing to the high level of contamination of heavy metals and other constituents. Membrane distillation (MD) offers several advantages in this regard, owing to the capture of low-grade heat to drive the process. In this study the wet FGD method is adopted for use in a proposed waste incineration plant located in Ghana. Through a mass and energy flow analysis it was found that MD was well matched to treat the 20 m3/h of wastewater generated during operation. Thermal performance of the MD system was assessed together with two parametric studies. The thermal efficiency, gained output ratio, and specific energy consumption for the optimized MD system simulated was found to be 64.9%, 2.34 and 966 kWh/m3, respectively, with a total thermal energy demand of 978.6 kW.
1. Introduction
Waste-to-energy (WtE) technology has been established to be an appropriate method of dealing with municipal solid waste (MSW) worldwide [1]. Most developed countries have embraced the use of it as an attractive means of treating non-recyclable and non-reusable waste because not only it minimizes the risks and environmental concerns associated with disposing copious quantities of MSW into landfill sites, but also it allows production/recovery of useful energy (e.g., electricity). The use of MSW as fuel to generate energy can reduce the over-dependence on fossil fuels as sources of energy.
Waste incineration is the most matured and widely used WtE technology [1,2,3]. Waste incineration can reduce the volume of MSW by 80 to 95% and the mass by 70 to 75% [4]. The major setback with the use of this technology is the significant amount of pollutants that are produced. There are some constituents (e.g., hydrofluoric (HF), hydrochloric (HCl), and sulphur dioxide (SO2)) in the flue gases emanating from waste incinerators which are proven to have a detrimental impact on the environment [5]. Therefore, strict limits on the amount of such constituents are set. Different technologies have been considered for removal of such emissions (e.g., wet, semi-dry, and dry scrubbing).
Absorption and adsorption are two distinct processes by which acidic gases are cleaned from flue gas streams emanating from waste incinerators. These processes are classified either as non-regenerative or regenerative. The non-regenerative technologies are further divided into three; dry, semi-dry and wet methods [6,7]. Figure 1 depicts the various methods in non-regenerative flue gas desulphurization (FGD) technologies that are used in acid gas cleaning. Wet scrubbing is a FGD method that is widely employed in cleaning acidic gases in flue gas streams, with Japan, USA and Germany enjoying the most patronage [8]. Advantages of this technology includes higher rates of desulphurization, relative ease of operation, and smaller equipment. The limestone wet method of FGD is reported to be the most widely used technology in the cleaning of acidic gases in flue gas streams from waste incineration plants [9]. A study by Lecomte et al. [10] indicates that removal efficiencies of up to 99% can be achieved using this technology. The major disadvantage with the use of this method is the production of wastewater, which must be treated prior to reuse or release into the environment. There are several wastewater treatment methods that are employed in the treatment of various types of wastewater. Membrane separation methods employed in the treatment of wastewater include microfiltration, ultrafiltration, reverse osmosis (RO), etc. RO has enjoyed the most patronage among the various types of membrane separation techniques. However, drawbacks include higher electricity demand in providing high pressures at the intake, consequently affecting the membrane’s long-term performance [11]. There is, therefore, the need to explore other membrane separation processes.
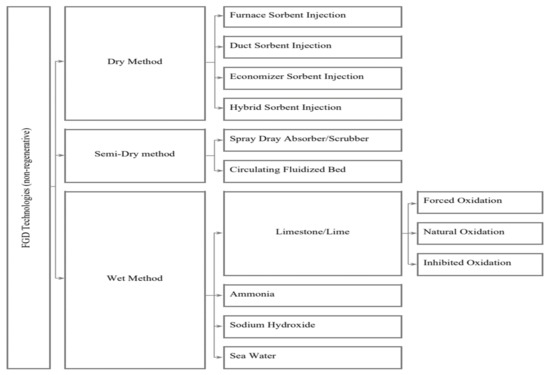
Figure 1.
Non-regenerative flue gas desulphurization technologies [23].
Membrane distillation (MD) is a promising novel technology used in separation processes where only water molecules can pass through a porous hydrophobic membrane material. The application of MD technology is widespread in the desalination of seawater and brackish water [12,13,14,15], and the treatment of wastewater that is polluted with radioactive substances [16,17]. MD is also reported to have potential in the treatment of oily wastewater from industries [18,19,20]. However, relatively few works have been carried out on the application of MD technology in the treatment of flue gas condensate. Chuanfeng et al. [21] investigated the use of MD in the framework of combined heat and power (CHP) plants in Sweden. Subsequently, a pilot unit was installed at the Vattenfall Idb cken CHP plant (a biofuel-fired plant) during 2006 and 2007 [22]. Later, a follow-up investigation considered water recovery from flue gas condensate in MSW-fired cogeneration plants using MD [11], and employed both laboratory and pilot-scale air gap MD modules in combination with techno-economic analyses. The aforementioned studies demonstrated that MD offers equal or superior separation efficiency as compared to RO with higher specific costs. The availability of low-grade heat placed an upper limit on the capacity of the MD system to about 100 m3/h. However, their work was carried out on cogeneration plants, which supply both heat and electricity, and not for WtE facilities operating in condensing mode, where electricity is the only energy service provided. Therefore, there is the need for further investigation if the MD technology is to be integrated in a WtE plant in a tropical country such as Ghana, where the heat demand is low and thus cogeneration is unprofitable when selected. Moreover, to meet the MD energy demand, the possibility of using the recovered waste heat during the cooling of the flue gas stream prior to the particulate matter (PM) separation process is considered.
This study, therefore, mainly focuses on different models of a waste incineration plant simulated using Aspen Plus® software (version 11). In other words, three of the developed models used for the study are presented, with emphasis on the simulation of acid gas cleaning using wet FGD and the treatment of the produced wastewater via MD technology. The current study is a subsequent part of a research investigation with the broader aim of proposing optimal integration of WtE in Ghana.
2. System Description
This section describes the overall flow chart used in the study, and the system design of a wet scrubbing system and how it is integrated to clean acidic gases in the flue gas stream.
2.1. Block Flowchart of the Incineration Plant Used in the Study
The integrated system block flow chart for the waste incineration plant used in this research is depicted in Figure 2. MSW is first fed into the incinerator/boiler, where sufficient air is added to aid in the complete oxidation of the MSW. After combustion of the MSW in the incinerator/boiler, the flue gas (which carries with it a high energy and particulate matter) and ash are produced. While ash is collected at the bottom, the flue gas stream exits into a heat recovery steam generator (HRSG). After heat exchange with high pressure water to produce high pressure steam, the flue gas is first cooled down further before entering a particulate matter (PM) separation device. At this stage, PM is separated from the flue gas stream using either a cyclone, filter bag, electrostatic precipitator PM separation device, or a combination of these. Then the flue gas stream goes into the wet FGD where water and aqueous calcium carbonate (CaCO3) are added to clean out acidic gases. The flue gas stream is further cleaned before its release to the environment through a stack. The produced wastewater after acid gas cleaning, on the other hand, is sent to the MD system for treatment prior to reuse or disposal into the environment. The wastewater that goes into the MD system is treated and produces a cleaned water (permeate), and the captured solids and the remains in the concentrate (retentate) can be returned to the MD system for further cleaning or disposed.
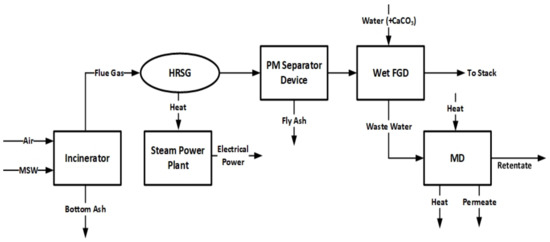
Figure 2.
Block flowchart of incineration plant used for the study.
2.2. Design of a Wet Scrubbing System
A typical design of a limestone wet method of FGD technology has two basic stages. In the first stage, only water (acidic condition) is added. This stage is only effective in the removal of HF, HCl and sulphur trioxide. The removal of SO2 in the first stage is low due to the presence of HCl, which affects its absorption. Therefore, a second stage is incorporated where a liquid with higher pH (neutral or alkaline condition) is added to remove the SO2. Studies [6,7,24,25,26] indicate that the second stage is capable of removing other acidic compounds that are present in the flue gas stream.
3. Methodology
The integrated system is divided into three subsystems that are simulated using Aspen Plus®. This section describes these three subsystem models simulated.
The first is the waste incineration plant, which is to determine the volume of emissions, including the parameters of the various constituents, that were generated after the combustion of the MSW. The second model is the wet scrubbing process, employed to determine the volume of water needed to clean acid gases (limited to only HCl and SO2 in this study) from the flue gas stream and subsequently the volume of flue gas condensate (wastewater) generated in the process. The third model is the MD technology which is used to treat the flue gas condensate produced during the acid gas cleaning.
The relations used in performing the thermal analysis of the MD system are also presented in this section.
3.1. Models Used in the Study
3.1.1. Model of the Waste Incineration Plant
The waste incineration plant Aspen Plus® flowsheet [27] is shown in Figure 3. The simulated plant has a nominal incineration capacity of 240 metric tons of MSW per day, generating 30 MW of electrical power with an efficiency of approximately 31%. The waste incineration plant model has four stages: (1) drying of the MSW, (2) combustion of the MSW, (3) steam generation for only electricity generation, i.e., condensing mode and (4) PM separation.
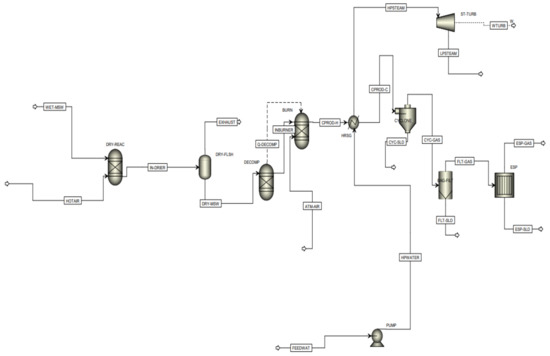
Figure 3.
Waste Incineration Aspen Plus® model flowsheet [27].
In the waste incineration plant, the wet MSW (WET-MSW) is sent into a vessel (DRY-REAC), where hot air (HOTAIR) is mixed with WET-MSW. A calculator block is defined in Aspen Plus to control the drying process in another vessel (DRY-FLSH) and the by-products from this vessel are a dry MSW (DRY-MSW) and an exhaust vapour (EXHAUST), which is discharged into the atmosphere.
DRY-MSW is now ready to be combusted. As its composition can vary based on the source and regional factors (e.g., topography, seasons, food habits etc.), it has been defined as non-conventional in the model. Consequently, for successful simulation of combustion process, DRY-MSW first needs to be defined based on its content. Therefore, an extra vessel (DECOMP) is included in the flowsheet where DRY-MSW is broken down into its various elemental constituents (Q-DECOMPOST). Q-DECOMPOST is then sent into the combustion chamber (BURN), where sufficient air (ATM-AIR) is added to achieve a complete oxidation of the MSW. Energy is recovered from the flue gases (CPROD-H) from the combustion process in the heat exchanger (HRSG) for the generation of superheated steam (HPSTEAM), which turns a steam turbine (ST-TURB) for the generation of electrical power (WT-TURB). After the recovery of heat energy from CPROD-H, there is a drop in temperature in the flue gas (CPROD-C) before entering particulate matter (PM) separation devices. In the model depicted in Figure 3, all three types (cyclone, bag filter and the electrostatic precipitator (ESP)) of PM removal devices are incorporated. The flue gas stream after the PM separation (ESP-GAS) then goes into the wet scrubbing system for cleaning of acidic gases.
3.1.2. Model of the Wet Scrubbing Process
An Aspen Plus® model (Figure 4) of a wet scrubbing process was developed in order to simulate the cleaning process of acid gases from produced flue gas in the previous model. The main output of this model is to determine the amount of flue gas condensate (wastewater) that would be generated. The base method used in Aspen Plus® is ELECNRTL.
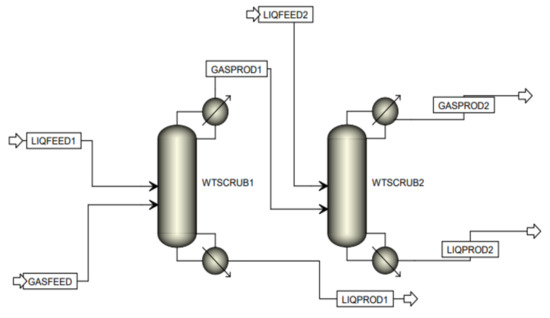
Figure 4.
Wet scrubbing process Aspen Plus® flowsheet [27].
As can be seen in Figure 4, the developed model has two stages. RadFrac (WTSCRUB1) from the Aspen block built-in library, which is the acidic scrubber, is selected where the flue gas stream from the waste incinerator (GASFEED) and water (LIQFEED1) are the feed streams. The products then are wastewater (LIQPROD1), and the flue gas stream (GASPROD1). The second wet scrubber (WTSCRUB2), selected as the same as the first scrubber in Aspen Plus, is the alkaline (or neutral) scrubber with two feeds: the partially cleaned flue gas (GASPROD1) from WTSCRUB1 and a liquid feed (LIQFEED2). The latter is an alkaline solution, which in this study is considered to be calcium carbonate (CaCO3).
Table 1 lists the operating condition used in the modelling of the wet scrubbing process. It is assumed that there is no temperature and pressure drop in GASPROD1 from WTSCRUB1 to WTSCRUB2.

Table 1.
Operating conditions in the wet scrubbing process.
3.1.3. Model of the MD System
There are no available blocks in the Aspen Plus built-in library that can readily be used in the simulation of an MD unit. Hence, it was modelled using a customised USER Model2 in Aspen Plus. An excel file sheet built into Aspen Plus was modified with data obtained from the simulation of the wet scrubbing model. Table 2 is a list of the operating parameters used in the simulation of the MD system. This simulation work is based on the MD system presented by Imtisal-e-Noor et al. [28]. However, there are a few differences between that simulation work and this current work. The current model has a single air gap MD module relative to the dual-cascaded MD modules used in that work. There are also differences in parameters, such as the feed inlet temperature, coolant inlet temperature, density of the feed, and the composition of the flue gas condensate. The feed and coolant inlet pressures, however, remain the same.
Table 2.
Operational parameters of MD system.
The Aspen Plus® MD model flowsheet is shown in Figure 5, and the base method used for this model is IDEAL. The flue gas condensate or wastewater (WWSCRUB) generated from the wet scrubbing process is collected into a tank (TNK) at a temperature of 56.7 °C. The wastewater stored in the tank (FD1) is then passed through a heat exchanger (HX) and heated up to a temperature of 85 °C using heat from the cooling of the flue gas stream (from 440 °C to 160 °C) before particulate matter separation. The heated flue gas condensate (FD2) then goes into the MD module (MD). The temperature of the flue gas stream drops because of the latent heat of vaporization which corresponds to the permeate flux passing through the membrane. The concentrate and permeate streams from the MD module are referred to as RET and PERM, respectively. The treated water (PERM) is then collected into another tank for reuse.
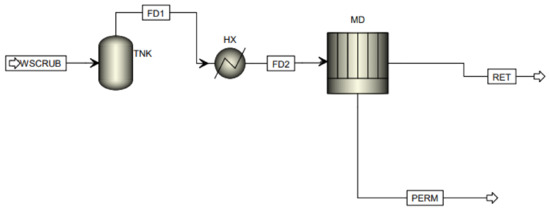
Figure 5.
MD system Aspen Plus® flowsheet [27].
During the simulation of the MD system, the coolant stream is considered to be water to be pumped from the surroundings (e.g., from a river) with an ambient temperature of between 25 to 27 °C (the ambient temperature of water in Ghana).
3.2. Thermal Energy Analysis of MD Systems
The permeate flux, or simply flux, of an MD (Jp) is considered the most relevant metric used in the assessment of any membrane technology. It is defined as the flow rate of permeate flowing through the membrane measured in kg/m2 s and can be expressed mathematically as [29]
where is the mass flow rate of the permeate measured in kg/s and A is the effective membrane area measured in m2.
The thermal efficiency (TE) or evaporative thermal efficiency of MD systems is defined as the ratio of the latent heat of vaporization to the total (latent and conduction) heat. The TE of MD systems is considered an effective tool in the measurement of desired thermal transport. It can be expressed mathematically as [29]
where ∆Hv,w refers to the enthalpy of vaporization of the water in kJ/kg, and Qm is the total heat flux through the membrane in kW, which can be determined by using the relation in Equation (3).
In this expression, refers to the feed mass flow rate measured in kg/s, refers to the feed water specific heat measured in kJ/kg °C, while and refer to the inlet and outlet feed water temperatures, respectively, measured in °C.
Another important parameter for evaluation of the thermal performance of an MD system is specific energy consumption (SEC). It is defined as the energy required to produce 1 m3 of distillate water in MD systems and can be determined using the following relation [30]
where ρ refers to the density of water measured in kg/m3.
Gained output ratio (GOR) is defined as the ratio of thermal energy that is required to produce distillate water in an MD system to the energy input to the system. GOR, a dimensionless parameter, can be expressed mathematically using the following equation [31]
where Ein refers to the total power input to the system measured in kW.
4. Results and Discussion
In this section, results for both the wet scrubbing and MD processes (including a parametric analysis on the MD system) are presented and discussed.
4.1. Results from the Wet Scrubbing Process
Table 3 presents some key simulation results of the wet scrubbing process. The temperature of the flue gas condensate was 56.7 °C, at a pressure 1.01 bar. The temperature of the flue gas condensate was above its dew temperature. The temperature of the cleaned flue gas (after acid gas cleaning) which continues into the stack to be emitted into the atmosphere is 52.2 °C at a pressure of 1.01325 bar and this is also above its dew point. In all the process can achieve an overall cleaning efficiency of over 99% for SO2 and over 95% for HCl. There was also a little reduction in the other constituents of the flue gases exiting the wet scrubber at the end of the cleaning process. The total flow rate of liquid feed used in the wet scrubbing was 70,000 kg/h of water, 35,000 kg/h in the first scrubber and 35,000 kg/h in the second scrubber. It must be noted that in the second scrubber the liquid feed is a mixture of water and CaCO3. (The mole fraction ratio of water to CaCO3 is 0.9:0.1).
Table 3.
Simulation results from the wet scrubbing process.
4.2. MD Model Simulation Results
This section presents the results obtained from the simulation of the optimized MD model used in the study. The thermal performance of the MD system is also presented and discussed. Table 4 list the results obtained after simulation of the MD model.
Table 4.
Simulation results from the MD system.
4.2.1. Thermal Efficiency
The thermal efficiency of the MD system was determined using Equation (2) when increasing the feed inlet temperature from 75 °C to 90 °C while maintaining the coolant inlet temperature at 26 °C. Values of the determined thermal efficiency against the corresponding feed inlet temperature are reported in Figure 6a. It can be observed in the figure that increasing the feed inlet temperature from 75 °C to 90 °C resulted in an increment of the TE from 50.7% to approximately 73%. This increment in TE can be attributed to the increase in permeation when the feed/concentrate inlet temperature increases. The thermal efficiency of the MD system was determined again using Equation (2), but this time increasing the coolant inlet temperature from 15 °C to 32 °C while maintaining the feed inlet temperature at 85 °C. Values of the determined thermal efficiency against the corresponding coolant inlet temperature are reported in Figure 6b. It can be observed that increasing the coolant inlet temperature from 15 °C to 32 °C decreases the TE from 75.4% to approximately 57%. This decrease in TE can be attributed to the low level of permeation due to the increase in the coolant inlet temperature. These results conform to the results obtained in research by Shahu et al. and Elmarghany et al. [32,33].
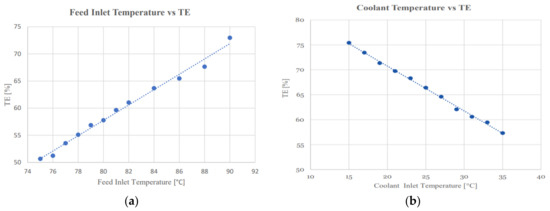
Figure 6.
Effects on increasing feed/coolant inlet temperature versus TE: (a) Effects on increasing feed inlet temperature vs. resulting SEC. (b) Effects on increasing coolant inlet temperature vs. resulting TE.
4.2.2. GOR
The GOR of the MD system was determined using Equation (3) by increasing the feed inlet temperature from 75 °C to 90 °C while maintaining the coolant temperature inlet temperature at 26 °C. The values of the determined GOR against the feed inlet temperature are reported in Figure 7a. It can be observed from that increasing the feed inlet temperature from 75 °C to 90 °C increases the GOR from 1.82 to 2.53. Increasing the feed inlet temperature increases permeation, which in turn increases the driving force of the permeate, as much less thermal energy is required to produce distillate water in the MD system. The GOR of the MD system was determined again using Equation (5), but this time increasing the coolant inlet temperature from 15 °C to 32 °C while maintaining the feed inlet temperature at 85 °C. Values of the GOR against the corresponding inlet temperature are reported in Figure 7b. It can be observed from the figure that increasing the coolant inlet temperature from 15 °C to 32 °C decreases the GOR from 2.72 to 2.06. This decrease can be attributed to the fact that increasing the coolant inlet temperature decreases the level of permeation and the driving force; therefore, higher amount of thermal energy is required to produce distillate water in the MD system. These results conform to the results obtained in research works carried out by Shahu et al. and Elmarghany et al. [32,33].
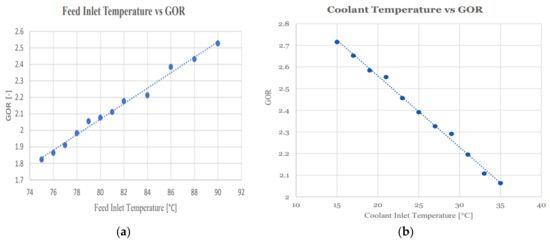
Figure 7.
Effects on increasing feed/coolant inlet temperature versus GOR: (a) Effects on increasing feed inlet temperature vs. resulting GOR. (b) Effects on increasing coolant inlet temperature vs. resulting GOR.
4.2.3. SEC
The SEC of the MD system was determined using Equation (3) by increasing the feed inlet temperature from 75 °C to 90 °C while maintaining the coolant temperature inlet temperature at 26 °C. The values of the determined SEC against the corresponding feed inlet temperature are reported in Figure 8a. It can be observed that increasing the feed inlet temperature from 75 °C to 90 °C decreases the SEC from 1237.4 kWh/m3 to approximately 860 kWh/m3. As mentioned earlier, increasing the feed inlet temperature increases permeation and thus increases the driving force of the permeate which in turn decreases the energy required to produce the distillate water, therefore decreasing the SEC. The SEC of the MD system was determined again using Equation (4), but this time increasing the coolant inlet temperature from 15 °C to 32 °C while maintaining the feed inlet temperature at 85 °C. The values of the determined SEC against the corresponding inlet temperature are reported in Figure 8b. It can be observed that increasing the coolant from 15 °C to 32 °C increases the SEC from 831.2 kWh/m3 to approximately 1074 kWh/m3. Increasing the coolant inlet temperature decreases the level of permeation which in turn decreases the driving force of the permeate, therefore more energy is needed to produce the distillate water. These results conform to the results obtained in research works carried out by Shahu et al. and Elmarghany et al. [32,33].
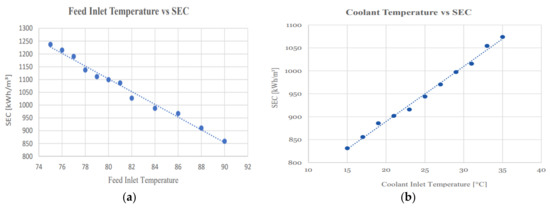
Figure 8.
Effects on increasing Feed/Coolant Inlet temperature versus SEC: (a) Effects on increasing feed inlet temperature vs. resulting SEC. (b) Effects on increasing coolant inlet temperature vs. resulting SEC.
5. Conclusions
The results obtained from the simulation of the MD process indicates it is possible to achieve almost 100% separation of the various constituents of the flue gas condensate. Additionally, a thermal performance assessment of the MD process indicates that increasing the feed/concentrate inlet while minimizing that of the coolant inlet temperature is the optimum means of operating the MD. It is therefore imperative to state that the coolant inlet temperature of 25 °C is reasonable and the feed inlet temperature should be at 90 °C.
Results obtained earlier from the simulation of the wet FGD model indicate almost 100% cleaning of acid gases (HCl and SO2) from the flue gas stream, where a total volumetric flow rate of 20 m3/h was used in the process. The total flue gas condensate produced at the end of the process was approximately 19.44 m3/h.
In conclusion, it is worth noting that the energy recovered during the cooling of the flue gas stream prior to PM separation is adequate for the operation of the integrated MD system, and the wet FGD technology is an effective method of cleaning acid gases from flue gas streams (achieving separation efficiencies of over 95% for the HCl and over 99% for the SO2). In addition, the MD technology is an effective method that can be used in the separation of these acid gases in the flue gas condensate produced in the wet FGD technology.
It is recommended that a techno-economics analysis on both the wet FGD and MD technologies are performed on a typical waste incineration plant with energy recovery, with Ghana as the location for the operation of the plant.
Author Contributions
Conceptualization, N.Y. and A.M.; methodology, N.Y. and A.M.; software, N.Y., M.S, and I.-e.N.; validation, N.Y.; formal analysis, N.Y.; writing—original draft preparation, N.Y.; writing—review and editing, N.Y., M.S., I.-e.N., A.M., and A.S.; supervision, A.M., and A.S.; All authors have read and agreed to the published version of the manuscript.
Funding
This research received no external funding. The APC was funded by a discount voucher received by A.M.
Data Availability Statement
Not applicable.
Acknowledgments
Authors wish to thank University of Mines and Technology, (UMaT), Tarkwa, Ghana and Royal Institute of Technology (KTH), Stockholm, Sweden for their support.
Conflicts of Interest
The authors declare no conflict of interest.
References
- Dong, J.; Tang, Y.; Nzihou, A.; Chi, Y.; Weiss-Hortala, E.; Ni, M.; Zhou, Z. Comparison of waste-to-energy technologies of gasification and incineration using life cycle assessment: Case studies in Finland, France and China. J. Clean. Prod. 2018, 203, 287–300, ISSN 0959-6526. [Google Scholar] [CrossRef]
- Demirbas, A. Combustion Systems for Biomass Fuel. Energy Sources Part A Recovery Util. Environ. Eff. 2007, 29, 303–312. [Google Scholar] [CrossRef]
- Lombardi, L.; Carnevale, E.; Corti, A. A review of technologies and performances of thermal treatment systems for energy recovery from waste. Waste Manag. 2015, 37, 26–44. [Google Scholar] [CrossRef]
- The World Bank. Municipal Solid Waste Incineration: Technical Guidance Report; Technical Report; The International Bank for Reconstruction and Development: Washington, DC, USA, 1999; Available online: https://goo.gl/kABenL (accessed on 20 October 2020).
- Mohajan, H. Acid Rain is a Local Environment Pollution but Global Concern. Open Sci. J. Anal. Chem. 2019, 3, 47–55. [Google Scholar]
- Neuwahl, F.; Cusano, G.; Benavides, J.G.; Holbrook, S.; Roudier, S. Best Available Techniques (BAT) Reference Document for Waste Incineration; Report; Publication Office of the European Union: Luxembourg, 2019. [Google Scholar] [CrossRef]
- Johnke, G. Draft of a German Report with Basic Informations for a BREF-Document “Waste Incineration”; Report. 2001. Available online: http://files.gamta.lt/aaa/Tipk/tipk/4_kiti%20GPGB/63.pdf (accessed on 13 December 2021).
- Zhao, G. Theoretical Study for Sulfur Dioxide Absorption on Limestone Wet Flue Gas Desulphurization. Master’s Thesis, Northeastern University, Shenyang, China, 2008. [Google Scholar]
- Carletti, C.; Bjondahl, F.; De Blasio, C.; Ahlbeck, J.; Järvinen, L.; Westerlund, T. Modeling limestone reactivity and sizing the dissolution tank in wet flue gas desulfurization scrubbers. Environ. Prog. Sustain. Energy 2013, 32, 663–672. [Google Scholar] [CrossRef]
- Lecomte, T.; Ferreria De La Fuente, J.; Neuwahl, F.; Canova, M.; Pinasseau, A.; Jankov, I.; Brinkmann, T.; Roudier, S.; Delgado Sancho, L. Best Available Techniques (BAT) Reference Document for Large Combustion Plants. Industrial Emissions Directive 2010/75/EU (Integrated Pollution Prevention and Control); EUR 28836 EN; Publications Office of the European Union: Luxembourg, 2017; ISBN 978-92-79-74303-0. [Google Scholar] [CrossRef]
- Noor, I.-e.; Martin, A.; Dahl, O. Water recovery from flue gas condensate in municipal solid waste fired cogeneration plants using membrane distillation. Chem. Eng. J. 2020, 399, 125707. [Google Scholar] [CrossRef]
- Alkhudhiri, A.; Darwish, N.; Hilal, N. Membrane distillation: A comprehensive review. Desalination 2012, 287, 2–18. [Google Scholar] [CrossRef]
- Camacho, L.M.; Dumée, L.; Zhang, J.; Li, J.-d.; Duke, M.; Gomez, J.; Gray, S. Advances in Membrane Distillation for Water Desalination and Purification Applications. Water 2013, 5, 94–196. [Google Scholar] [CrossRef]
- Qtaishat, M.R.; Banat, F. Desalination by solar powered membrane distillation systems. Desalination 2013, 308, 186–197. [Google Scholar] [CrossRef]
- Rahaoui, K.; Ding, L.C.; Tan, L.P.; Mediouri, W.; Mahmoudia, F.; Nakoa, K.; Akbarzadeh, A. Sustainable Membrane Distillation Coupled with Solar Pond. Energy Procedia 2017, 110, 414–419. [Google Scholar] [CrossRef]
- Liu, H.; Wang, J. Treatment of radioactive wastewater using direct contact membrane distillation. J. Hazard. Mater. 2013, 261, 307–315. [Google Scholar] [CrossRef]
- Korolkov, I.V.; Yeszhanov, A.B.; Zdorovets, M.V.; Gorin, Y.G.; Güven, O.; Dosnagambetova, S.S.; Khlebnikov, N.A.; Serkv, K.V.; Krasnopyorova, M.V.; Milts, O.S.; et al. Modification of PET ion track membranes for membrane distillation of low-level liquid radioactive wastes and salt solutions. Sep. Purif. Technol. 2019, 227, 115694. [Google Scholar] [CrossRef]
- Ricceri, F.; Giagnorio, M.; Farinelli, G.; Blandini, G.; Minella, M.; Vione, D.; Tiraferri, A. Desalination of Produced Water by Membrane Distillation: Effect of the Feed Components and of a Pre-treatment by Fenton Oxidation. Sci. Rep. 2019, 9, 14964. [Google Scholar] [CrossRef]
- Tavakkoli, S.; Lokare, O.; Vidic, R.; Khanna, V. Shale gas produced water management using membrane distillation: An optimization-based approach. Resour. Conserv. Recycl. 2020, 158, 104803. [Google Scholar] [CrossRef]
- Said, I.A.; Chomiak, T.R.; He, Z.; Li, Q. Low-cost high-efficiency solar membrane distillation for treatment of oil produced waters. Sep. Purif. Technol. 2020, 250, 117170. [Google Scholar] [CrossRef]
- Chuanfeng, L.; Martin, A. Membrane Distillation and Applications for Water Purification in Thermal Cogeneration—A Pre-study; Varmeforsk Service AB: Stockholm, Sweden, 2005; ISSN 0282-3772. [Google Scholar]
- Kullab, A. Desalination using Membrane Distillation: Experimental and Numerical Study. Ph.D. Thesis, KTH Royal Institute of Technology, Stockholm, Sweden, 2011. [Google Scholar]
- Jurczyk, M.; Mikus, M.; Dziedzic, K. Flue Gas Cleaning in Municipal Waste-to-Energy Plants—Part II; Nr. IV/2/2016; Polska Akademia Nauk Oddział w Krakowie, Komisja Technicznej Infrastruktury Wsi: Krakow, Poland, 2016; pp. 1309–1321. Available online: http://dx.medra.org/10.14597/infraeco.2016.4.2.096 (accessed on 20 November 2021).
- Hellman, M. Handbok i Vattenkemi för energianläggningar; Energiforsk, Stockholm, Sweden. 2015. Available online: https://energiforsk.se/program/branslebaserad-el-och-varmeproduktion-sebra/rapporter/handbookk-for-vattenkemi-for-energianlaggningar/ (accessed on 23 October 2021).
- Goldschmidt, H.O.B.; Carlström, H. Benchmarking of Flue Gas Condensate Cleaning Technologies in Waste-to-Energy Plants; Energiforsk: Stockholm, Sweden, 2011; Available online: https://energiforskmedia.blob.core.windows.net/media/17905/teknikval-vid-rening-av-roekgaskondensat-i-avfallsfoerbraenningsanlaeggningar-vaermeforskrapport-1184.pdf (accessed on 6 December 2021).
- Matthews, C. Flue gas desulphurization—Total design. In Case Studies in Engineering Design; Matthews, C., Ed.; Butterworth-Heinemann: London, UK, 1998; pp. 217–231. [Google Scholar] [CrossRef]
- Solids|Process Modeling|Aspentech. Available online: https://www.aspentech.com/en/products/pages/solids (accessed on 1 November 2021).
- Noor, I.-e.; Samavati, M.; Martin, A. Evaluation of membrane distillation system for flue gas condensate cleaning. In Proceedings of the ECOS 2020—The 33rd International Conference on Efficiency, Cost, Optimization, Simulation and Environmental Impact of Energy Systems, Osaka, Japan, 29 June–3 July 2020. [Google Scholar]
- Swaminathan, J.; Chung, H.W.; Warsinger, D.M.; Lienhard, V.J.H. Energy efficiency of membrane distillation up to high salinity: Evaluating critical system size and optimal membrane thickness. Appl. Energy 2018, 211, 715–734. [Google Scholar] [CrossRef]
- Soomro, M.L.; Kim, W.S. Parabolic-trough plant integrated with direct-contact membrane distillation system: Concept, simulation, performance, and economic evaluation. Sol. Energy 2018, 173, 348–361. [Google Scholar] [CrossRef]
- Khayet, M. Solar desalination by membrane distillation: Dispersion in energy consumption analysis and water production costs (a review). Desalination 2013, 308, 89–101. [Google Scholar] [CrossRef]
- Shahu, V.T.; Thombre, S.B. Theoretical analysis and parametric investigation of an innovative helical air gap membrane desalination system. Appl. Water Sci. 2022, 12, 18. [Google Scholar] [CrossRef]
- Elmarghany, M.R.; El-Shazly, A.H.; Salem, M.S.; Sabry, M.N.; Nady, N. Thermal analysis evaluation of direct contact membrane distillation system. Case Stud. Therm. Eng. 2019, 13, 100377. [Google Scholar] [CrossRef]
Publisher’s Note: MDPI stays neutral with regard to jurisdictional claims in published maps and institutional affiliations. |
© 2022 by the authors. Licensee MDPI, Basel, Switzerland. This article is an open access article distributed under the terms and conditions of the Creative Commons Attribution (CC BY) license (https://creativecommons.org/licenses/by/4.0/).