Energy and Greenhouse Gas Savings for LEED-Certified U.S. Office Buildings

Abstract
1. Introduction
2. Materials and Methods
2.1. Benchmarking Data
2.2. LEED Building Identification
2.3. Site, Source, Electric, and Non-Electric Energy
2.4. Comparing Energy Metrics between Building Sets
2.5. Imputing Design Energy Savings from EAc1 Scores
3. Results
3.1. Offices Compared between Cities
3.2. Comparing LEED with Non-LEED Offices
3.3. Impact of Building Age
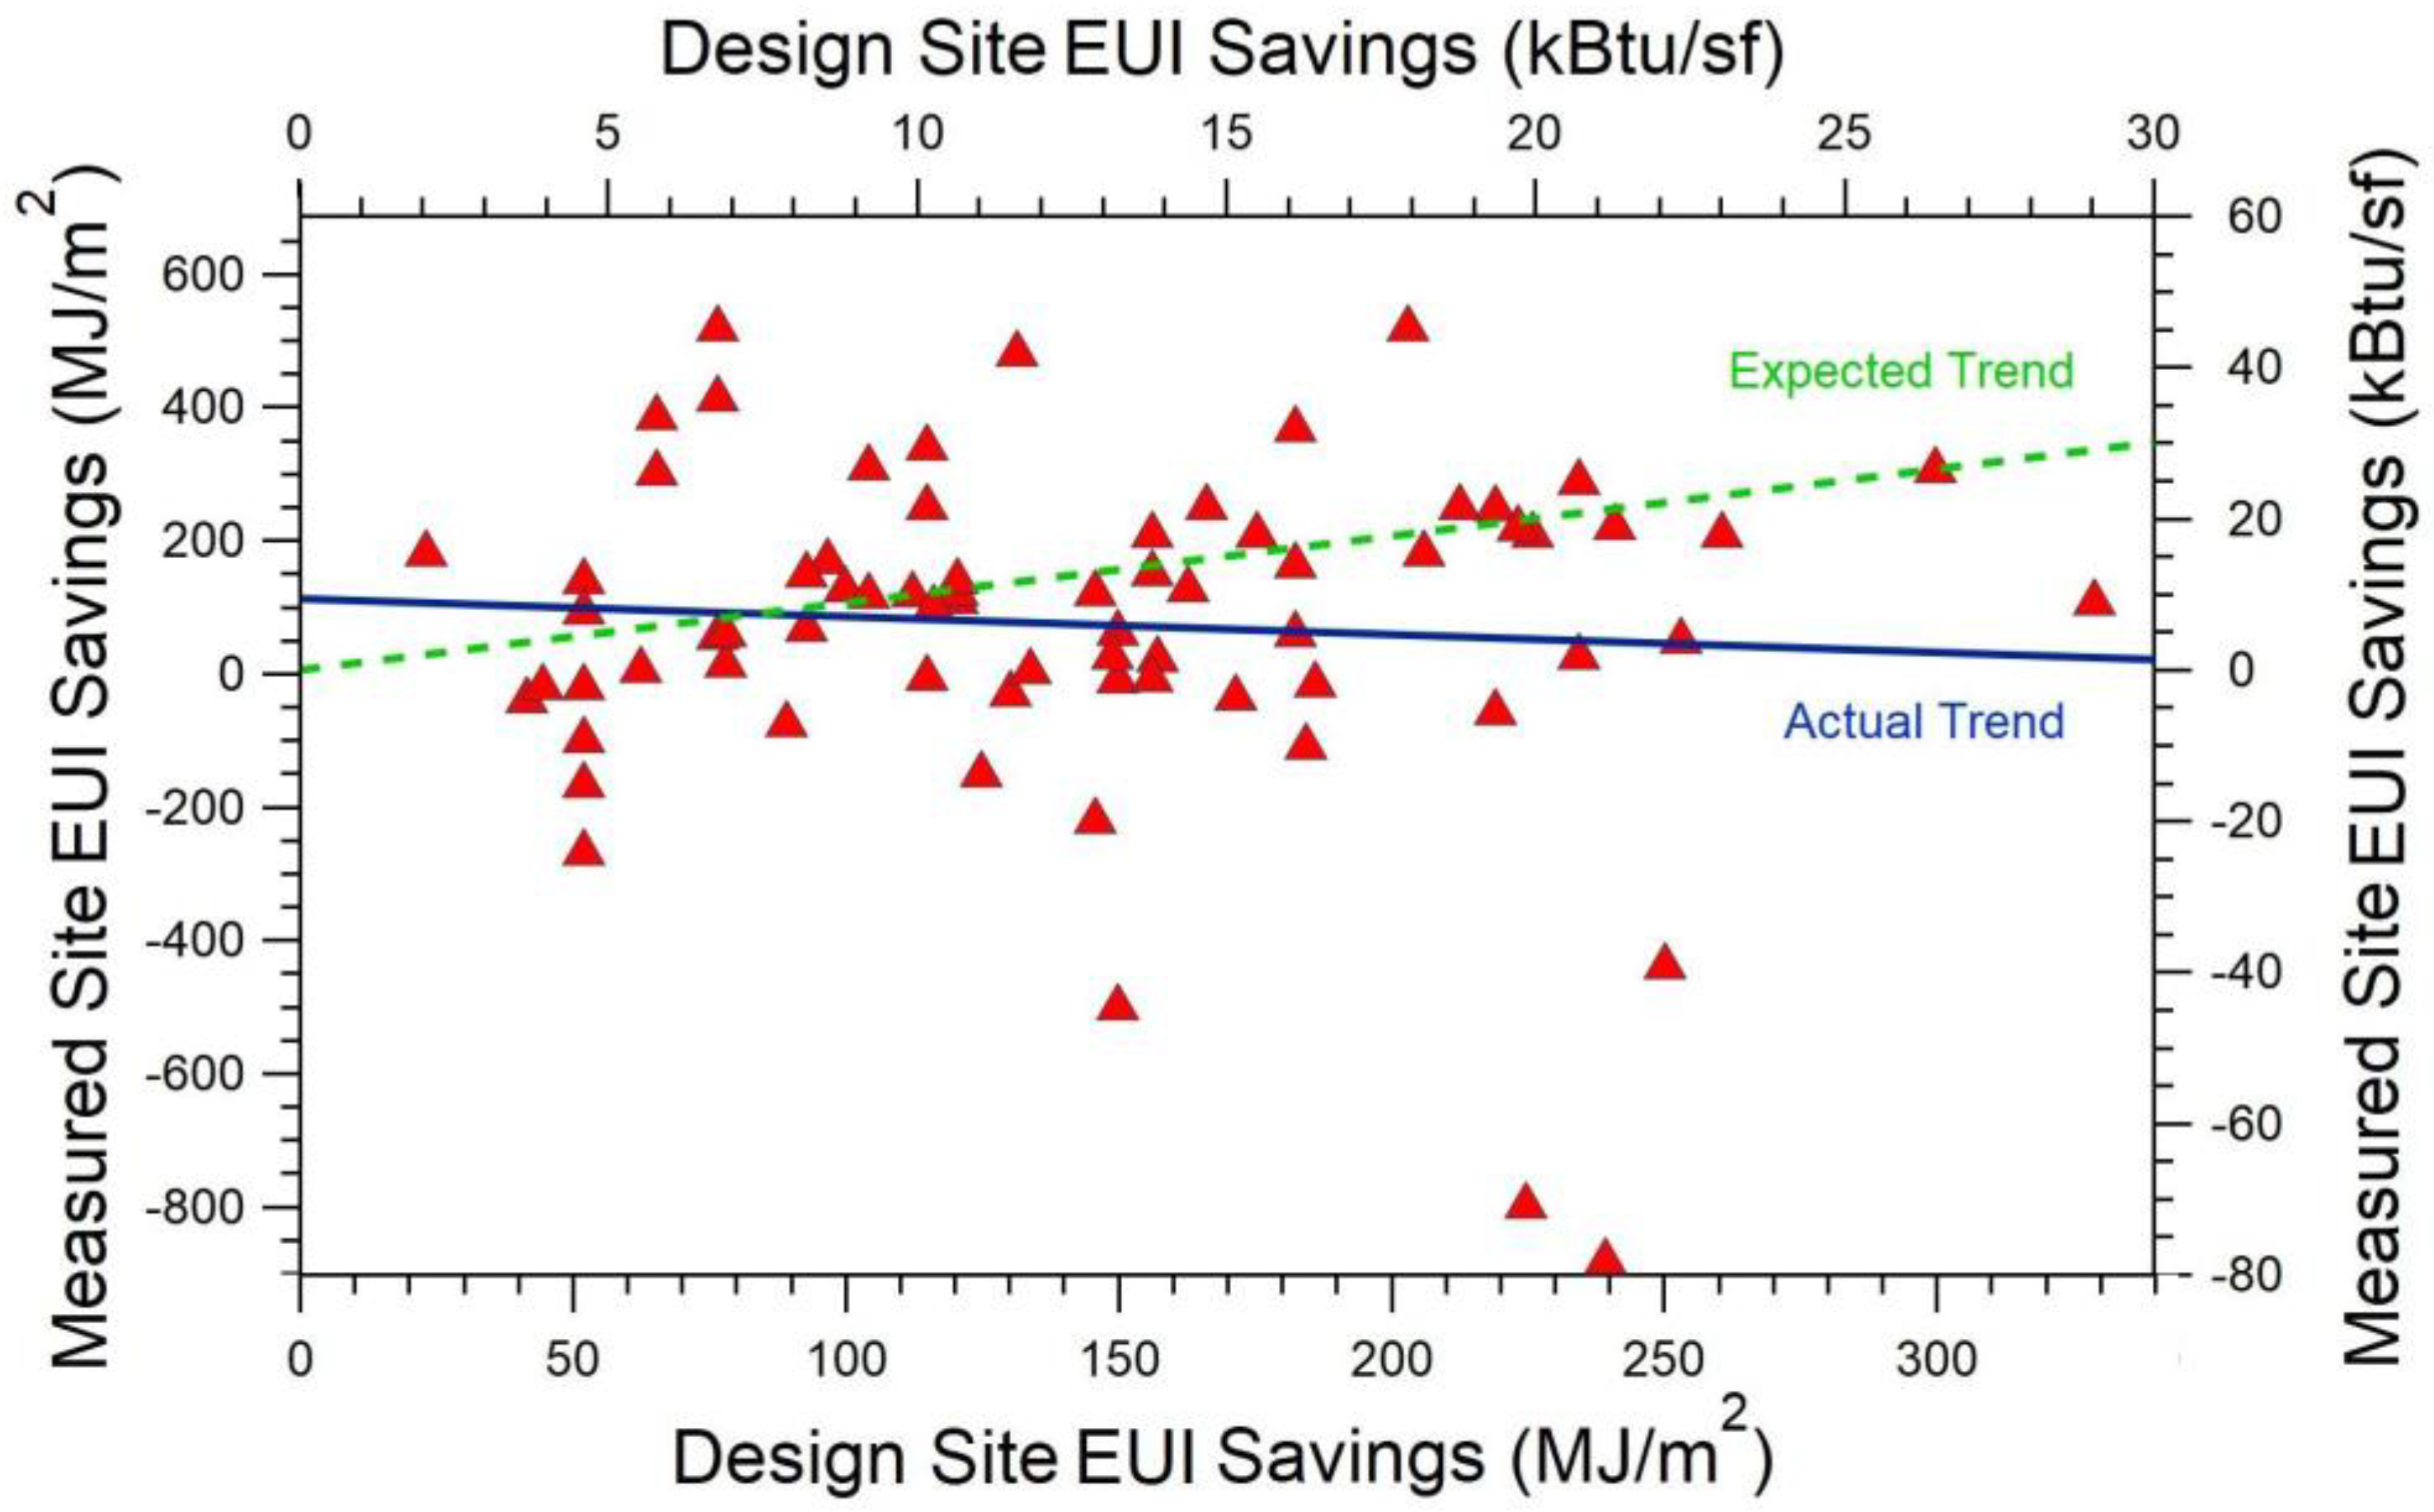
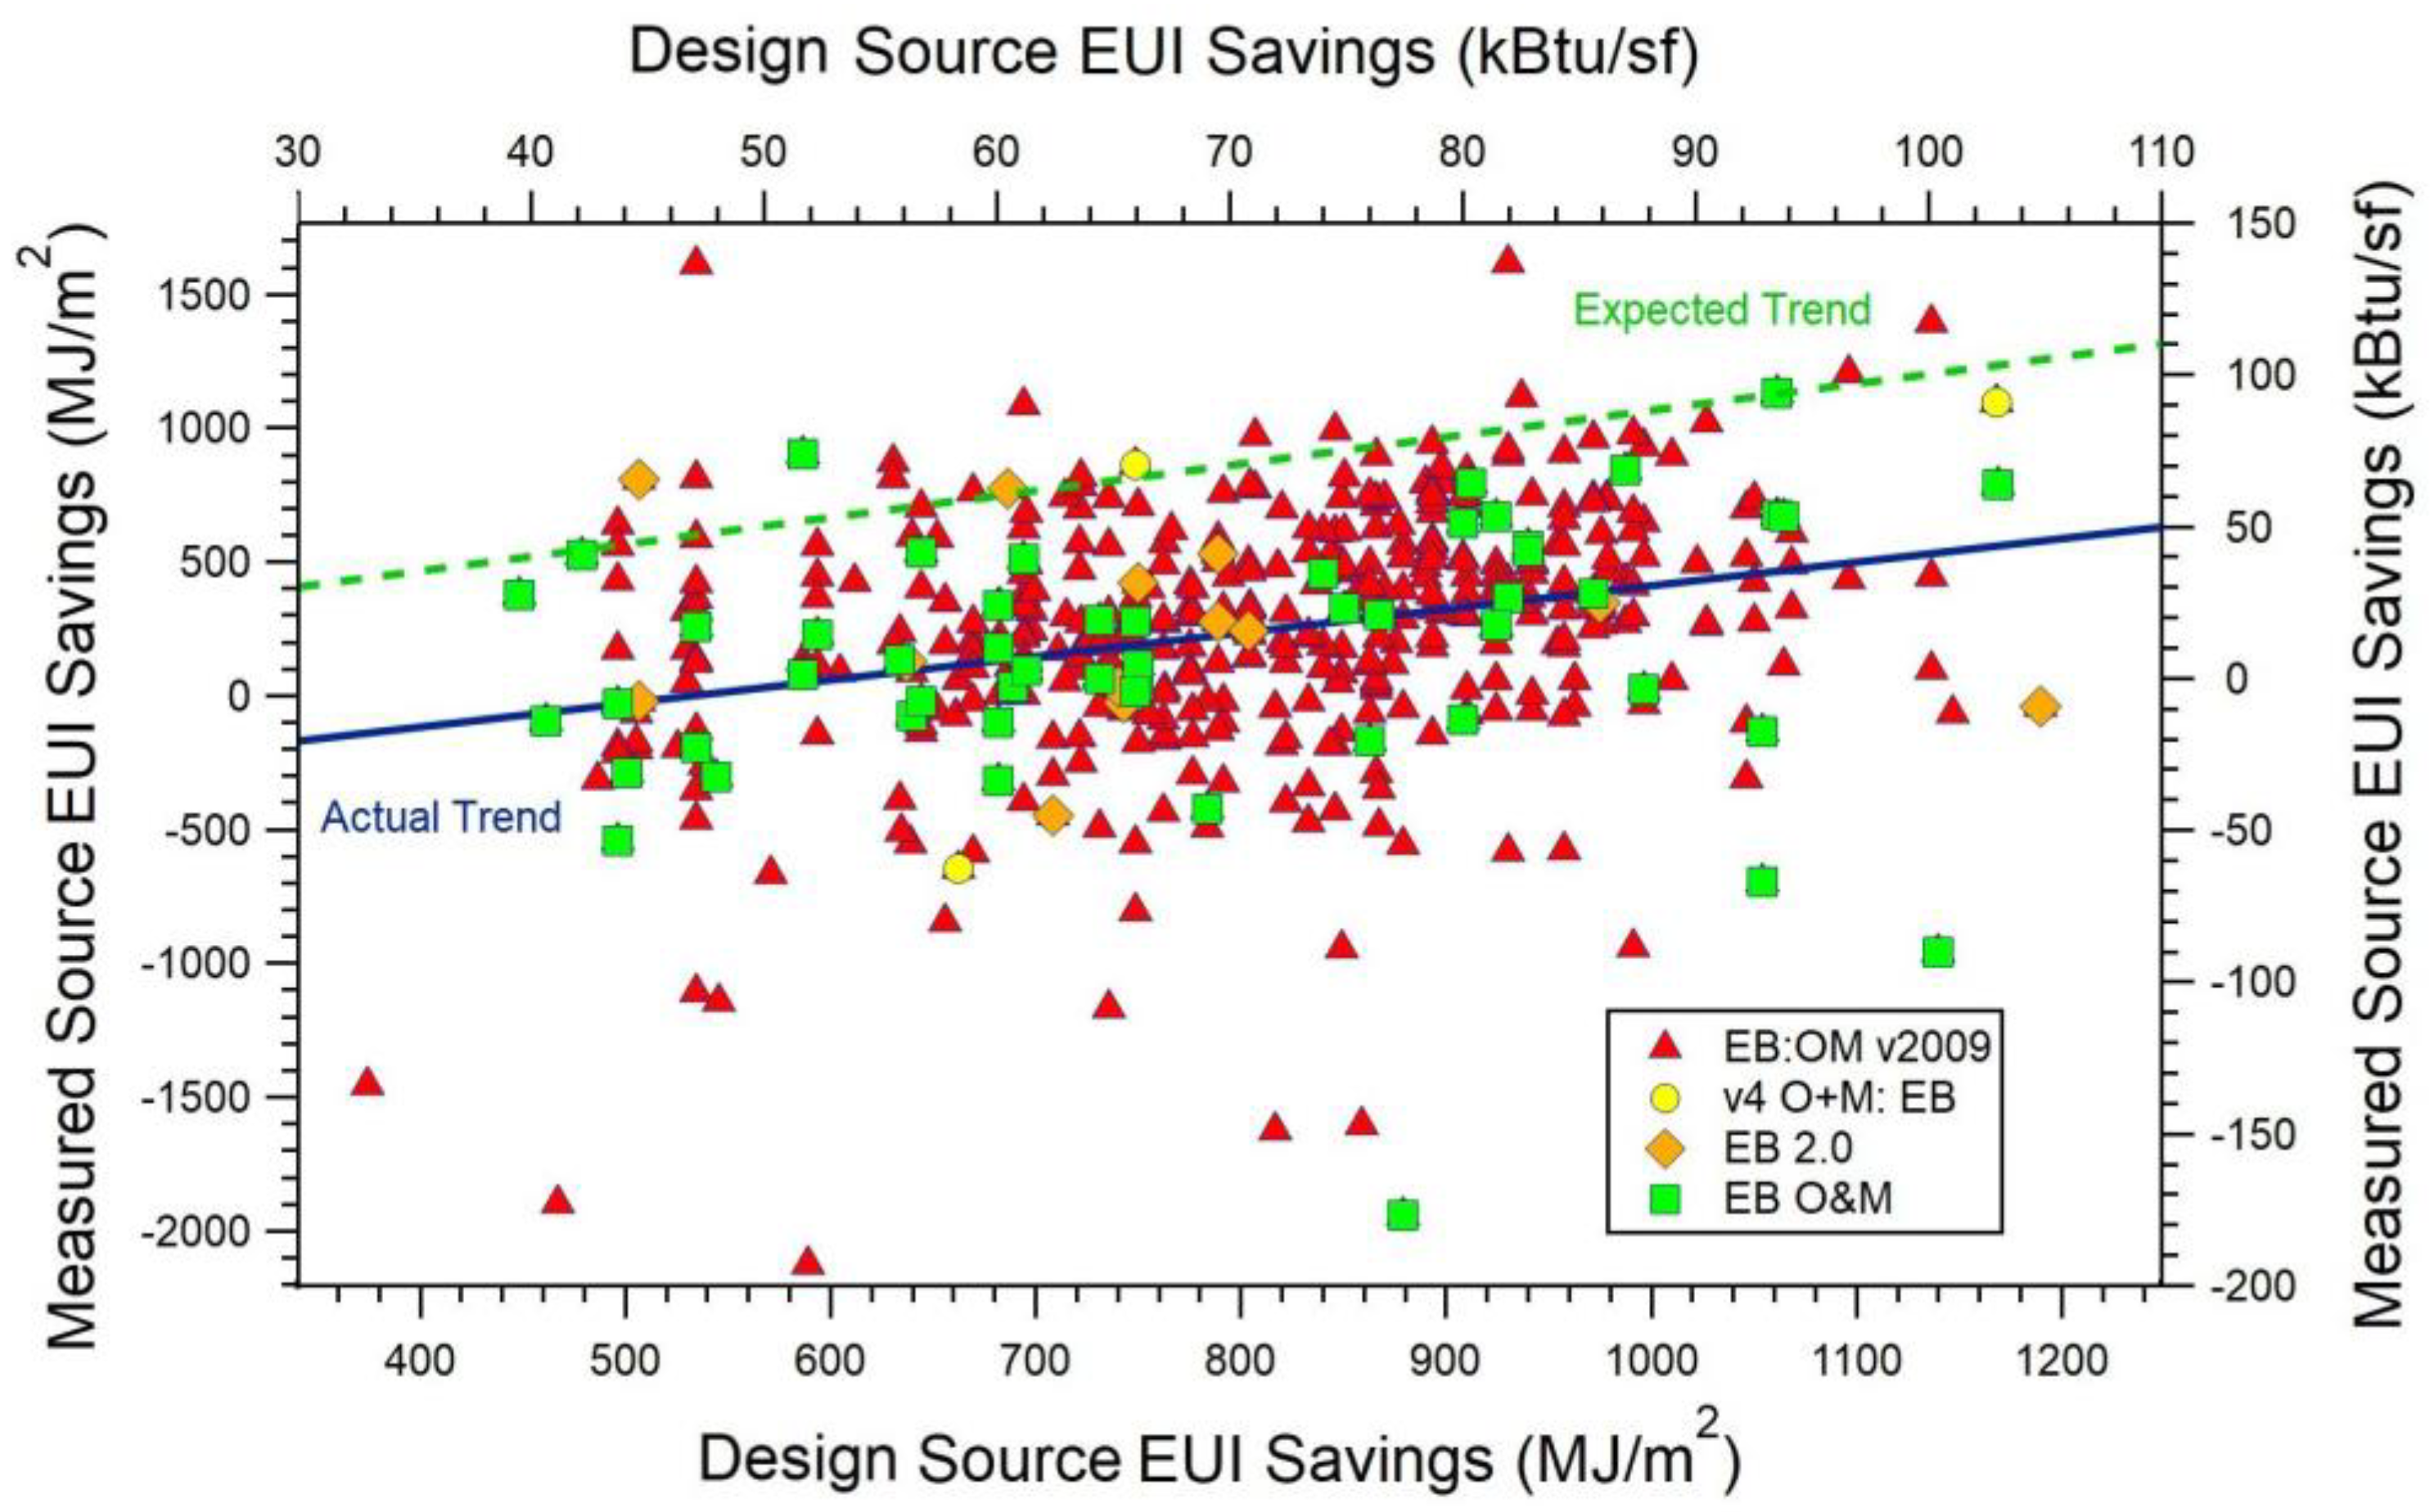
3.4. Comparing Measured with Predicted LEED Savings
4. Discussion
5. Summary and Conclusions
Supplementary Materials
Author Contributions
Funding
Institutional Review Board Statement
Informed Consent Statement
Data Availability Statement
Acknowledgments
Conflicts of Interest
References
- Carbon Emissions, Energy Flow Charts for all U.S. States. Available online: https://www.llnl.gov/news/carbon-emissions-energy-flow-charts-all-us-states (accessed on 25 December 2020).
- MacNaughton, P.; Cao, X.; Buonocore, J.; Cedeno-Laurant, J.; Sprengle, J.; Bernstein, A.; Allen, J. Energy savings, emission reductions, and health co-benefits of the green building movement. J. Expo. Sci. Environ. Epidemiol. 2018, 28, 307–318. [Google Scholar] [CrossRef]
- American Physical Society. Energy Future: Think Efficiency. 2008. Available online: http://www.aps.org/energyefficiencyreport/index.cfm (accessed on 30 December 2020).
- U.S. Green Building Council. Available online: https://new.usgbc.org/ (accessed on 30 December 2020).
- U.S. General Services Administration, LEED Building Information. Available online: https://www.gsa.gov/real-estate/design-construction/design-excellence/sustainability/sustainable-design/leed-building-information (accessed on 30 December 2020).
- USGBC LEED Project Database. Available online: http://www.usgbc.org/projects (accessed on 30 December 2020).
- Scofield, J.H.; Cornell, J. A critical look at ‘Energy savings, emissions reductions, and health co-benefits of the green building movement’. J. Expo. Sci. Environ. Epidemiol. 2018, 29, 584–593. [Google Scholar] [CrossRef] [PubMed]
- National Research Council. Energy-Efficiency Standards and Green Building Certification Systems Used by the Department of Defense for Military Construction and Major Renovations; The National Academies Press: Washington, DC, USA, 2013. [Google Scholar] [CrossRef]
- U.S. Energy Information Administration’s 2012 Commercial Building Energy Consumption Survey. Available online: https://www.eia.gov/consumption/commercial/data/2012/ (accessed on 30 December 2020).
- Turner, C.; Frankel, M. Energy Performance of LEED for New Construction Buildings—Final Report; New Buildings Institute: White Salmon, WA, USA, 2008; Available online: http://newbuildings.org/resource/energy-performance-leed-new-construction-buildings/ (accessed on 30 December 2020).
- Gifford, H. A Better Way to Rate Green Buildings. Available online: http://www.solaripedia.com/files/223.pdf (accessed on 3 January 2020).
- Scofield, J.H. A re-examination of the NBI LEED Building Energy Consumption Study. In Proceedings of the International Energy Program Evaluation Conference (IEPEC), Portland, OR, USA, 12–14 August 2009. [Google Scholar]
- Lstiburek, J. Why green can be wash. ASHRAE J. 2008, 50, 28–36. [Google Scholar]
- Newsham, G.; Mancini, S.; Birt, B.J. Do LEED-certified buildings save energy? Yes, but…. Energy Build. 2009, 41, 897–905. [Google Scholar] [CrossRef]
- Scofield, J.H. Do LEED-certified buildings save energy? Not really…. Energy Build. 2009, 41, 1386–1390. [Google Scholar] [CrossRef]
- Menassa, C.; Mangasarian, S.; El Asmar, M.; Kirar, C. Energy consumption evaluation of U.S. Navy LEED certified buildings. J. Perform. Constr. Facil. 2012, 25, 46–53. [Google Scholar] [CrossRef]
- Oates, D.; Sullivan, K.T. Post-occupancy energy consumption survey of Arizona’s LEED new construction population. J. Constr. Eng. Manag. 2012, 138, 742–750. [Google Scholar] [CrossRef]
- Issa, M.H.; Attalla, M.; Rankin, J.H.; Christian, J. Energy consumption in conventional, energy-retrofitted and green LEED Toronto schools. Constr. Manag. Econ. 2011, 29, 383–395. [Google Scholar] [CrossRef]
- Agdas, D.; Srinivasan, R.S.; Frost, K.; Masters, F.J. Energy use assessment of educational buildings: Toward a campus-wide sustainable energy policy. Sustain. Cities Soc. 2015, 17, 15–21. [Google Scholar] [CrossRef]
- Chokor, A.; El Asmar, M. A Novel Modeling Approach to Assess the Electricity Consumption of LEED-Certified Research Buildings Using Big Data Predictive Methods. In Proceedings of the Construction Research Congress 2016: Old and New Construction Technologies Converge in Historic San Juan—Proceedings of the 2016 Construction Research Congress, CRC 2016, San Juan, Puerto Rico, 31 May–2 June 2016; American Society of Civil Engineers (ASCE): Reston, VA, USA, 2016; pp. 1040–1049. [Google Scholar]
- Jeong, J.; Hong, T.; Ji, C.; Kim, J.; Lee, M.; Jeong, K. Development of an evaluation process for green and non-green buildings focused on energy performance of G-SEED and LEED. Build. Environ. 2016, 105, 172–184. [Google Scholar] [CrossRef]
- Asensio, O.I.; Delmas, M.A. The effectiveness of US energy efficiency labels. Nat. Energy 2017, 2, 1–8. [Google Scholar] [CrossRef]
- Scofield, J.H. Efficacy of LEED-certification in reducing energy consumption and greenhouse gas emission for large New York City office buildings. Energy Build. 2013, 67, 517–524. [Google Scholar] [CrossRef]
- Scofield, J.H.; Doanes, J. Energy performance of LEED-certified buildings from 2015 Chicago benchmarking data. Energy Build. 2018, 174, 402–413. [Google Scholar] [CrossRef]
- Institute for Market Transformation, Building Ratings. Available online: https://www.buildingrating.org (accessed on 6 January 2020).
- Energy Star Portfolio Manager. Available online: https://www.energystar.gov/buildings/facility-owners-and-managers/existing-buildings/use-portfolio-manager (accessed on 6 January 2020).
- U.S. Environmental Protection Agency, Emissions & Generation Resource Integrated Database (eGRID). Available online: https://www.epa.gov/energy/emissions-generation-resource-integrated-database-egrid (accessed on 30 December 2020).
- QGIS: A Free and Open Source Geographic Information System. Available online: https://www.qgis.org/en/site/ (accessed on 30 December 2020).
- The Green Building Information Gateway. Available online: http://www.gbig.org/ (accessed on 30 December 2020).
- Energy Star Portfolio Manager Technical Reference: Source Energy. Available online: https://portfoliomanager.energystar.gov/pdf/reference/Source%20Energy.pdf (accessed on 30 December 2020).
- Lock, R.H.; Frazer-Lock, P.; Lock-Morgan, K.; Lock, E.F.; Lock, D.F. Statistics: Unlocking the Power of Data, 2nd ed.; John Wiley & Sons: Hoboken, NJ, USA, 2017. [Google Scholar]
- Scofield, J.H. Building Energy Star Scores: Good Idea, Bad Science; CreateSpace Independent Publishing Platform: Scotts Valley, CA, USA, 2016; Chapter 17; pp. 260–265. [Google Scholar]
- New York City Local Law 84 Benchmarking Report, August 2012. Available online: http://www.nyc.gov/html/gbee/downloads/pdf/nyc_ll84_benchmarking_report_2012.pdf (accessed on 30 December 2020).
- Scofield, J.H.; Richman, G. Results of Validation Tests Applied to Seven ENERGY STAR Building Models. In Proceedings of the 2015 International Energy Program Evaluation Conference, Long Beach, CA, USA, 11–13 August 2015; Available online: https://www.iepec.org/wp-content/uploads/2015/papers/158.pdf (accessed on 29 January 2021).
- Energy Star Portfolio Manager Technical Reference: Energy Star Score for Offices in the United States. 2019. Available online: https://www.energystar.gov/sites/default/files/tools/Office_August_2019_508.pdf (accessed on 30 December 2020).
- Carbon Neutral Cities Alliance (CNCA). Available online: https://carbonneutralcities.org/ (accessed on 30 December 2020).
- Chicago Climate Action Plan (2008). Available online: https://www.chicago.gov/city/en/progs/env/climateaction.html (accessed on 30 December 2020).
- The Building Electrification Initiative. Available online: https://www.beicities.org/about (accessed on 30 December 2020).
- Dennis, K.; Colburn, K.; Lazar, J. Environmentally Beneficial Electrification: The Dawn of “Emissions Efficiency”. Electr. J. 2016, 29, 52–58. [Google Scholar] [CrossRef]
- U.S. Energy Information Administration. U.S. Energy-Related Carbon Dioxide Emissions, 2018. 2019. Available online: https://www.eia.gov/environment/emissions/carbon/ (accessed on 30 December 2020).
- U.S. Energy Information Administration. Annual Energy Outlook 2019 with Projections to 2050. #AEO2019; 2019. Available online: https://www.eia.gov/outlooks/aeo/pdf/aeo2019.pdf (accessed on 7 March 2020).


| Non-LEED | Site | Electric | Non-Electric | Source | GHG | |||||||
|---|---|---|---|---|---|---|---|---|---|---|---|---|
| City | N | A(106 m2) | Mean | SDm | Mean | SDm | Mean | SDm | Mean | SDm | Mean | SDm |
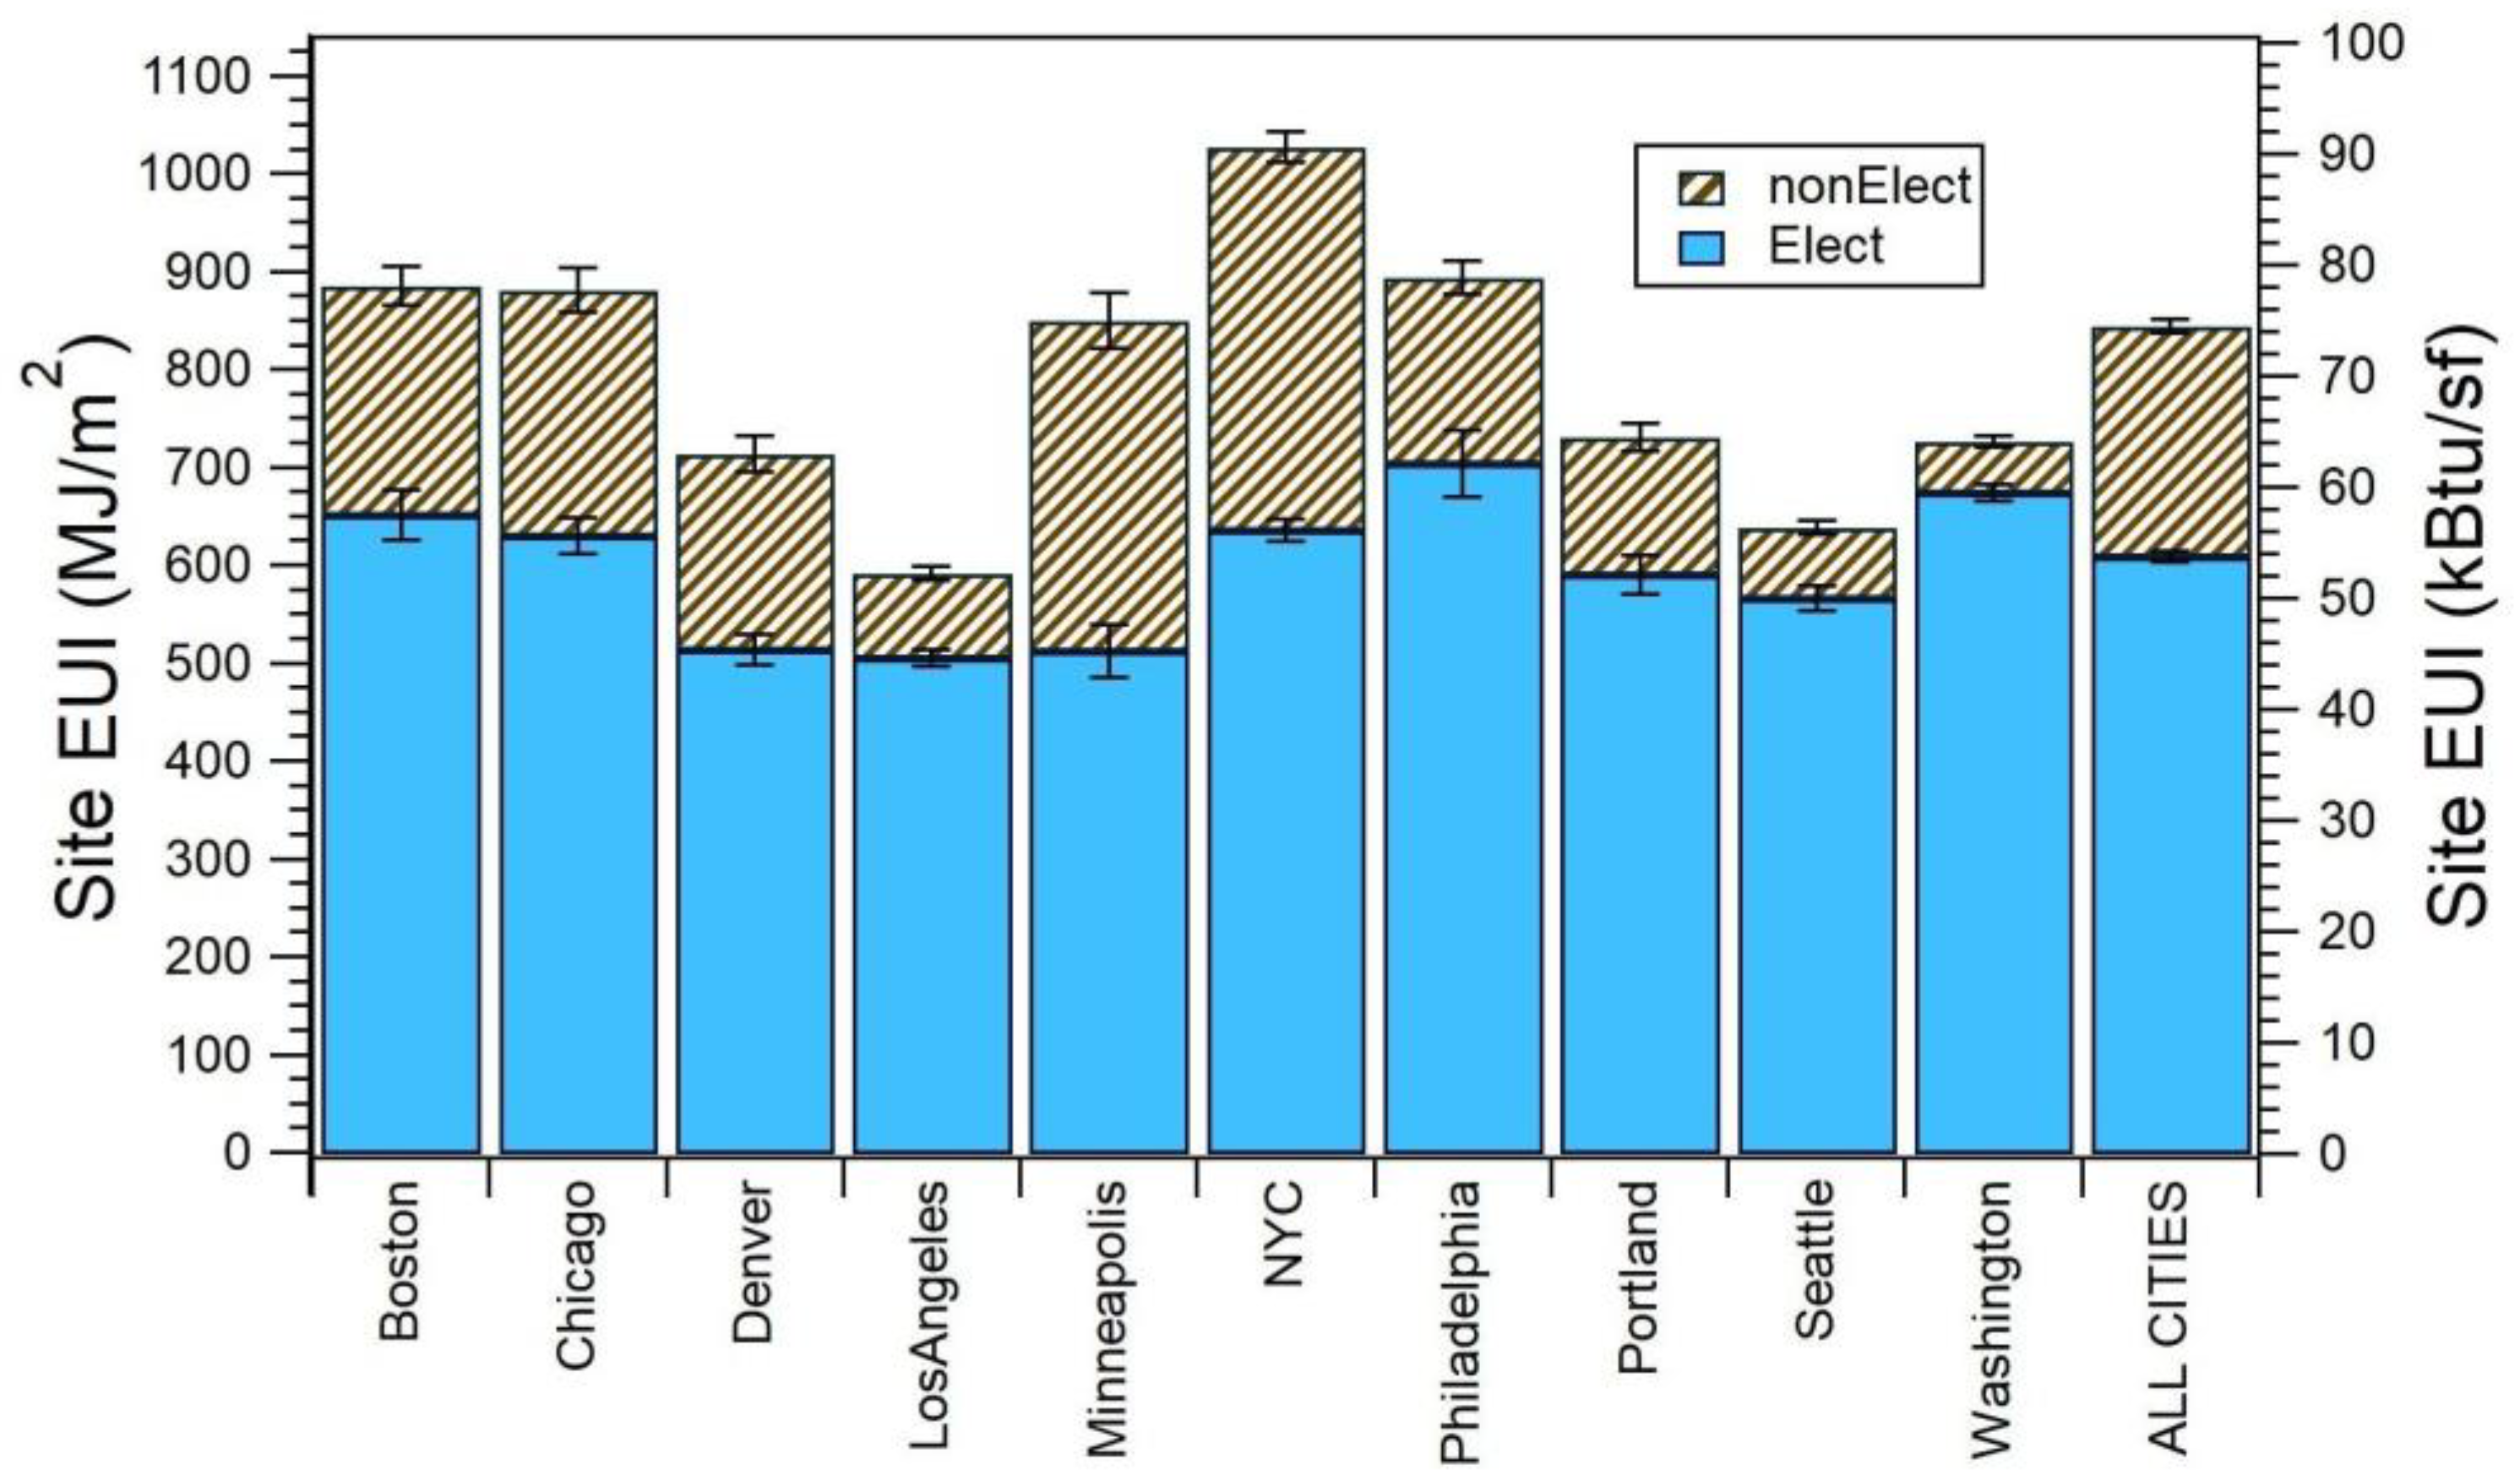
| Boston | 239 | 4.33 | 930 | 36 | 684 | 34 | 245 | 26 | 2406 | 103 | 68.5 | 2.8 |
| Chicago | 244 | 7.18 | 930 | 24 | 631 | 27 | 299 | 27 | 2296 | 73 | 125.5 | 4.1 |
| Denver | 144 | 2.10 | 765 | 21 | 535 | 18 | 230 | 19 | 1922 | 54 | 134.4 | 4.0 |
| Los Angeles | 691 | 15.57 | 602 | 12 | 512 | 9 | 91 | 8 | 1702 | 29 | 42.6 | 0.8 |
| Minneapolis | 93 | 2.21 | 926 | 44 | 522 | 41 | 403 | 29 | 2064 | 123 | 110.8 | 7.6 |
| NYC | 1166 | 30.93 | 1043 | 23 | 638 | 14 | 405 | 18 | 2429 | 47 | 80.2 | 1.5 |
| Philadelphia | 173 | 5.06 | 919 | 42 | 709 | 41 | 210 | 20 | 2447 | 126 | 82.8 | 4.6 |
| Portland | 133 | 1.75 | 753 | 26 | 613 | 24 | 139 | 17 | 2073 | 73 | 59.4 | 2.6 |
| Seattle | 409 | 3.73 | 667 | 14 | 579 | 13 | 88 | 9 | 1909 | 40 | 51.2 | 1.5 |
| Washington | 331 | 6.46 | 759 | 13 | 697 | 12 | 63 | 7 | 2253 | 38 | 84.5 | 2.8 |
| Aggregate | 3623 | 79.33 | 874 | 12 | 615 | 7 | 259 | 9 | 2204 | 25 | 77.3 | 1.2 |
| LEED | Site | Electric | Non-Electric | Source | GHG | |||||||
|---|---|---|---|---|---|---|---|---|---|---|---|---|
| City | N | A(106 m2) | Mean | SDm | Mean | SDm | Mean | SDm | Mean | SDm | Mean | SDm |
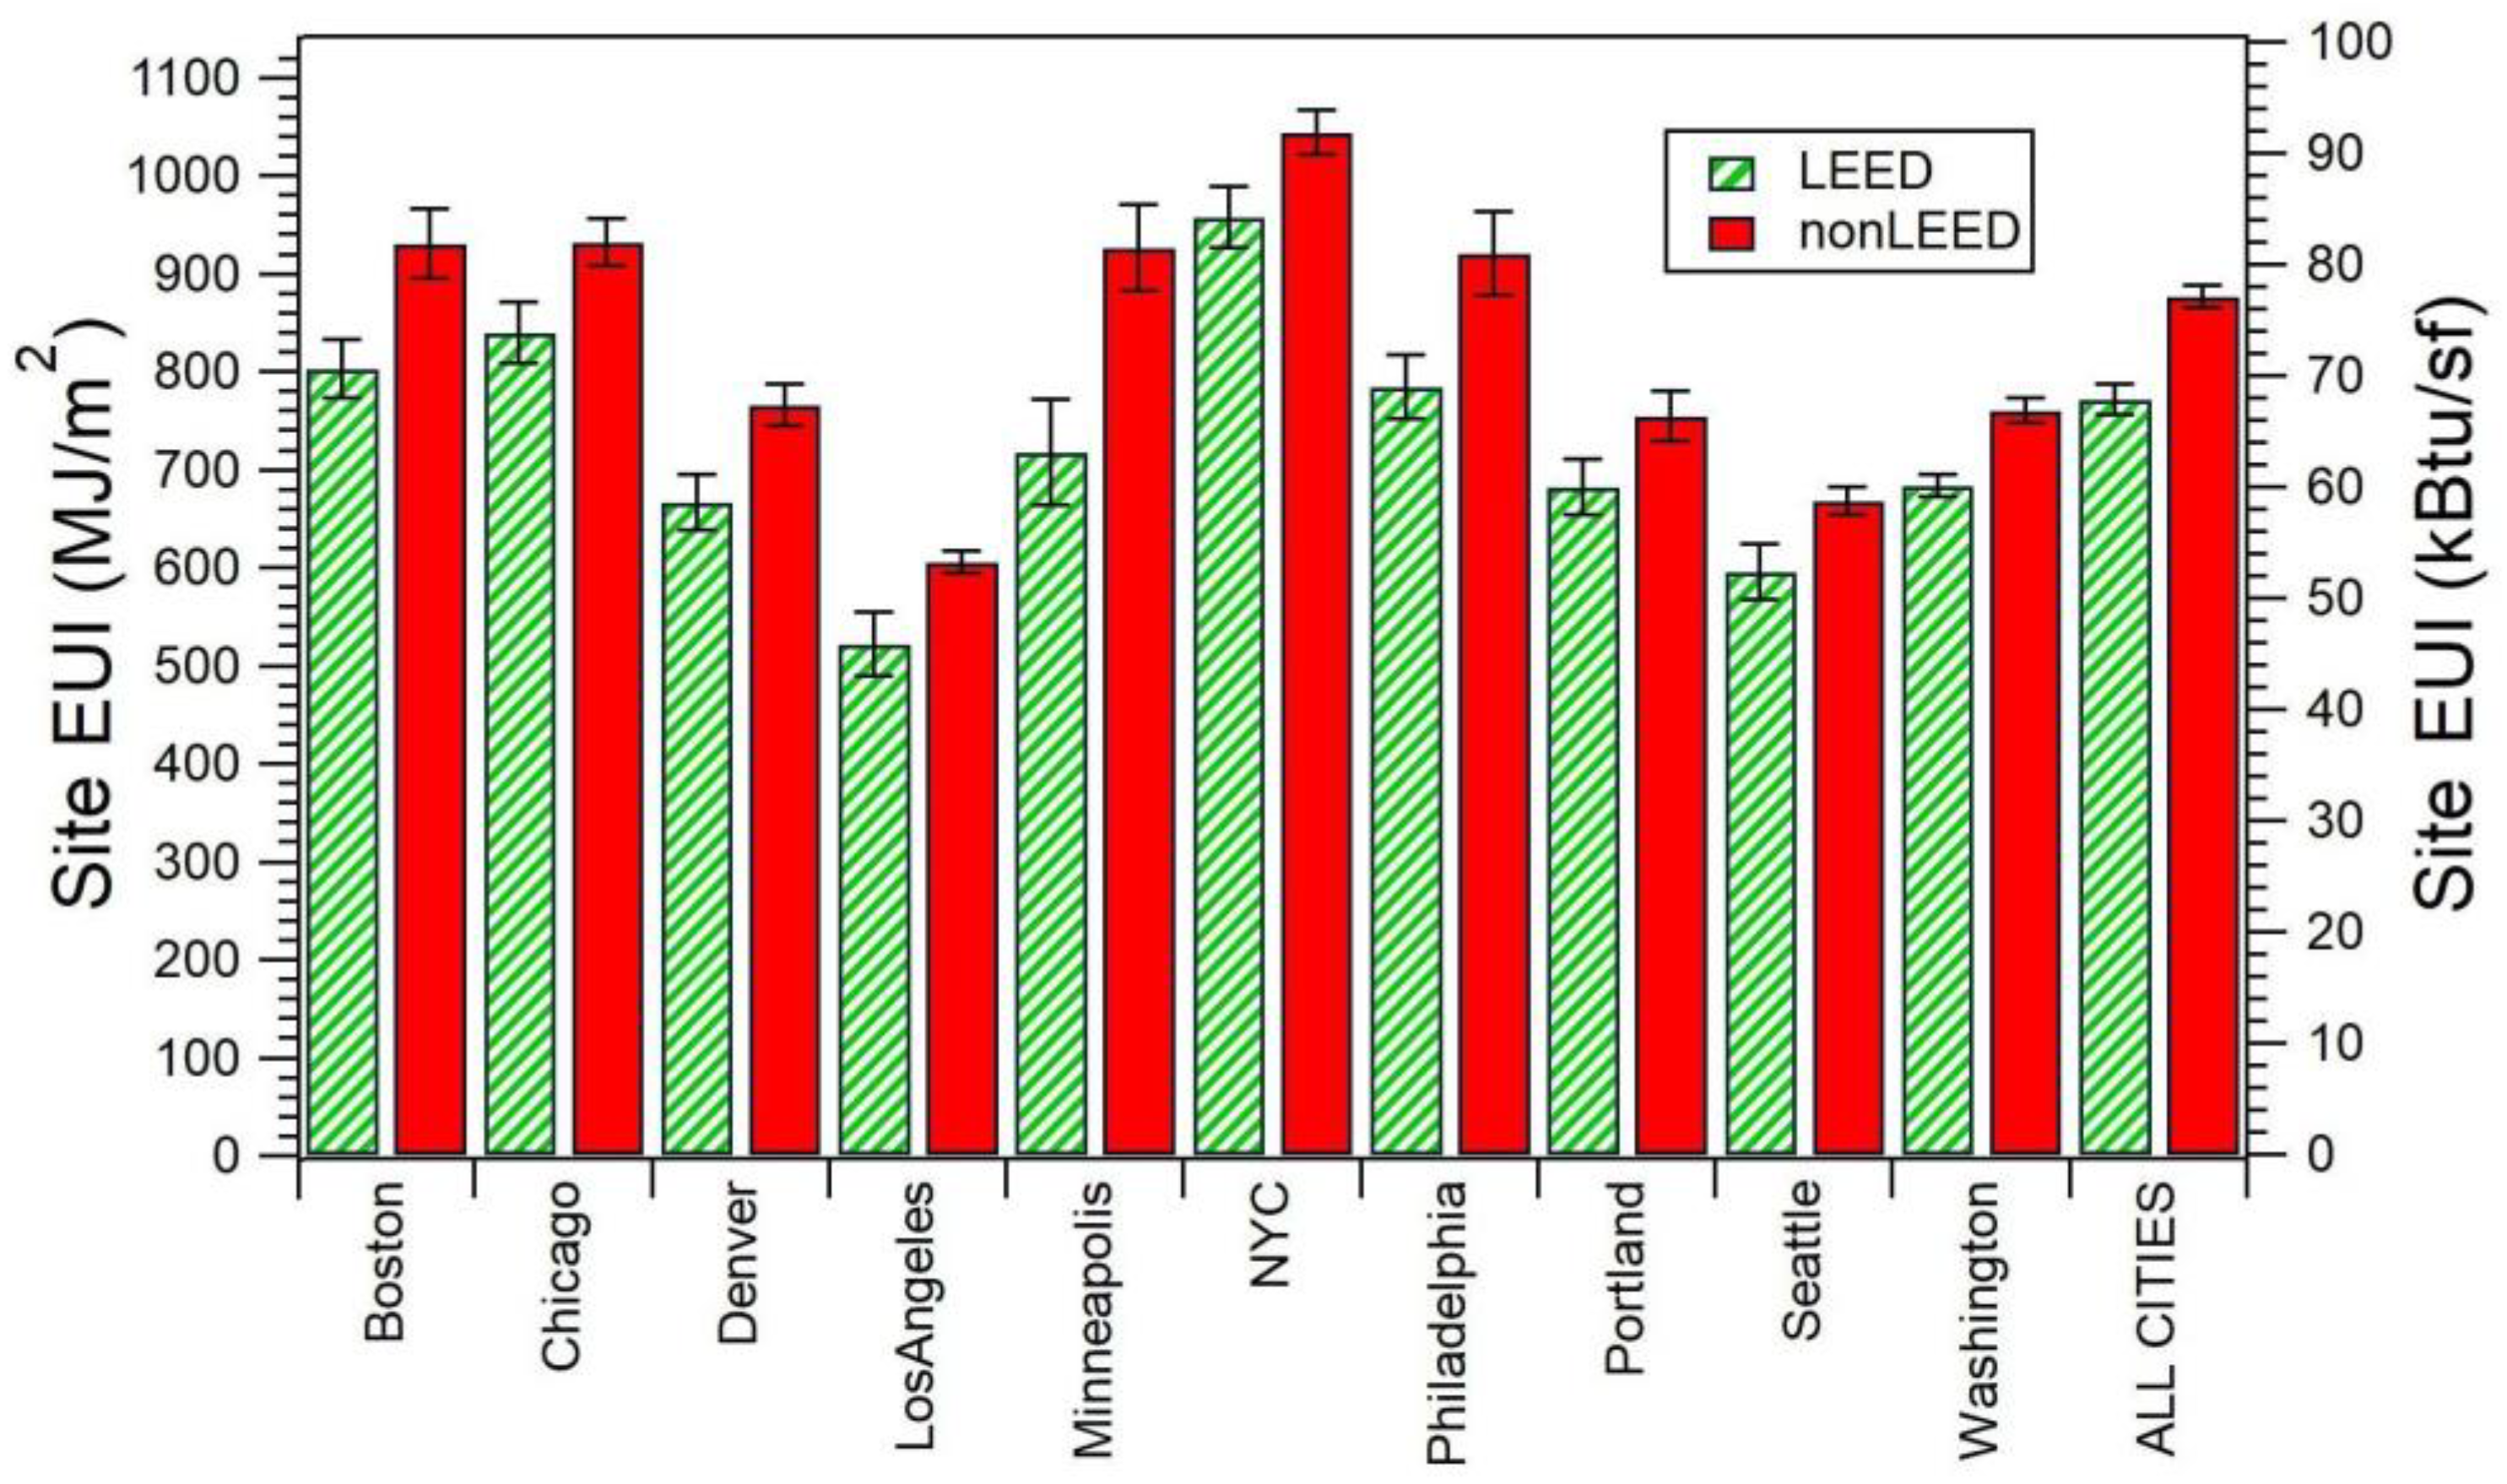
| Boston | 35 | 2.18 | 801 | 30 | 590 | 25 | 211 | 33 | 2074 | 68 | 62.2 | 3.6 |
| Chicago | 81 | 7.93 | 839 | 31 | 633 | 27 | 206 | 37 | 2203 | 70 | 121.2 | 4.0 |
| Denver | 49 | 2.09 | 665 | 28 | 494 | 26 | 171 | 32 | 1730 | 71 | 128.9 | 5.3 |
| Los Angeles | 41 | 2.61 | 534 | 32 | 473 | 27 | 61 | 20 | 1550 | 85 | 38.1 | 2.1 |
| Minneapolis | 16 | 1.21 | 716 | 54 | 498 | 21 | 218 | 48 | 1792 | 86 | 101.2 | 4.7 |
| NYC | 81 | 6.29 | 957 | 31 | 630 | 19 | 327 | 25 | 2321 | 64 | 76.1 | 2.3 |
| Philadelphia | 16 | 1.10 | 783 | 33 | 688 | 32 | 95 | 23 | 2260 | 94 | 74.4 | 5.1 |
| Portland | 26 | 0.71 | 681 | 29 | 538 | 30 | 142 | 28 | 1840 | 84 | 52.0 | 2.4 |
| Seattle | 50 | 2.20 | 595 | 28 | 547 | 23 | 48 | 10 | 1769 | 79 | 48.6 | 2.9 |
| Washington | 150 | 4.30 | 681 | 12 | 645 | 10 | 36 | 8 | 2063 | 32 | 75.1 | 2.1 |
| Aggregate | 545 | 30.61 | 772 | 15 | 596 | 10 | 176 | 13 | 2057 | 31 | 85.4 | 2.2 |
| Site | Electric | Non-Electric | Source | GHG | ||||||
|---|---|---|---|---|---|---|---|---|---|---|
| City | Savings | p | Savings | p | Savings | p | Savings | p | Savings | p |
| Boston | 14% | 0.117 | 14% | 0.217 | 14% | 0.582 | 14% | 0.133 | 9% | 0.355 |
| Chicago | 10% | 0.051 | 0% | 0.969 | 31% | 0.079 | 4% | 0.448 | 3% | 0.538 |
| Denver | 13% | 0.023 | 8% | 0.273 | 26% | 0.166 | 10% | 0.075 | 4% | 0.473 |
| Los Angeles | 11% | 0.177 | 8% | 0.307 | 33% | 0.368 | 9% | 0.210 | 11% | 0.163 |
| Minneapolis | 23% | 0.057 | 5% | 0.777 | 46% | 0.029 | 13% | 0.262 | 9% | 0.535 |
| NYC | 8% | 0.274 | 1% | 0.854 | 19% | 0.217 | 4% | 0.520 | 5% | 0.455 |
| Philadelphia | 15% | 0.223 | 3% | 0.811 | 55% | 0.075 | 8% | 0.514 | 10% | 0.458 |
| Portland | 10% | 0.206 | 12% | 0.160 | -2% | 0.940 | 11% | 0.146 | 12% | 0.164 |
| Seattle | 11% | 0.123 | 5% | 0.434 | 46% | 0.087 | 7% | 0.273 | 5% | 0.546 |
| Washington | 10% | 0.000 | 7% | 0.005 | 43% | 0.019 | 8% | 0.000 | 11% | 0.021 |
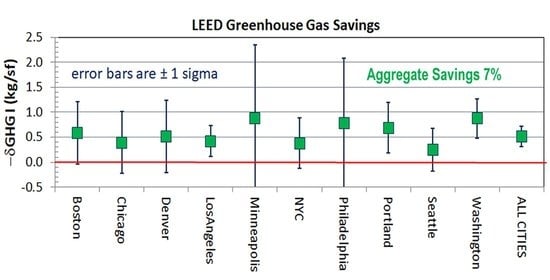
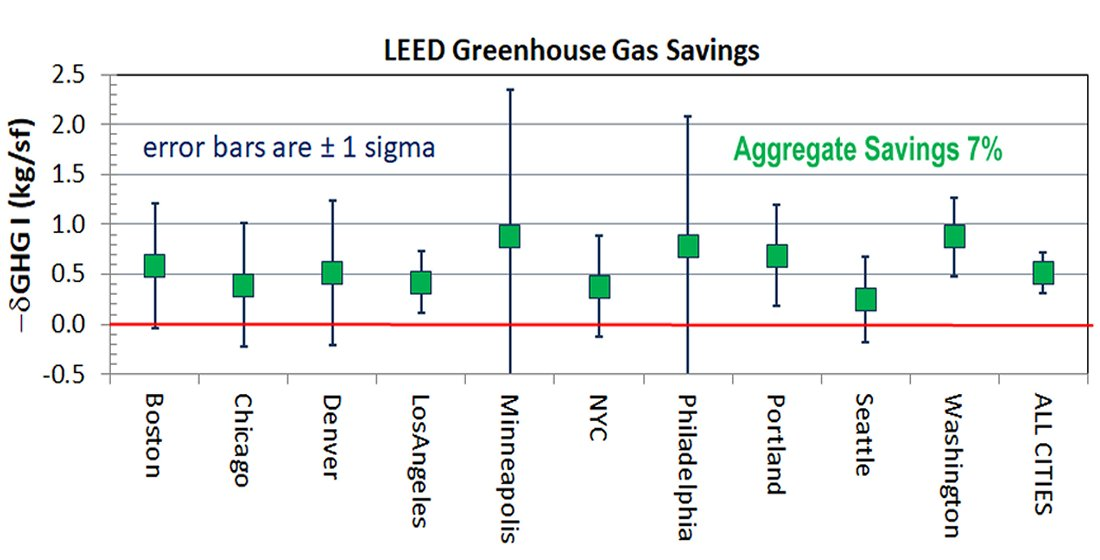
| Aggregate | 11% | 0.000 | 4% | 0.113 | 26% | 0.001 | 7% | 0.004 | 7% | 0.012 |
| Site | Electric | Non-Electric | Source | GHG | ||||||||
|---|---|---|---|---|---|---|---|---|---|---|---|---|
| LEED Level | N | A(106 m2) | Savings | p | Savings | p | Savings | p | Savings | p | Savings | p |
| Certified | 35 | 1.76 | 14% | 0.190 | 8% | 0.436 | 27% | 0.274 | 10% | 0.274 | 12% | 0.248 |
| Silver | 142 | 8.45 | 5% | 0.364 | 1% | 0.913 | 16% | 0.288 | 2% | 0.626 | 4% | 0.466 |
| Gold | 303 | 16.60 | 12% | 0.002 | 6% | 0.108 | 27% | 0.011 | 9% | 0.013 | 8% | 0.030 |
| Platinum | 65 | 3.80 | 15% | 0.068 | 4% | 0.624 | 42% | 0.054 | 9% | 0.241 | 7% | 0.340 |
| Aggregate | 545 | 30.61 | 11% | 0.000 | 4% | 0.107 | 26% | 0.001 | 7% | 0.006 | 7% | 0.009 |
| Metric (e) | b | ∆b | R2 | t-Value | p-Value |
|---|---|---|---|---|---|
| Site EUI (MJ/m2) | −1.23 | 0.20 | 1.1% | −6.14 | 9.16 × 10⁻¹⁰ |
| Electric EUI (MJ/m2) | 0.86 | 0.14 | 1.1% | 6.09 | 1.26 × 10⁻⁹ |
| non-Electric EUI (MJ/m2) | −2.08 | 0.14 | 6.1% | −15.06 | <2.2 × 10⁻¹⁶ |
| Source EUI (MJ/m2) | 0.51 | 0.47 | 0.03% | 1.10 | 0.272 |
| GHGI (kg/m2) | 0.022 | 0.022 | 0.03% | −0.976 | 0.329 |
| New non-LEED | Site | Electric | Non-Electric | Source | GHG | |||||||
|---|---|---|---|---|---|---|---|---|---|---|---|---|
| City | N | A(106 m2) | Saving | p | Saving | p | Saving | p | Saving | p | Saving | p |
| Boston | 127 | 3.17 | 17% | 0.013 | 19% | 0.045 | 13% | 0.589 | 18% | 0.022 | 14% | 0.107 |
| Chicago | 122 | 4.76 | 9% | 0.066 | 7% | 0.355 | 17% | 0.454 | 8% | 0.138 | 7% | 0.161 |
| Denver | 123 | 1.81 | 13% | 0.025 | 12% | 0.076 | 17% | 0.422 | 12% | 0.025 | 6% | 0.298 |
| Los Angeles | 597 | 14.19 | 14% | 0.081 | 10% | 0.142 | 34% | 0.338 | 12% | 0.092 | 13% | 0.065 |
| Minneapolis | 56 | 1.56 | 22% | 0.049 | 4% | 0.750 | 45% | 0.029 | 12% | 0.223 | 7% | 0.535 |
| NYC | 618 | 21.90 | 13% | 0.057 | 4% | 0.481 | 25% | 0.069 | 8% | 0.153 | 9% | 0.127 |
| Philadelphia | 74 | 2.95 | 10% | 0.275 | -1% | 0.938 | 50% | 0.099 | 4% | 0.656 | 5% | 0.629 |
| Portland | -- | --- | -- | --- | -- | --- | -- | --- | -- | --- | -- | --- |
| Seattle | 236 | 2.65 | 11% | 0.093 | 11% | 0.094 | 16% | 0.600 | 11% | 0.088 | 7% | 0.383 |
| Washington | 223 | 5.14 | 9% | 0.001 | 9% | 0.001 | 9% | 0.720 | 9% | 0.001 | 11% | 0.027 |
| Aggregate | 2176 | 58.12 | 12% | 0.000 | 8% | 0.001 | 21% | 0.007 | 10% | 0.000 | 10% | 0.000 |
Publisher’s Note: MDPI stays neutral with regard to jurisdictional claims in published maps and institutional affiliations. |
© 2021 by the authors. Licensee MDPI, Basel, Switzerland. This article is an open access article distributed under the terms and conditions of the Creative Commons Attribution (CC BY) license (http://creativecommons.org/licenses/by/4.0/).
Share and Cite
Scofield, J.H.; Brodnitz, S.; Cornell, J.; Liang, T.; Scofield, T. Energy and Greenhouse Gas Savings for LEED-Certified U.S. Office Buildings. Energies 2021, 14, 749. https://doi.org/10.3390/en14030749
Scofield JH, Brodnitz S, Cornell J, Liang T, Scofield T. Energy and Greenhouse Gas Savings for LEED-Certified U.S. Office Buildings. Energies. 2021; 14(3):749. https://doi.org/10.3390/en14030749
Chicago/Turabian StyleScofield, John H., Susannah Brodnitz, Jakob Cornell, Tian Liang, and Thomas Scofield. 2021. "Energy and Greenhouse Gas Savings for LEED-Certified U.S. Office Buildings" Energies 14, no. 3: 749. https://doi.org/10.3390/en14030749
APA StyleScofield, J. H., Brodnitz, S., Cornell, J., Liang, T., & Scofield, T. (2021). Energy and Greenhouse Gas Savings for LEED-Certified U.S. Office Buildings. Energies, 14(3), 749. https://doi.org/10.3390/en14030749