Abstract
The urgent need to make buildings more performant in energy and environmental terms has led to the increasing study of recycled and natural materials as viable solutions. In this context, the present study aims at comparing the energy performance of innovative wall-sample solutions (with recycled polyethylene-terephthalate panels or durum-wheat straw bales) with a basic one. Energy evaluations were performed in Piazza Armerina (a city of Sicily–Italy), where the chosen material is widespread, by applying two calculation methods: a monthly average-energy-calculation approach, mandatory by Italian regulations (UNI TS 11300), and an hourly energy-calculation procedure (EN 52016). The results documented that: (i) the new innovative wall-sample allows for significantly reducing heat loss (heating of 4–10% and cooling of 40–50%) (ii) a lower primary-energy demand was obtained by adopting the new calculation procedure of EN 52016 (energy decreasing of 20–24%); (iii) significant differences in terms of heat-loss (of 10–36%) and heat-gain (up to 75%) calculations were found for the two calculation methods. This puts emphasis upon the importance of properly selecting a calculation method by accounting for all of those key variables and features that are representative of the energy system being investigated.
1. Introduction
The increasing emission of carbon dioxide (CO2) has led to climate change, entailing important consequences, such as desertification and extreme atmospheric phenomena. CO2 emissions-reduction represents the key point in current energy policy, where sustainable, innovative, and efficient solutions are generally being promoted.
The adoption of energy-focused strategies is an unavoidable challenge for all European countries, with the common goal of reducing the use of fossil fuel and increasing energy efficiency, prioritizing action in the most energy-intensive and environmentally impacting sectors.
Buildings are recognised as one such sector, as they are responsible for about 40% of the global energy consumption (which holds for Italy, according to the annual national report of the Italian Minister of Economic Development [1]) and about 30% of CO2 eq. global emissions during their operation phase. Moreover, representing 30% of the global consumption of raw materials, buildings are responsible for significant additional CO2 eq. emissions due to production and acquisition of all the materials and components that are required for their construction [2,3,4,5].
Therefore, to face climate change and other environmental challenges, the building sector calls for solutions that sustainably enable reduction in their well-documented consumption of resources, materials, fuels, and energy, from a life-cycle perspective [6]. Material and resource efficiency, following the loop-closure-and-circularity approach, can be implemented at the materials, components, and whole-building scales, and represents, in this regard, a key strategy for reducing the environmental impact of buildings, thereby advancing sustainability. Points of intervention exist in each of buildings’ life-cycle phases (design, material/component production, construction site activities, use and maintenance, renovation/rehabilitation/reuse, and end-of-life management) and implementable actions generate reduction in both the emission of greenhouse gases (GHGs) and the “material footprint” of buildings—with quite a direct correlation. It is estimated, for instance, that resource-efficient construction can generate a mass–material reduction equal to 4 Gt and a GHG-emission reduction of 3.4 Gt CO2 eq., whilst reductions of −3.5 Gt and −1.1 Gt CO2 eq. are associated with the usage of circular construction materials [7]. Accordingly, UNEP [8] estimated that the reduction of annual GHG emissions associated with the material cycles of residential buildings in G7 countries and China could reach up to 80–100 per cent by 2050, compared to a scenario without material efficiency (including the benefits of using recycled materials).
In this context, therefore, selecting proper construction materials and technologies in the early stage of design is of paramount importance, as it generally has beneficial consequences on both the core and downstream phases of the building’s life cycle [6]. Based upon literature studies, such as La Rosa et al. [9], Ingrao et al. [10], and Ingrao et al. [2], the choice of proper building materials and construction technologies can, in fact, significantly reduce:
- −
- the environmental impacts that are, overall, embodied in the construction of a building
- −
- the consumption of energy, and related impacts, in terms of fossil-resource exploitation and the emission of greenhouse gases (GHGs) during a building’s use phase;
- −
- the impact associated with the end-of-life phase, especially when oriented to waste-material-recycling maximization from a circular-economy perspective. In this case, an avoided impact would partially compensate for the environment impacts deriving from building construction and use (Ingrao et al. [11]).
Sustainable materials are generally regarded as those having natural origin or being derived from waste-recycling systems: the production of those materials is, on average, of low environmental burden compared to conventional materials, because such is now the demand from materials and fossil energy characteristic of building construction [5]. Therefore, the utilisation of those materials is recognised to be a key aspect in sustainable construction, as it enables decreasing material and energy consumption in buildings [1,12,13]. In particular, natural and bio-based construction materials are identified as one of the most promising solution for optimizing buildings’ environmental sustainability [14,15] and the benefits of using them instead of synthetic materials is well known and documented in the literature.
For the optimal selection of construction materials and technologies that allow for sustainable, low GHG-emitting, and low energy-consuming buildings, it is important to select the most appropriate calculation method for building performance simulation, since it can affect—even significantly—the obtainable results. We assert that such selection should be made in a way that best captures the key features of the building system under investigation, from an energy perspective, and of the objectives of such study.
Many studies have been published, thus far, that explore the energy needs of buildings, often by comparison of sets of innovative solutions. In those studies, the authors often adopt dynamics codes, as it allows for the consideration of the actual heat exchanged by each building component. For instance, Colangelo et al. [16] adopted the dynamics code for investigating the performance of heating/ventilation and air conditioning system (HVAC) with high-performance heat-transfer fluid (nanofluids), demonstrating how their new solution obtained a higher COP and EER and lower operating costs. Carlander et al. [17] used dynamics simulations to highlight the dependence of the energy needs of a new office building on its indoor heat gains, location, orientation, and façade design.
At the European level, the Energy Performance of Buildings Directive (EPBD) has defined and led to the realization of nearly zero-energy buildings (nZEBs) that meet a majority of their energy needs with sources of on-site renewable energy. Numerous works have been aimed at analysing the energy performance of nZEB, which represents the new standard for new building construction as of 2021, such as in [18], wherein the results of dynamic energy-simulation were compared to the monitored energy use of real-world buildings, in order to check the accuracy of the tool and to evaluate energy savings in their nZEB case study.
The use of accurate and reliable energy tools is another important point to be accounted for in energy analyses; in fact, as highlighted in [19], an incorrect assessment of heating- and cooling-energy needs can lead to the incorrect sizing of HVAC, photovoltaic, and energy-storage systems, worsening the energy performance of such buildings.
In Italy, when new construction projects or building refurbishments are designed, it is mandatory to apply current energy regulations, as well use of the calculation approach defined by the standard set of UNI TS 11300 [20,21,22,23], which provides a monthly average-energy-calculation method. The main critical issue of the monthly-calculation method has been widely discussed in the literature, such as in [24], wherein energy-dynamics results were compared to those returned by an artificial neural network that forecasts the energy need of buildings according to UNI TS 11300 [20,21,22,23]. A similar comparison was performed in [25], wherein the difference between thermal-load predictions was analysed, and highlighted a lower accuracy in the summer period. This was achieved by the authors through application of the current European standard method for energy prediction in comparison with a more reliable, but complex, tool, such as the dynamics one [25].
Despite the lower accuracy of the current European calculation method, it is widely used for energy evaluation in the building sector [26], especially for energy-performance certificate assessments. This is mainly due to its ease of use and inexpensiveness, with respect to dynamics tools. On the other hand, there are important issues that should be checked when using dynamics tools, such as boundary conditions and the quality of the input data, as these can considerably influencing an energy-needs calculation [27].
To improve the current calculation method, a new and more accurate approach is provided by the EN 52016 [28], consisting of an hourly energy-calculation procedure capable of accounting for the thermal inertia of buildings’ envelopes. As this new methodology is quite recent, few studies are yet found in the literature, though one such [29,30,31,32,33] performed the first energy-analysis approach based on EN 52016.
Currently the main difference between the new methodology proposed by EN 52016 and the one in force for energy building assessment (UNI TS 11300) consists in heat losses calculation as will be discussed below.
This paper wishes to contribution to this field of research by:
- (i)
- evaluating if the use of recycled or natural materials can improve the energy efficiency of buildings;
- (ii)
- comparing the energy performance of recycled and natural materials with standard materials;
- (iii)
- comparing the energy results obtained by using the standard monthly average-energy-calculation approach, mandatory by Italian regulations (UNI TS 11300), with those of the new hourly-energy-calculation procedure (provided by EN 52016).
The study is part of research previously conducted by the authors on buildings and building materials, with the specific aim of comparing innovative wall-sample solutions using recycled polyethylene terephthalate (R-ofPET) or hemp concrete, with more conventional ones. Though our research includes the research by Ingrao et al. [10], Maalouf et al. [34], and Moussa et al. [35], these, however, focused on the construction materials and assembly technologies used, rather than on methodology. Here, the authors wish to take a step forward, by exploring the change in results determined by differences in methodological choices and calculation methods, on an otherwise equal basis with regard to construction materials and assembly technologies.
In this regard, the study follows these two previous studies by comparing a set of innovative wall-sample solutions with a basic one that is used quite often in the study area. In particular, the R-PET panel-containing wall, which was designed and tested for the first time by Ingrao et al. [8], is compared in this study with a wall containing a core layer made from durum-wheat (DW) straw bales of rectangular form. In this way, the study may contribute further to answering the question ‘Recycled or natural?’, that is currently at the centre of the international debate about which strategies that can achieve sustainability in a wide range of sectors, to which buildings clearly belong.
From this perspective, the study may be useful to building designers and energy-assessment practitioners, as well as to policy- and decision-makers, to expand their knowledge and skills on the use of innovative construction materials and technologies for energy-performant buildings, as a starting point for taking the right strategic actions for their promotion and spread.
After the introductory piece contained in Section 1, this manuscript is structured as follows:
- (1)
- Section 2 contains a description of the two calculation methods here compared, and of the three wall-sample solutions and of the reference single-family building chosen as a case study;
- (2)
- in Section 3, the discussion of the main energy results is developed, along with some useful comparisons;
- (3)
- Section 4 contains the main conclusions and perspectives for the future of the study.
2. Materials and Methods
2.1. Calculation Methodology
The study is based upon a comparison of a set of building envelope samples, to highlight those performing best in terms of energy efficiency. The study was designed with the following purposes:
- To evaluate the energy performance of innovative and sustainable materials (recycled or natural materials) when they are applied at the building scale.
- To compare energy results of the two examined calculation methods, in terms of heat losses and primary energy need, by taking into account the energy effects of HVAC systems.
- To compare two calculation procedures to highlight their energy differences in terms of primary energy need.
To achieve these, building-envelope systems using unconventional sustainable materials were defined, and were compared with traditional ones through energy-use simulations. Moreover, energy analyses were performed, in agreement with the current national energy regulations for building energy assessment, UNI TS 11300 [20,21,22,23], and, alternatively, with the new energy calculation method proposed by the new regulation, UNI EN 52016 [28], currently under review and development. The main differences between these two methods concern the thermal-loss evaluation of building envelopes and the time-span over which energy calculations are made, as described below.
The UNI TS 11300 [20,21,22,23] calculation method is mandatory for any European building-energy assessment, such as the Energy Performance Certificate (EPC), energy audit, or when drafting energy designs for new buildings or building refurbishment. This method is based upon a monthly average-energy calculation, where the energy need for heating (QH,nd) and cooling (QC,nd) is estimated by means of an energy balance of the heat losses through the building’s envelope (QH,ht and QC,ht) and the total heat gains (Qgn), including solar and internal heat gains.
In the energy balance for the QH,nd calculation, the Qgn value is corrected by a utilisation factor (ηH,gn), representing the gains that reduce the energy need for heating, whilst for the QC,nd calculation, the QC,ht value is corrected by a utilisation factor (ηC,ls) that is the losses from reducing the energy needed for cooling.
The new EN 52016 [28], instead, provides a less simplified calculation procedure, but which can assess the hourly energy needed for heating and cooling on the basis of the resistance-and-capacitance (RC) network thermal model for each building component. In fact, in the new proposed method, the building envelope is modelled as shown in Figure 1, i.e., the building component is composed of five nodes with four thermal resistances (grey boxes) and with different numbers of capacitances (indicated with k), depending on the position of the mass.
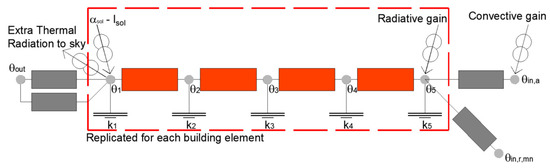
Figure 1.
Resistance-and-capacitance (RC) network thermal model. Personal elaboration from UNI EN 52016 [28].
The main advantage of the hourly calculation that characterises this method is the accounting of the influence of climate conditions, operation schedules, and thermal inertia of building structures on the energy-need assessment.
According to Annex B of the UNI EN 52016 standard, each building envelope is modelled with five nodes (plus two nodes related to indoors and outdoors), interconnected by four thermal resistances (in addition to the ones related to radiative and convective resistances) and from one to five capacitances [28,33].
Unlike the current calculation method [20,21,22,23], in the UNI EN 52016 [28], the two aforementioned utilisation factors that affect heating- and cooling-period calculations in [20,21,22,23] are not taken into account, since an hourly calculation is performed. There, the heating and cooling periods, being derived from UNI EN 52016, are strongly affected by outdoor thermal conditions and the real thermal properties of buildings. These are only marginally accounted for by UNI TS 11300, through its utilisation factors. Therefore, heating and cooling periods calculated according to UNI EN 52016 should, nonetheless, be more reliable.
According to [28], currently the two methods differ only in the evaluation of heat lost through the building envelope. Indeed, their calculations for HVAC systems is currently the same and follows [20,21,22,23]. From this frame of reference, it may be of interest to investigate the energy need calculated by adopting both approaches, in order to point out how a more accurate heat-losses evaluation can affect primary energy demand and, therefore, energy evaluations of HVAC systems.
2.2. Description of the Designed Wall-Composition Samples
For the comparative analysis, three wall-composition samples were designed in compliance with the foreseen thermal-transmission limits for the area of interest. These technical packages have been designed for possible realisation in the municipality of Piazza Armerina, within the province of Enna (the smallest city of Sicily, located practically in its barycentre). The climatic zones assigned to the municipalities of the free municipal consortium of Enna are reported in Table 1, from which there is evidence of the predominance of D zone in the province, touching 70% of the municipalities. A few other of those are in the climatic zones “C” and “E” [36].

Table 1.
Climatic zone distribution in the province of Enna. Personal elaboration using data extrapolated from the Presidential Decree n.412/93 [36].
As per D.M. 2015 [37], new constructions or renovated buildings must comply with several requirements of the decree, such as that heat-exchange coefficients be based upon the thermal transmittance of the building envelope. In particular, it provides specific limits for thermal transmittance by climatic zone. Figure 2 shows the thermal-transmittance limits for all Italian territories, from which it is possible to extract those for the D climatic zone.
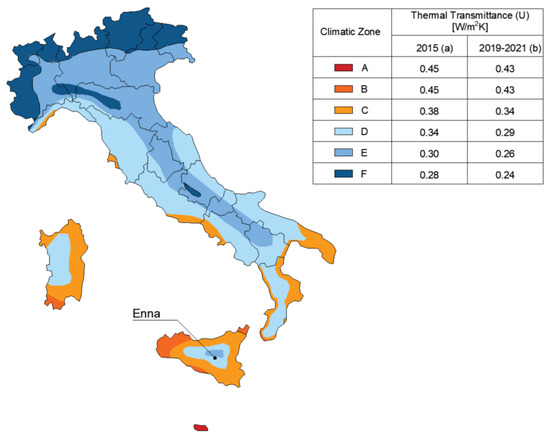
Figure 2.
Italian climatic zones and related thermal-transmittance limits for external walls. Limits in the “a” column entered into enforcement on 1 July 2015, whilst those in the “b” column entered into enforcement on 1 January 2019, for public-destination buildings, and 1 January 2021 for all other buildings, as reported above and based upon intended use [37].
The three wall-composition samples were designed with the aim of furthering energy performance and the environmental sustainability of innovative building solutions compared with a basic solution that is representative of the current building construction practice in the Sicilian region. Those compositions are depicted in Figure 3, and Table 2 details their dimensions and mass. Whilst walls 1 and 2 were extrapolated from Ingrao et al. [10], wall 3 is of new conception. It was designed by the authors to contain a layer of DW straw, as it is abundantly produced in—and so is highly representative of—the area of Enna (Chinnici et al. [38]), in which the wall is hypothetically installed. In addition to this, straw is increasingly finding unconventional application, as in buildings as enveloping and insulating material, beyond its most widespread usage as animal bedding or feed. These new applications enhance the environmental sustainability of both agricultural and building systems, from a life-cycle perspective, and enable extracting some straw’s greatest value.
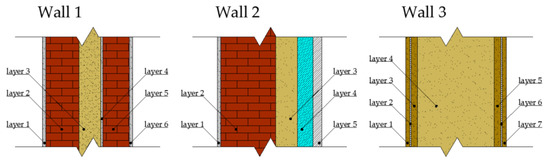
Figure 3.
Wall-sample sections equipped with thermally insulating panels.
Table 2.
Dimensions and superficial mass for the three wall-composition samples studied.
The whole composition of wall 2 was designed and tested for the first time by Ingrao et al. [10]. In these authors’ opinion, it is innovative, both for the (dry) assembly technology and for the package of materials utilised, including R-PET fibre panels for the thermal insulation of the wall. The panel was environmentally assessed by Ingrao et al. [39], who determined the environmental strengths and weaknesses associated with its supply chain in comparison with other widespread insulating materials.
In this study, such a panel can be seen as an unconventional material commodity, whose manufacturing chain, moreover, is well in line with the principles of a circular economy (Ingrao et al. [39]; Ingrao et al. [11]). It is a key element of the stratigraphy, and its main features are shown in Table 3.
Table 3.
Features of the R-PET panel used as an insulation layer in wall 2. Personal elaboration from Ingrao et al. [39].
Starting from the stratigraphy of each defined wall (in particular, from the interior to the exterior i.e., from left to right), the corresponding thermal transmittance was calculated based upon the UNI EN ISO 6946 [40]. In particular, as regards the ventilated façade and following Ingrao et al. [10], thermal transmittance was evaluated by neglecting the thermal resistance of the air cavities, considering the resistance to the external surface as the value relative to the still air. This approach is commonly used for a precautionary modelling of ventilated façades, and it does not take into account their positive contribution during the summer period. The values of thermal conductivity of the homogeneous layers and of the thermal resistance of the non-homogeneous layers are declared by the manufacturer of each component material and, where absent, we used the thermal properties proposed by the Italian reference standards (Ingrao et al. [10]). In Table 4 we present the thermal conductivity values, along with those of U thermal transmittances. The latter were calculated using the well-known formulas of technical physics, starting from the thickness (s) and the thermal conductivity () of each j-th homogeneous wall-composing layer, and continuing with the thermal resistance (R) of each i-th heterogeneous material and of each l-th air-gap, and concluding with calculations of the internal (1) and external (2) thermal adduction coefficients.
Table 4.
Thermal properties of defined walls.
As evident from Table 4, the obtained values are all fully in compliance with the limits established for the Italian Climate Zone D, i.e., 0.29 W/sq·m K from 2021 (Figure 2).
According to the current energy regulations, in addition to the thermal transmittance, each wall must complete a thermo-hygrometric check, i.e., it must verify the absence of surface and interstitial condensations.
To check the absence of surface condensation, temperature factors (fRsi) for each construction layer were calculated and compared with the temperature-factor limits calculated for each month (); specifically, fRsi values depending on the indoor and outdoor wall temperatures (Tin and Tout) and on minimum surface temperature (Ts,min) were calculated with consideration for air humidity and saturation vapour pressure (Psat):
The obtained results are shown in Table 5, from which there is evidence that all wall compositions present fRsi values higher than the critical minimum (calculated for December), thus avoiding the formation of condensation on the internal surface of the walls.
Table 5.
Surface condensation: inspection of the thermo-hygrometric behaviour of the examined walls.
Saturation-pressure profiles, based on their temperature profiles, and the vapour pressure inside the walls were considered when checking against interstitial condensation. The two profiles were compared in Glaser diagrams for each month of the year, obtaining December as the most critical month (considering indoor–outdoor thermal conditions and fRsi values). Figure 4, Figure 5 and Figure 6 show the Glaser diagrams for each wall; only those for the most critical month (December) are reported. As seen in these figures, all the investigated walls had a vapour profile lower than the saturation profile, thus presenting no interstitial condensation points in any internal layer of the stratigraphy.
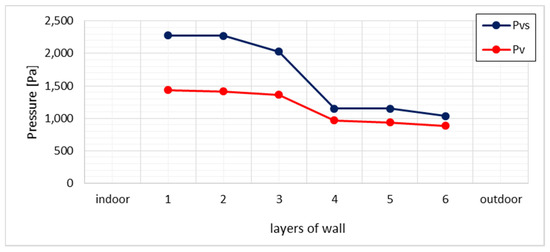
Figure 4.
Glaser diagram: trend of saturation and vapour pressures throughout wall 1.
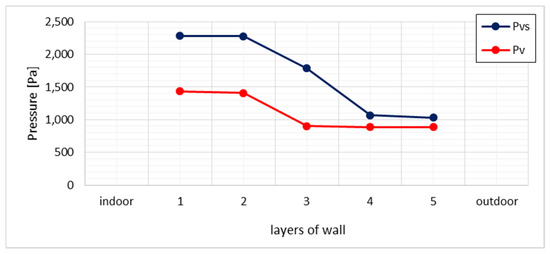
Figure 5.
Glaser diagram: trend of saturation and vapour pressures throughout wall 2.
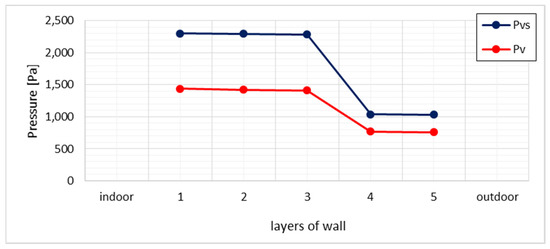
Figure 6.
Glaser diagram: trend of saturation and vapour pressures throughout wall 3.
2.3. Description of the Simulation Case Study
With reference to the two described calculation methods and the three defined walls, energy simulations were performed for the primary energy assessment of one archetype of reference-detached house, chosen as a case study (Figure 7).
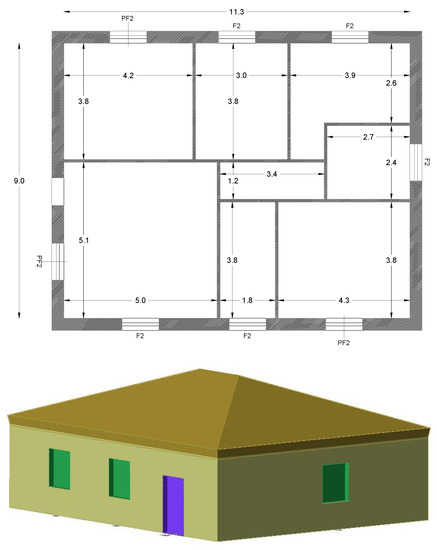
Figure 7.
Map and 3D view of the chosen case study.
The main characteristics of the case study are shown in Table 6.
Table 6.
Case study: geometric characterization of the detached house.
To make energy results depend solely upon the thermal properties of the defined walls, the same components for the ground floor, ceiling, and windows have been set thus:
- Ground floor: floor of clay/cement mix with 0.05 m of thermally insulating material for a thermal-transmittance value of 0.270 W/m2K;
- Ceiling: structure of clay/cement mix with 0.14 m of thermally insulating material for a thermal-transmittance value of 0.220 W/m2K;
- Semi-transparent surfaces: windows (three of 1.2 m × 1.4 m) and doors (three of 1.2 m × 2.1 m) with low-emissivity double glazing and a thermal-transmittance value of 1.80 W/m2K.
All the considered components comply with national regulations in terms of thermal transmittance [37].
The case study was also equipped with radiant panels and hydronic heat pumps for heating, cooling, and domestic hot-water production, whose technical information are reported in Table 7. Moreover, the integration of the heat pump, with and without photovoltaic panels, was also considered, with the aim of highlighting the difference in electricity demand obtained by the two calculation methods. As mentioned, the two calculation methods differ in their thermal-losses calculations, whilst they share the same HVAC evaluation and monthly time span thereof. Therefore, any resulting differences will be due to the different energy needs of the building, as assessed by the two compared approaches (see Section 2.1). For this further analysis, a value for the peak power from photovoltaic panels of 2 kW was assumed, corresponding to the minimum power required to comply with the national regulation [41].
Table 7.
Hydronic heat pump: technical data.
Moreover, internal heat gains of 4.55 W/m2 were also set for both calculation methods.
According to these premises, several energy simulations, compliant with UNI 11300 and EN 52016, were thus performed for the Piazza Armerina municipality, and which considered the integration of a heat pump with photovoltaic panels. No period for heating and for cooling was set in any simulation, in order that the real energy need of the building was considered.
3. Results and Discussion
The energy requirements for heating and cooling were modelled and calculated in compliance with the aforementioned calculation methods, considering heat losses and thermal gains through the designed wall compositions in winter and summer.
Edilclima, certified software that implements both calculation methods, was used for conducting the energy simulation, and the heat loss through the walls for both winter and summer, and the energy demands thereof, were then compared.
Heat loss [kWh] through the walls was analysed first; Table 8 and Table 9 show the comparison of heat losses calculated by the methods of both UNI 11300 and EN 52016 during heating and cooling periods. Different trends can be noticed by these data, primarily linked to the heating and cooling periods. EN 52016 simulated higher heat loss through the walls, of about 1.2–3%, but, according to the authors, this mainly depended upon recouping heat losses in the warmer months of May and June. In fact, if the conventional heating period is considered (for the climatic zone D corresponds from 1 November to 15 April) the UNI 11300 returns a higher heat loss, of about 8%, for wall 1, and up to about 15% for wall 3.
Table 8.
Heat losses (kWh) during the winter period through the walls of a case study (detached house): comparison between UNI 11300 and EN 52016.
Table 9.
Heat losses (kWh) during summer period through the walls of a case study (detached house): comparison between UNI 11300 and EN 52016.
A different trend can be found for the heat losses during the cooling period, where no conventional period is provided by national regulation [20,21,22,23]. In this case, the heat losses returned by EN 52016 was always higher, by about 40% (walls 2 and 3), and as much as 50% (wall 1).
As described in Section 2, the main difference between UNI 11300 and 52016 lies in their modelling of buildings’ envelope and in the energy balance adopted for the energy-need calculation. Thus, these explored, all the other energy components were analysed and the energy needs for heating and cooling were finally compared.
In Figure 8 and Figure 9, all the energy contributions calculated for heating and for cooling are reported. In particular, the heat losses through the building’s envelope due to transmission (Qtr), the extra heat flow due to thermal radiation to the sky (Qr), the losses due to ventilation (Qv), the internal heat gains (Qint), and the heat gains due to solar radiation through the windows (Qsol) are compared.
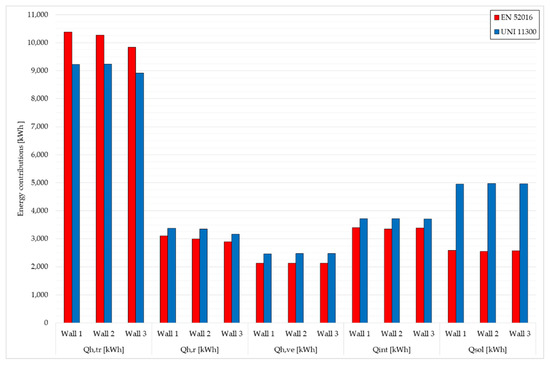
Figure 8.
Energy-contribution comparison during the heating period: UNI 11300 vs. EN 52016 (Qh,tr = heat losses for transmission through the building envelope; Qh,r = extra heat flow due to thermal radiation to the sky; Qh,ve = heat losses for ventilation; Qint = internal heat gains; Qsol = solar radiation through windows).
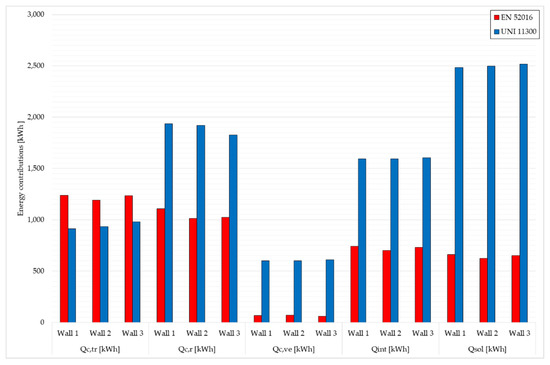
Figure 9.
Energy-contribution comparison during the cooling period: UNI 11300 vs. EN 52016 (Qc,tr = heat losses for transmission through the building envelope; Qc,r = extra heat flow due to thermal radiation to the sky; Qc,ve = heat losses for ventilation; Qint = internal heat gains; Qsol = solar radiation through windows).
As can be noticed, during the heating period, all the energy contributions are higher under UNI 11300 except only for Qtr values, for the aforementioned reasons. The same trend can be found during the cooling period, but with greater differences, as already highlighted in Table 9.
The primary energy needs (EP) for heating and cooling, in compliance with the energy balance of UNI 11300 and EN 52016, were finally evaluated. The results are shown with and without photovoltaic systems (PV) in Figure 10. In particular, results are shown for renewable (EPren), non-renewable (EPren), and total (EPtot) primary energies [37] of the global primary energy (EPgl) [20,21,22,23], i.e., for the present study, primary energy need was calculated as the sum of the primary energy needs for heating (EPH), cooling (EPC), and domestic hot-water production (EPW).
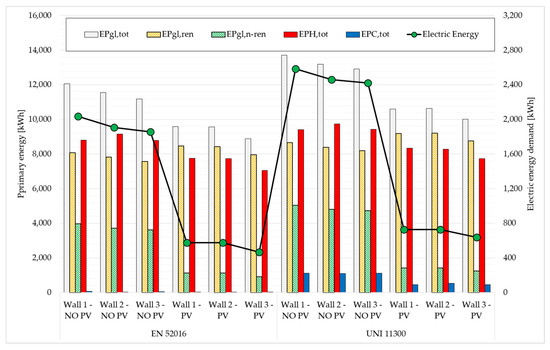
Figure 10.
Primary energy need contribution (EPgl,tot, EPgl,n-ren, EPgl,ren), primary energy needs for heating (EPH,tot) and for cooling (EPH,tot) and the electric energy need for the chosen case study.
In Figure 10, the grey bars represent the global primary energy need (EPgl,tot-kWh), i.e., the sum of the primary energy needs for heating (red bars), cooling (blue bars), and domestic hot-water production, the orange-dashed bars are the renewable contributions to primary energy (EPgl,ren), the green-dashed bars are the non-renewable contribution (EPgl,n-ren), whilst the green dots with black lines are the electric energy demand required by the case studies (wall 1, wall 2, and wall 3) with and without a PV system.
As per to Figure 10, the EPgl,tot calculated with EN 52016 was always lower than when returned by UNI 11300, by about 12% for walls 1 and 2, and by 13.3% for wall 3. The EPH,tot for heating, assessed with both calculation methods, was very close between them, with a small difference of about 6%. The main differences were found for cooling (EPC,tot), instead, where UNI 11300 returns much higher values (greater than 90%). These results can be due to the simplified calculation method provided by UNI 11300, which fails to account for the real complexity of exchanges during the cooling period.
The new innovative wall (wall 3) equipped with a thermally insulating panel made of recycled PET was determined to be the less energy-intensive wall, requiring a EPgl,tot between 8800 kWh (EN 52016) and 9400 kWh (UNI 11300), so confirming results from past studies, such as those of Ingrao et al. [10] and Maalouf et al. [34].
Similar trends can be highlighted when considering the electrical energy demand for all the case studies; for this analysis, the non-renewable, renewable, and total-conversion factors for electrical energy of 1.95, 0.47, and 2.42, respectively, were considered. additionally, in this case, UNI 11300 returned much higher results, of about 21–23%, mainly due to the higher primary energy needs obtained for cooling. When a heat pump was integrated with a photovoltaic system, the difference between UNI 11300 and EN 52016 increased only for wall 3 and by as much as 26%, whilst, for the other two walls, a decrease of as much as 20% was found. The integration of PV panels allowed for reducing the electrical energy demand by about 12–20% for heating and 50–60% for cooling with both calculation methods, for a total electric energy reduction of more than 70% for all three wall configurations.
Finally, the electrical energy demand required for all the energy services of the selected case study is also shown in Table 10, highlighting the electrical-energy need per m2.
Table 10.
Total electric consumption over a year for the three studied walls.
From the perspective of life-cycle-assessment (LCA) application, electrical energy consumption was normalized for the external surface of each wall. The results shown in Table 11 confirm the better energy behaviour of wall 3 (equipped with a thermal insulating panel made of recycled-PET). Accordingly, it could be of interest to understand how the two methodological approaches can also affect an LCA analysis.
Table 11.
Electrical energy index, normalized for the wall surface.
4. Conclusions
The consumption of resources and materials in buildings’ life cycles could be reduced through a circular approach aimed at increasing efficiency and sustainability. To this end, it would be desirable to use sustainable, low energy-intensive materials that are characterised by acceptable thermal insulation properties that contribute to reducing the heat losses and gains through the building envelope, and so, too, for the energy consumed by indoor heating and cooling.
To this end, the present study aimed to compare the energy performance of two innovative wall-sample solutions, equipped with R-PET panels (recycled materials) or DW straw bales (natural materials), with a basic one. The energy analysis focused mainly on comparing the thermal heat losses through the building’s envelope and the primary energy consumptions; for this purpose, a set of simulations and calculations were developed on the local scale. This was done in compliance with the current monthly-average-energy-calculation approach, mandatory by Italian regulation (UNI TS 11300) and, alternatively, with the new hourly-energy-calculation procedure, which is a more accurate approach, provided by EN 52016.
The obtained results allowed the authors to highlight the following main outcomes:
- i.
- Natural materials (i.e., the innovative wall-sample with DW straw bales) had the lowest thermal transmittance value (U = 0.155 W/m·sqK), obtaining a significant U-reduction of −38% (wall 1) and −28% (wall 2). However, the R-PET solution (wall 2, with recycled materials) can be considered an effective and alternative system to DW straw bales, especially when it is not possible to make 100% natural buildings;
- ii.
- The new innovative wall-sample with DW straw bales (wall 1, with natural materials) significantly reduces heat losses through the building’s envelope, by 5–10%, with a decrease of 10–20% in global total primary energy demand, compared with traditional envelopes;
- iii.
- The heat losses through the investigated walls, calculated with the hourly-energy-calculation procedure (EN 52016), was higher than the that obtained with UNI TS 11300 (increase of about 10–12% for heating and 26–36% for cooling). On the other hand, the other energy components taken into account in the energy balance (such as ventilation, heat gains, and solar radiation) are overestimated by UNI TS 11300 (up to 75%). This was due to the energy need of the building (which accounts for all the building’s energy components) being estimated to be much lower by the hourly-energy-calculation procedure (EN 52016), resulting in a lower primary energy need (which also accounts for HVAC systems) of 10–12% overall (6–7% for heating and more than 90% for cooling).
Therefore, based upon these outcomes, it is understood that there exist several differences between the two energy-calculation approaches, mainly in terms of heat losses and primary energy demand.
Finally, to answer the question ‘Recycled or natural?’, at this step of the research, it can be asserted that both the unconventional wall solutions investigated are characterised by remarkable energy performance rates, making them effective for enhancing the energy efficiency of buildings with respect to standard solutions.
Such a finding opens new avenues for assessing the environmental and economic sustainability of wall solutions when considered from a life-cycle perspective, so as to have a holistic and integrated understanding of their viability, and to best contribute to answering the proposed question. Such an area of research will be, indeed, explored by the present authors in a future study, through application of scientifically based tools like Life Cycle Assessment and Life Cycle Costing.
Author Contributions
Conceptualisation, methodology, data curation, writing—original draft preparation, and writing—review, and editing: D.P., F.S. and C.I.; software and validation, D.P.; supervision, N.C., and G.B. All authors have read and agreed to the published version of the manuscript.
Funding
This research received no external funding.
Institutional Review Board Statement
Not applicable.
Informed Consent Statement
Not applicable.
Data Availability Statement
The data presented in this study are both from Ingrao et al. (2014) [39] and (2016) [10], and from a new design analysis carried out consistently with the aim of the study. All the data are available under request to the corresponding author.
Acknowledgments
The authors wish to warmly thank: J. Adamczyk and R. Dylewski for kindly inviting us to publish in the journal’s special issue “Building Energy: Economics and Environment”, of which they are guest editors, and our two anonymous reviewers for their invaluable review comments on an earlier version of this manuscript.
Conflicts of Interest
The authors declare no conflict of interest.
Symbol
| CO2 | carbon dioxide |
| COP | coefficient of performance |
| DW | durum wheat |
| EER | energy efficiency ratio |
| EP | primary energy |
| EPBD | energy performance of buildings directive |
| EPC | energy performance certificate |
| fRSI | temperature factor |
| GHG | greenhouse gases |
| ηC,ls | utilization factor for cooling |
| ηH,gn | utilization factor for heating |
| HVAC | heating/ventilation and air-conditioning system |
| LCA | life-cycle assessment |
| nZEB | nearly zero energy buildings |
| Psat | saturation vapour pressure |
| QC,ht | heat losses through the building envelope during the cooling |
| QC,nd | energy need for cooling |
| Qgn | heat gain |
| QH,ht | heat losses through the building envelope during the heating |
| QH,nd | energy need for heating |
| Qint | internal heat gain |
| Qr | extra heat flow due to thermal radiation to the sky |
| Qsol | heat gain due to solar radiation through the windows |
| Qtr | heat losses through the building envelope due transmission |
| Qv | heat losses due to ventilation |
| RC | resistance and capacitance |
| Tin | indoor temperature |
| Ts,min | minimum surface temperature |
| Tout | outdoor temperature |
| U | thermal transmittance |
| subscripts | |
| C | cooling |
| H | heating |
| gl | global |
| n-ren | not renewable |
| ren | renewable |
| W | domestic hot water |
References and Notes
- International Energy Agency. Global Status Report for Buildings and Construction 2019. IEA, Paris. Available online: https://www.iea.org/reports/global-status-report-for-buildings-and-construction-2019 (accessed on 29 June 2021).
- Ingrao, C.; Messineo, A.; Beltramo, R.; Yigitcanlar, T.; Ioppolo, G. How can life cycle thinking support sustainability of buildings? Investigating life cycle assessment applications for energy efficiency and environmental performance. J. Clean. Prod. 2018, 201, 556–569. [Google Scholar] [CrossRef]
- Goubran, S. On the role of construction in achieving the SDGs. J. Sustain. Res. 2019, 1, e190020. [Google Scholar]
- Omer, M.A.B.; Noguchi, T. A conceptual framework for understanding the contribution of building materials in the achievement of Sustainable Development Goals (SDGs). Sustain. Cities Soc. 2020, 52, 101869. [Google Scholar] [CrossRef]
- Asdrubali, F.; Schiavoni, S.; Horoshenkov, K.V. A review of sustainable materials for acoustic applications. J. Build. Acoust. 2012, 19, 283–312. [Google Scholar] [CrossRef]
- Ingrao, C.; Arcidiacono, C.; Bezama, A.; Ioppolo, G.; Winans, K.; Koutinas, A.; Gallego-Schmid, A. Sustainability issues of by-product and waste management systems, to produce building material commodities: A comprehensive review of findings from a Virtual Special Issue. Resour. Conserv. Recycl. 2019, 146, 358–365. [Google Scholar] [CrossRef] [Green Version]
- Circle Economy. The Circularity Gap Report 2021. Available online: https://www.circularity-gap.world/2021#downloads (accessed on 29 June 2021).
- International Resource Panel. Resource Efficiency and Climate Change: Material Efficiency Strategies for a Low-Carbon Future; Hertwich, E., Lifset, R., Pauliuk, S., Heeren, N., Eds.; A Report of the International Resource Panel; United Nations Environment Programme: Nairobi, Kenya, 2020. [Google Scholar]
- La Rosa, A.D.; Recca, A.; Gagliano, A.; Summerscales, J.; Latteri, A.; Cozzo, G.; Cicala, G. Environmental impacts and thermal innovation performance of innovative composite solutions for building applications. Constr. Build. Mater. 2014, 55, 406–414. [Google Scholar] [CrossRef]
- Ingrao, C.; Scrucca, F.; Tricase, C.; Asdrubali, F. A comparative Life Cycle Assessment of external wall-compositions for cleaner construction solutions in buildings. J. Clean. Prod. 2016, 124, 283–298. [Google Scholar] [CrossRef]
- Ingrao, C.; Arcidiacono, C.; Siracusa, V.; Niero, M.; Traverso, M. Life Cycle Sustainability Analysis of Resource Recovery from Waste Management Systems in a Circular Economy Perspective-Key Findings from This Special Issue. Resources 2021, 10, 32. [Google Scholar] [CrossRef]
- Švajlenka, J.; Kozlovská, M. Effect of accumulation elements on the energy consumption of wood constructions. Energy Build. 2019, 198, 160–169. [Google Scholar] [CrossRef]
- Švajlenka, J.; Kozlovská, M. Analysis of the Thermal–Technical Properties of Modern Log Structures. Sustainability 2021, 13, 2994. [Google Scholar] [CrossRef]
- Scrucca, F.; Ingrao, C.; Maalouf, C.; Moussa, T.; Polidori, G.; Messineo, A.; Arcidiacono, C.; Asdrubali, F. Energy and carbon footprint assessment of production of hemp hurds for application in buildings. Environ. Impact Assess. Rev. 2020, 84, 106417. [Google Scholar] [CrossRef]
- Asdrubali, F.; Bianchi, F.; Cotana, F.; D’Alessandro, F.; Pertosa, M.; Pisello, A.L.; Schiavoni, S. Experimental thermo-acoustic characterisation of innovative common reed bio-based panels for building envelope. Build. Environ. 2016, 102, 217–229. [Google Scholar] [CrossRef]
- Colangelo, G.; Raho, B.; Milanese, M.; de Risi, A. Numerical evaluation of a hvac system based on a high-performance heat transfer fluid. Energies 2021, 14, 3298. [Google Scholar] [CrossRef]
- Carlander, J.; Moshfegh, B.; Akander, J.; Karlsson, F. Effects on energy demand in an office building considering location, orientation, façade design and internal heat gains—A parametric study. Energies 2020, 13, 6170. [Google Scholar] [CrossRef]
- Magrini, A.; Lentini, G. NZEB analyses by means of dynamic simulation and experimental monitoring in mediterranean climate. Energies 2020, 13, 4784. [Google Scholar] [CrossRef]
- Efkarpidis, N.A.; Christoforidis, G.C.; Papagiannis, G.K. Modeling of Heating and Cooling Energy Needs in Different Types of Smart Buildings. IEEE Access 2020, 8, 29711–29728. [Google Scholar] [CrossRef]
- UNI TS 11300—1. Energy Performance of Buildings—Part 1: Evaluation of Energy Need for Space Heating and Cooling. 2014
- UNI TS 11300—Part 2: Energy Performance of Buildings—Evaluation of Primary Energy Need and of System Efficiencies for Space Heating, Domestic Hot Water Production, Ventilation and Lighting for Non-Residential Buildings. 2014
- UNI TS 11300—Part 3: Energy Performance of Buildings Part 3—Evaluation of Primary Energy Need and of System Efficiencies for Cooling. 2010
- UNI TS 11300—Part 4: Energy Performance of Buildings—Renewable Energy and Other Generation Systems for Space Heating and Domestic Hot Water Production. 2016
- Buratti, C.; Cristarella Orestano, F.; Palladino, D. Comparison of the Energy Performance of Existing Buildings by Means of Dynamic Simulations and Artificial Neural Network. Energy Procedia 2016, 101, 176–183. [Google Scholar] [CrossRef]
- Bruno, R.; Pizzuti, G.; Arcuri, N. The Prediction of Thermal Loads in Building by Means of the EN ISO 13790 Dynamic Model: A Comparison with TRNSYS. Energy Procedia 2016, 101, 192–199. [Google Scholar] [CrossRef]
- Semple, S.; Jenkins, D. Variation of energy performance certificate assessments in the European Union. Energy Policy 2020, 137, 111127. [Google Scholar] [CrossRef]
- D’Amico, A.; Giulla, G.; Panno, D.; Ferrari, S. Building energy demand assessment through heating degree days: The importance of a climatic dataset. Appl. Energy 2019, 242, 1285–1306. [Google Scholar] [CrossRef]
- UNI EN ISO 52016-1—Energy Performance of Buildings—Energy Needs for Heating and Cooling, Internal Temperatures and Sensible and Latent Heat Loads—Part 1: Calculation Procedures. 2018
- Bruno, R.; Bevilacqua, P.; Arcuri, N. Assessing cooling energy demands with the EN ISO 52016-1 quasi-steady approach in the Mediterranean area. J. Build. Eng. 2019, 24, 100740. [Google Scholar] [CrossRef]
- Ohlsson, K.E.A.; Olofsson, T. Benchmarking the practice of validation and uncertainty analysis of building energy mod-els. Renew. Sustain. Energy Rev. 2021, 142, 110842. [Google Scholar] [CrossRef]
- Summa, S.; Tarabelli, L.; Di Perna, L. Evaluation of ISO 52010-1: 2017 and proposal for an alternative calculation procedure. Sol. Energy 2021, 218, 262–281. [Google Scholar] [CrossRef]
- Congedo, P.M.; Baglivo, C.; Centonze, G. Walls comparative evaluation for the thermal performance improvement of low-rise residential buildings in warm Mediterranean climate. J. Build. Eng. 2020, 28, 101059. [Google Scholar] [CrossRef]
- Mazzarella, L.; Scoccia, R.; Colombo, P.; Motta, M. Improvement to EN ISO 52016-1:2017 hourly heat transfer through a wall assessment: The Italian National Annex. Energy Build 2020, 210, 109758. [Google Scholar] [CrossRef]
- Maalouf, C.; Ingrao, C.; Scrucca, F.; Moussa, T.; Bourdot, A.; Tricase, C.; Presciutti, A.; Asdrubali, F. An energy and Carbon Footprint assessment upon the usage of hemp-lime concrete and recycled-PET façades for office facilities in France and Italy. J. Clean. Prod. 2018, 170, 1640–1653. [Google Scholar] [CrossRef]
- Moussa, T.; Maalouf, C.; Ingrao, C.; Scrucca, F.; Costantine, G.; Asdrubali, F. Bio-based and recycled-waste materials in buildings: A study of energy performance of hemp-lime concrete and recycled-PET façades for office facilities in France and Italy. Sci. Technol. Built Environ. 2018, 24, 492–501. [Google Scholar] [CrossRef]
- Decree of President of the Republic 26 August 1993, n. 412—Regulation for the Design, Installation, Operation, and Maintenance of the Building Heating Systems to Reduce Energy Consumption in Implementation of the Law 9 January 1991 n. 10. 1993. Available online: https://www.gazzettaufficiale.it/eli/id/1993/10/14/093G0451/sg (accessed on 15 June 2021). (In Italian).
- Interministerial Decree 26 June 2015—Application of Calculation Methodologies for Energy Performance Assessment and Definition of Minimal Requirement of Buildings. 2015. Available online: https://www.gazzettaufficiale.it/eli/id/2015/07/15/15A05199/sg (accessed on 15 June 2021). (In Italian).
- Chinnici, G.; D’Amico, M.; Rizzo, M.; Pecorino, B. Analysis of biomass availability for energy use in Sicily. Renew. Sustain. Energy Rev. 2015, 52, 1025–1030. [Google Scholar] [CrossRef]
- Ingrao, C.; Lo Giudice, A.; Tricase, C.; Rana, R.; Mbohwa, C.; Siracusa, V. Recycled-PET fibre based panels for building thermal insulation: Environmental impact and improvement potential assessment for a greener production. Sci. Total Environ. 2014, 493, 914–929. [Google Scholar] [CrossRef]
- UNI EN ISO 6946: Components and Elements of Buildings—Thermal Resistance and Thermal Transmittance—Calculation Method. 2018
- Legislative Decree 3 March 2011 n. 28. Implementation of Directive 2009/28/CE on the Promotion of the Use of Energy from Renewable Sources and Amending and Subsequently Repealing Directives 2001/77/EC and 2003/30/EC. Available online: https://www.gazzettaufficiale.it/eli/id/2011/03/28/011G0067/sg (accessed on 15 June 2021). (In Italian).
Publisher’s Note: MDPI stays neutral with regard to jurisdictional claims in published maps and institutional affiliations. |
© 2021 by the authors. Licensee MDPI, Basel, Switzerland. This article is an open access article distributed under the terms and conditions of the Creative Commons Attribution (CC BY) license (https://creativecommons.org/licenses/by/4.0/).