2. Building and Equipment
2.1. Site and Climate
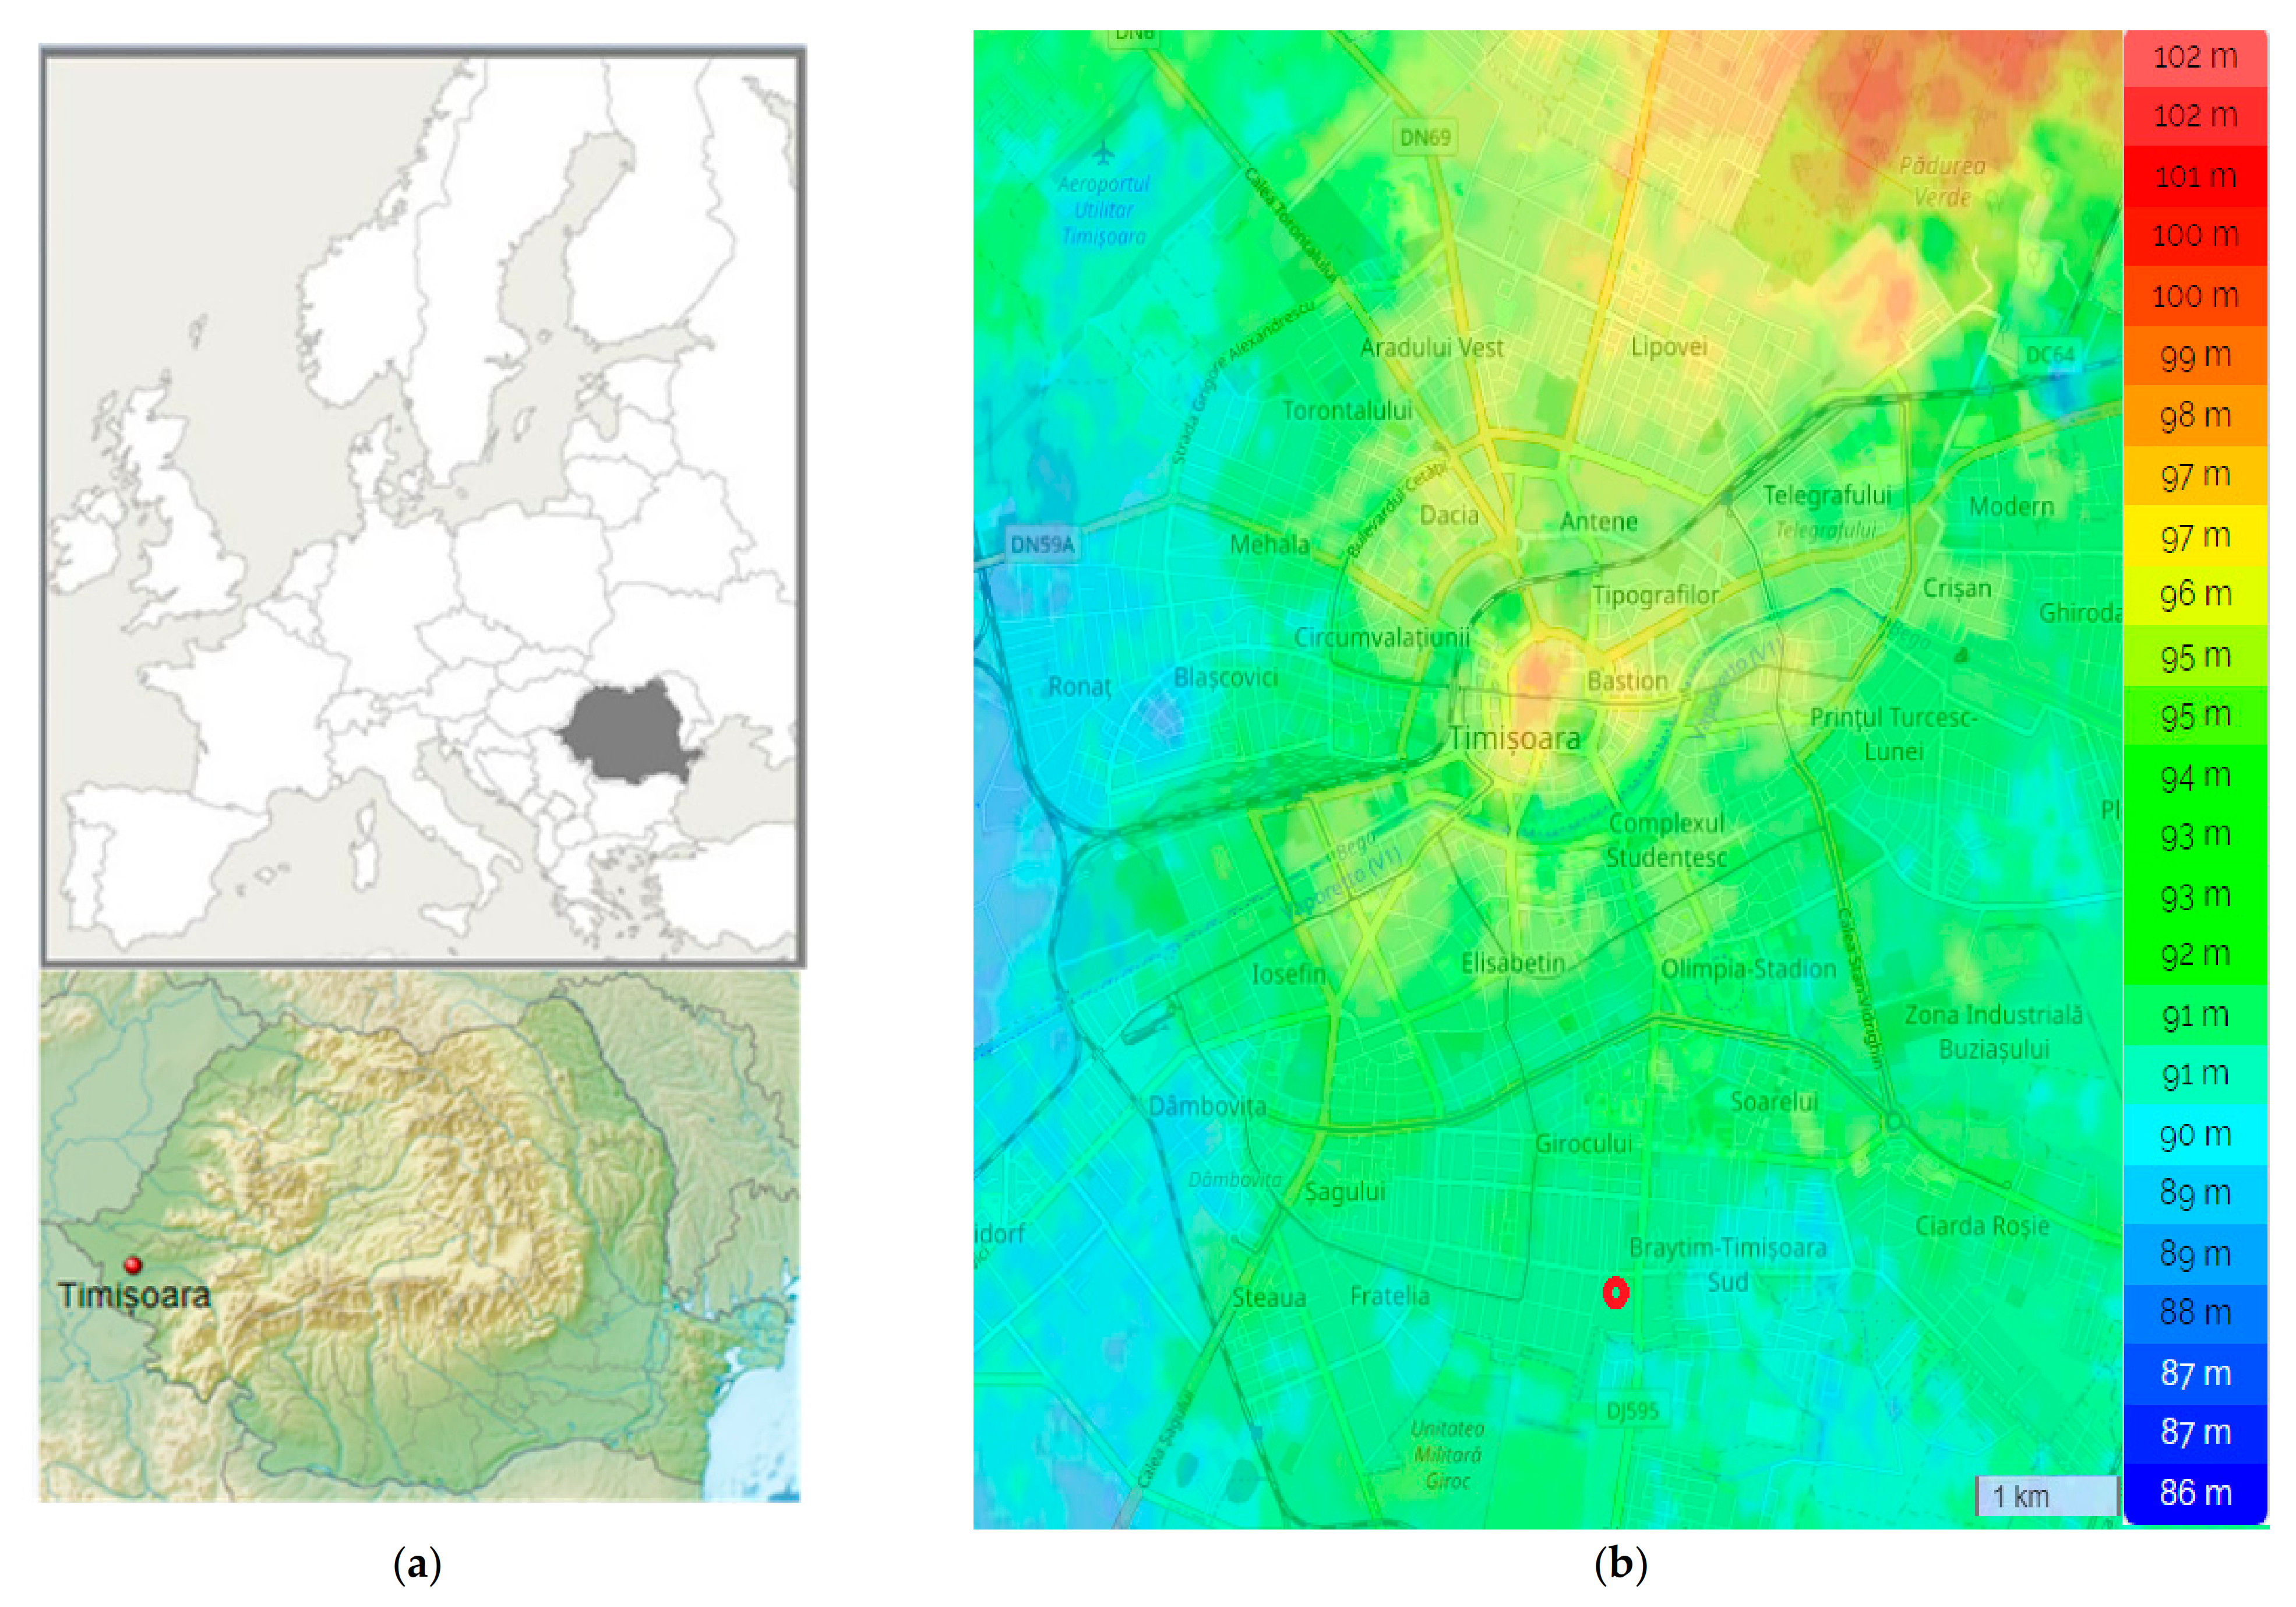
The case study is located in Timişoara, the capital city of Timiş County, western Romania (
Figure 2).
Located on the Bega River, the city of Timișoara is considered the informal capital of the historical Banat region, being the country’s third most populous city, with almost 320,000 inhabitants and close to half a million inhabitants in its metropolitan area [
18]. At a geographical level, Timișoara is located at the intersection of the 21st meridian east with the 45th parallel north, being almost an equal distance from the north pole and the equator and in the eastern hemisphere. Timișoara lies at an altitude of 86–102 m (
Figure 2b) on the southeast edge of the Banat Plain which is part of the Pannonian Plain.
According to the Köppen-Geiger climate classification [
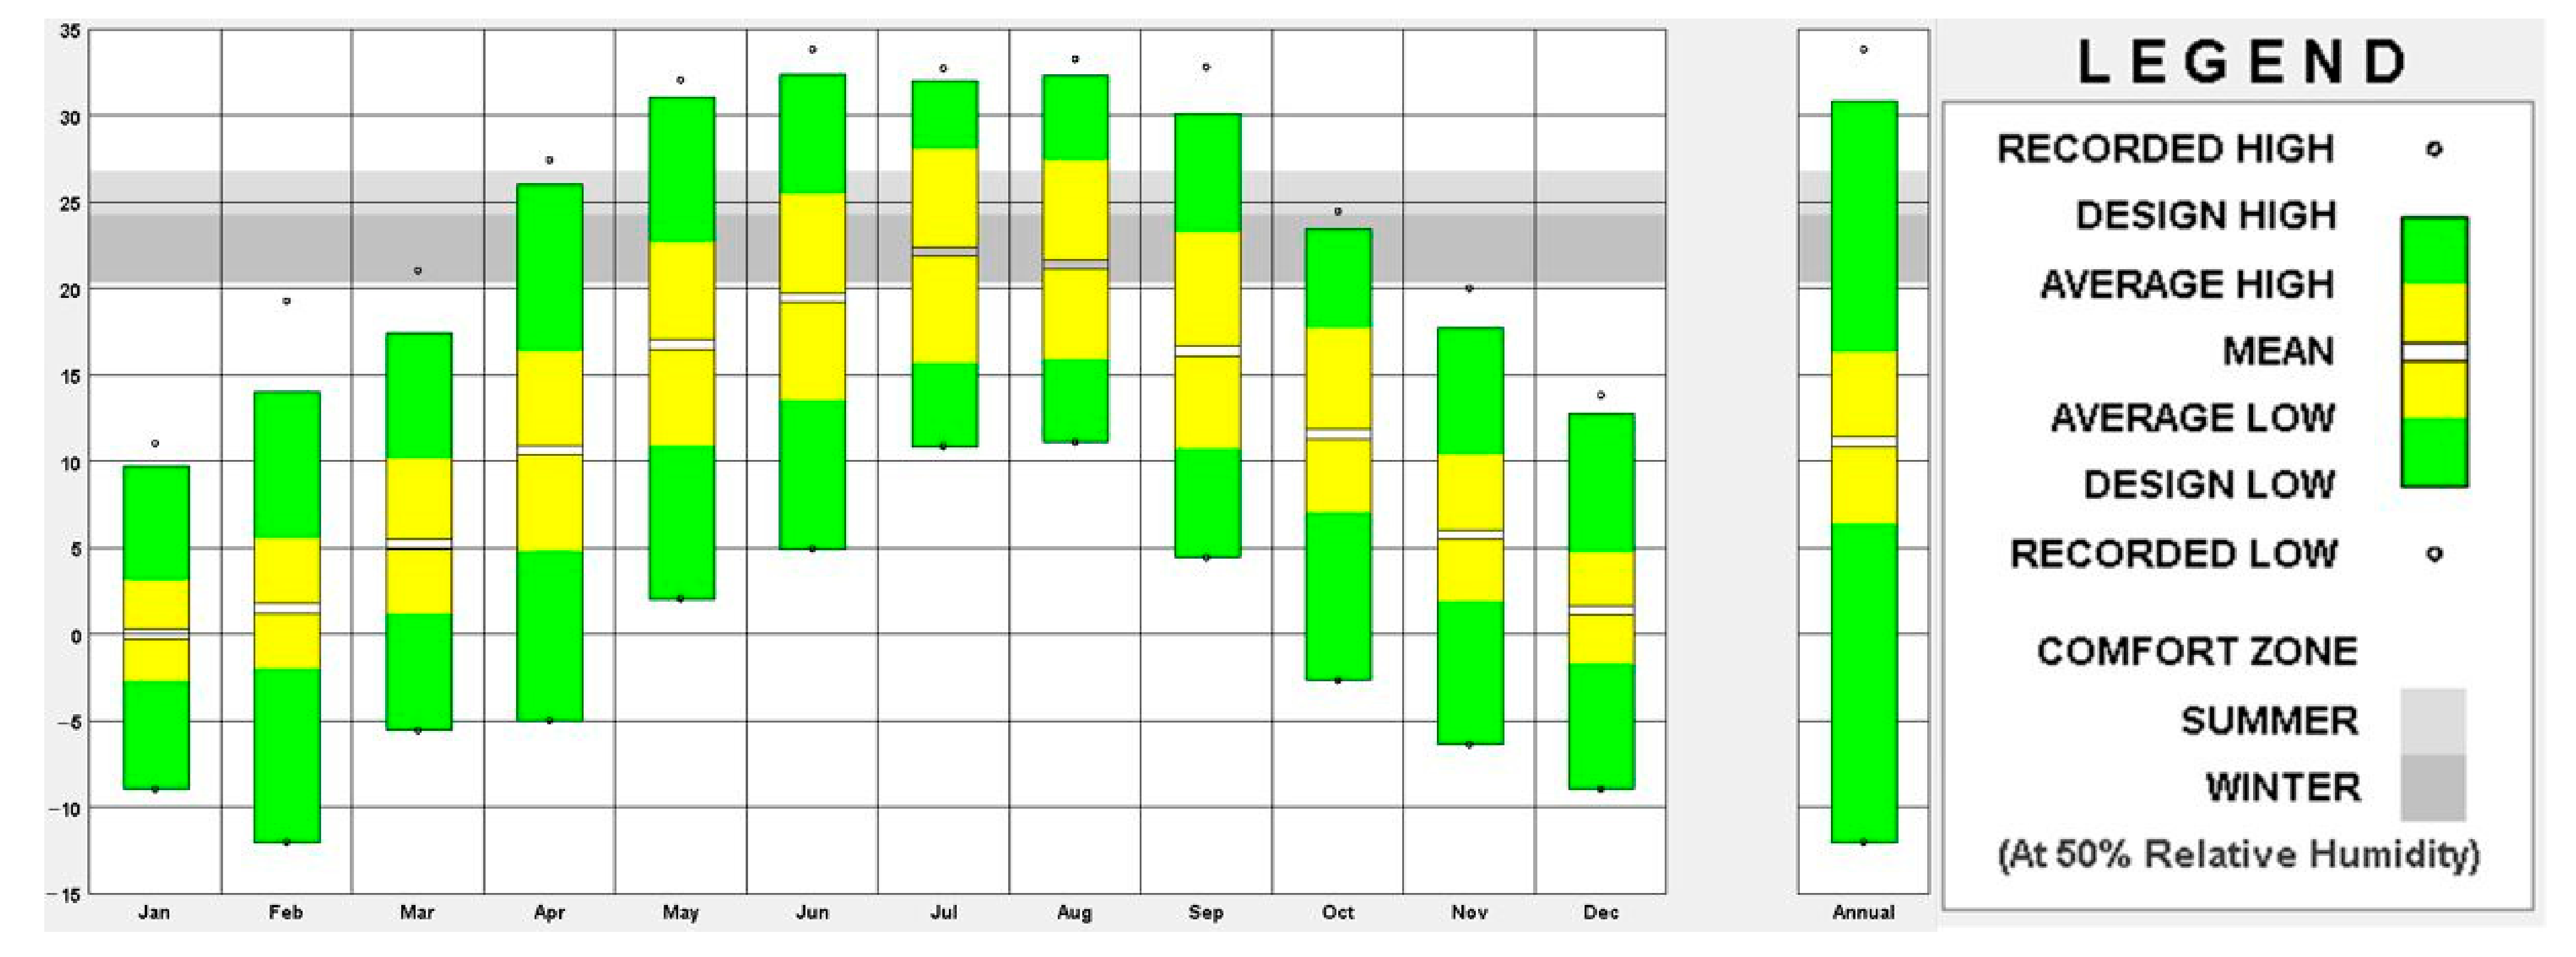
19], the Banat region exhibits a Cfb climate; a marine climate with mild summers and cool but not cold winters. The average annual temperature in Timișoara is 11.1 °C, having the warmest month, on average, in July, with an average temperature of 21.7 °C (average high 27.8 °C) and the coolest month on average, January, with an average temperature of −1.7 °C (average low −4.8 °C) [
20,
21].
Figure 3 shows calculated values for the dry bulb temperature ranges for each month and the full year, enclosing the recorded high and low temperature (round dots), the design high and low temperatures (top and bottom of green bars), average high and low temperatures (top and bottom of yellow bars), and average temperature (open slot). The majority of the recorded hours are below the comfort zone, both during the warm and cold periods of the year.
The annual average relative humidity is 80% in Timișoara, where June is the month with the highest rainfall (76 mm average rainfall) and February is the driest month (36 mm average rainfall) [
20].
Recent studies [
23,
24,
25] over climate and bioclimatic conditions in Romania show changes in the bioclimatic indices over the period 1961–2016 in terms of frequency of occurrence considering the number of days for each class of bioclimatic indices and in terms of duration of their occurrence period. For the stated period, bioclimatic indices such as the universal thermal climate index (UTCI), the effective temperature (ET), the equivalent temperature (TeK), the temperature-humidity index (THI), and the cooling power (H) reveal a shift from cold stress conditions to warm and hot conditions, as the climate in the big cities of Romania (Timișoara being among them) became hotter during the warm periods of the year and milder during the cold season. In terms of thermal sensation, a general negative trend was noticed in the number of comfortable days [
21].
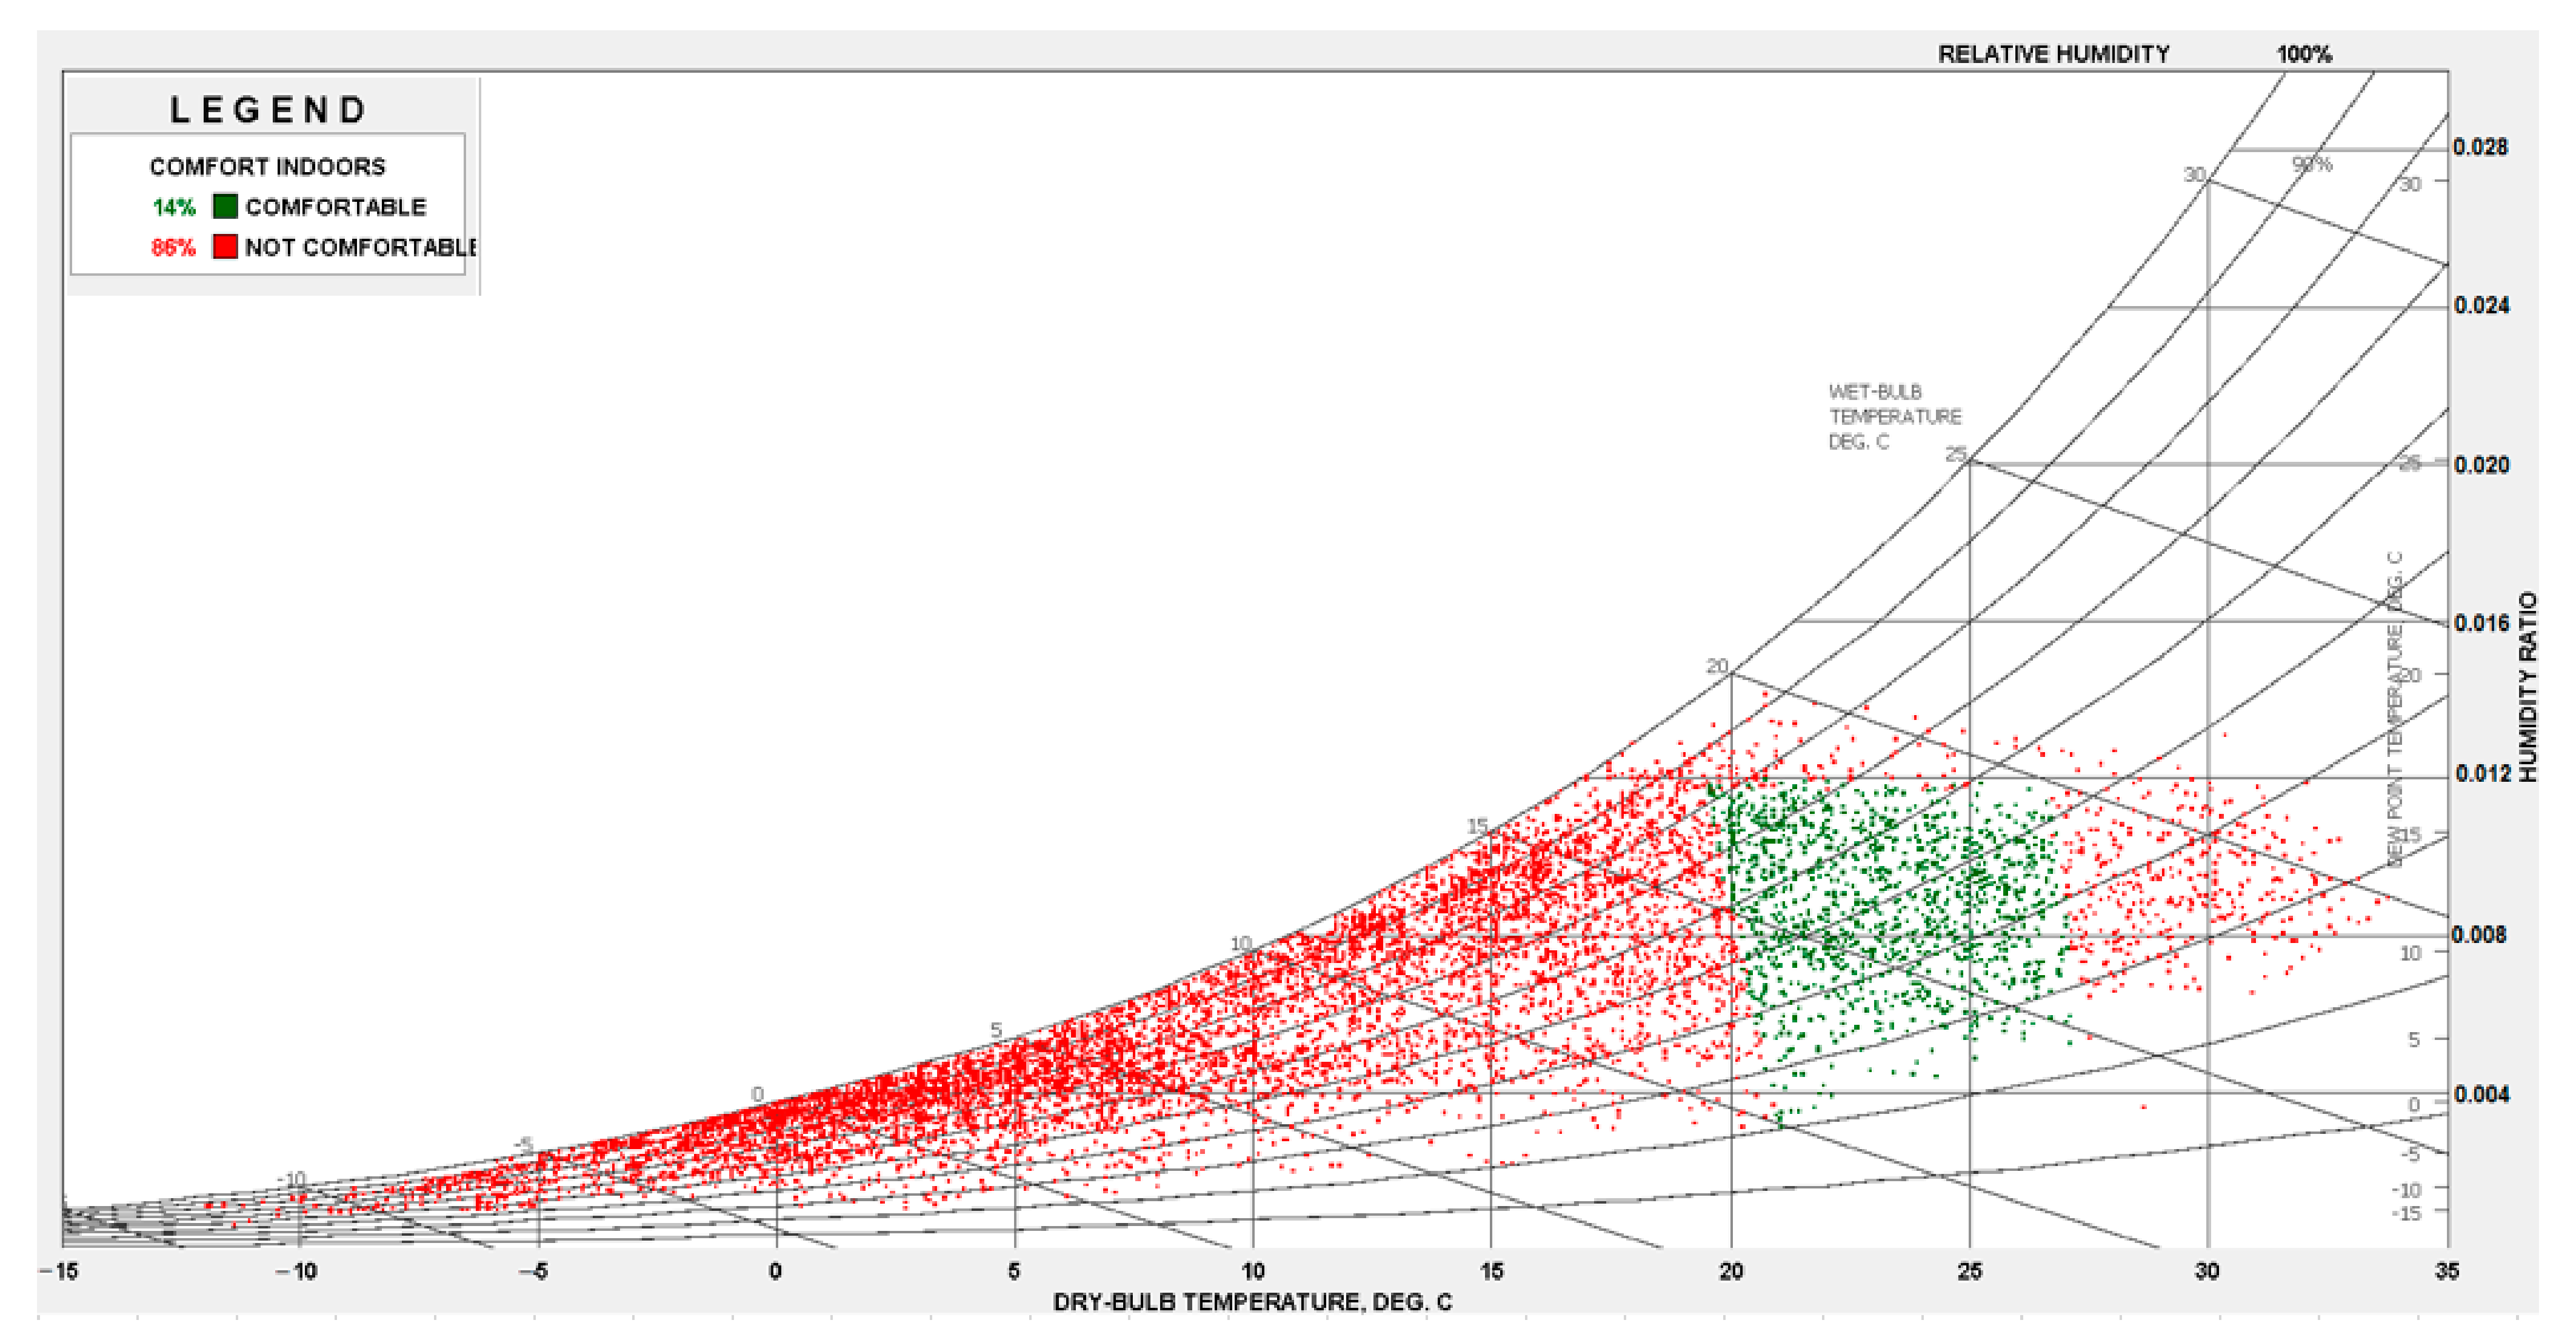
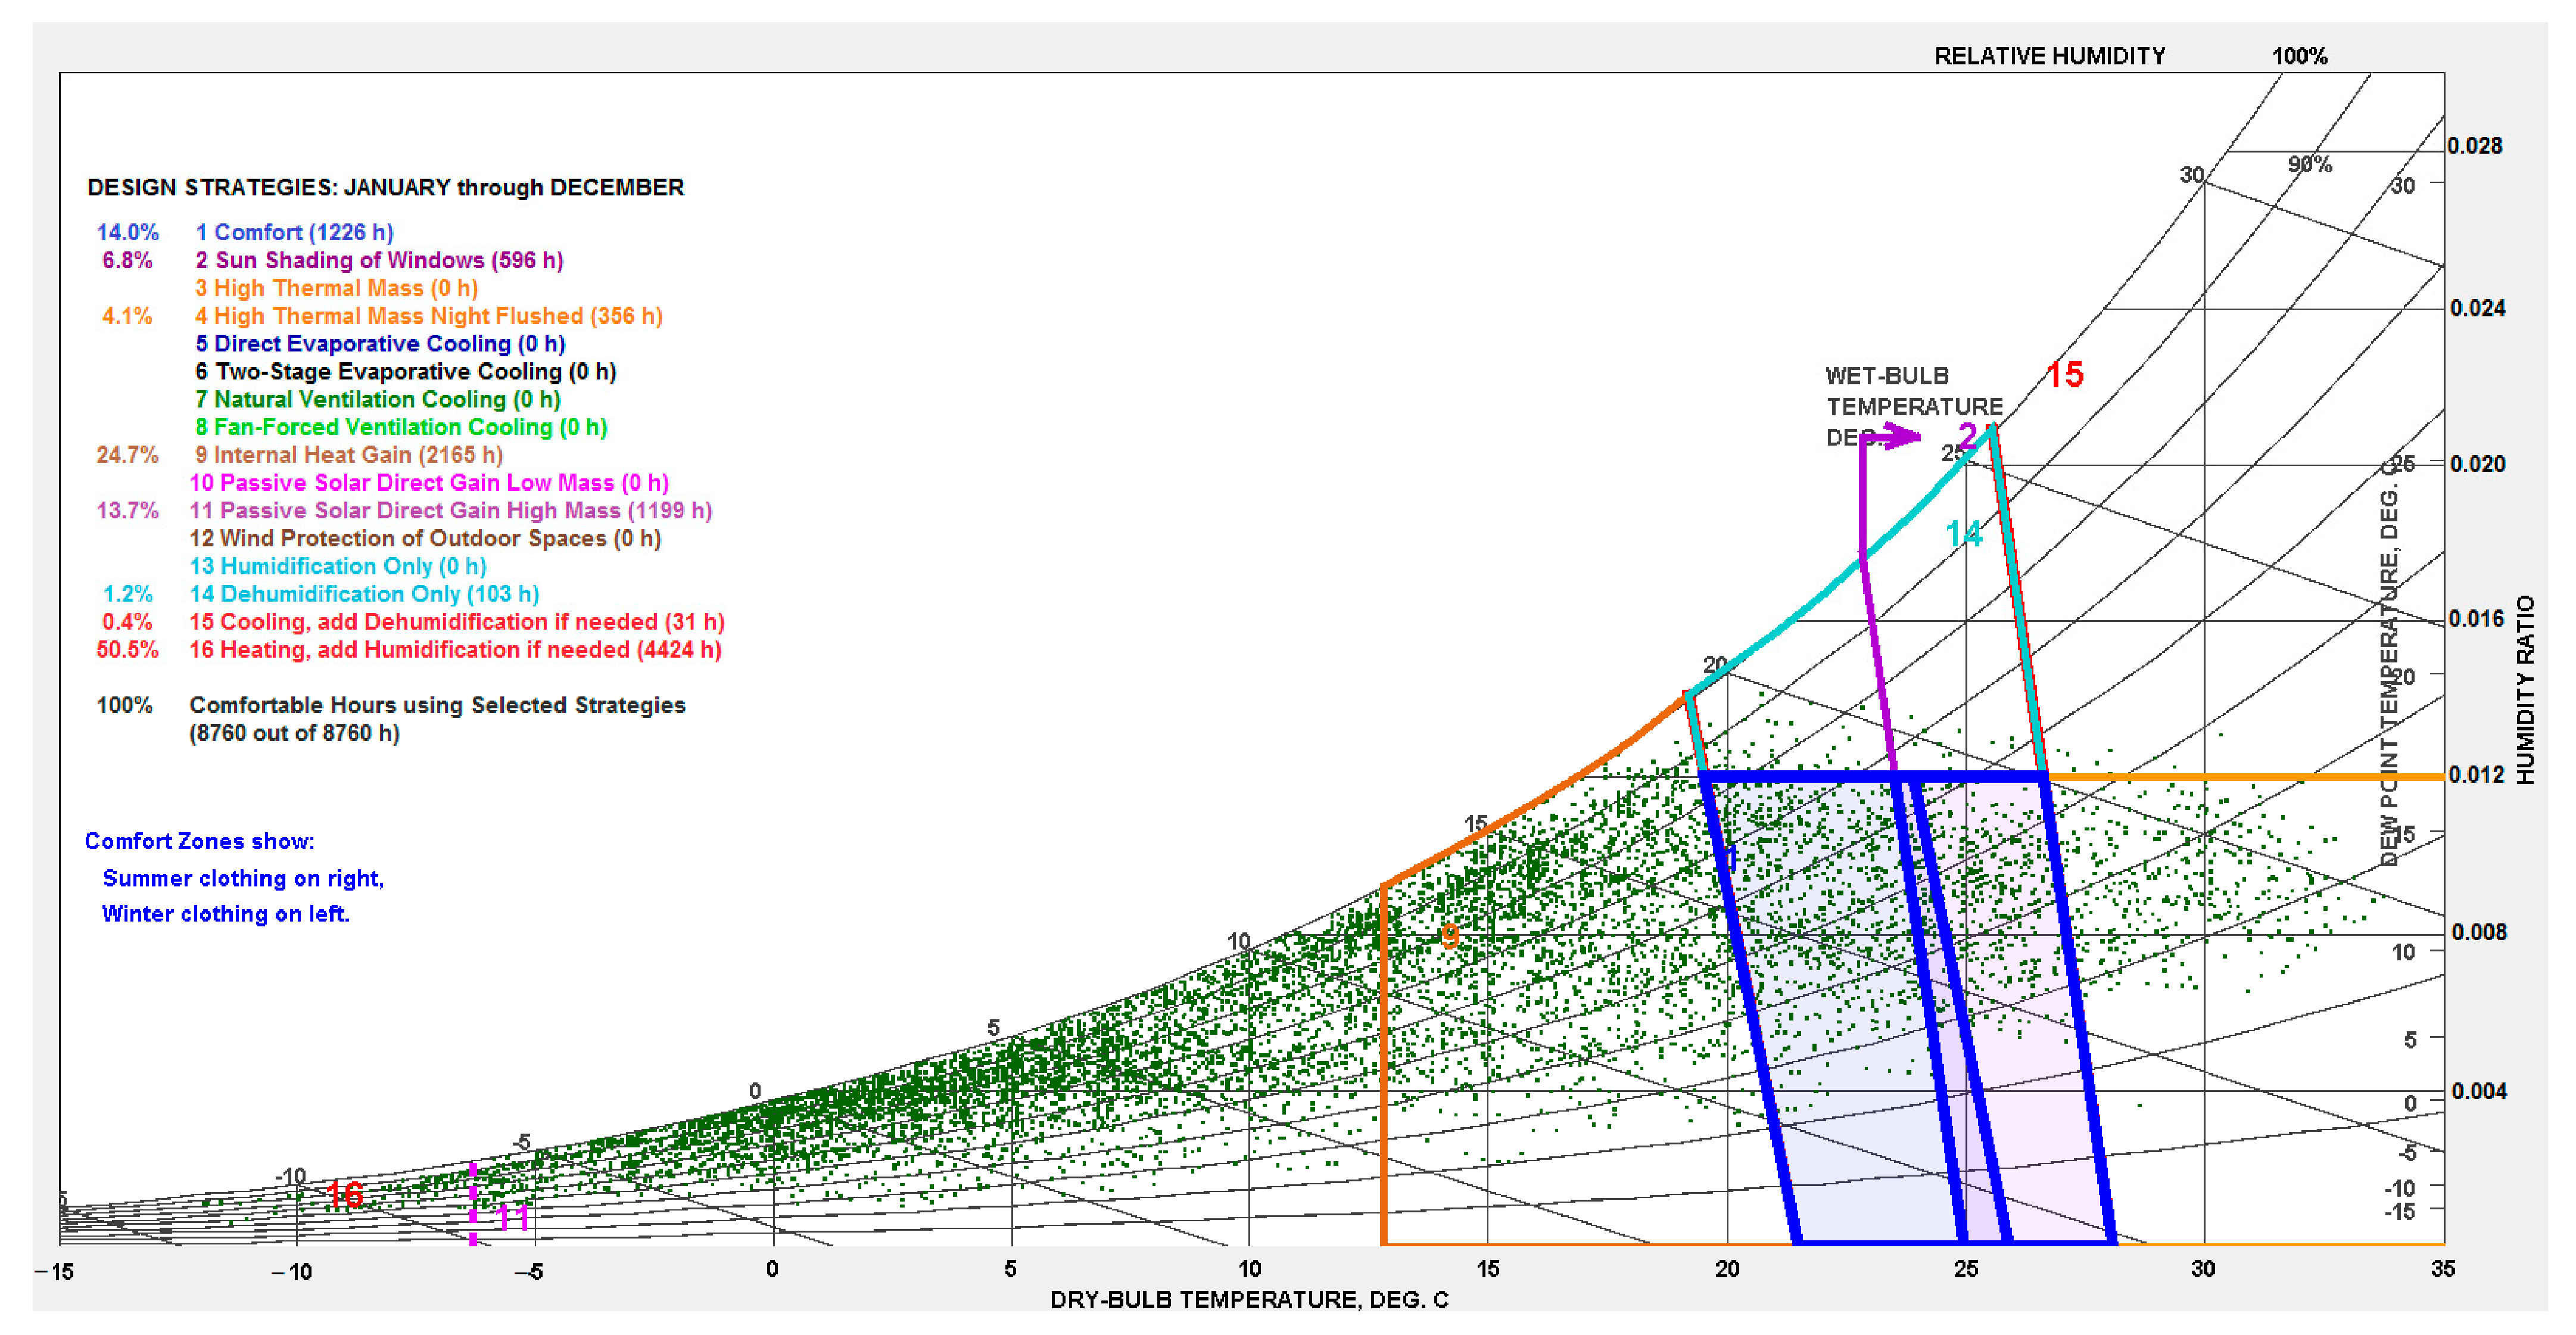
Figure 4 shows a psychrometric chart for the Timișoara location, based on IWEC weather data [
18] and ASHRAE 55 standard [
23] and shows that in residential buildings only 14% of the hours (1226 h) during a year are indoor comfortable hours for a human being when no design strategies (such as cooling, heating, humidification, dehumidification, sun shading of windows, natural ventilation cooling, fan-forced ventilation cooling, etc.) are considered. Every hour of registered climate data is shown as a dot on this chart.
The colour of each dot represents whether the hour is comfortable (green dots) or uncomfortable (red dots). To reach more than 90% of indoor comfortable hours during a year, one must consider design strategies such as heating and humidification for 7047 h (from a total of 8760 h annually) and cooling along with dehumidification (when needed) for 387 h annually which leads to significant energy use during the year and for the building’s life span. In this specific location, the same achievement of more than 90% of indoor comfortable hours during a year can be reached when integrating holistic and passive design strategies in building design, such as internal heat gain, sun shading of windows, direct gain passive solar, night flushing of high thermal mass, etc. This reduces heating and humidification needs to 4424 h annually (almost 38% less heating hours annually) and cooling and dehumidification needs to 31 h annually (92% less cooling hours annually), as shown in
Figure 5.
Integrating passive design strategies in building design and concurrent engineering (CE) overall is the necessary to meet the climate change milestones related to keeping the global temperature rise for this century well-below two degree Celsius, to achieve a climate neutral world by mid-century within zero-carbon solution targets [
5] in current bioclimatic conditions with the context of a future weather shift and to provide a more resilient future for our built environment.
Based on IWEC data [
21], the representative concentration pathway 4.5 [
26] emissions scenario (RCP of an additional 4.5 W/m
2 of heating in 2100 compared with preindustrial conditions representing moderately aggressive mitigation that requires that carbon dioxide (CO
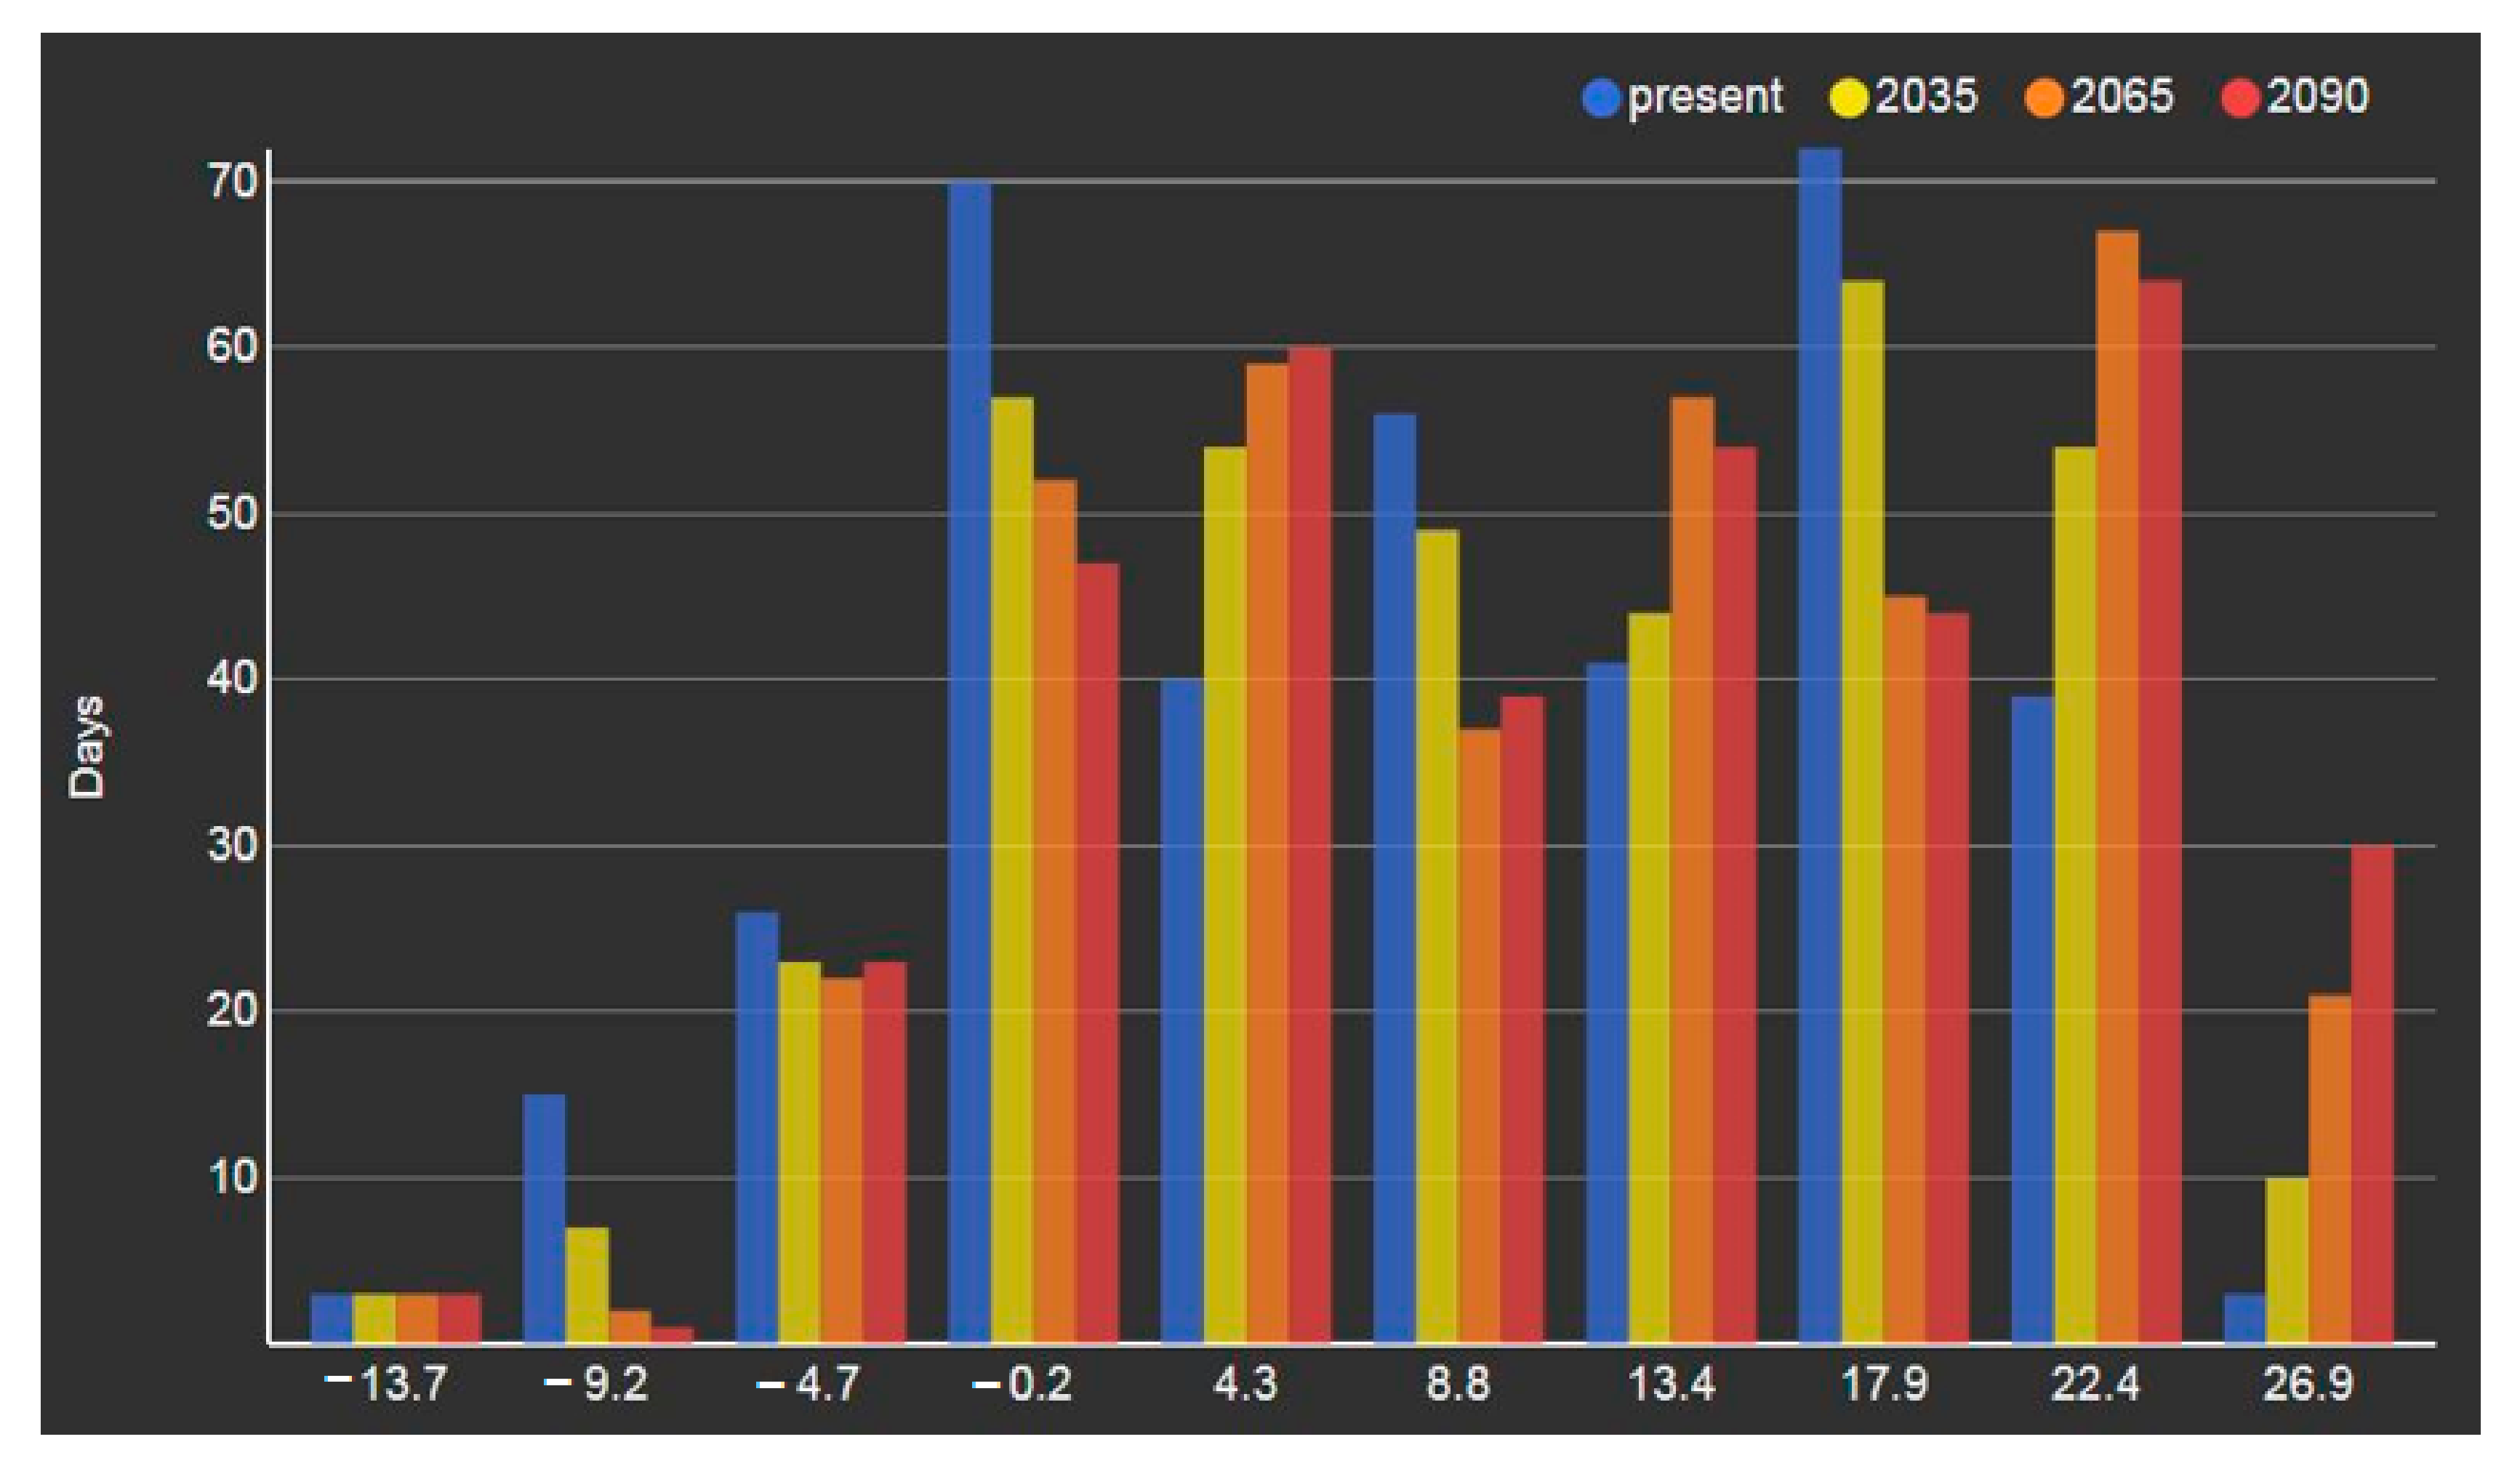
2) emissions start declining by approximately 2045) and a warming percentile of 50%, the local weather previsions over the course of the 21st century due to the impact of climate change, shows a continuous shift in decreasing number of colder days in a typical year and an increasing number of hotter days (
Figure 6). For example, the number of days with an average temperature of 26.9 °C will increase from 3, registered at the present, to 10 days by 2035, to 21 days by 2065 and will reach a number of 30 days annually by 2090, while the number of days with an average temperature of −0.2 °C will decrease from 70, which are registered at present, to 57 days by 2035, to 52 days by 2065 and 47 days annually by the year 2090.
As RCP 1.9 is the pathway that limits global warming to below 2 °C, as the Paris Agreement specifies, which is significantly below the greenhouse gas concentration trajectory of RCP 4.5, which is considered to be a possible scenario for 2100 (in which global temperature rises between 2 and 3 °C, over the 21st century and many plants and animal species will be unable to adapt to its effects). Integrating a holistic concept in sustainable building design proves to be important.
2.2. Construction of the Experimental Module
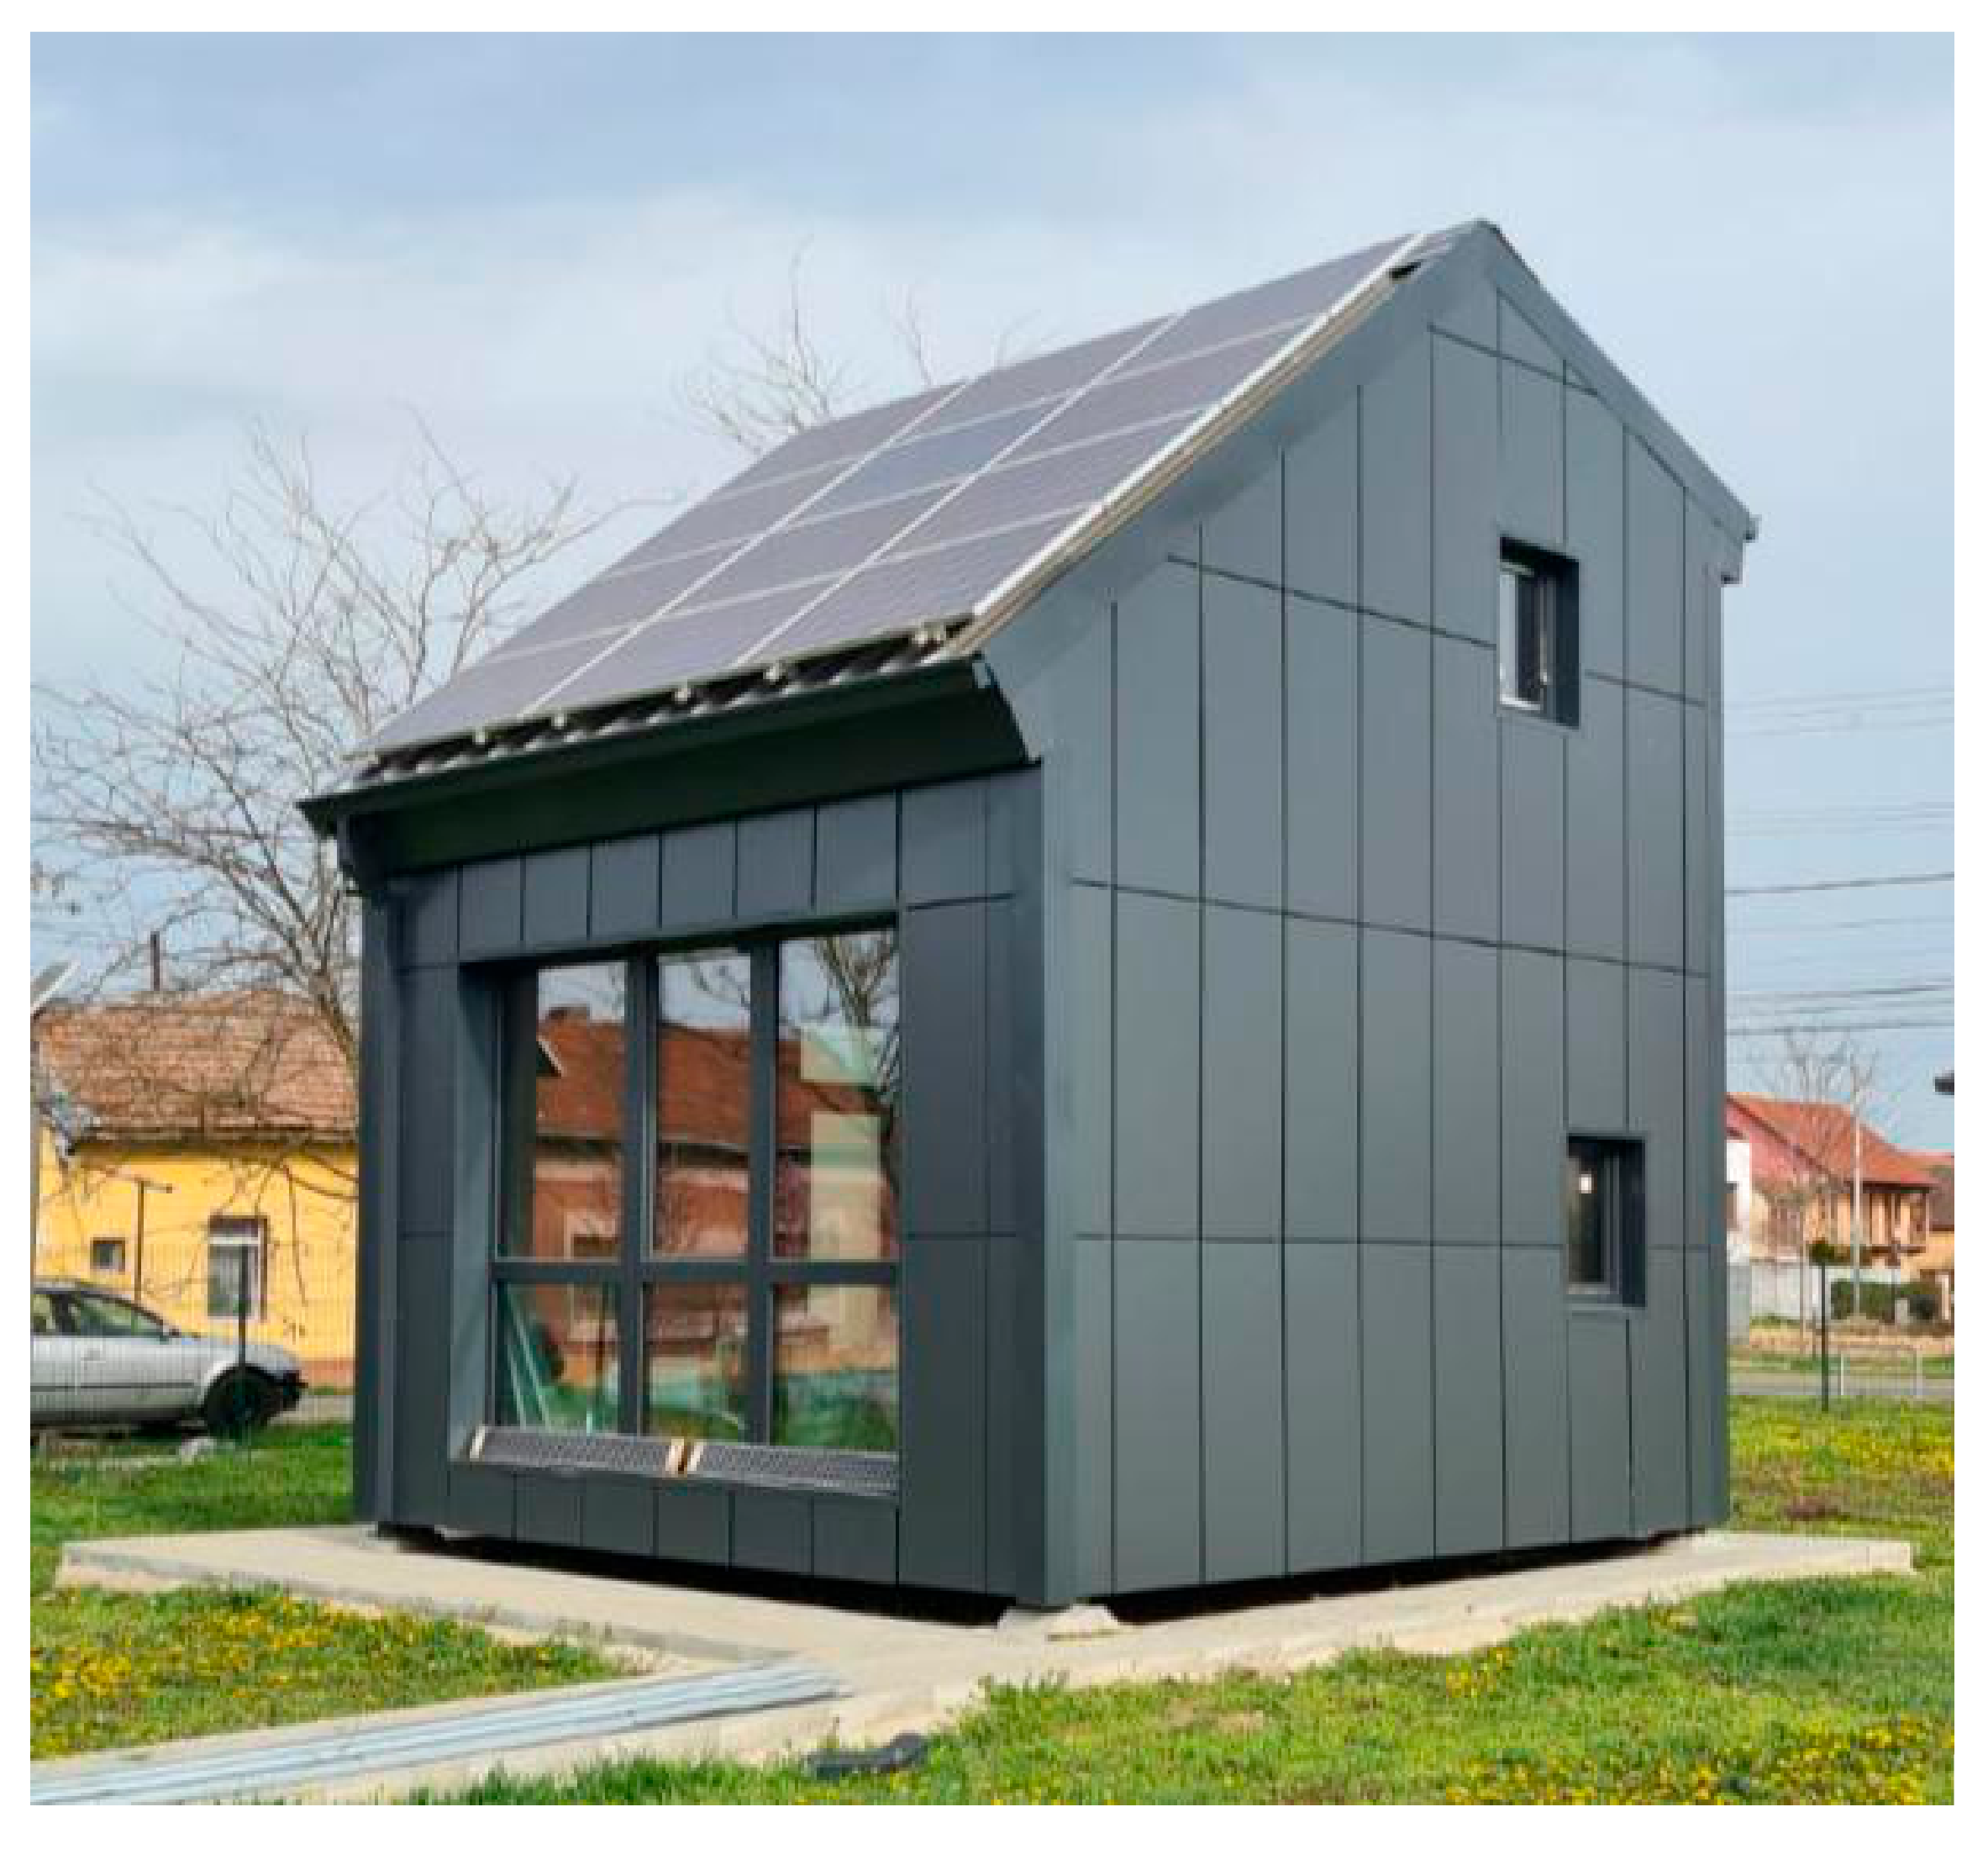
The modular laboratory, illustrated in
Figure 7, on which the experimental measurements were performed was constructed based on a selection of structural systems and materials under constituent factors of sustainable building principles, such as material efficiency, resource efficiency, health and well-being or cost-efficiency.
The structure is a lightweight steel-framed (LSF) construction with cold-formed elements. The structural system was chosen on the account of the sustainable characteristics of steel, essentially, small weight with high mechanical strength, tremendous potential for recycling, deconstruction and future reuse, onsite reduced severance, speed of construction, flexible structural system for modular design, economic in transportation and handling, reduced foundation costs, [
28,
29,
30]. The LSF structure is a two-story, modular construction, with a 5 m long span, 5 m long bay, 3.80 m eave height (on the southern side), 6.10 m eave height (on the northern side), and 6.95 m ridge height.
The eastern façade has two 0.76 m × 0.96 m window openings, the southern façade integrates a 3.56 m × 2.73 m glass curtain opening, while the western façade has a 0.76 m × 0.96 m window opening and a 0.97 m × 2.73 m door opening. There are no openings on the northern side of the building. The access to the second floor is ensured by a 1 m × 1 m attic scuttle door.
Using an LSF structure allowed the adoption of a precast wedge foundation system, designed as a quick foundation system, easy to handle and install, fully recoverable at the end-of-Life of the building and suitable for reuse [
31]. The foundations’ design was part of the holistic approach design of the experimental module, adopted regarding environmentally conscious design, modular and standardized design, reusable/recyclable element design, life cycle design, waste generation assessment, environment-friendly demolition method, working conditions, safety design and consideration of costs for materials, waste disposal and life cycle [
9].
The southern side of the roof was designed with a roof pitch of 42 °, in the pursuit of gaining an optimal performance of a roof-mounted solar energy system.
The materials used in the experimental module’s construction were selected in the same approach of holistic design and ease for deconstruction and future reuse of the components.
Table 1 presents the thermal conductivities of the materials used in the LSF experimental module.
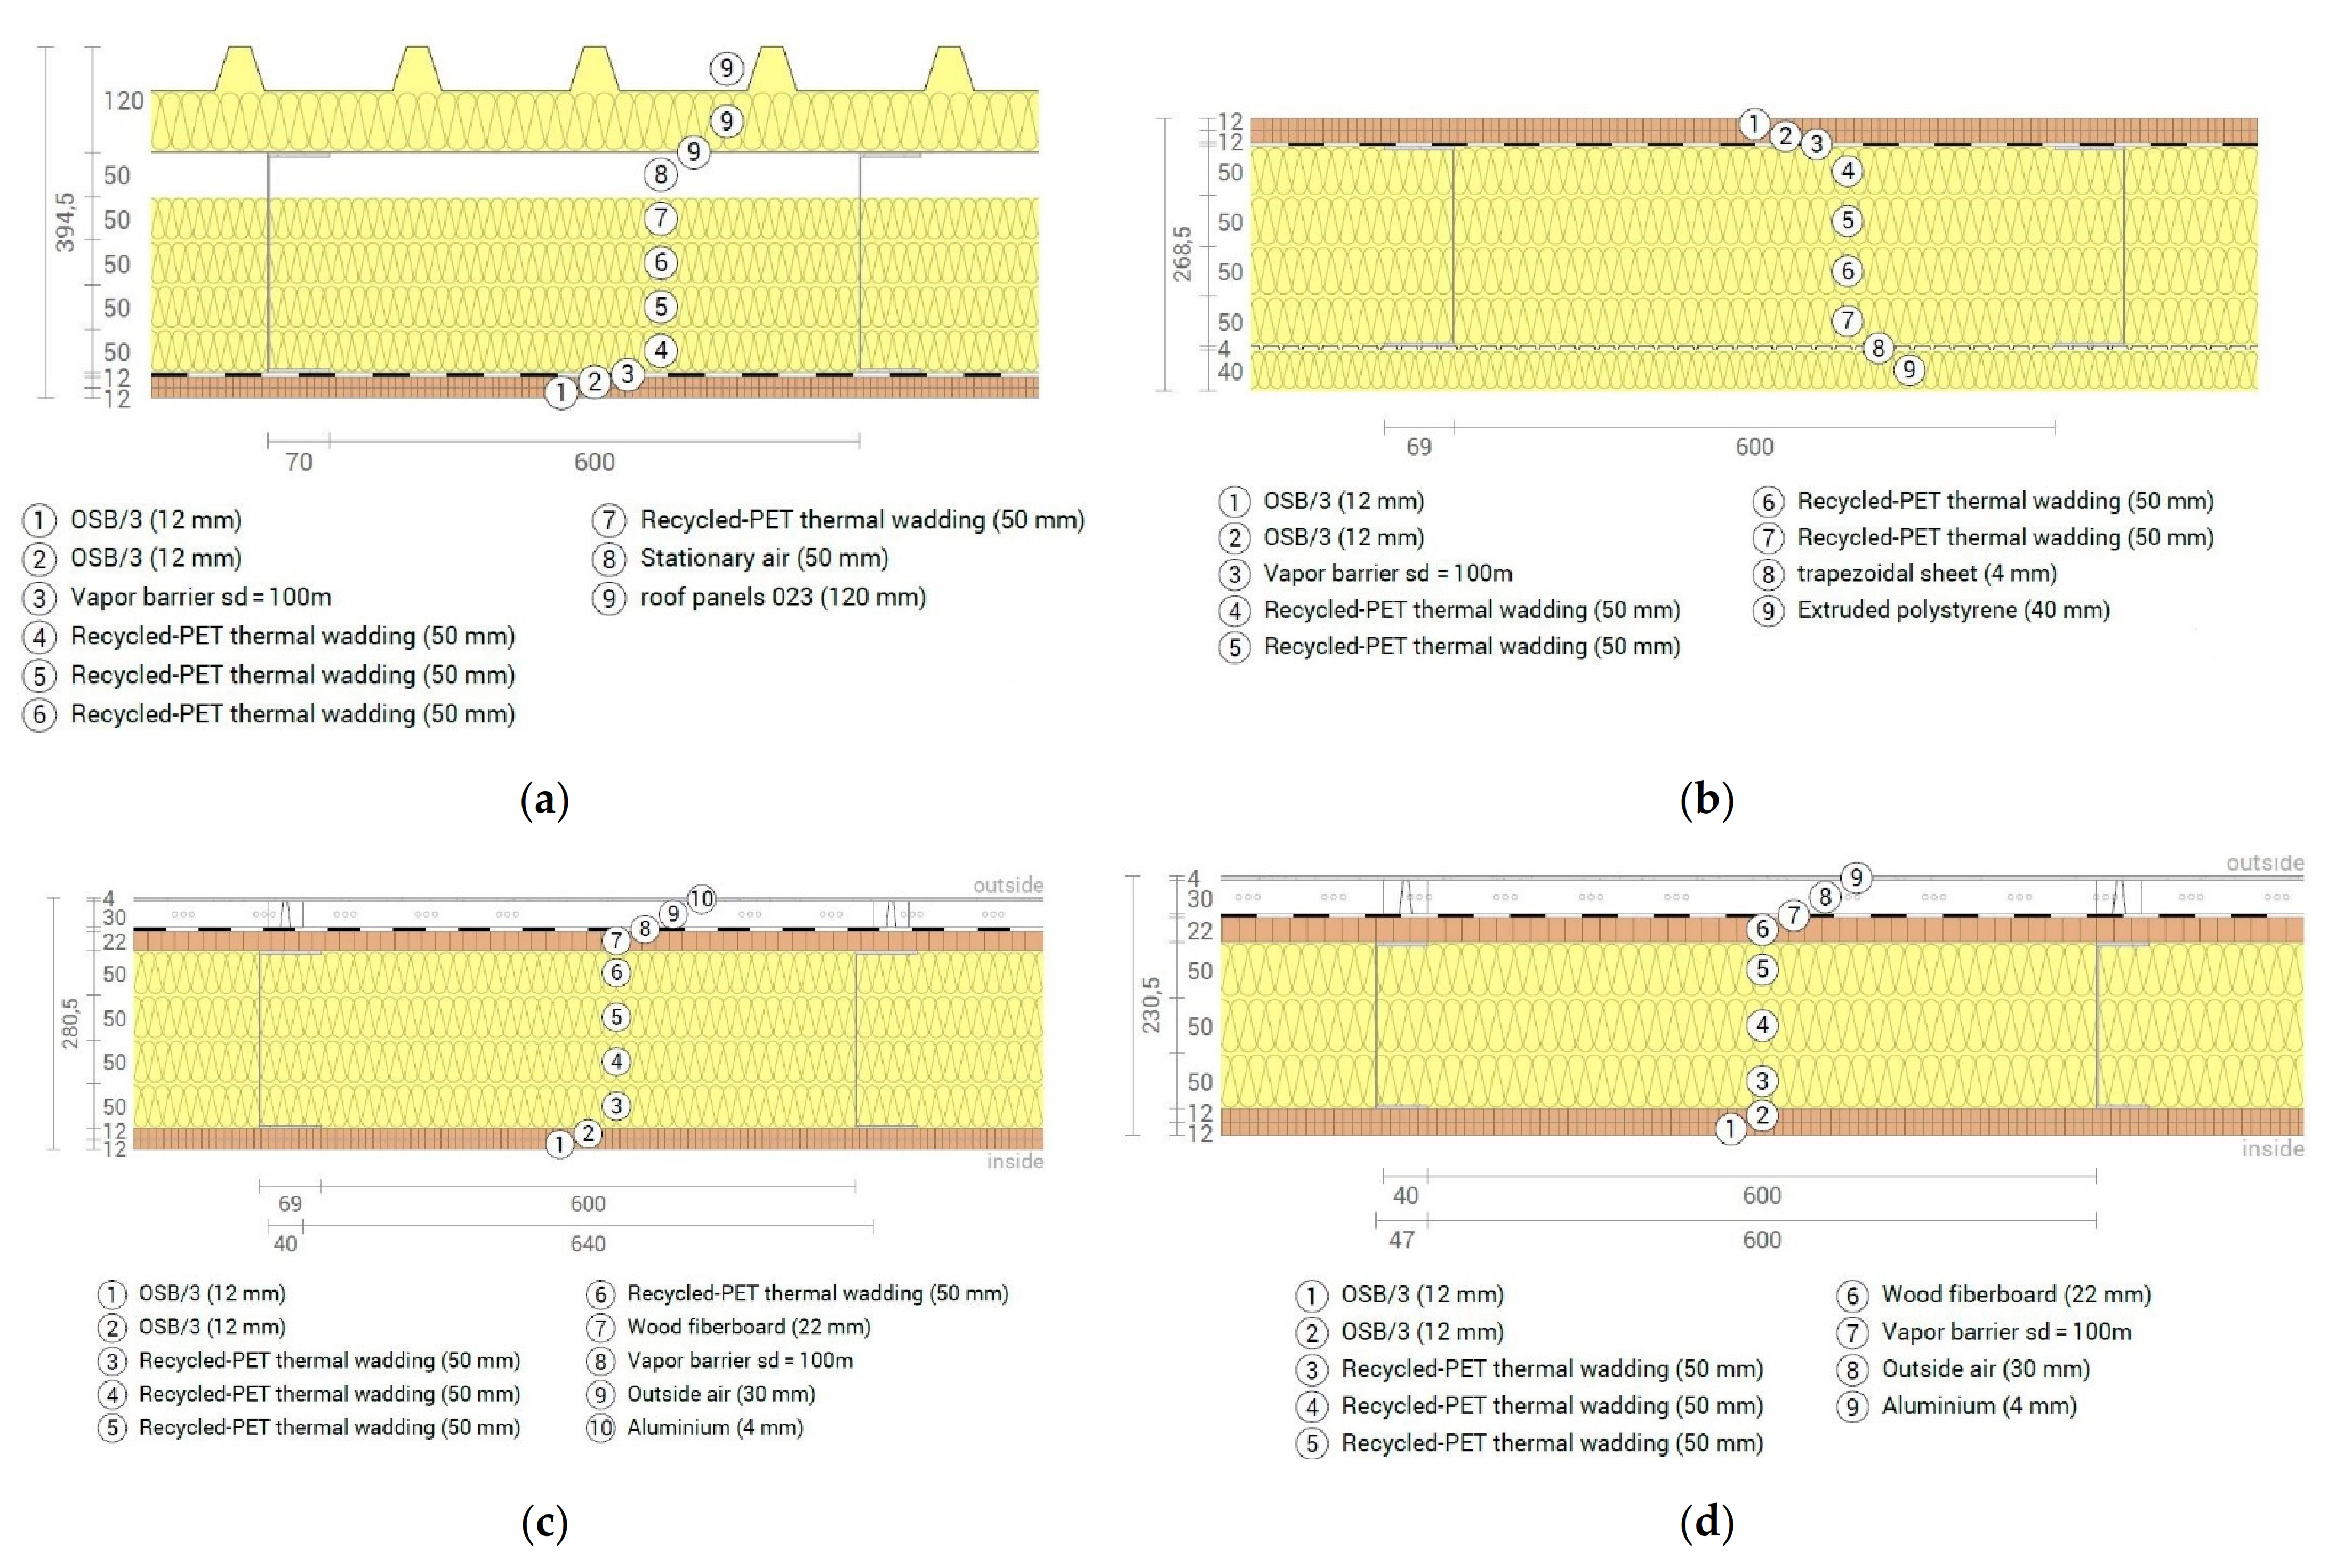
The structure is proper for various envelope configurations. The current envelope configuration (
Figure 8) was carefully selected with consideration for the local sourcing of building materials to keep transport emissions and associated costs to a minimum.
As an inner sheathing layer of walls, ceiling, and floor, the LSF experimental module was designed to have oriented strand board (OSB) panels (24 mm thick). In between the steel frame, recycled-PET thermal wadding (150 mm or 200 mm thick, by the case) was used as batt insulation. For walls, the thermal insulation system was completed in the exterior with an overlaid layer of wood fibreboards (22 mm thick) and finished by a layer of rectangular aluminium panels (4 mm thick). In order to avoid moisture from the ground, the floor was 400 mm elevated. In between the steel frame of the floor, recycled PET thermal wadding was used (200 mm thick) as batt insulation. Below the thermal insulation wadding, was installed a layer consisting of trapezoidal steel sheets (4 mm thick), and beneath, an exterior continuous layer (40 mm) of extruded polystyrene (XPS). Both the floor and roof were waterproofed by poly-vinyl chloride (PVC) membranes. On the roof, the thermal insulation system was completed in the exterior with PIR sandwich panels (120 mm thick).
The LSF envelope elements (materials, thicknesses, number of layers) are displayed in
Table 2.
Thermal Insulation Fabricated from Recycled Post-Consumer PET Bottles
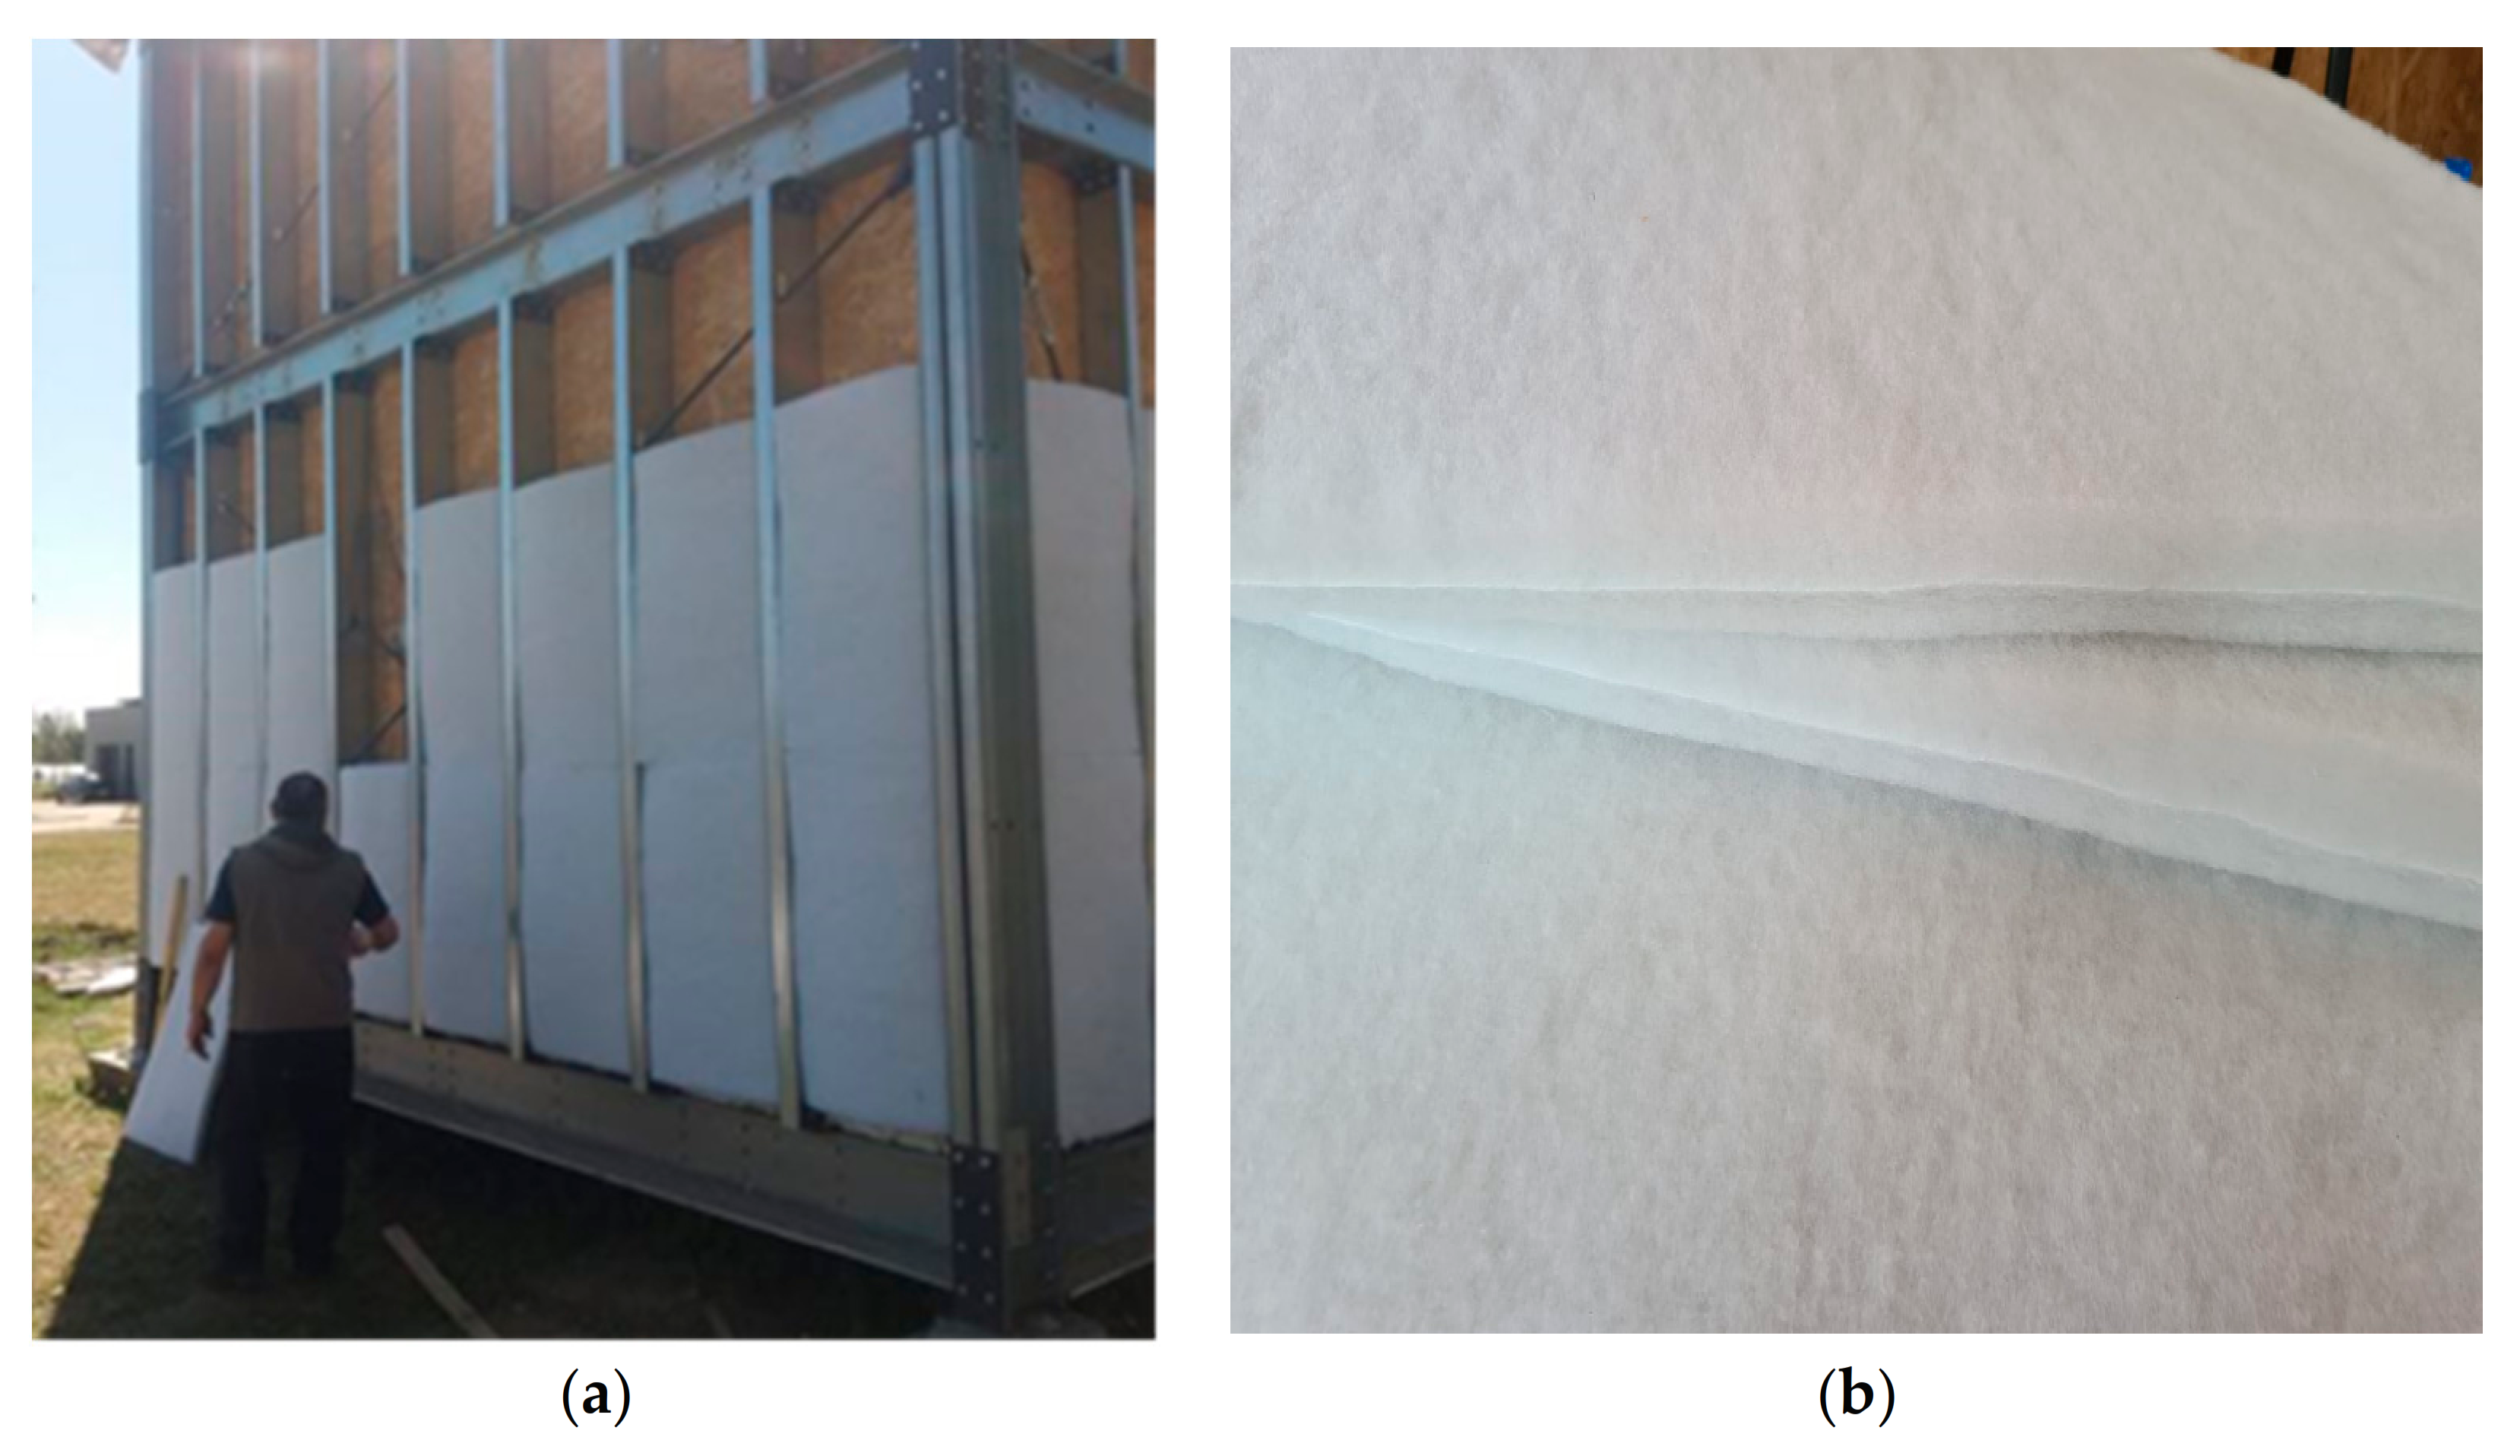
The thermal insulation layers of the envelope elements (
Figure 9), consisting of a thermal insulation wadding, are fabricated of polyester fibre, recycled from post-consumer polyethylene terephthalate (PET) bottles. The insulation material is produced entirely from recycled PET bottles, which withholds CO
2 emissions and ensures environmental benefits. Besides the significantly low environmental impacts shown by the product [
32], the recycled-PET thermal wadding provides high mechanical and physical properties [
33], which remain unaffected by time passing and ensures acoustic insulation properties as well.
Since there are no chemical or textile agents used in the production process, the product contains no harmful substances for human health [
34]. Another property of the recycled-PET thermal wadding is the material circularity: at the end-of-life of the building where it was installed, the product can be recycled in a proportion of 100% and used as a raw material for new thermal insulation wadding. The eco-efficiency of this specific thermal insulation is also from the proximity of the production place to the construction site of the laboratory: a transportation distance of only 15 km contributed to the created value of the product system, along with other factors, such as reusing post-consumer PET bottles as a raw material in the production stage, the absence of chemicals in the production process, the lack of wastes resulted from production or installation of the product.
2.3. Experimental Installation and Data Acquisition
The primary function of a building is to provide a suitable, comfortable, inner environment, according to the building’s functions. A holistic design of an energy-efficient building regards the installation of renewable energy sources and energy conservation and an integrated design with regard towards technology, operation, and maintenance. In a building’s lifetime, the greatest amount of energy is required during the operational phase, therefore the building’s envelope has a pivotal impact on the building’s behaviour.
2.3.1. Passive Design Strategies
The holistic design of the building regarded a series of passive strategies for the design of the LSF experimental module. Natural illumination is granted by a 3.56 m × 2.73 m glass curtain, installed on the south façade of the building, which also provides passive solar heating during daylight. When additional artificial light is necessary, LED light sources are available. The sun shading of the glass curtain, provided by external photo-voltaic shading lamellae, ensures passive cooling of the first floor (not yet installed during the six months of monitoring).
The renewable sources of energy are based on harvesting solar and wind energy: twelve 250 W polycrystalline cell panels intake solar energy, with an estimated amount of solar energy produced on-site of 1269 kWh/year (the potential production of the installed polycrystalline cell panels under ideal conditions is 3427.29 kWh/year [
32]), and a 1 kW vertical wind turbine.
2.3.2. Monitored Energy Management System
The design of the LSF experimental module, in pursuance of having an authentic, factual overview of the building’s performance during the operational phase, included a monitored energy management system. The LSF experimental module is a non-grid connected building, matching its own energy needs by on-site generation, fully based on renewables. The monitored energy management system consists of an electric power distribution representing a direct current (DC) grid, similar to a smart nano-grid (SN). The electric power distribution integrates wind and solar sources of energy, elements for conversion and storage of the electrical energy, and a distributed control and energy management system through a SCADA system. Common electrical appliances (fridge, TV, PC) are used and adapted for DC supply, in order to reproduce residential application.
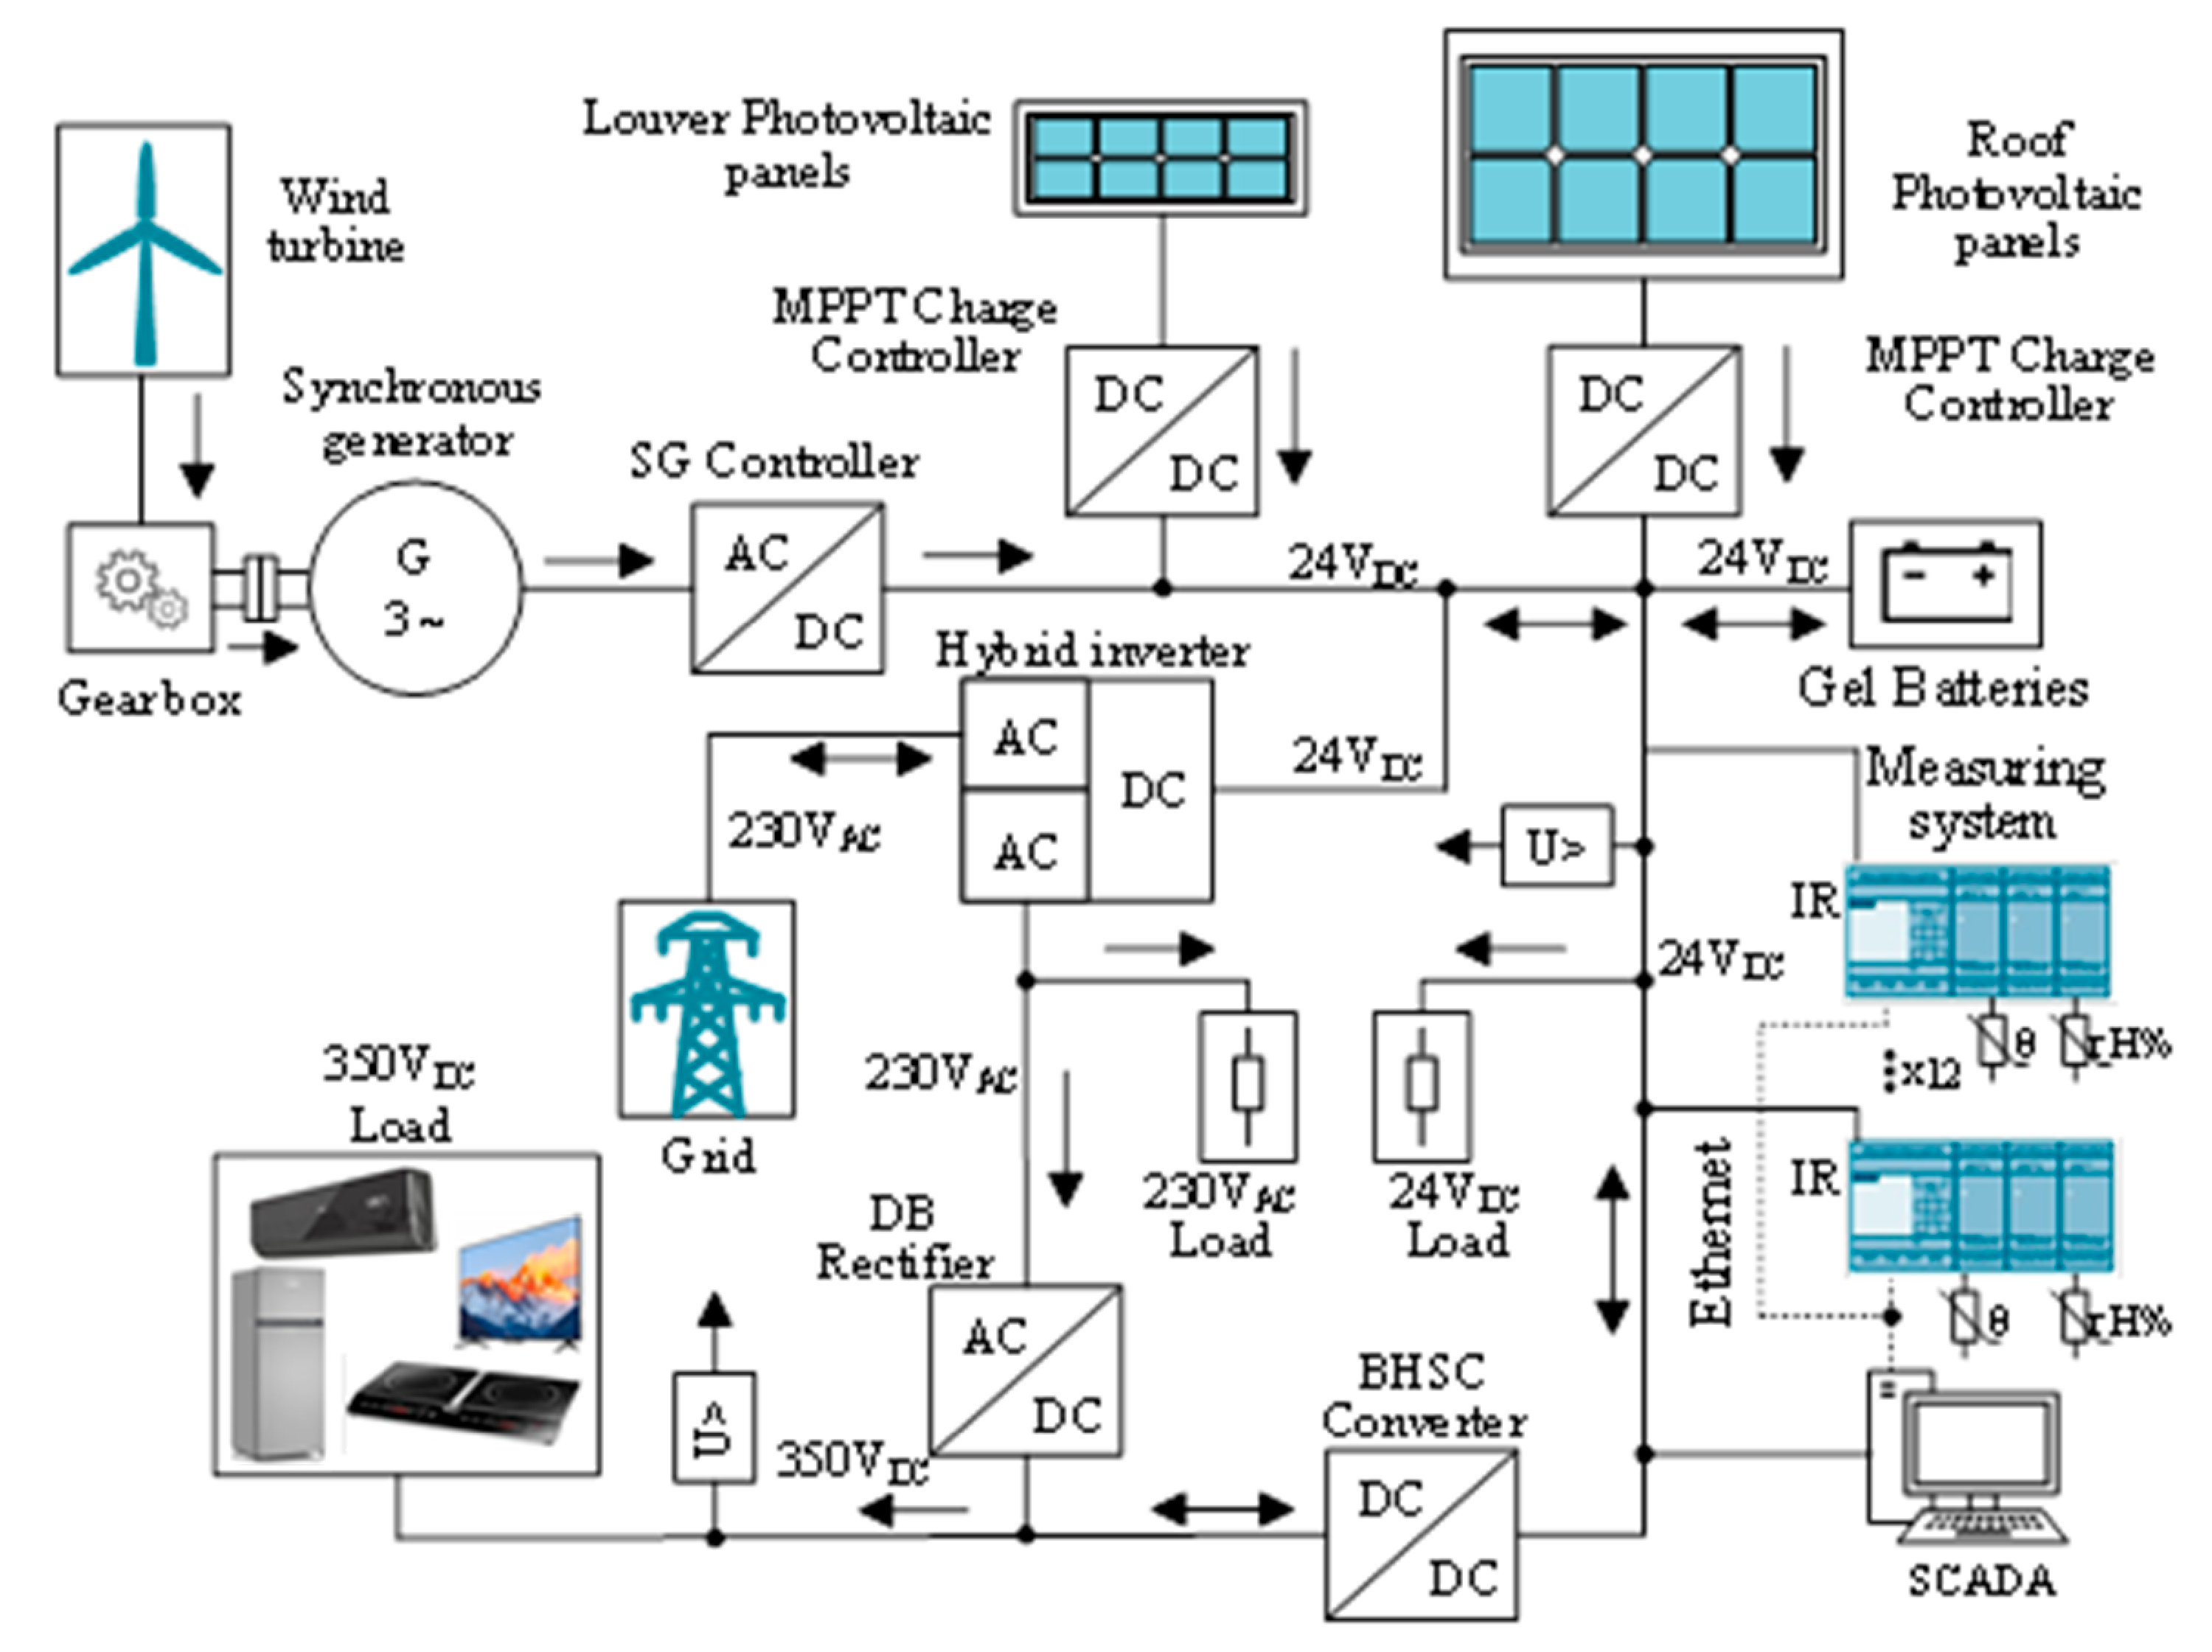
The architecture of the SN, presented in
Figure 10, consists of a high voltage DC bus (HVDC), with a value of 350 V, and a low voltage DC bus (LVDC), with a level of 24 V. For alternating current (AC) loads and as a backup solution, the SN owns an AC bus with a voltage of 230 VRMS.
A synchronous generator (SG) coupled through a gearbox ensures the harvest of the wind energy from the vertical wind turbine. The electrical power provided by the SG is injected into the LVDC bus using the SG controller. A maximum power point tracking (MPPT) charge controller through which the LVDC is connected to the photovoltaic panels, helps to convert solar energy into electrical energy. A smaller MPPT charge controller is used for the louver photovoltaic panels. The energy is stored in four 12 V/220 Ah valve regulated lead-acid gel batteries, which can store 10 kWh of electrical energy, enough for 2–3 days of usual household operation without recharging. The connection between the HVDC bus and LVDC bus is performed through a bidirectional hybrid switched capacitors converter (BHSC) [
35].
High efficiency and low cost of high ratio voltage conversion are viable due to the BHSC converter’s capabilities. The entire flow of electrical energy is controlled by a SCADA system which ensures the data acquisition of all parameters.
2.3.3. Data Acquisition Infrastructure
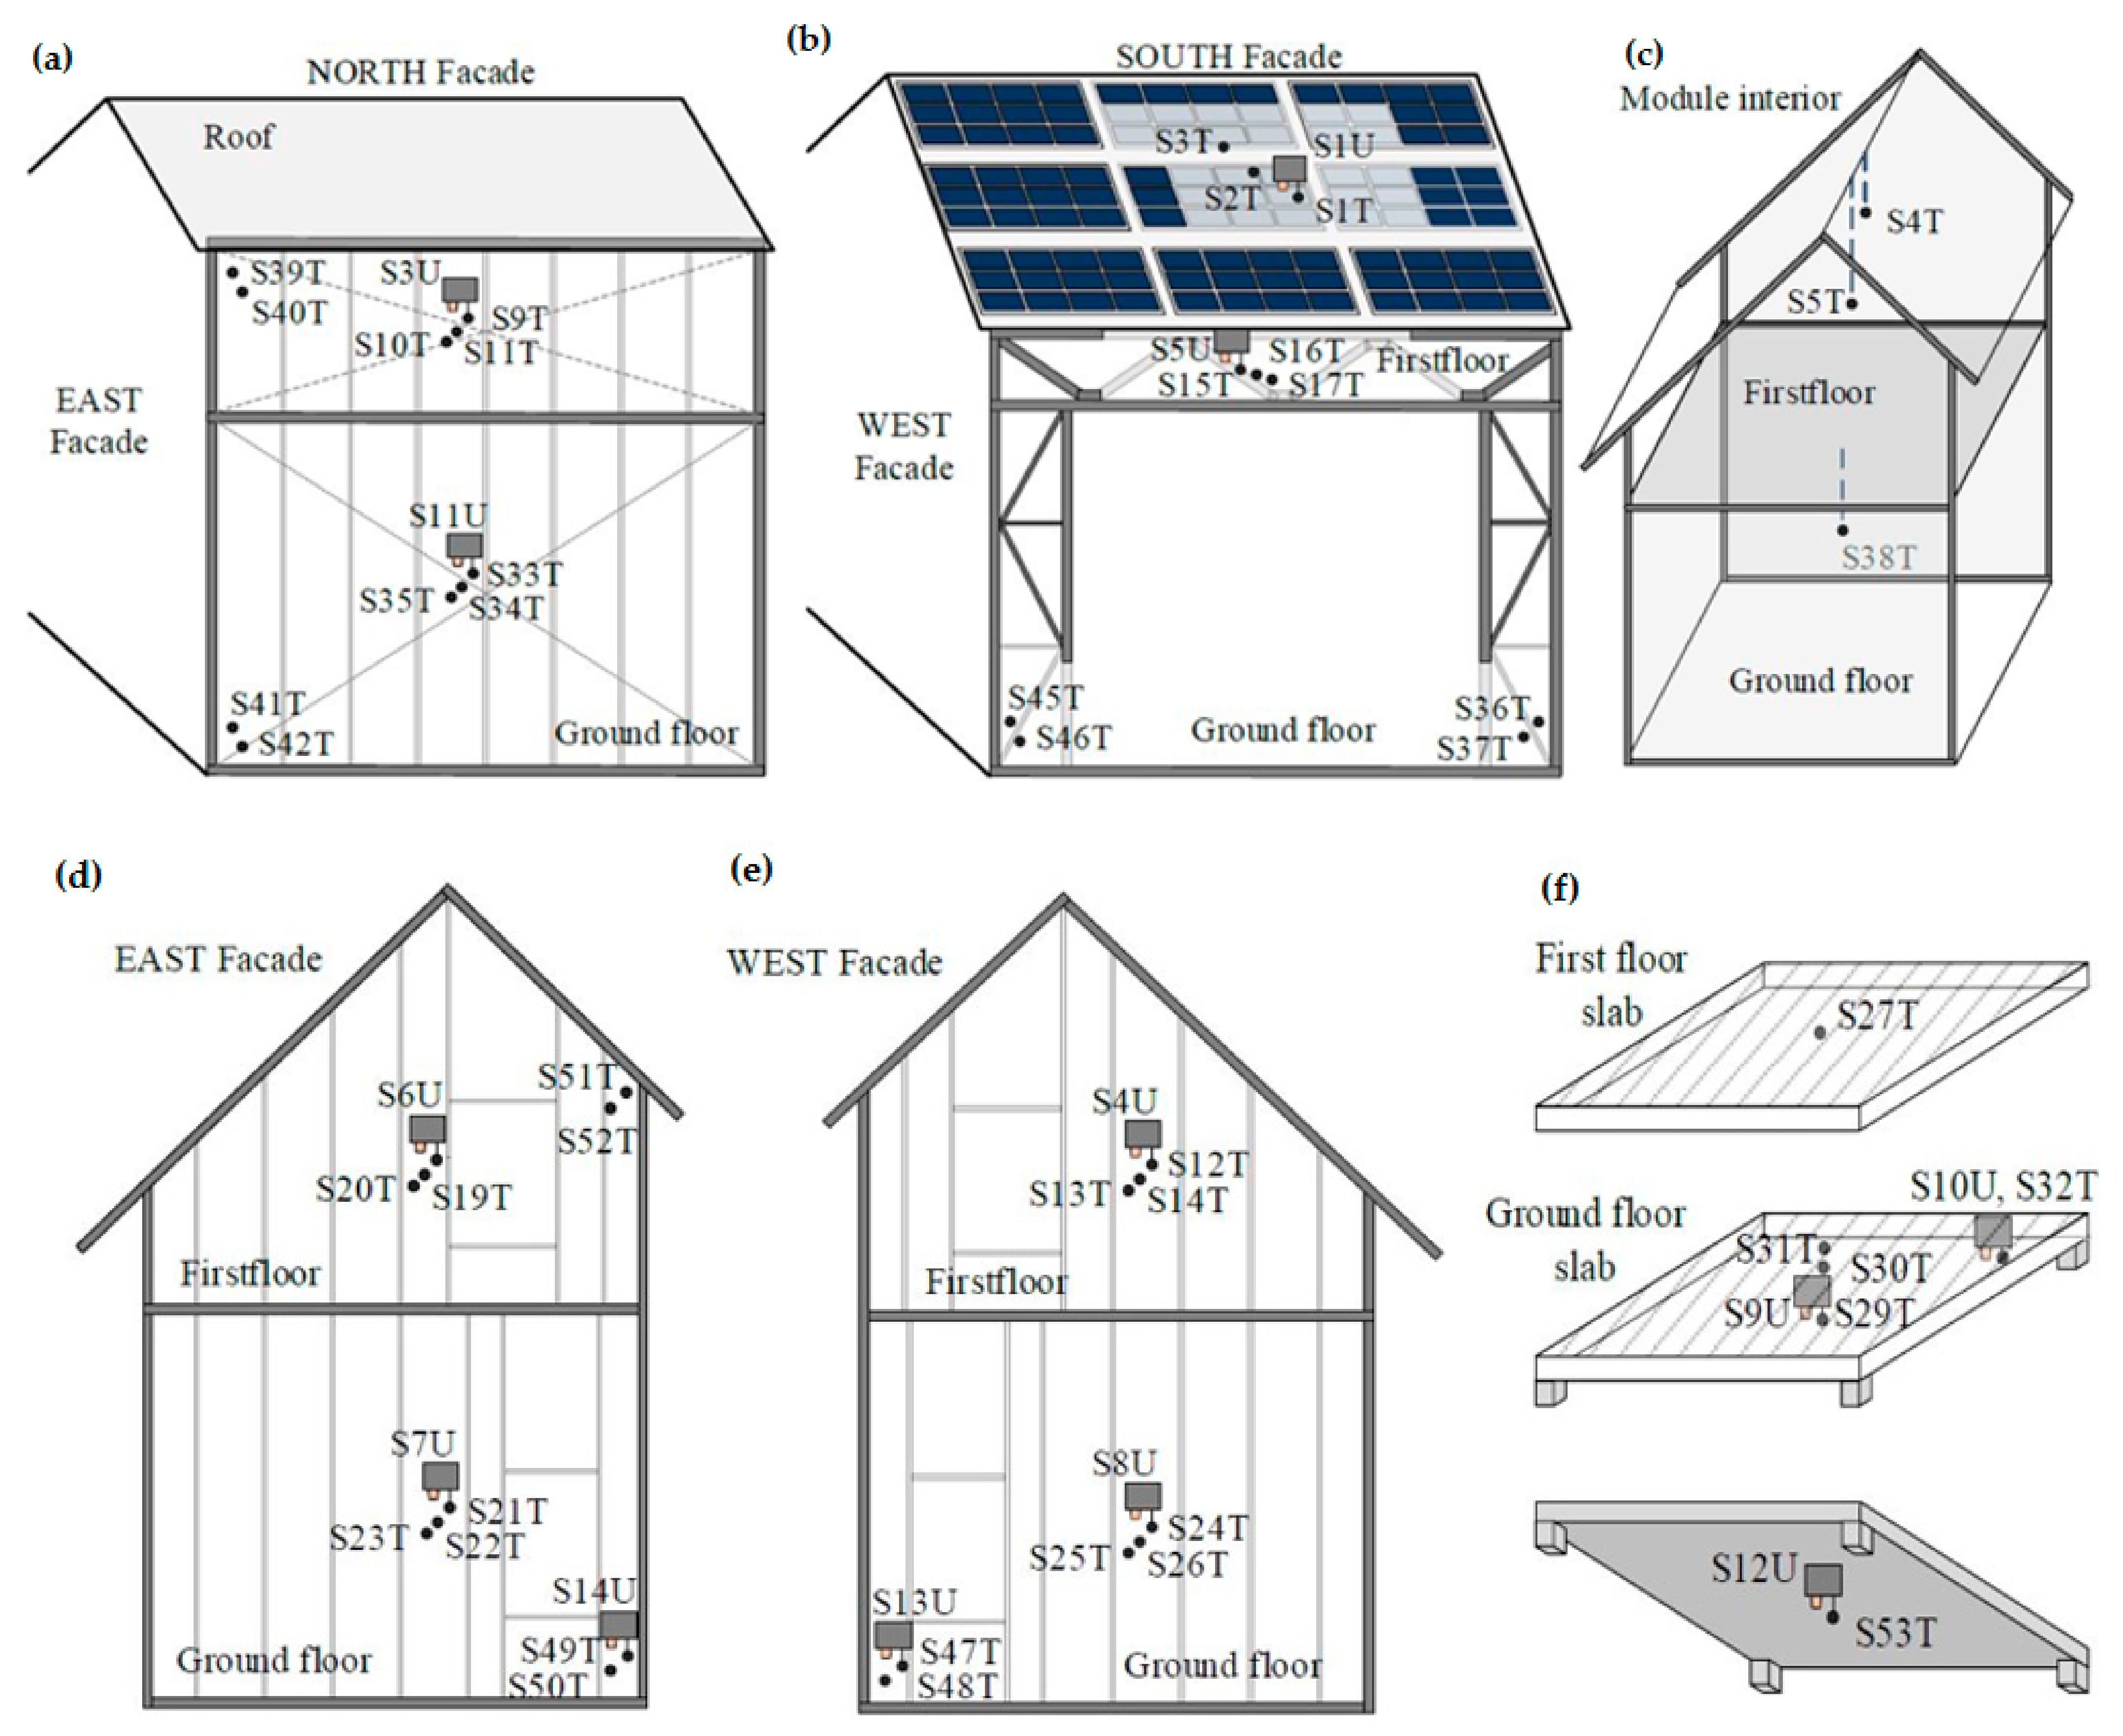
The LSF experimental module’s data acquisition infrastructure consists of 3 CO
2 sensors, 14 humidity sensors and 53 temperature sensors distributed as presented in
Figure 11. A measuring station, composed from 12 so-called intelligent relays (IR) is used for acquiring the data from the sensors [
36], providing digital inputs and outputs, which can be used in small automation such as residential automation [
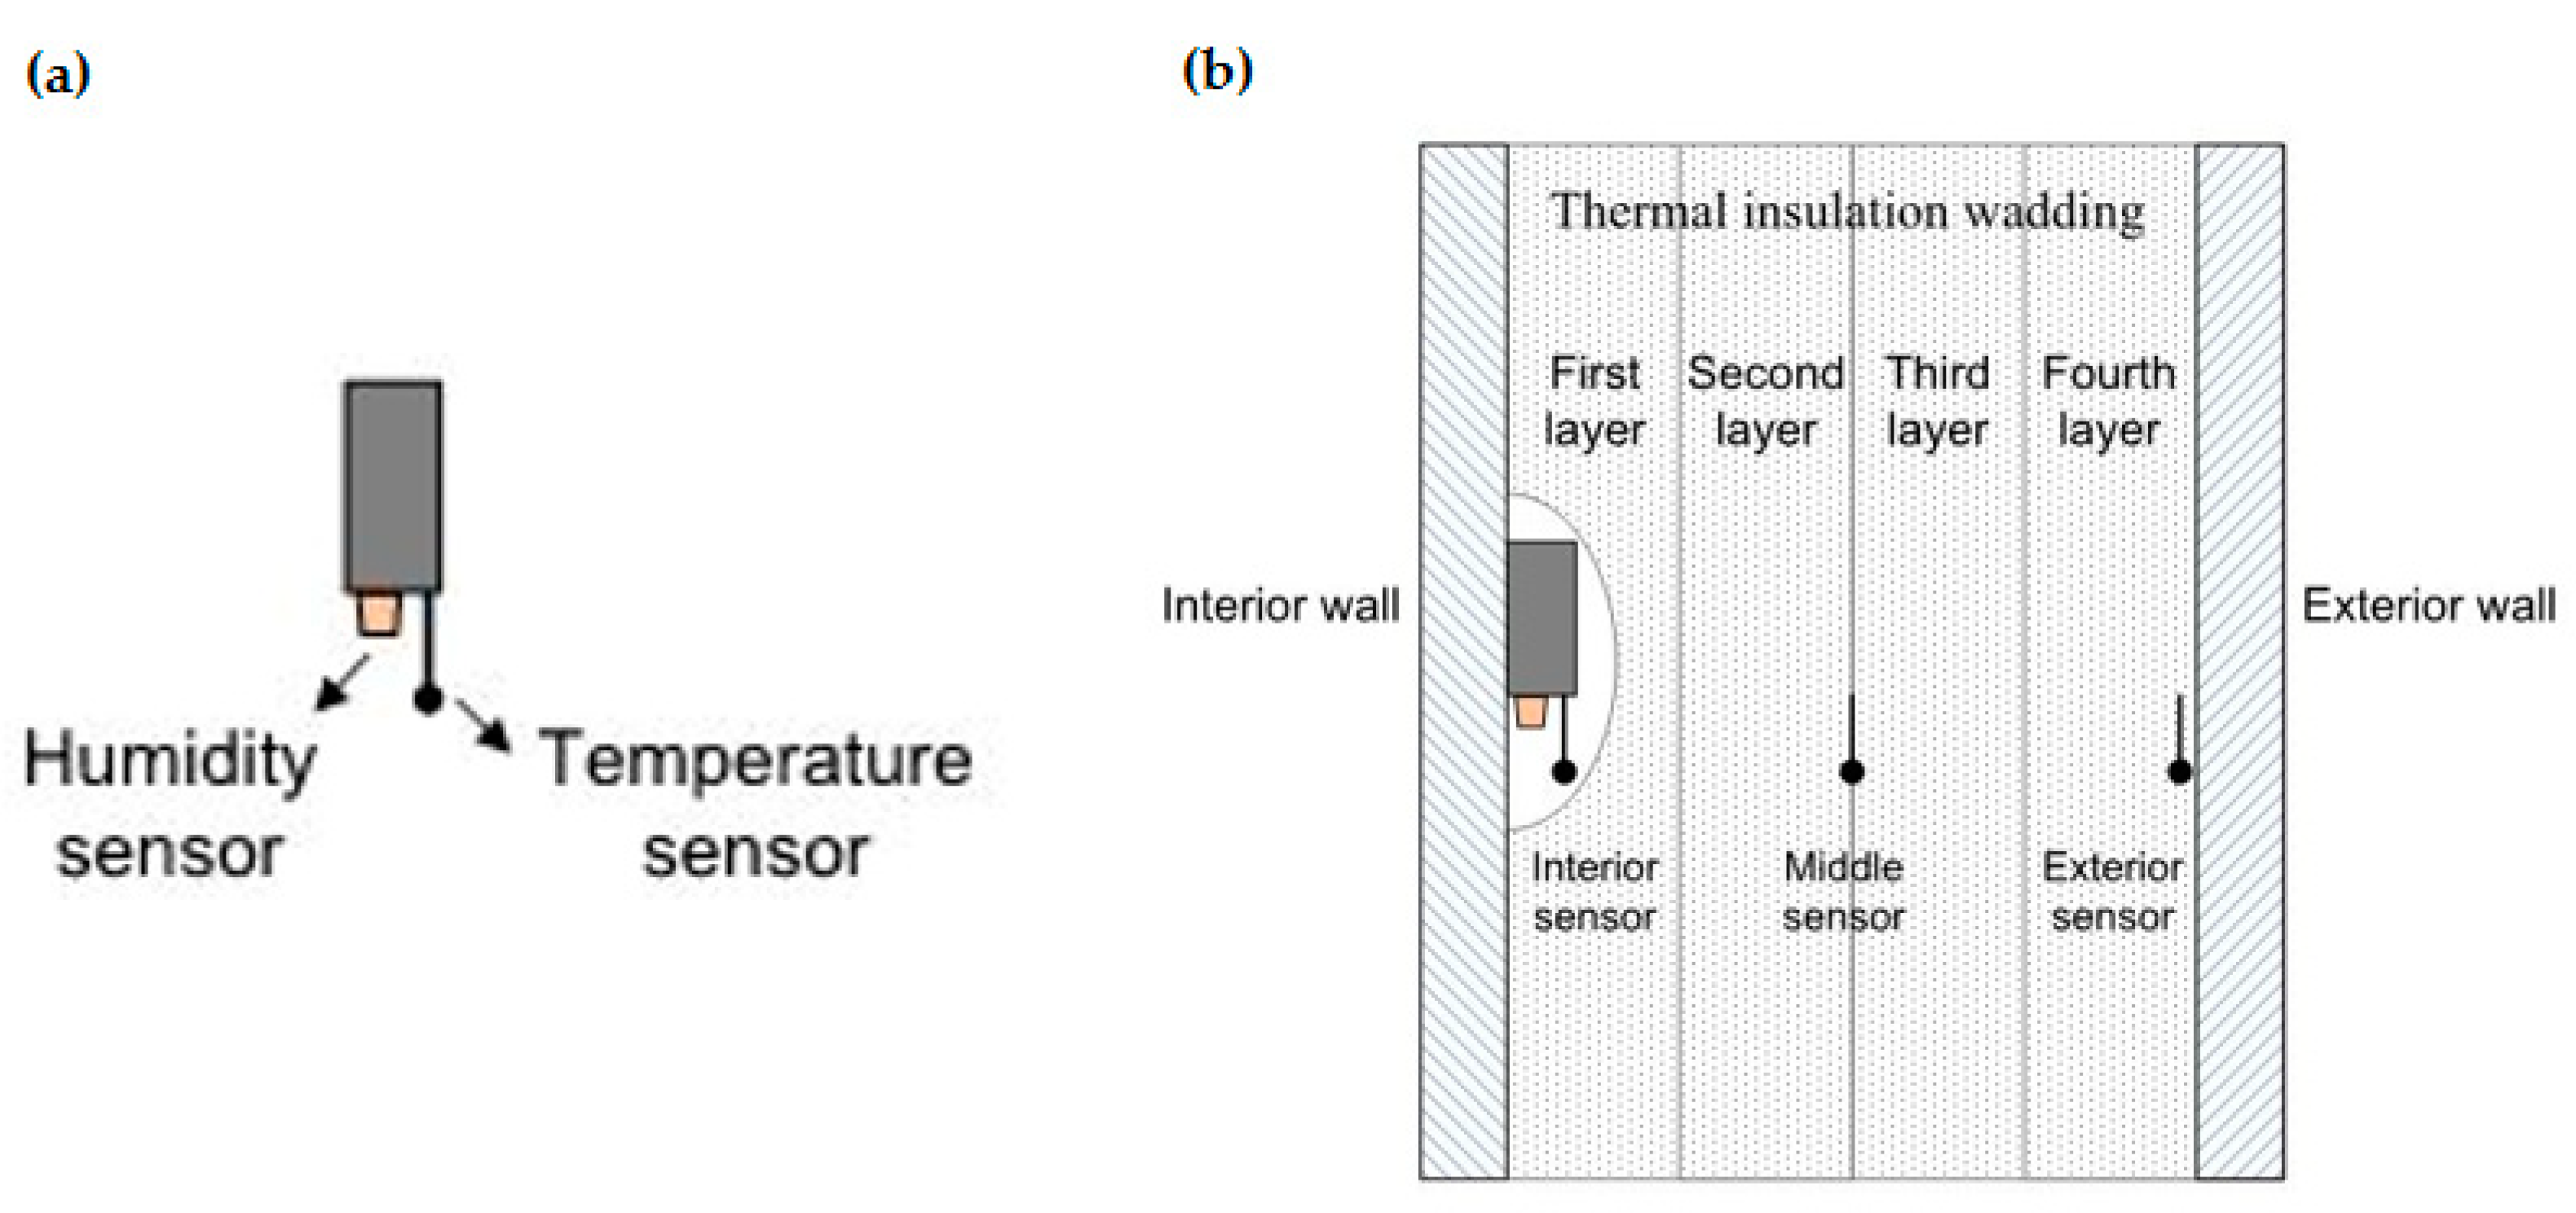
9]. The sensors (
Figure 12a) distributed on the walls are located on the outer face of the interior walls, between the insulation layers and on the inner face of the exterior walls, as illustrated in
Figure 12b.
The SCADA interface was designed with the LabView 2021 software development platform provided by National Instrument (11500 N Mopac Expwy Austin, TX 78759-3504, USA), and it is supported by a dedicated station server. For redundancy, a second SCADA system was designed with the Logo Web Editor V1.0 software (Siemens AG, P.O. Box 48 48 90026 Nuremberg, Germany) development platform [
36] which is supported by the IR. Unlike other SCADA systems which run over a dedicated station (server or desktop), this second SCADA system is accessible using a web page. The acquired data are stored on the server station and backup is also stored on the IR which is equipped with a micro-SD card.
3. Results and Discussion
3.1. Thermal Monitoring
Figure 13,
Figure 14,
Figure 15,
Figure 16,
Figure 17 and
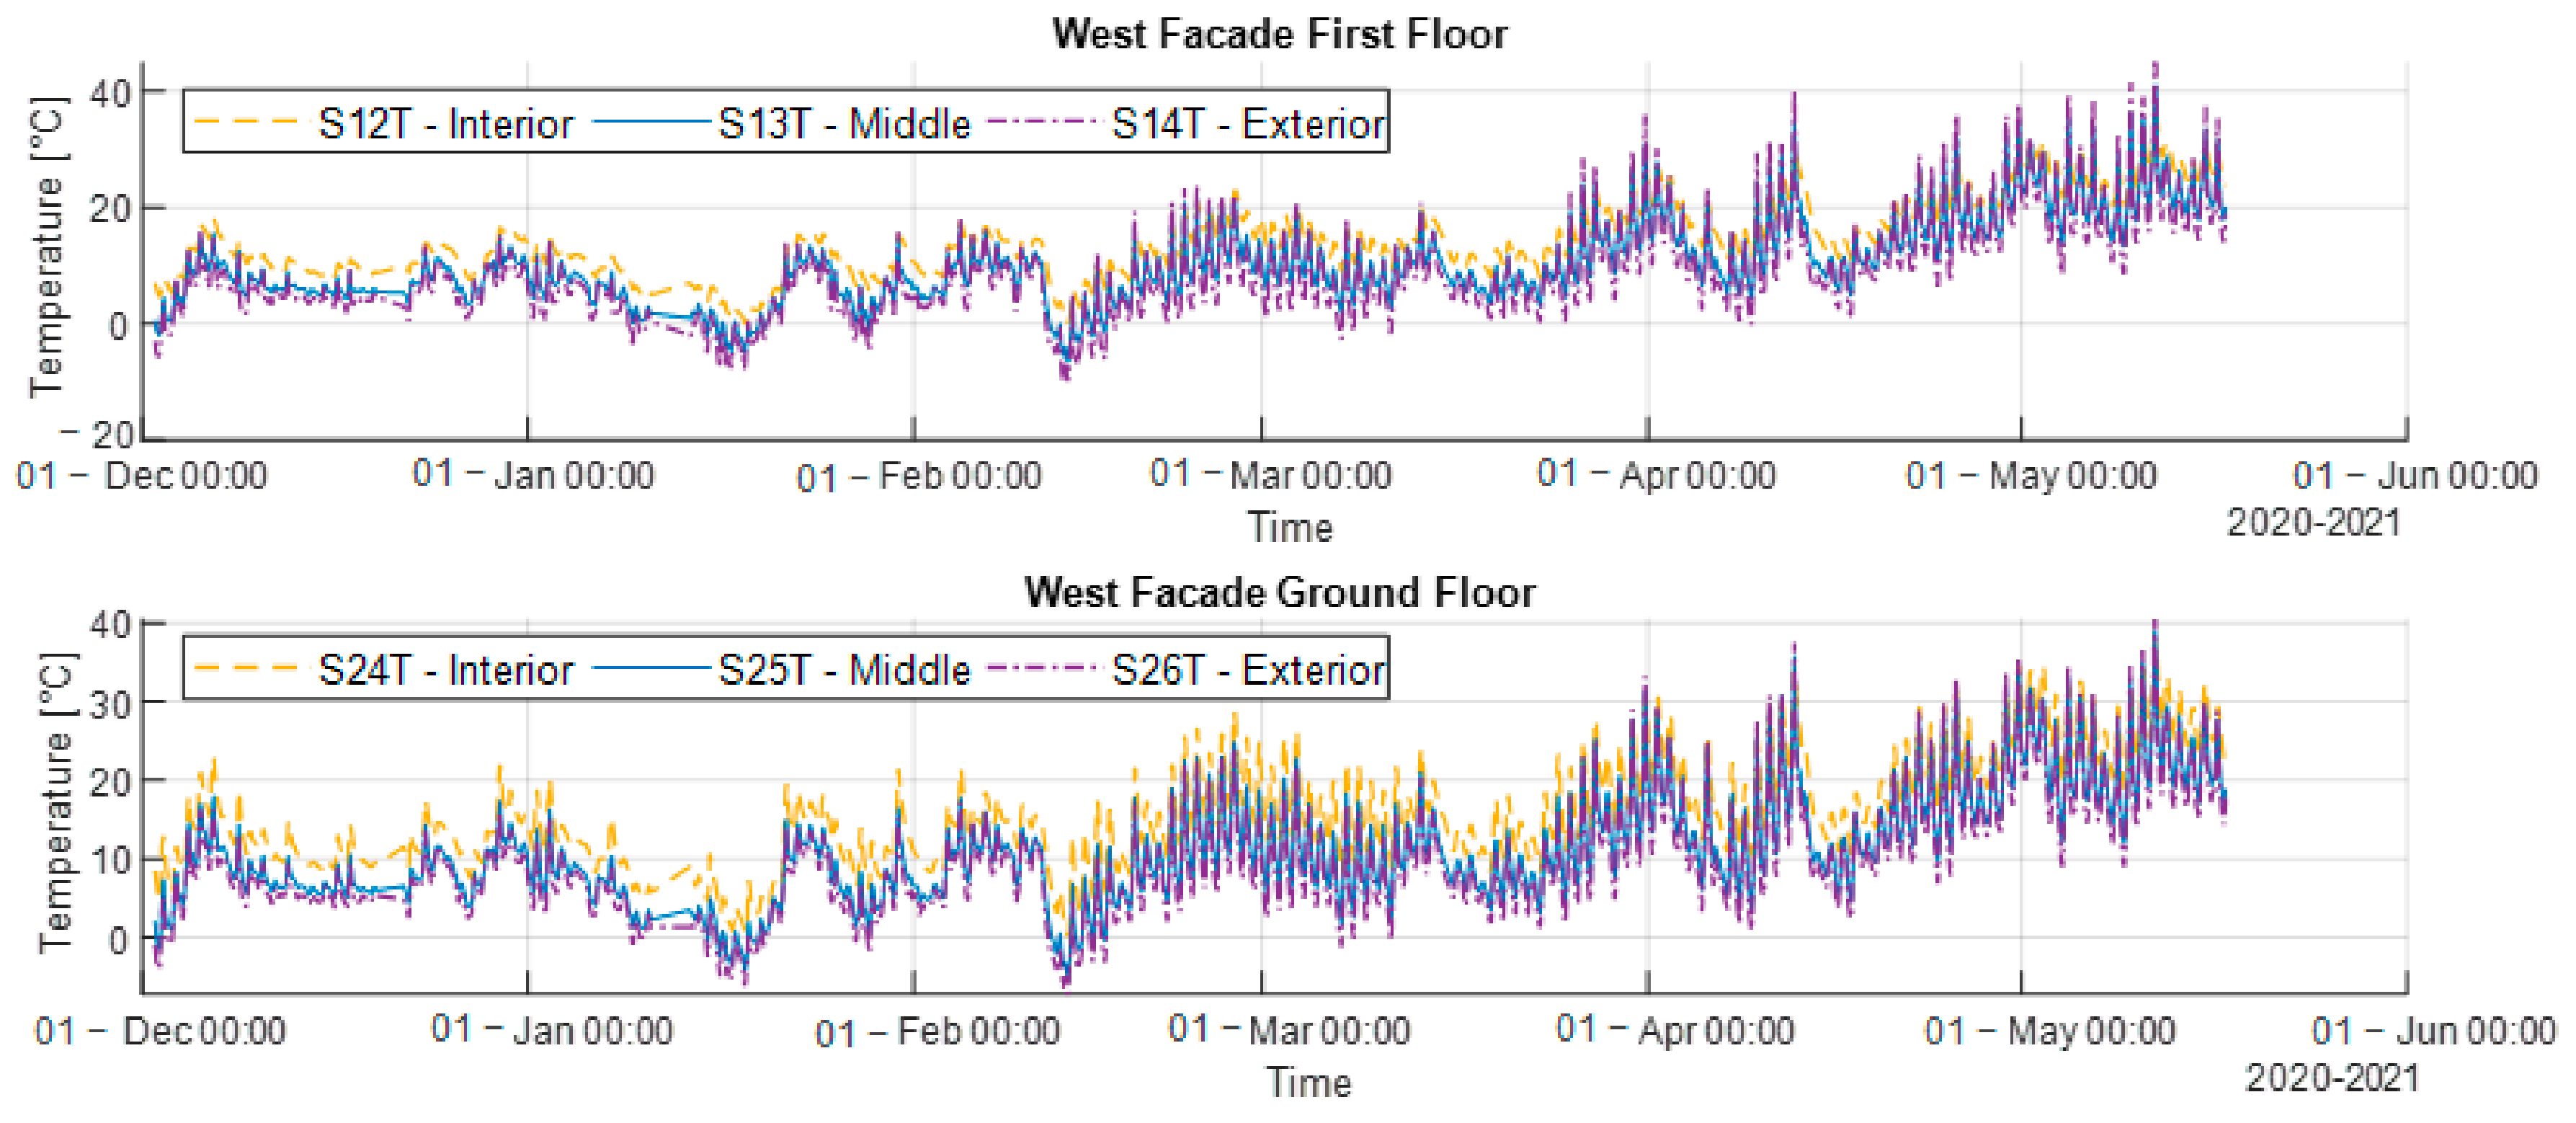
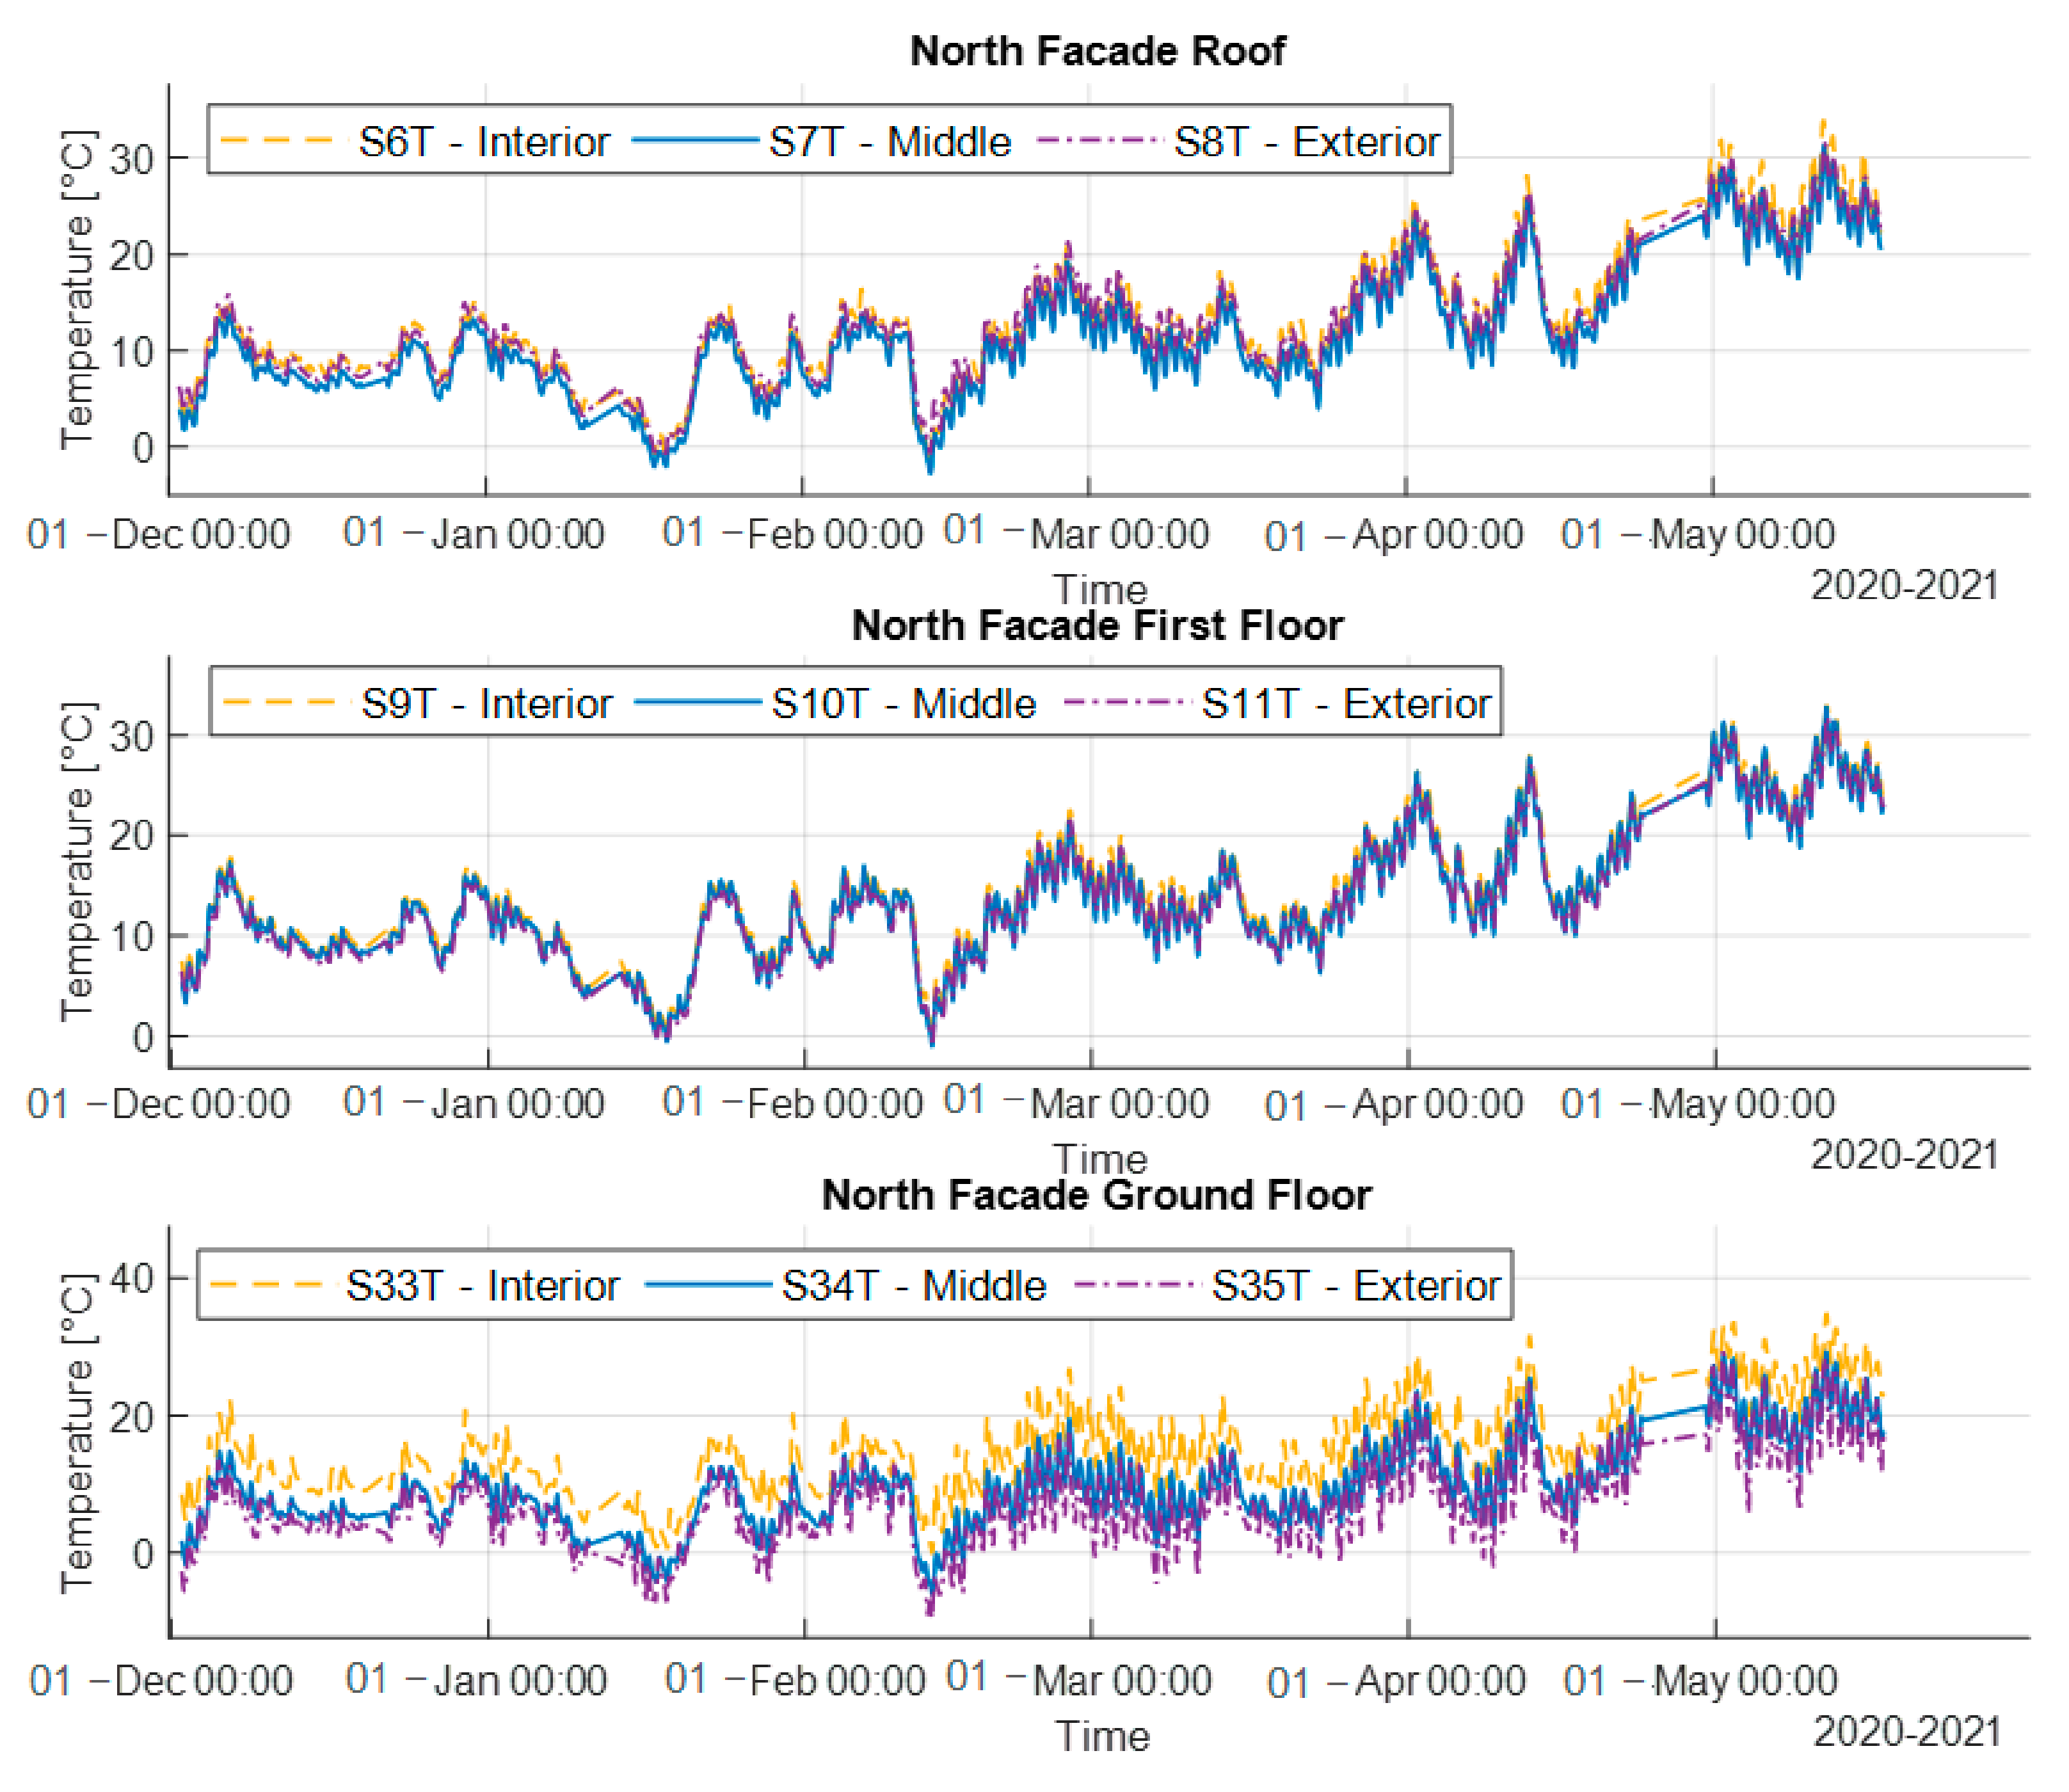
Figure 18, illustrated below, show the information provided by the monitoring management system registered during a supervision interval of six months (02 December 2020–17 May 2021). The recordings transferred from the sensors reveal the behaviour of the experimental module’s envelope and indoor comfort conditions. In the temperature graphics, data provided from the sensors located on the outer face of the interior walls are shown in yellow, data provided from the sensors located between the insulation layers are shown in blue while data provided from the sensors located on the inner face of the exterior walls are shown in purple (
Figure 12b). It should be noted that at the time of monitoring the external photo-voltaic shading lamellae were not installed yet, nor any other HVAC system; therefore, no mechanically cooling, heating or dehumidification system contributed to the indoor comfort. The interior temperature was influenced only by solar gain, electrical appliances, and human interaction during maintenance and observation interference.
No doubt, the building occupancy has a direct influence on the thermal performance of the building. The building was only used sporadically during the recording period, human interaction during maintenance and observation was the only interaction.
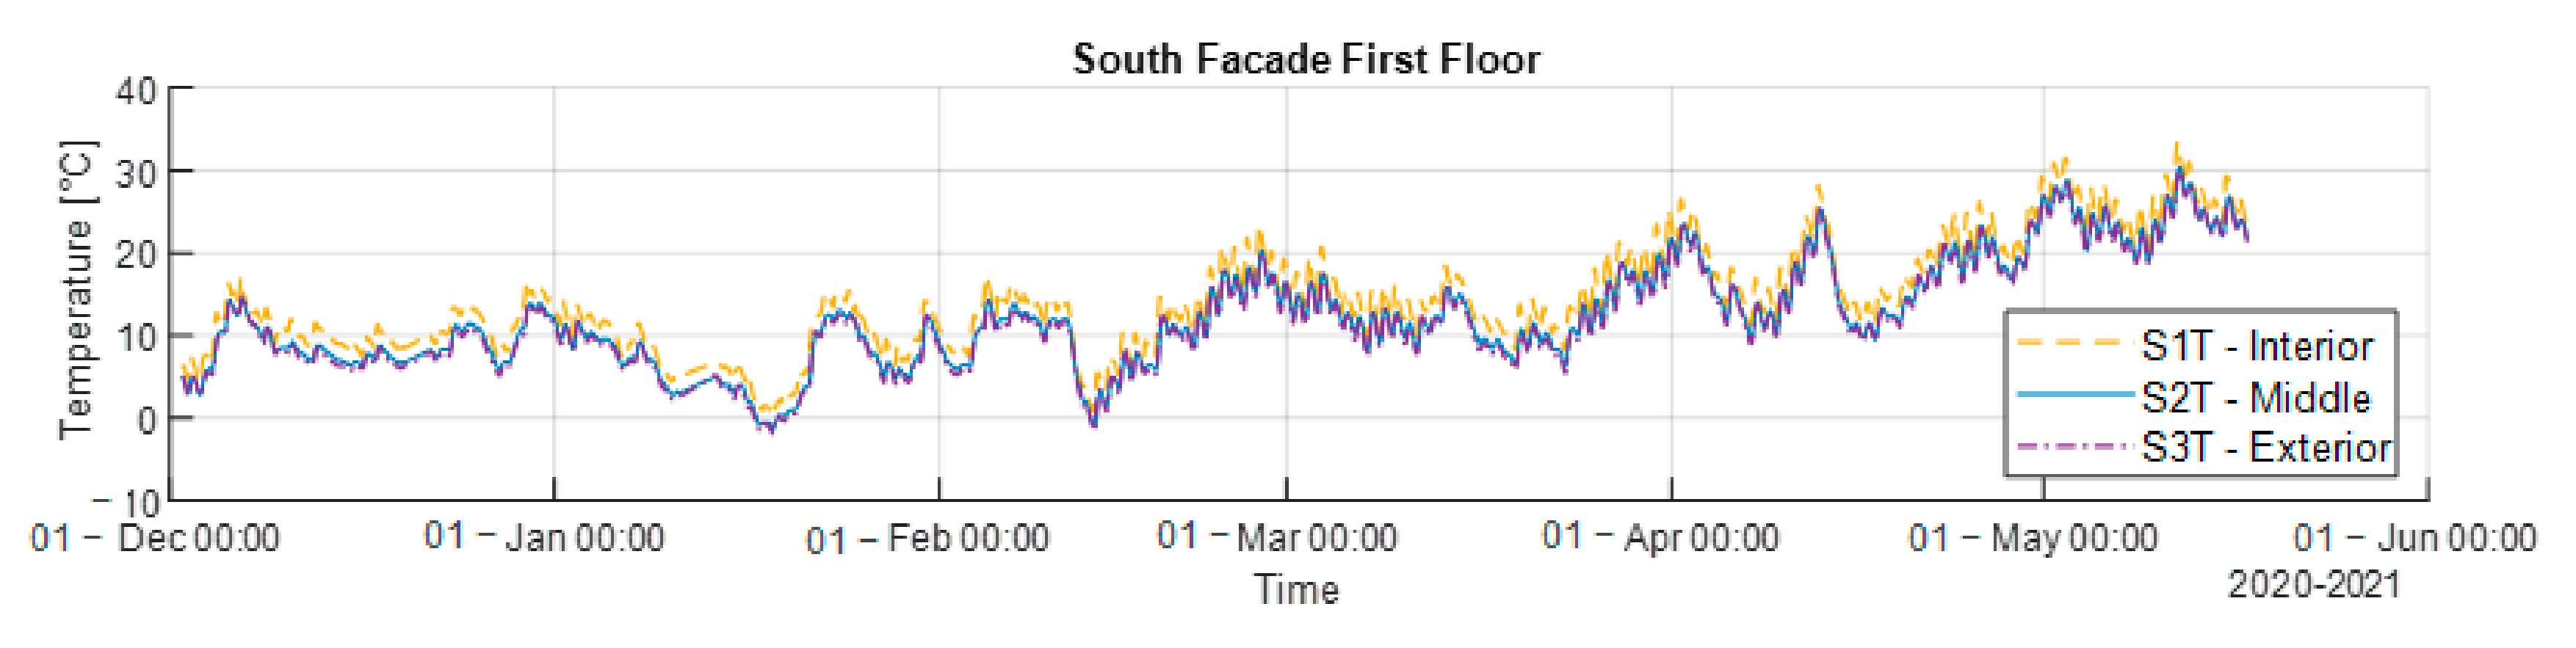
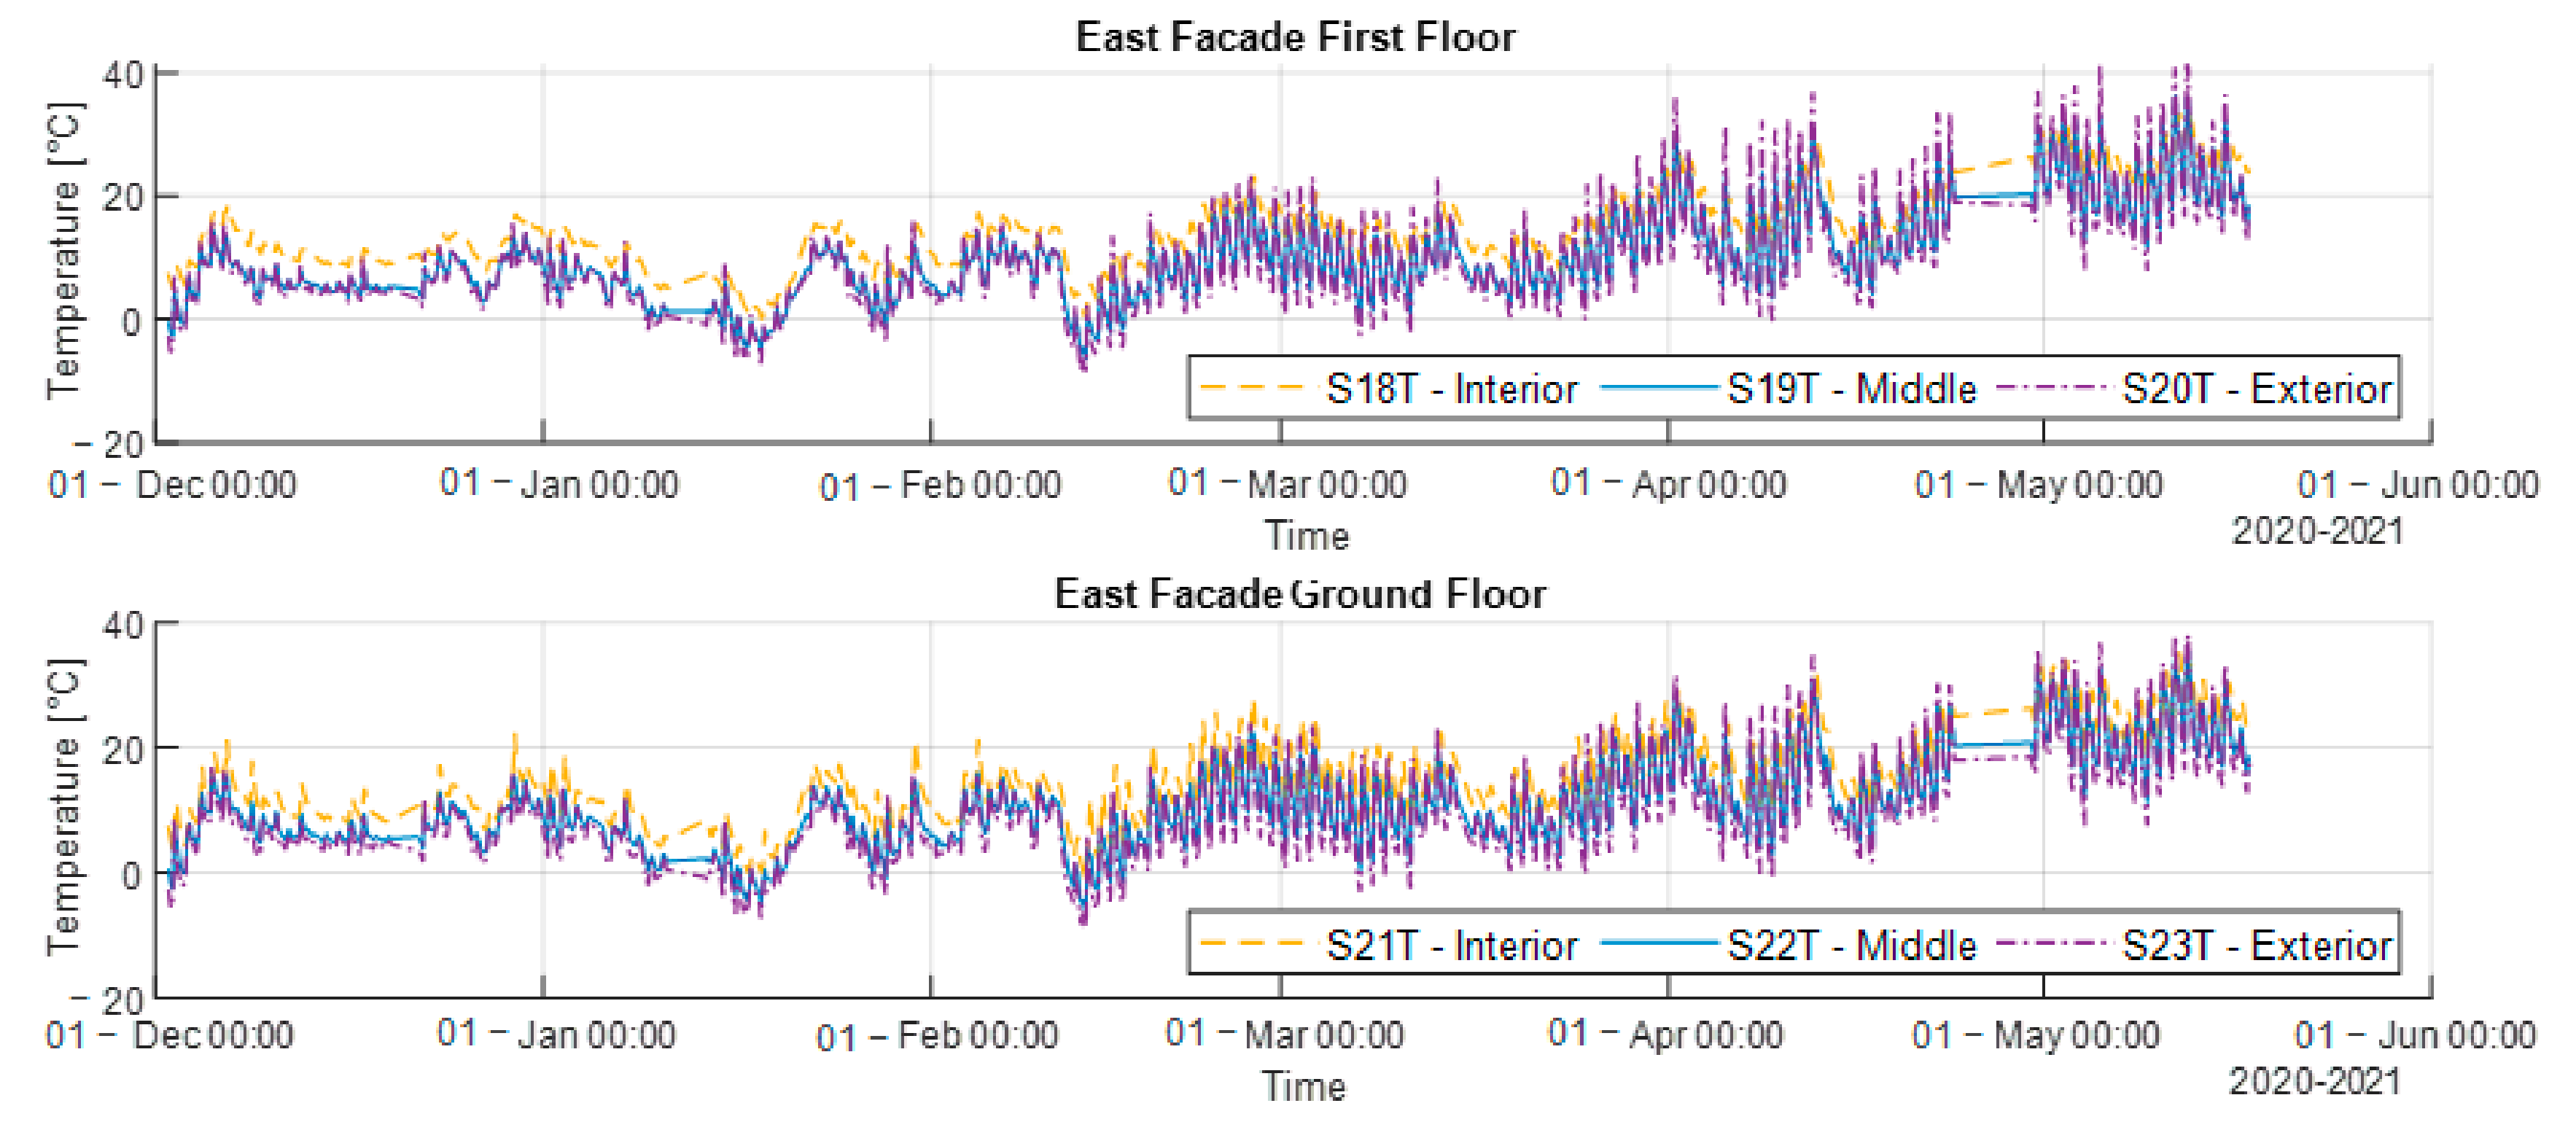
During the winter period (from 1 December 2020 to 21 March 2021), the outdoor minimum air temperature was ranging from −1 to 2 °C, while the maximum one from 5 to 9 °C. During the spring period (from 22 March 2021 to 15 May 2021), the outdoor minimum air temperature was ranging from 3 to 8 °C, while the maximum one from 11 to 21 °C. In both periods, the daily maximum and minimum outdoor air temperatures had significant variations during the monitoring period. Looking to the middle and interior sensors, it is very easy to see they are following those from the exterior with a difference of 2–3 °C (
Figure 13,
Figure 14,
Figure 15 and
Figure 16). The differences are a bit higher in the case of north and west facades, especially from the sensors located on the ground floor. The temperature profiles for both floors were quite similar, but due to the presence of the larger glazed area on the southern facade, higher temperatures were recorded for the interior sensor. These highlight the effect of the glazed area as a strategy to capture solar gains. In the spring, a difference of 2–3 °C was observed between the indoor air temperatures of the space located on the ground floor and the one the upper floor.
Figure 13,
Figure 14,
Figure 15 and
Figure 16 show thew indoor temperature does not remain stable in the rooms. The situation was expected to be like this due to the missing systems for indoor comfort and human interaction.
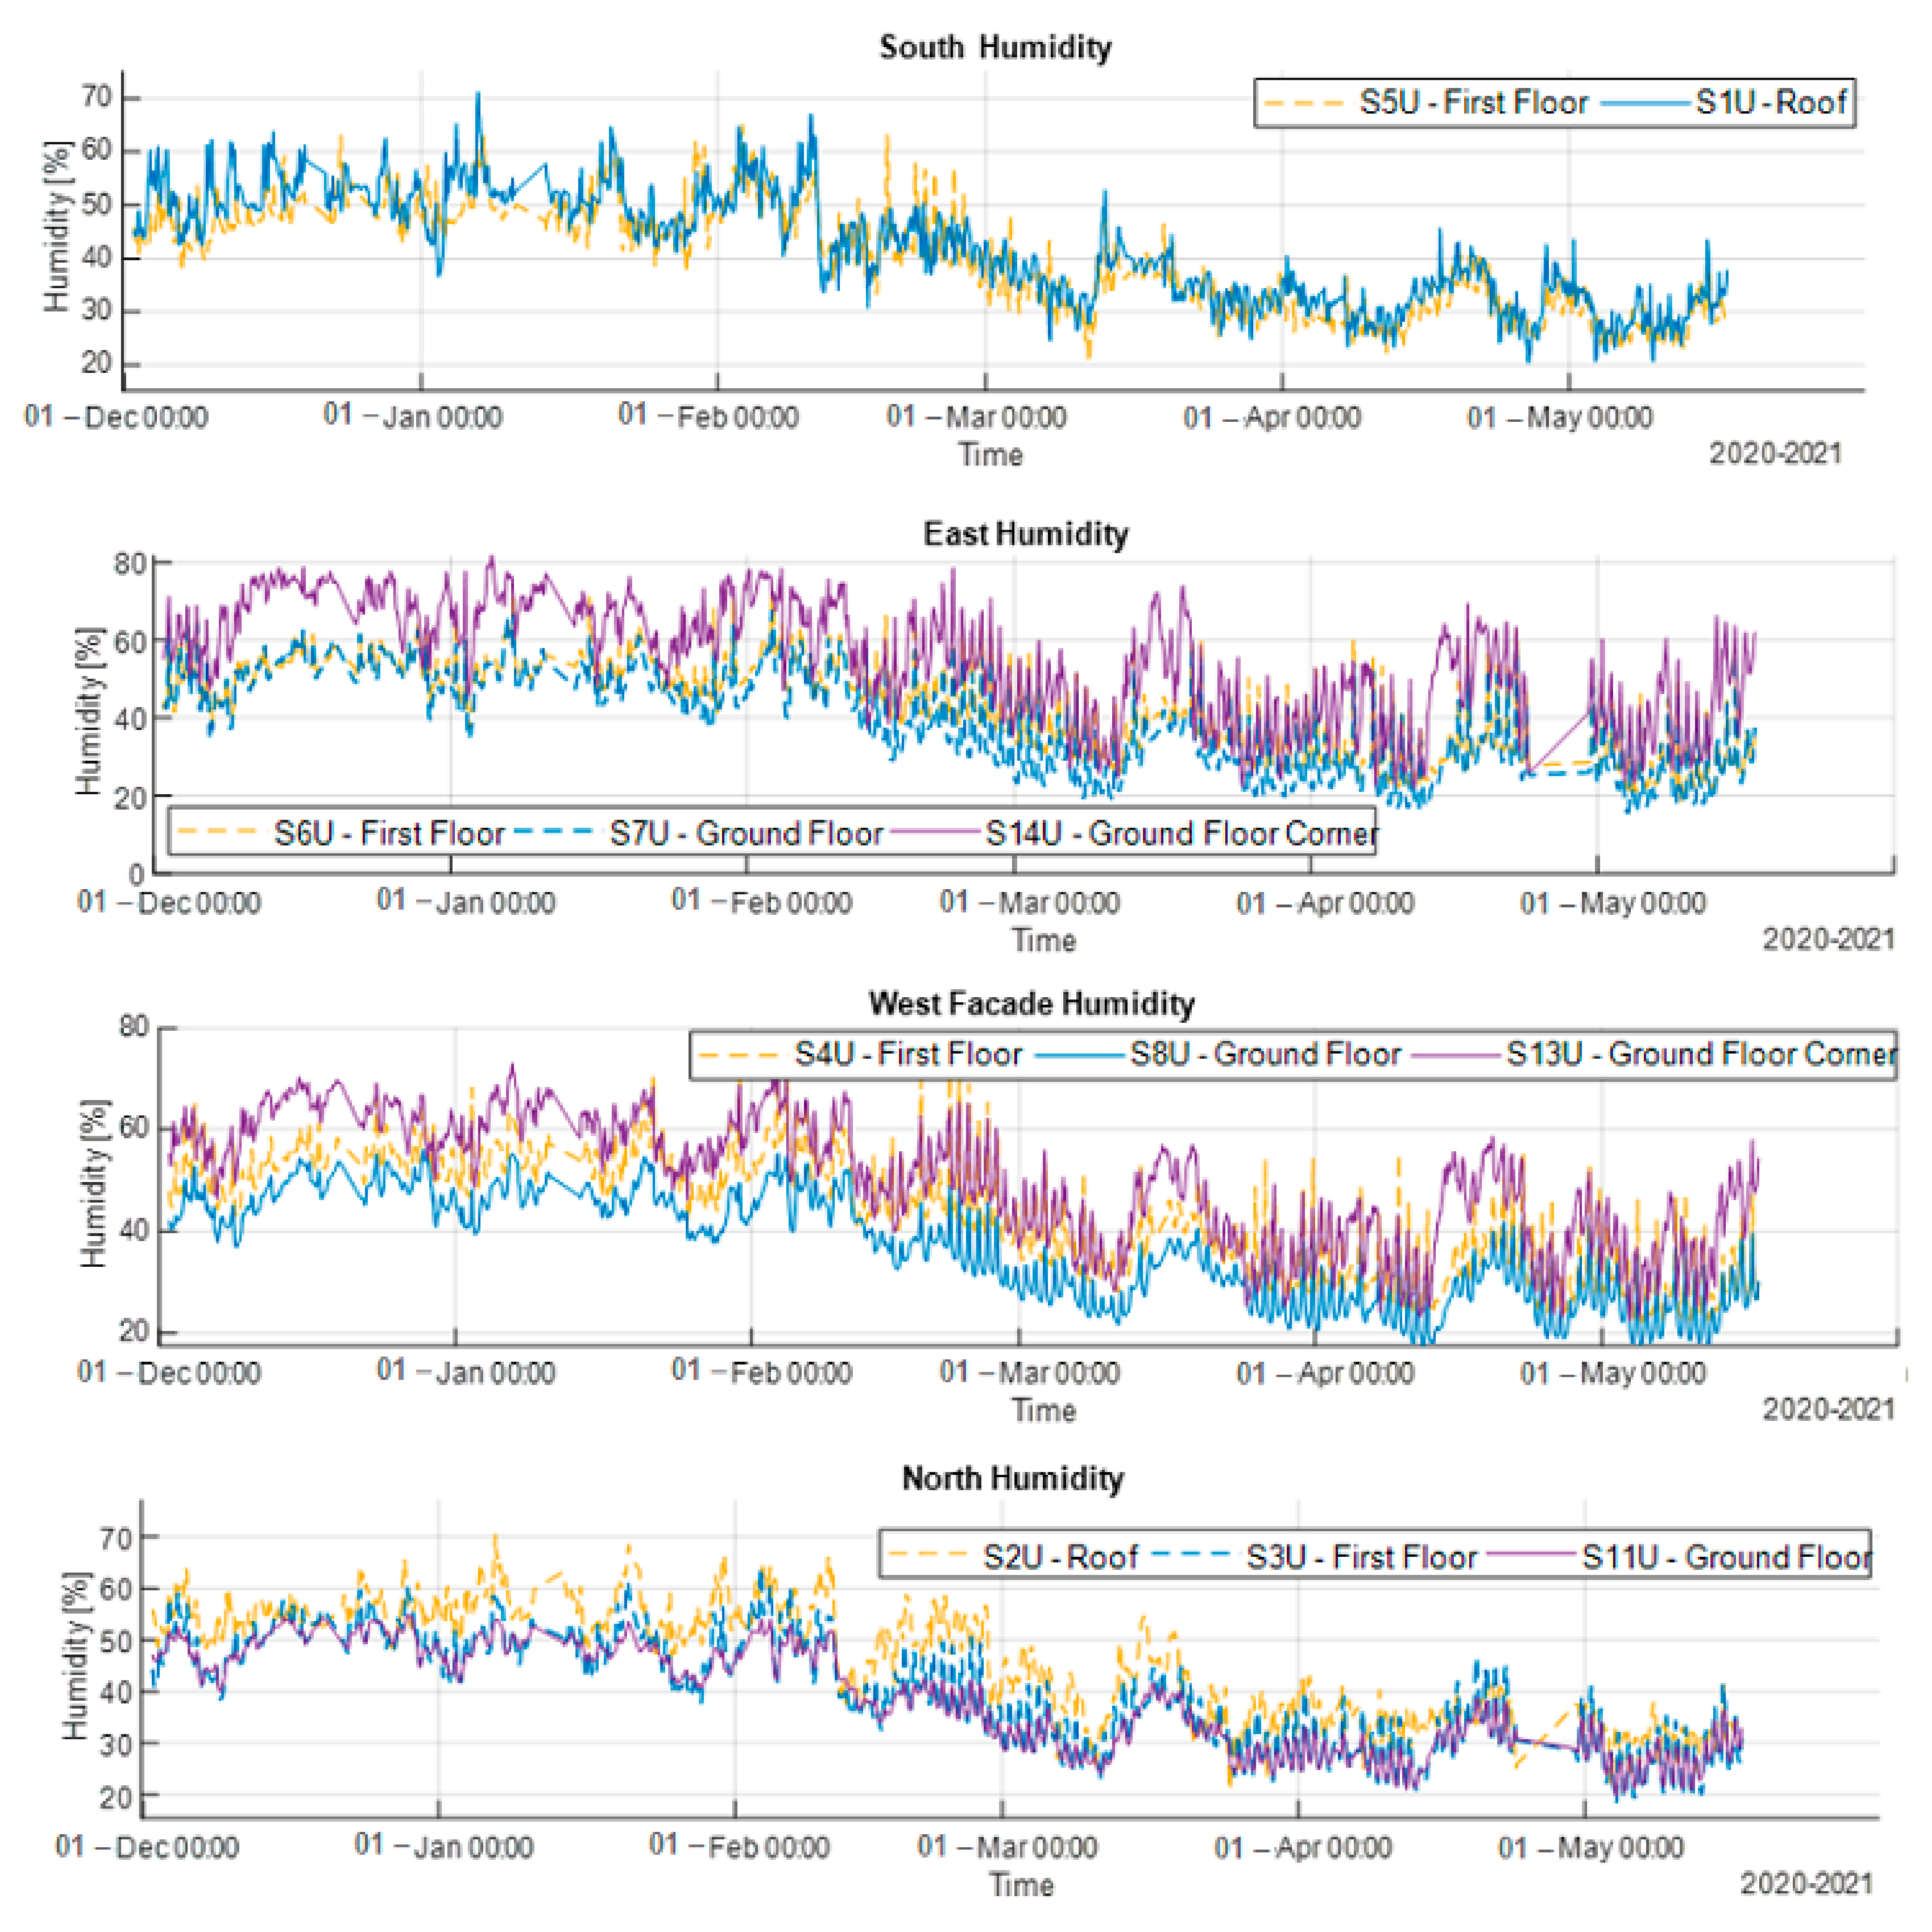
Regarding the outdoor relative humidity, two different periods can be identified, i.e., from 1 December 2020 to 21 March 2021, where the outdoor relative humidity varies between 90 and 95% and from 22 March 2021 to 15 May 2021, where the outdoor relative humidity varies between 74 and 78% (
Figure 17).
The humidity sensors placed on the internal sides of the walls shows there was a 10–20% daily variation, reaching maximum values of around 70% during the night and lower figures of 40% during the day in the winter, while in spring values from 45 to 25% are observed. Slightly higher values for the relative humidity were obtained for the sensors S13U placed on the west ground floor corner and S14U placed on the east ground floor corner, close to the north facade. The reduced ventilation rate, due to the lack of occupancy, might be the main reason for the high indoor relative humidity levels.
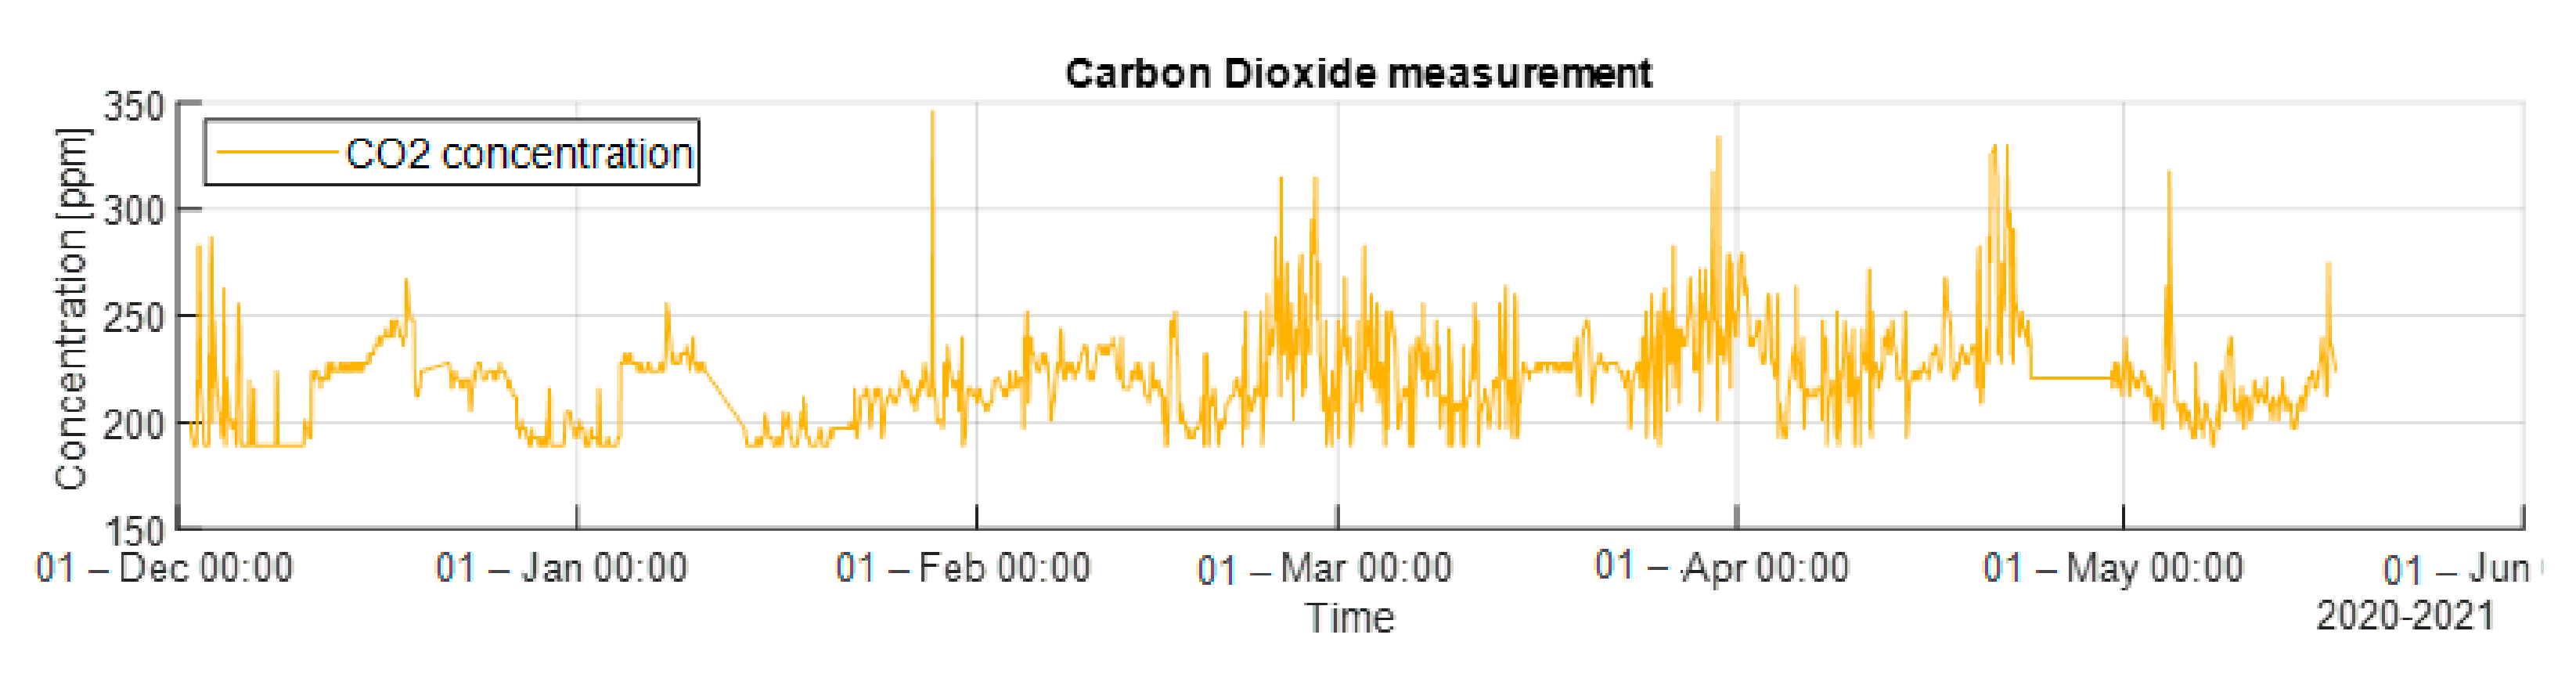
The LSF module is also equipped with a CO
2 sensor, whose provided data are reflected in
Figure 18. The carbon dioxide (CO
2) concentration was evaluated and classified according to the categories defined by EN 15,251 [
37]. The CO
2 concentrations were measured during the same period of time. Higher values of CO
2, between 300 and 350 parts per million (ppm) were recorded during human interference in the building for maintenance or observation. However, even the top values of CO
2 concentration remain in the normal CO
2 concentration of air quality, which corresponds to category I according to EN 15251.
As the LSF experimental module is completely off-grid and during the monitorisation period the wind turbine was not yet installed, there were two intervals (10 January 2021–08:02 AM to 14 January 2021–01:42 PM and 23 April 2021–07:18 AM to 30 April 2021–02:11 PM) in which the energy production of the roof PV was insufficient (due to heavy cloud cover), and the sensors could not provide data (as the graphics show).
3.2. Analysis of the Energy Production
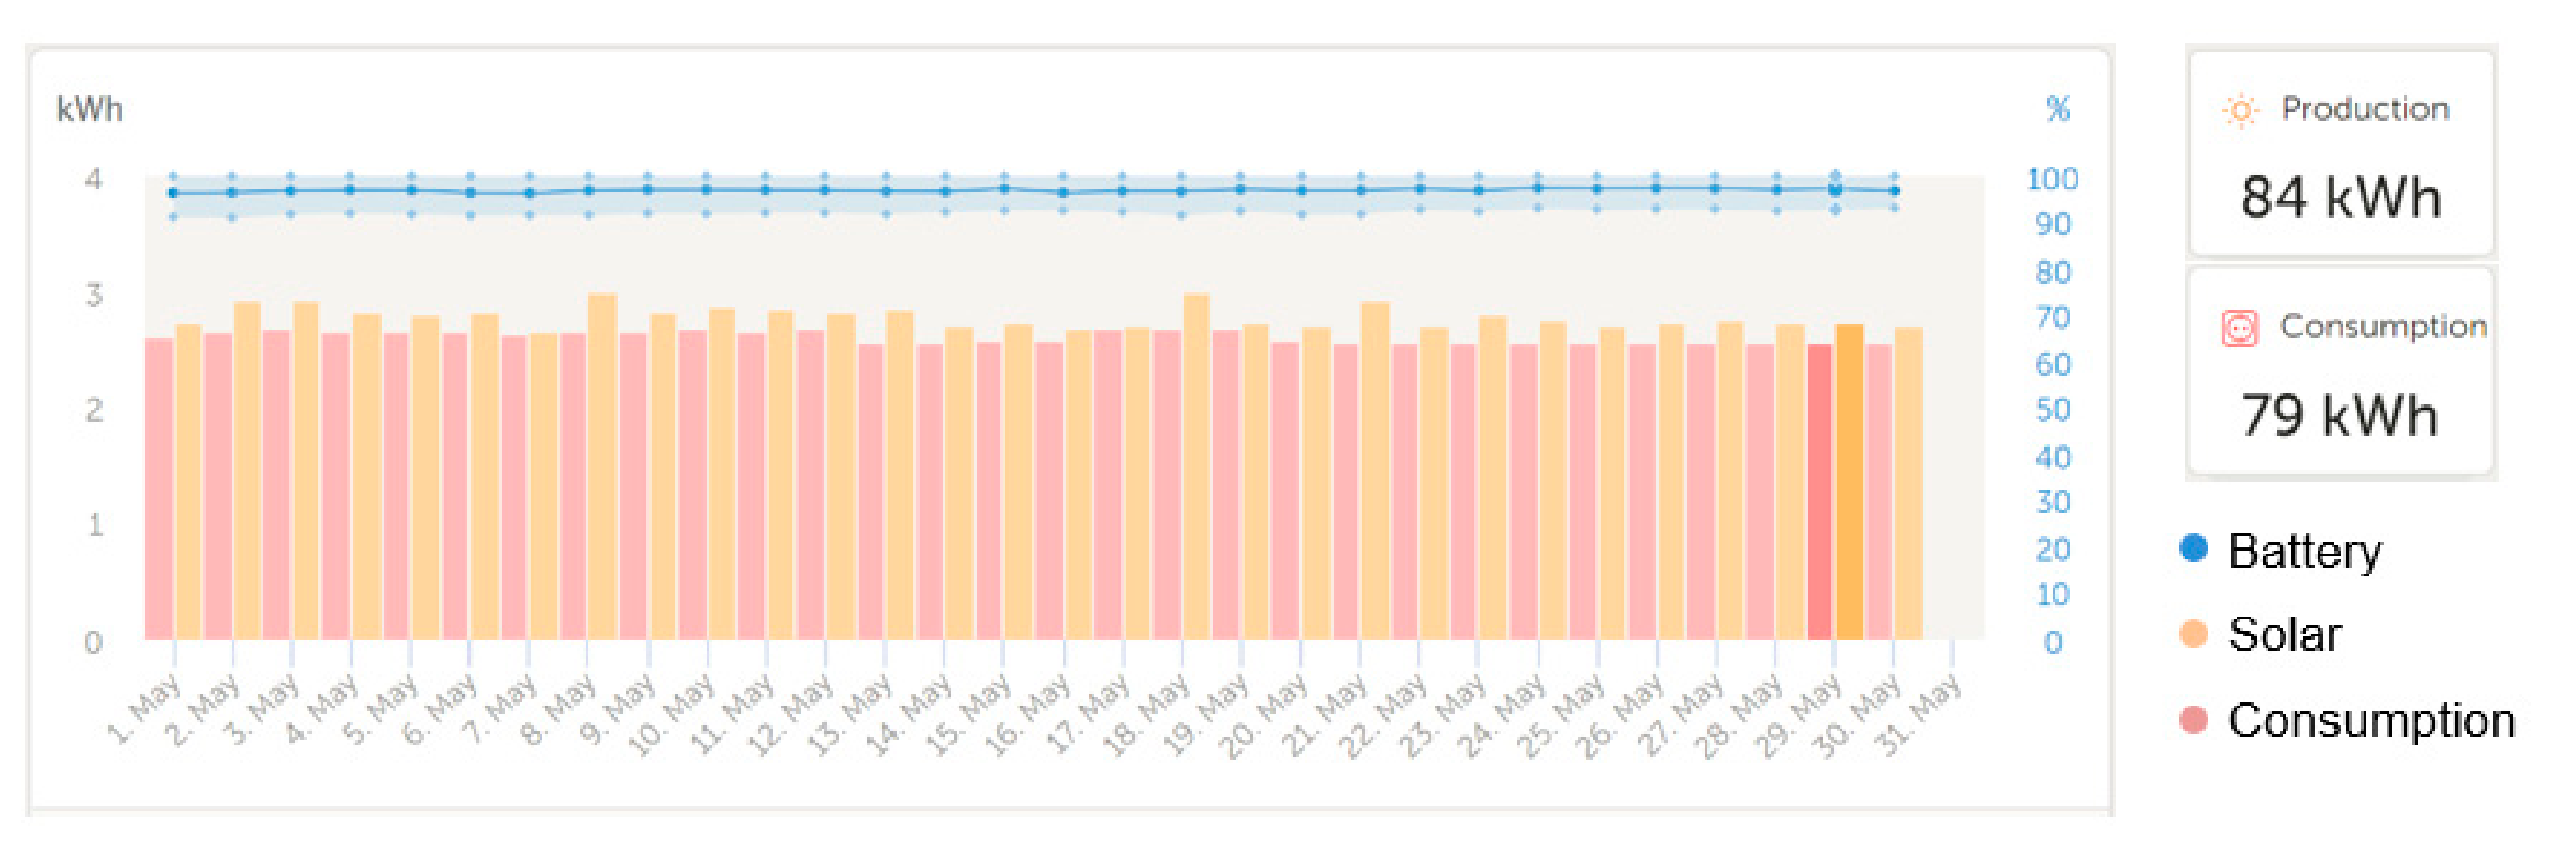
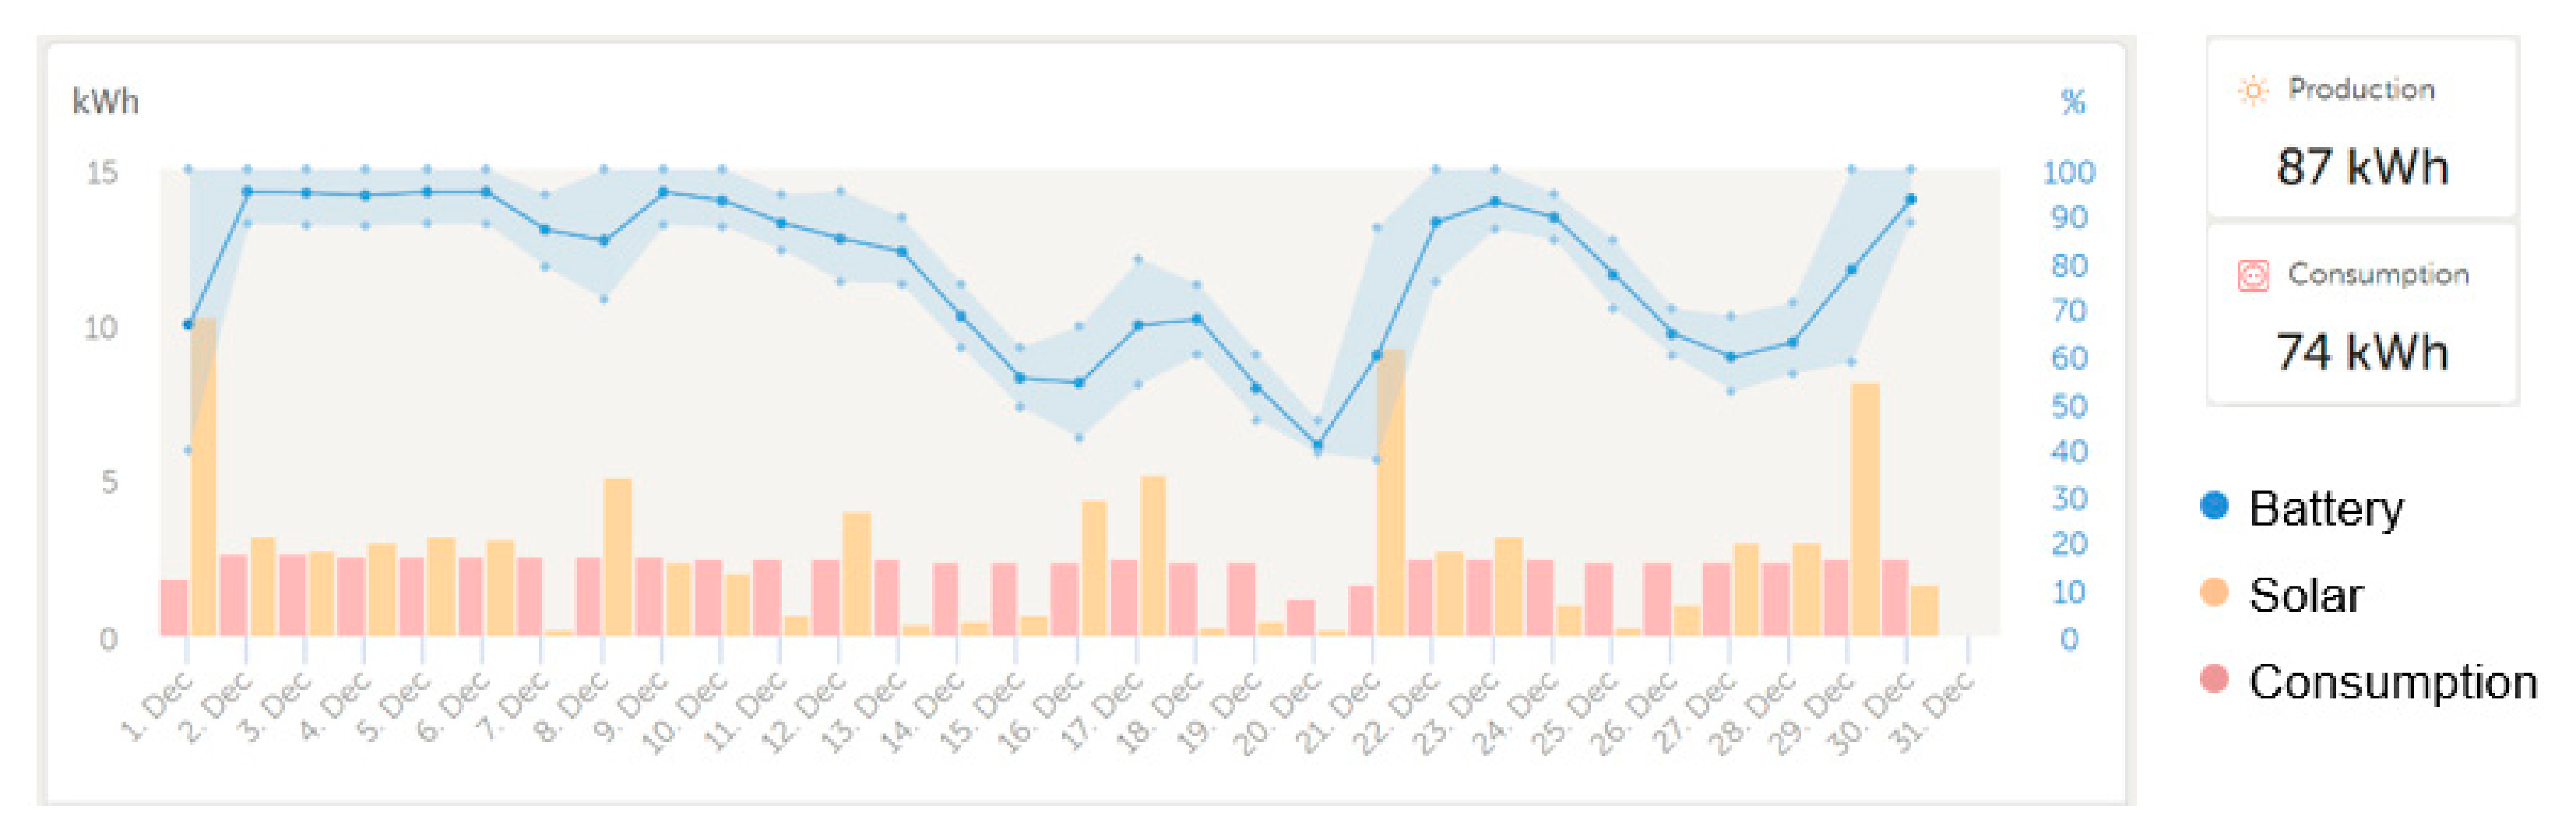
The next section presents an energy analysis report of the LSF module. The energy shown in the following diagrams is provided only by the roof PV. The wind turbine and PV louver were not integrated into the physical system during the monitoring period. For comparison, a winter month, December (
Figure 19), and a final spring month, May (
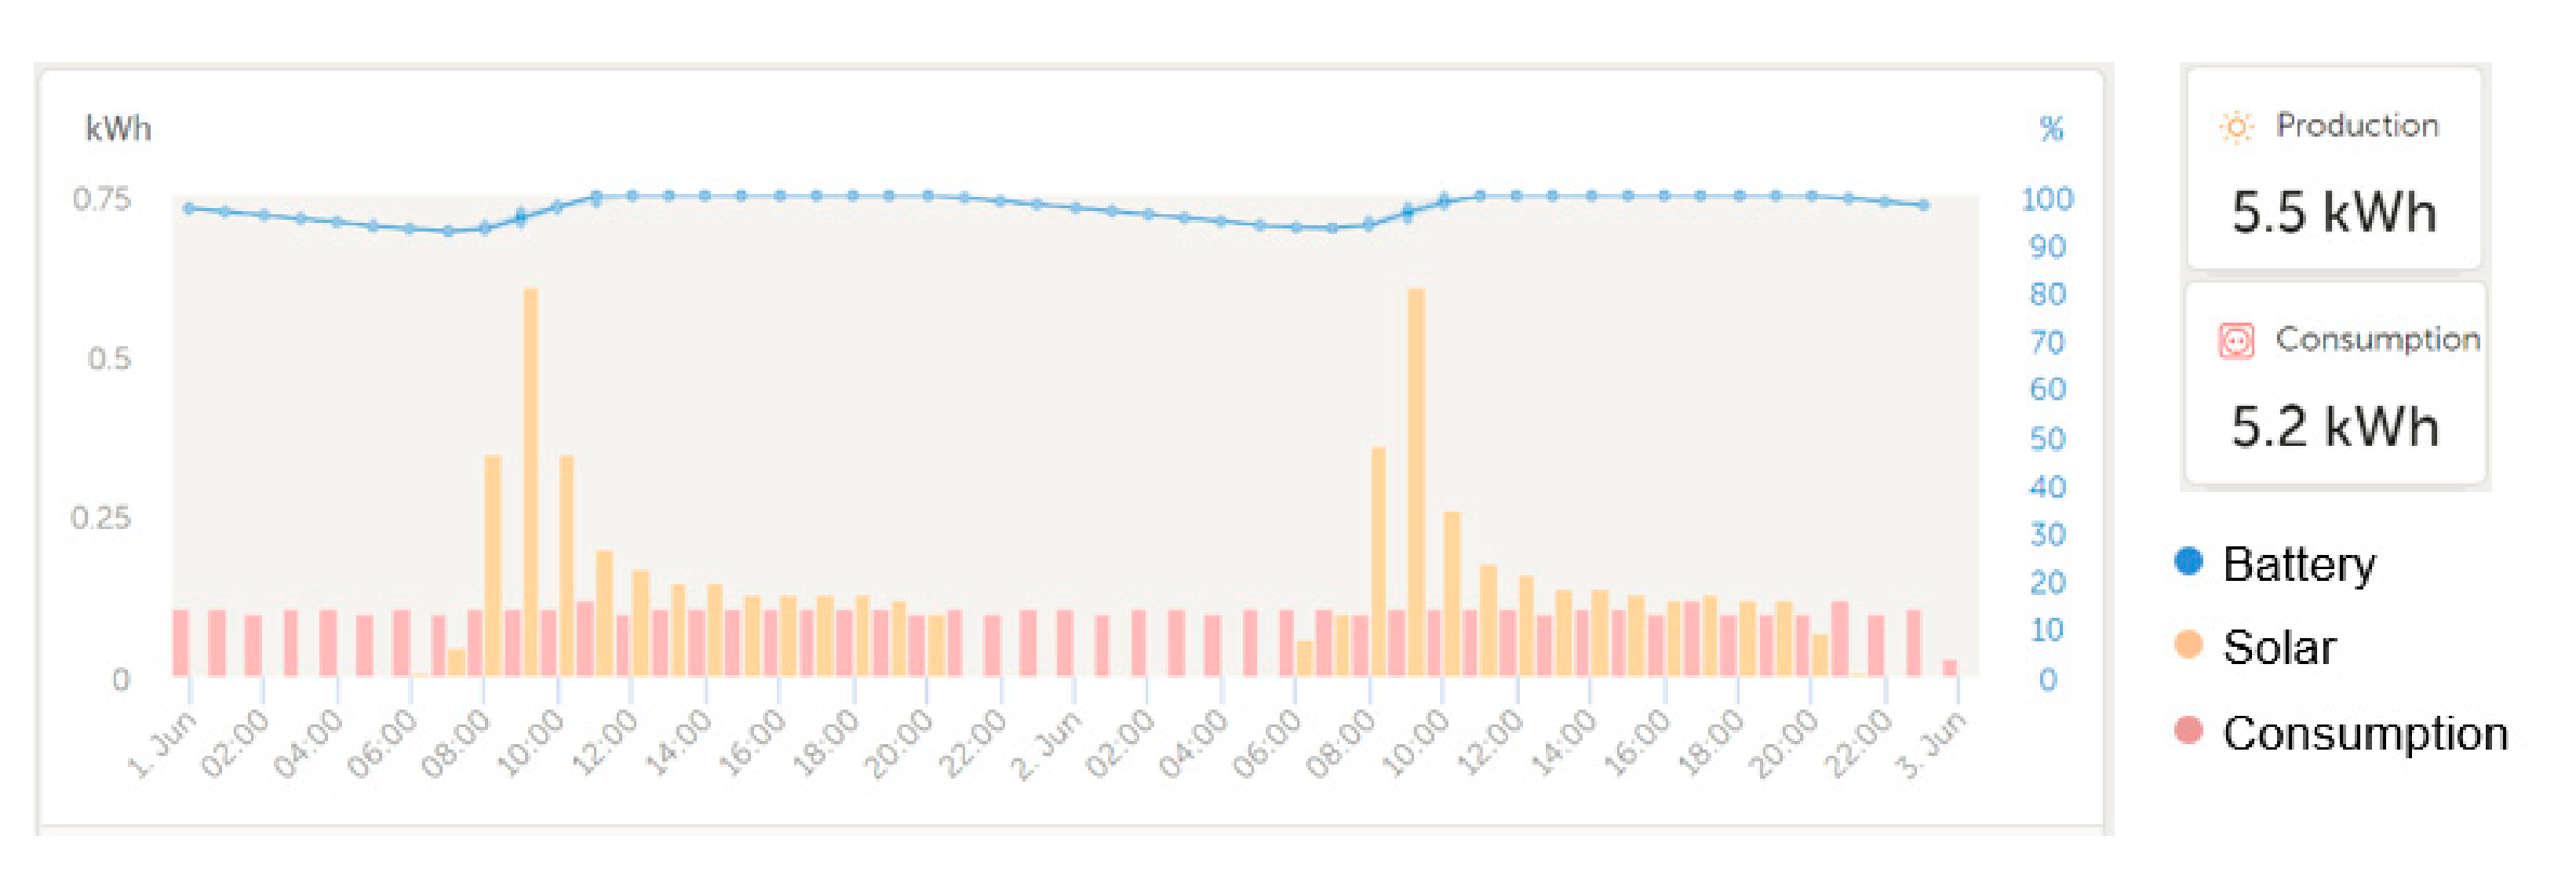
Figure 20), were chosen. The blue line represents the state of charge of the storage system, the orange bars represent the energy production of the roof PV, while the red bars represent the energy consumptions by the LSF module. Against expectations, the higher energy production is in December, due to the necessary energy to charge the batteries.
It can be observed that there are periods of up to 10 kWh energy production/day, which compensate for cloudy and snowy days when the energy is assured from the batteries. In normal operation, the LSF module energy consumption is constant and is approximately 2.6 kWh/day (
Figure 21); however, to not discharge the batteries more than 40% to extend the batteries life, the consumption was reduced and only the essential equipment was powered.
Figure 21 presents the hourly energy analysis for two summer days. Over the nights, the batteries are discharged up to 92–93%, which covers eight–nine hours without solar radiation. The essential equipment consists of the SCADA system and the measuring system. In the end, if we want to assume the total energy that can be generated by the three renewable energy sources (roof photovoltaic panels, louver photovoltaic panels, and wind turbine), we can state that the energy provided is around 5 kWh during peak production.
3.3. Conditions and Limitations of the Study
The outcomes of this study are based on the analysis of only six months of thermal behaviour, it was not possible to statistically analyse and compare the behaviour of this building during large periods of time. The results presented are particular to the Banat zone due to the particular type of climate. However, the benefits of holistically designed buildings and of the recycled-PET thermal wadding insulation can be extrapolated to other areas.
Another limitation of this study is the fact that the building is an experimental laboratory that was not constantly inhabited during the monitorisation period. Since this building is mainly used for short periods of time (maintenance or observation), potential actions of building occupants who could alter in any way the indoor environmental quality were not addressed.
Furthermore, at the time of monitorisation, the external photovoltaic shading lamellae were not installed, a fact which led to the lack of sun shading of the glass curtain and a lower rate of indoor comfortable hours in the days with a clear sky and outside temperatures above 20 °C. Another equipment that was not yet installed at the time of the monitorisation period was the wind turbine, which could have been helpful with the energy production during the two periods of heavy cloud cover of the sky when the energy production of the roof PV was insufficient.
4. Conclusions
Given the EU’s commitment in the Paris Agreement to limit the increase in global average temperature to less than 1.5 °C above pre-industrial levels and the significant contribution of GHG emissions of the building sector, it is imperative to minimize both the embodied GHG emissions and the operating GHG emissions from the construction and renovation of buildings. The weight of embodied GHG emissions varies with the design, the origin of energy, the mix of materials used, and with the construction of the buildings, while the operating GHG emissions are determined by the building performance and the amount of renewable energy in building energy consumption in correlation with fossil-based energy sources.
To achieve buildings with a reduced impact on the environment (either from the construction or operational phase) and moderate construction costs, one needs the embody a holistic approach, integrating cross-disciplinary analysis and multi-object optimization.
The holistic design approach of the LSF experimental module presented in the paper involved the adoption of various criteria regarding a sustainable building, such as resource efficiency, material efficiency, ecology preservation, environmentally conscious design, life cycle design, reusable/recyclable materials, modular and standardized design, environment-friendly demolition method, waste recycling and reuse, safety design, consideration of life cycle cost, materials cost and health and well-being. Besides assigning renewable energy sources, conservation sources of energy, and inclusion of passive design strategies, to meet energy efficiency targets, the holistic design of the modular laboratory required an integrated design with consideration for technology and operation.
The monitored energy system included in the design of the LSF experimental module brings an important contribution in having a genuine overview of the building’s performance during the operational phase.
Thermal performance monitoring included the assessment of air temperature and relative humidity. These parameters were evaluated over six months, from 1 December 2020 to 15 May 2021. The results showed that it is difficult to obtain adequate thermal comfort conditions without an active heating system.
Despite the fact that the building does not have any mechanically cooling, heating or dehumidification systems to augment the indoor comfort conditions, the recordings showed for the monitored period that during mid-season, the rooms had adequate comfort conditions.
However, the presented results highlight the importance of the occupants’ actions that will influence the thermal performance of the building through heating/cooling and ventilation, useful for removing air pollutants and heat loads.
Not controlling the solar radiation (as the shading PV lamellae were not installed yet) increased the risk of overheating hours, as the results showed for the last two weeks of monitorisation. The future use of an external solar shading device will be more efficient in reaching thermal comfort conditions within comfort limits, reducing the risk of excessive solar gains and overheating. The use of an external solar shading device, such as the PV louver, will be more effective to reduce the risk of excessive solar gains and overheating during summer.
Furthermore, additional studies are needed to complement and understand the benefits of improving thermal comfort conditions and reducing energy requirements for heating, to validate the effectiveness of the research presented and to disseminate the assets on a holistic design approach. In future works, a main issue of the model should be addressed, i.e., human behaviour interaction with the building in defining energy demand. Another important aspect is the energy production from renewable sources. The wind turbine and PV louver are now integrated into the physical system. From September 2021, a one-year monitoring period will start including all these missing components.


 ,
, 


