Review

Supercritical Carbon Dioxide Extraction of Lignocellulosic Bio-Oils: The Potential of Fuel Upgrading and Chemical Recovery

by
Nikolaos Montesantos
and
Marco Maschietti
*
Department of Chemistry and Bioscience, Aalborg University, Niels Bohrs Vej 8A, 6700 Esbjerg, Denmark
*
Author to whom correspondence should be addressed.
Energies 2020, 13(7), 1600; https://doi.org/10.3390/en13071600
Submission received: 31 January 2020 / Revised: 22 March 2020 / Accepted: 30 March 2020 / Published: 1 April 2020

Abstract

:
Bio-oils derived from the thermochemical processing of lignocellulosic biomass are recognized as a promising platform for sustainable biofuels and chemicals. While significant advances have been achieved with regard to the production of bio-oils by hydrothermal liquefaction and pyrolysis, the need for improving their physicochemical properties (fuel upgrading) or for recovering valuable chemicals is currently shifting the research focus towards downstream separation and chemical upgrading. The separation of lignocellulosic bio-oils using supercritical carbon dioxide (sCO2) as a solvent is a promising environmentally benign process that can play a key role in the design of innovative processes for their valorization. In the last decade, fundamental research has provided knowledge on supercritical extraction of bio-oils. This review provides an update on the progress of the research in sCO2 separation of lignocellulosic bio-oils, together with a critical interpretation of the observed effects of the extraction conditions on the process yields and the quality of the obtained products. The review also covers high-pressure phase equilibria data reported in the literature for systems comprising sCO2 and key bio-oil components, which are fundamental for process design. The perspective of the supercritical process for the fractionation of lignocellulosic bio-oils is discussed and the knowledge gaps for future research are highlighted.

Graphical Abstract

1. Introduction

The contemporary society is heavily dependent on fossil fuels, both for energy and for the production of chemicals and materials. Indicatively, in 2017, about 108 barrels/day of crude oil, 1010 m3/day of natural gas, and 22 Mt/day of coal were consumed worldwide [1,2]. The volumetric figures for crude oil and natural gas correspond to approximately 11 Mt/day and 12 Mt/day, respectively. The CO2 emissions related to the consumption of fossil fuels amounted to 96 Mt/day in 2017. In addition, the use of crude oil, natural gas, and coal is predicted to increase by 20%, 32%, and 10% by 2050 [1]. These figures clearly show that the development of efficient technological pathways for substantially increasing the production share of energy, chemicals, and materials from biomass, in partial substitution of fossil fuels, is a key aspect for reducing net CO2 emissions and paving the way for a sustainable society based on renewable resources.
Biomass can be classified into first and second generation. First generation biomass is considered edible biomass, which can be extensively cultivated expressly for energy production [3]. Related technological examples are the production of bioethanol from corn and sugar cane and the production of biodiesel from soybean [4]. Second generation biomass is non-edible biomass, characterized by lignocellulosic structure and typically available in the form of waste or by-products from forestry, agriculture, municipal waste management, and the pulp and paper industry [3]. Not being in direct competition with food production, with respect to land and water utilization, the development of process pathways for exploiting second generation biomass is particularly appealing. Low-value utilization of residual lignocellulosic biomass as a source of heating by direct combustion is widespread, both in households (e.g., wood pellets) and in industrial plants where it is produced (e.g., lignin from pulp and paper industry). On the other hand, higher value-added utilizations (i.e., production of liquid fuels and chemicals) are still extremely limited. An indicative example is that lignocellulosic biofuels from forestry and agricultural residues (i.e., bio-oils) account for only 3% of worldwide biofuel production [5].
In line with the above, a huge research effort has been made in the last few decades, aimed at advancing the technologies for the conversion of lignocellulosic feedstocks into liquid fuels and chemicals. Thermochemical processes have shown promising results, as in the case of pyrolysis and hydrothermal liquefaction (HTL). The main product of these processes is a lignocellulosic crude bio-oil, along with gas and biochar as side-products [6]. In the majority of scientific literature, the lignocellulosic oil produced by means of pyrolysis is named bio-oil, whereas the lignocellulosic oil produced by means of HTL is named biocrude (or bio-crude). The same approach is followed in this review. However, in this work, the term bio-oil is also used when pyrolysis and HTL oils are discussed jointly.
With regard to fuel production, crude bio-oils require both physical and chemical upgrading steps in order to be inserted into the current technological chain (e.g., blending with specific petroleum fuels). The utilization of typical refinery processes developed for fossil fuels is challenging, owing to the marked difference between bio-oils and petroleum. More specifically, from a chemical standpoint, lignocellulosic bio-oils (LC bio-oils) suffer from high average molecular weights (MWs), high oxygen and water content, as well as high acidity. From a physical standpoint, they suffer from high density and viscosity [7,8]. The production of specific chemicals is also challenging, as LC bio-oils are complex mixtures of a large number of compounds that show diverse molecular weight and polarity. The diversity in polarity is a marked difference compared with fossil crudes, which makes existing separation and chemical processes developed for fossil crudes not straightforwardly applicable to LC bio-oils. On the one hand, the development of thermochemical conversion processes of lignocellulosic biomass has been the focus in previous years; on the other hand, it is expected that the research focus in the coming years will shift towards the development of separation processes to be applied downstream of the thermochemical conversion unit. Such processes aim to produce either upgraded fuel fractions or specific value-added chemicals.
Among separation processes available in the chemical industry for the fractionation of oils, distillation and liquid–liquid extraction (LLE) are particularly relevant and widespread. However, in the case of LC bio-oils, the high molecular weight leads to very high distillation temperatures or very high vacuum requirements. For example, distillate fractions not exceeding 50 wt%–60 wt% of the bio-oil are reported for pressures as low as 0.1 mbar [9,10,11,12]. In addition, temperatures above 100 °C during distillation promote side-reactions (e.g., polymerization) [8,13]. Another factor negatively affecting the distillation of bio-oils is their water content. It was reported to reduce the efficiency of the separation and to lead to unsteady boiling and process control difficulties [9]. In addition, the water content is one of the main factors reducing the viscosity of bio-oils [8]. This implies that, in the lower stages of a continuous-flow distillation column, the bio-oil flowing downwards is expected to be extremely viscous, leading to operational problems. With regard to LLE, the process requires large quantities of organic solvents, the majority of which are produced from petroleum (e.g., dichloromethane, n-pentane) [14,15], thus spoiling one of the selling points of renewable fuels by using petroleum-based materials for bio-oil processing. In addition, organic solvents are often noxious and their recovery downstream of the extraction requires an additional process step (e.g., solvent evaporation).
An alternative for the separation of oils is represented by the extraction using supercritical carbon dioxide (sCO2) as a solvent. In the supercritical region (i.e., above 73.8 bar and 31 °C), carbon dioxide behaves as a liquid solvent, exhibiting liquid-like densities and good solvent power towards apolar and moderately polar compounds. In addition, sCO2 has favorable transport properties (e.g., high diffusivity, low viscosity), which make it an efficient solvent. Downstream of the separation unit, carbon dioxide can be easily recovered by, for example, partial decompression, and recycled. From a solvent perspective, CO2 is environmentally benign, safe (non-flammable), low-cost, and readily available. It is considered a particularly valid alternative for the separation of oils with high boiling temperatures (i.e., low volatility) [16]. For example, it finds industrial application for the fractionation of low volatility liquid mixtures, as in the case of hydroxyl-terminated perfluoropolyether oligomers [17]. The supercritical process is expected to have operational advantages as the dissolution of sCO2 in the liquid phase causes oil expansion and a drop in viscosity, which facilitate the flow of the oil in continuous countercurrent equipment. As an example, these mechanisms are exploited in enhanced oil recovery processes based on CO2 injection, which are particularly effective with respect to heavy oils and tar sands [18].
For the reasons stated above, research papers reporting the use of sCO2 for separating LC bio-oils have appeared in the literature in the last decade. The main objectives of this review paper are as follows: (i) to provide an update on the progress of the research on sCO2 separation of LC bio-oils; (ii) to provide an update on the progress of the research on high-pressure phase equilibria of systems comprising sCO2 and bio-oil components; and (iii) to highlight knowledge gaps inspiring future research work in this area. The review paper is structured as follows. Section 2 describes the properties of LC bio-oils, also in relation to the starting biomass and the thermochemical conversion process, and highlights the issues encountered in the downstream upgrading aimed at fuel and chemicals production. Section 3 provides basic features of sCO2 extraction processes and reviews in detail the literature providing experimental data on sCO2 extraction of LC bio-oils. Section 4 analyzes available experimental data of phase equilibrium of carbon dioxide at supercritical conditions and key components of LC bio-oils and provides data correlations and interpretation based on the Chrastil model. Section 5 summarizes the authors’ view with regard to the integration of this technology in the downstream upgrading of LC bio-oils and highlights research and technology gaps.

2. Lignocellulosic Bio-Oils

2.1. Lignocellulosic Feedstocks

Second generation lignocellulosic biomass is abundant in the form of agricultural, forestry, and municipal residues, as well as industrial byproducts such as lignin from the pulp and paper industry. In 2017, the agriculture sector was estimated to be able to generate from 11 to 47 Mt/day of lignocellulosic residues, whereas forestry residues were estimated to be 2.1 Mt/day [19]. Their quantitative potential as raw materials alternative to fossil fuels is thus significant. However, when considering the inherent difficulties in collecting a sparse resource and conveying it to conversion plants, together with the yields of transformation into valuable products, it is probable that only a fraction of fossil-based fuels and chemicals can realistically be substituted by LC counterparts. The potential contribution of municipal sewage sludge is rather small (e.g., approximately 25 kt/day of dry biomass in the European Union (EU) in 2010 [20]), even though it is worth considering it in the context of an overall effort aimed at raw material shift from fossil fuels to renewables. With regard to industrial lignocellulosic residues, Kraft lignin from the pulp and paper industry and lignin-rich residues from bio-ethanol plants (i.e., residual enzymatic lignin) are currently made available in small quantities, with an estimated 0.19 Mt/day [21] and 0.74–2.2 kt/day [22], respectively. In spite of the small quantities currently available, lignin is attractive owing to the peculiar chemical structure, which is composed of aromatic moieties. In addition, lignin is available with reproducible quality as a by-product of industrial systems that are either well-established (Kraft process) or under development (lignocellulosic to ethanol). These aspects make lignin an interesting by-product for the production of fuel additives, as well as bulk and fine aromatic chemicals [23,24]. Another interesting industrial example is represented by residues of the palm industry, such as palm kernel shells. In 2006, Malaysia produced approximately 0.14 Mt/day of lignocellulosic residues associated to palm oil production, which can be an attractive feedstock for the production of bio-oils [25].
Lignocellulose consists in its majority of three natural macromolecules (i.e., cellulose, hemicellulose, and lignin), as well as a small weight percent of ash (i.e., inorganics). The ratio between these macromolecules varies widely from biomass to biomass and is one of the parameters affecting the composition of bio-oils. Key examples of these feedstocks that were studied in the literature, with respect to their conversion to bio-oils, are reported in Table 1, with typical ranges of mass fraction for cellulose, hemicellulose, lignin, and ash.
Besides the composition in terms of cellulose, hemicellulose, and lignin, the overall elemental composition is another basic parameter that affects the properties of the bio-oil that can be obtained by LC biomass. Table 2 reports the oxygen content, the H/C and O/C ratios, and the higher heating value (HHV) for specific LC feedstocks that were studied in the context of bio-oil production. Elemental data and HHV are given on a water-free basis. HHV is calculated as reported in the literature [27], when the experimental data were not provided.
As can be seen, the elemental composition of woody biomass is rather constant for pine (softwood) and beech (hardwood). Lignin is the biomass with the lowest oxygen content, which results in the highest HHV. The crop residues have the highest oxygen content, and thus the lowest HHVs.

2.2. Lignocellulosic Bio-Oils

Bio-oils are defined here as the organic-rich liquid product of the thermochemical conversion of biomass. The two most prominent conversion processes are pyrolysis and hydrothermal liquefaction (Table 3). Pyrolysis employs high temperature to thermally break the macromolecules constituting the biomass in an oxygen-free environment. Drying of the biomass is required prior to pyrolysis. Depending on the residence time, the process is denoted as fast (i.e., a few seconds) or slow (i.e., hours to days). Microwaves can be used as an alternative heating source [8]. HTL can handle both dry and wet biomass, whose macromolecular constituents are broken down by a complex set of reactions in subcritical or supercritical water environment, with or without assisting chemicals (e.g., catalysts, pH regulators, co-solvents) [33].
Pyrolysis has reached industrial production level, with several plants around the world [8]. Licensed pyrolysis technologies (e.g., BTG-BTL, Ensyn, VTT) are being used in plants that produce bio-oil mostly from forestry residues. Characteristic examples are the Empyro plant (Twence – Empyro) in the Netherlands with production of approximately 65 t/day [34] and the Côte-Nord plant (Ensyn) in Canada with a capacity of approximately 130 t/day [35]. The HTL technology is utilized in several pilot plants around the globe [33] and one demonstration plant is under construction in Norway by Steeper energy and Silva Green Fuel with a production capacity of approximately 4 t/day [36].
LC bio-oils produced by pyrolysis and HTL are typically viscous dark liquids (Figure 1), composed to a large extent of oxygenated organic components. These oils are tight water-in-oil emulsions with water mass fractions typically in the range of 20 wt% to 30 wt% for pyrolysis oils [37], while lower values are observed for HTL biocrudes (4 wt%–15 wt%) [38,39,40,41,42]. Owing to the polarity induced by oxygen to many chemical constituents, raw bio-oils are not fully miscible with hydrocarbon solvents. They are, however, miscible with oxygen-containing organic solvents such as acetone and tetrahydrofuran [40,43]. In some cases, inorganics (i.e., ash) are present in bio-oils. They can either originate from the biomass or be introduced during processing [44]. Some quantitative information concerning physical and chemical properties of bio-oils is available in the literature and is reviewed in the following.
Density values for LC bio-oils are typically higher than 1000 kg/m3, with small variations depending on the source of biomass. For example, values between 970 kg/m3 and 1100 kg/m3 are typical for HTL biocrudes [9,45,46]. Somewhat higher values are typically reported for pyrolysis oils, namely between 1100 kg/m3 and 1200 kg/m3 [47]. Density values are thus higher than petroleum and petroleum liquid products, which typically range from 800 kg/m3 for light crude oils up to 1000 kg/m3 for heavy oils and bitumens [48].
Kinematic viscosity values for LC pyrolysis oils are reported in a broad range, from 7 to 53 cSt at 40 °C [37,49]. The variation is strongly connected to the water content of the bio-oil (i.e., 17 wt%–48 wt%), with viscosity markedly decreasing with the water content. In another work, the kinematic viscosity is reported to be 28 cSt at 60 °C [50]. With regard to LC biocrudes (obtained by means of HTL), dynamic viscosity values are reported in a much broader range, namely from 1700 cP to 4·106 cP [30,51,52]. The higher values correspond to semisolids and result from the drying of the biocrude. Another work reports the kinematic viscosity of a dehydrated HTL biocrude being 12 cSt at 40 °C [9]. The major difference in viscosity between pyrolysis and HTL oils is, at least in large part, owing to the difference in the water content. As reported data typically refer to different water contents, caution is required in drawing conclusions related to the quality of the bio-oil on the basis of viscosity.
With regard to bulk chemical properties, the most important characteristic of LC bio-oils is the high oxygen content (O), which can widely range from as low as 10 wt% to as high as 50 wt%. In Table 4, a few examples are reported. As can be seen, oxygen ranges from 19 wt% to 40 wt%. In all cases, the oxygen of the bio-oil is lower than that of the biomass, which also translates into a higher HHV and a lower O/C ratio. Nevertheless, the oxygen values are at least one order of magnitude higher than the typical values for crude oils, where they lie in the range 0.05 wt% to 1.5 wt% [53]. Therefore, deoxygenation of LC bio-oil is a requirement in the perspective of fuel production.
The inorganic content of bio-oils, cumulatively reported as ash, is the result of both the presence of metals in the original biomass and their introduction during processing. Examples of metals found in bio-oils are sodium (Na), potassium (K), and iron (Fe) [44,57,58]. Pyrolysis oils typically have a low ash content (e.g., 0.01 wt%−0.2 wt%) [47,59], as most of the metals are not contained in volatile compounds, and thus do not transfer in the gas stream. In addition, entrained particles in the gas stream are retained by filters. The small amounts of ash reported in pyrolysis oils are typically associated to volatile organometallic components [44]. On the other hand, HTL biocrudes are typically obtained by processes where catalysts (e.g., potassium carbonate [57]) and pH regulators (e.g., sodium hydroxide [60]) are utilized. These chemicals dissolve in the water droplets emulsified in the biocrude, resulting in high ash contents. For example, when an alkali catalyst is used, the ash content of the biocrude can be as high as 5 wt% [45]. With regard to the biomass feedstock, Anastasakis et al. [41] performed non-catalytic HTL of miscanthus and spirulina, which contained 2.7 wt% and 6.5 wt% of ash, respectively, and the biocrudes ended up on average with 2.8 wt% and 6.6 wt% ash, respectively. It is important to note that even metal content values as low as 0.5 wt% can be detrimental for the downstream catalytic upgrading (e.g., hydrotreating). Therefore, the metal content of bio-oils must be substantially reduced if the oil is to be hydrotreated [57].
Another relevant characteristic of LC bio-oils is the acidity. The total acid number (TAN) of LC bio-oils is reported in the range of 9 to 200 mg KOH/g [30,59,60,61,62,63,64], depending on the bio-oil and on the measurement method. TAN is a representation of the acidity of the liquid mixture and is a cumulative effect of carboxylic acids and phenolic components that are present in the LC bio-oils. Considering these two partial acid numbers, namely the carboxylic acid number (CAN) and phenolic acid number (PhAN), the determination of the latter is not always achieved, when methods developed for petroleum are used. In some cases, the reported (cumulative) TAN values are essentially CAN. A modification of ASTM D664 [65] was reported by Christensen et al. [63], which successfully determines both acid numbers in pyrolysis oils. Montesantos et al. [64] measured the TAN of a LC biocrude from HTL, using a method inspired by this modification, and reported a CAN value of 43 mg KOH/g and TAN of 129 mg KOH/g. On the other hand, most of the literature for HTL biocrudes reports values of TAN up to 67 mg KOH/g [30,61,66]. This suggests that, at least in some cases, CAN values are those actually reported. Therefore, the methodology for the determination of TAN for bio-oils is one of the properties that requires standardization to ensure meaningful comparisons between different works. In this respect, Oasmaa et al. [27] published an interesting review of properties and analytical methods for the case of LC pyrolysis oils.
With regard to the detailed chemical structure of LC bio-oils, they are complex mixtures consisting of an overwhelming number of chemical components. Ketones, phenols, organic acids, and aromatic hydrocarbons are commonly found in the volatile fraction [7,67] of LC bio-oils. Other components such as aldehydes, esters, furans, and sugars are reported in the volatile fraction of pyrolysis oils [67]. The nonvolatile fraction of bio-oils contains mainly oligomers with several carbon and oxygen atoms (e.g., 15–29 carbon and 8–10 oxygen atoms [68]). This heavy fraction includes both phenolic and carbonyl functional groups [68,69], but little is known in detail. The average molecular weight of bio-oils is typically in the range of 300 to 1000 g/mol [70,71,72], with individual components with molecular weight ranging from less than 100 g/mol to several thousand g/mol [15,68,73].
More information is available for the volatile fraction, which is typically studied by gas-chromatography coupled with mass spectrometry (GC-MS). A discussion on this fraction is reported in the following. In most cases, the relative amounts of components of the volatile fraction are simply reported in terms of chromatographic peak area ratios. When internal standards are used, the mass fraction of identified components rarely accounts for more than 50 wt% of the bio-oil. The highest values are typically associated with pyrolysis oils, owing to several low molecular weight components (e.g., acetol, acetic acid, and glycoladehyde) that each constitute up to 10 wt% of the oil. In addition, levoglucosan is typically found in woody pyrolysis oils at high mass fractions (e.g., 10 wt%) [43,54,74,75,76,77,78]. On the other hand, single components at such a high concentration are not observed in the volatile fraction of HTL biocrudes, which is characterized by total mass fractions of identified components in a lower range (e.g., 10 wt%–30 wt%) [28,40,64,76,79,80]. However, chemical classes like polyaromatic hydrocarbons (e.g., retene) [57] and long chain fatty acids (e.g., hexadecanoic acid) [64] were found to constitute up to 9 wt% and 4 wt% [58] of HTL biocrudes, respectively. Such components are often not reported in the characterization of HTL biocrudes, even though they seemingly are a considerable part of it.
Table 5 reports the main chemical classes observed in the volatile fraction of LC bio-oils, together with typical ranges of molecular weight and number of carbon atoms (carbon number). In addition, an example is provided in which two pinewood bio-oils, produced by fast pyrolysis and HTL, are directly compared. The chemical classes include components with a wide range of molecular weights (i.e., 60 g/mol to above 300 g/mol) and volatilities, with boiling points ranging from around 100 °C (as normal boiling points) to values by far exceeding 300 °C (as atmospheric equivalent temperature, AET). The presence of these components in LC bio-oils results in high oxygen content, polarity, and acidity.
As different lignocellulosic biomasses own different fractions of cellulose, hemicellulose, and lignin, it follows that some component types will be favored during thermochemical conversion. More specifically, a larger fraction of lignin increases the fraction of phenolic components such as phenol, alkylphenols, guaiacols, and benzenediols [85]. For example, the mass fraction of phenolic components (relative to the total mass fraction of GC-MS identified components) reported by Belkheiri et al. [40] for an HTL biocrude from Kraft lignin was 97%, whereas the analogous ratio (in terms of peak areas) observed by Pedersen et al. [57] for an HTL biocrude from aspen wood was only 27%. Other chemical classes like ketones, furans, and acids are abundant in bio-oils that originate from biomass with a high content of cellulose and hemicellulose [86]. For example, the peak area fraction of ketones reported by Pedersen et al. [57] was 21% for a biocrude originating from biomass with 67% of cellulose and hemicellulose. The analogous quantity reported by Chan et al. [87] was 21% in a biocrude originating from biomass with 50% of cellulose and hemicellulose.
Another important aspect of LC bio-oils is the stability under storage. Kosinkova et al. [46] reported an increase in density of about 5% for an HTL biocrude under ambient conditions upon 25 weeks of storage. The increase reached 30% when the biocrude was stored at 43 °C for the same duration. The density increase was connected to the increase of the average molecular weight, which in turn resulted from polymerization reactions of certain lignin-derived phenolic components. Nguyen et al. [79] observed composition changes in a lignin-derived HTL biocrude (lignin oil), which can be attributed to instability of the biocrude. Specifically, alkylphenols, benzenediols, and phenolic dimers decreased over time, while the average molecular weight of the oil increased after two years under ambient conditions. The increase in MW was observed by means of gel permeation chromatography (GPC), and was in line with the decrease of the GC-MS identified fraction of components from 15 wt%, for the fresh biocrude, to 11 wt% after long-term storage. Interestingly, a diethyl ether extracted fraction (corresponding to 66 wt% of the biocrude) was very stable, with the identified GC-MS fraction exhibiting only a 1% reduction in two years at ambient conditions. An important observation of this work is that the presence of inorganic solids in the lignin oil catalyzes the polymerization reactions, resulting in a higher aging rate. Elliott et al. [37] reported an increase of the kinematic viscosity of a fast pyrolysis oil between 60% and 70% during an aging test at 80 °C for 24 h. This viscosity difference, together with the reported increase of the average molecular weight, is indicative of the relatively low stability of pyrolysis oil. A similar increase of viscosity was observed after 12 months at 21 °C. Storage at 5 °C and −17 °C resulted in smaller increases of viscosity, equal to 19% and 7%, respectively [37].

2.3. Valorization

2.3.1. Fuel Upgrading

Hydrotreating (HT) is the most prominent process for removing heteroatoms. It is a catalytic process adopted from the mature oil industry, where it is typically performed at temperatures of 90–390 °C and pressures of 15–170 bar. HT aims to remove heteroatoms like sulfur, nitrogen, oxygen, and hydrogenate C = C bonds (hydrogenation, HYD). The main expenditure is the consumption of hydrogen (H2), with typical refinery values in the range of 10 to 850 Nm3 of H2 per m3 of feed. The variation in the process conditions depends on the feedstock composition as well as on the objective of HT. Higher heteroatom contents usually require more severe conditions. Typically, fixed bed reactors are used, with the most common catalysts being cobalt-molybdenum (CoMo) and nickel molybdenum (NiMo) [88].
With regard to bio-oils, HT was studied at laboratory scale, with the main objective being the hydrodeoxygenation (HDO) of the liquid feed [89,90]. Reaction temperatures and pressures are reported in the range of 150 to 400 °C and 40 to 140 bar, with most typical values being 300–400 °C and 100 bar [39,89,90,91]. The most commonly used catalysts are commercially available CoMo and NiMo on Al2O3 support, although several other catalysts were also studied [92]. The economics of the process is mainly affected by the high H2 partial pressures required. In particular, the large oxygen fraction of bio-oils requires H2 to feed ratios in the range of 300 to 600 Nm3/m3 [9,89,93], which are similar to the ratios required for the sulfur-rich heavy fractions of crude oil refineries (e.g., residual oil) [88].
One of the issues of HT is the formation of coke, which leads to gradual deactivation of the catalyst. Typically, high molecular weight and high boiling point components accelerate deactivation because of deposition on the catalyst active sites [94]. Bjelic et al. [15] investigated the chemistry of a wood-derived HTL biocrude, as well as the chemistry of the extract and the residue obtained from the hydrotreated biocrude by means of liquid–liquid extraction using n-pentane (C5). The presence of HT resistant species in the residue was observed and the recommendation of separating the C5-insoluble fraction from the biocrude prior to HT was formulated. The metal content of some bio-oils (mainly HTL biocrudes) is also expected to pose problems to HT, because of rapid deactivation of the catalyst. Metal deposition is irreversible; it substantially reduces the catalytic activity and increases the pressure drop in the HT reactor [88,94]. When metals are deposited on the catalyst bed, regeneration (e.g., to remove coke) can sinter the catalyst surface, resulting in area loss [94]. These factors make necessary the demetallization of bio-oils prior to HT.
In spite of the abovementioned problems, research on HT of bio-oils has shown promising results indicating that, using optimal catalysts and conditions for hydrotreating, fuel grade oils can be achieved. Jensen et al. [90] performed HT experiments on HTL lignocellulosic biocrude on a commercial NiMo/Al2O3 catalyst. This parametric study highlighted the importance of high temperature and high H2 partial pressure for achieving high-levels of HDO. The maximum HDO level attained in this work corresponded to a reduction of oxygen from 5.3 wt% (feed biocrude) down to 0.1 wt% (hydrotreated oil), with operating conditions of 350 °C, 97 bar, and an H2 to biocrude ratio of 500 Nm3/m3. The same authors performed GCxGC-MS on HTL biocrude and its HT product, and qualitatively reported (i.e., based on peak area ratios) an increase of alkanes and cycloalkanes from about 10%–15% to more than 50%. Another important observation of this work regards the total acid number, which was reduced to zero after hydrotreating. These results prove the feasibility of HT of LC bio-oils at laboratory scale. Nevertheless, further work is needed on a larger scale to verify the process operability and economics, especially with respect to catalyst deactivation rates and fouling. The physical upgrading (separation) of LC bio-oils upstream of the HT unit may be a key factor to improve the HT operability on commercial catalysts on an industrial scale.

2.3.2. Production of Green Chemicals

Another perspective of valorization of LC bio-oils is the production of green chemicals. Pyrolysis oils contain some chemicals at relatively high mass fractions. Among them are acetic acid (up to 9 wt%) and acetol (up 8 wt%) [84]. Acetol is used as intermediate to produce polyols and acrolein [95], and acetic acid is an important chemical with a production exceeding 33 kt/day. Other chemicals with high mass fractions are glycolaldehyde (up to 6 wt%) and levoglucosan (up to 9 wt%) [68]. Even though it has no industrial application at this moment, levoglucosan has been identified as a potential building block for the chemical synthesis of high value-added pharmaceutical products [96,97,98,99]. Phenol is one of the most studied chemicals in LC bio-oils owing to its huge global demand, which has reached 27 kt/day in 2015 [100]. Phenol and its derivatives (e.g., guaiacol) can be used to produce resins and adhesives, as well as in the pharmaceuticals, food, or perfumery industries. Phenol mass fractions in LC bio-oils typically range from 0.1 wt% to 2 wt% [101], with values up to 5 wt% reported in the literature for pyrolysis oils from high-lignin content bio-mass [54]. High-value specialty chemicals are also found in LC bio-oils, albeit in low mass fractions. For example, vanillin, which is produced in majority by petroleum-derived guaiacol (approximately 85% of world production) [102], can be found in pyrolysis oils between 0.1 wt% and 1 wt% [43,54,84,101,103]. The production of vanillin in 2018 reached 100 t/day [104].
Recently, the antioxidant activity of bio-oil fractions has been studied for both pyrolysis and HTL oils derived by different biomasses [105,106,107,108]. Phenolic dimers and oligomers are suggested as the active antioxidant components, as monomers exhibited small to no antioxidant activity. The phenolic fractions were compared with commercial stabilizing agents (i.e., butylated hydroxytoluene, BHT) and showed identical or even better antioxidant activity in bio-diesel and bio-lubricants [106,107].

3. sCO2 Separation of Bio-Oils

3.1. sCO2 Basics

Carbon dioxide exists in a supercritical state at conditions that exceed 73.8 bar and 31 °C. The pressure–temperature (P–T) phase diagram of pure CO2, plotted from experimental data available in the literature [109,110,111], is shown in Figure 2. Even though CO2 is a low-density vapor at standard conditions (i.e., 0 °C and 1 bar), in the supercritical region, it can exhibit liquid-like densities while keeping relatively high diffusivities and low viscosities [112]. The presence of high-density regions, at pressures not exceedingly high, allow sCO2 to exhibit solvent power comparable to liquid solvents in pressure ranges where separation processes are feasible.
The density of CO2 at the critical point is approximately 468 kg/m3, while its viscosity is approximately 0.03 cP [109]. Within the supercritical region, the density varies widely depending on pressure and temperature. For example, for temperatures and pressures in the range of 35 to 150 °C and 75 to 400 bar, respectively, it varies between 105 kg/m3 and 973 kg/m3. Even at the highest densities, sCO2 exhibits viscosities remarkably lower than those of typical liquid solvents, such as hexane (i.e., approximately four times lower). In addition, in a broad area of the supercritical region, the density of sCO2 can be varied remarkably with relatively small variations of pressure and temperature. This aspect provides a high tunability of the solvent characteristics, namely solvent power and selectivity, on the basis of two degrees of freedom (i.e., pressure and temperature). This is a distinct advantage over conventional liquid solvents, where a single parameter (i.e., temperature) can be varied to alter the properties of the solvent.
Another interesting property of CO2 is that, even though it has zero dipole moment [113], it has a large quadrupole moment, which makes it a good solvent for both apolar and low polarity compounds [114]. In addition, sCO2 is non-toxic, not flammable, and widely available at low cost. Its use in renewable chemical production is likely to be neutral with respect to CO2 emissions into the atmosphere, as CO2 does not need to be produced on purpose, contrary to most petroleum-derived organic solvents. Moreover, it may even be speculated that a spread in utilization of sCO2 in industrial applications has the potential of a slight reduction of CO2 emissions, as its storages will increase in the growth period of the sCO2 technology. Furthermore, underground CO2 storage facilities might be utilized in combination with units employing sCO2 as a solvent for renewable production processes, thus taking advantage of the in situ presence of high-pressure CO2 and developing negative CO2-emission processes.
Typical process unit configurations include semi-continuous (i.e., batch) extraction, which can be performed either in a single stage extractor or a multi-stage column, and countercurrent continuous extraction [16,112,113,115]. In semi-continuous single-stage extractions (Figure 3a), the feed material is charged in a high-pressure extractor vessel and sCO2 is continuously delivered to the bottom of the extractor. The CO2-rich stream exits the vessel from the top and is expanded in a separator in order to release the extracted matter by reduction of the solubility, while the solute-free solvent is recompressed and recirculated. Alternatively, membranes or adsorbents can be used to separate the solutes from the sCO2 without depressurization. Such an example is the use of activated carbon in the supercritical decaffeination of coffee beans [116]. In the case of multi-stage semi-continuous operation (Figure 3b), a reflux loop is added, where part of the extract is refluxed at the top of the column. In this mode of operation, the feed is contacted with the ascending CO2-rich phase in a multiple-stage manner to achieve a better separation, compared with the single-stage operation [117]. The unextracted material (i.e., raffinate) remains in the vessel until the end of the batch extraction.
The continuous countercurrent operation involves continuous flow of the feed from an entry point at the top or at an intermediate point of an extraction column, while the sCO2 flows continuously from the bottom. Depending on the feed entry point, the extract is either continuously collected (Figure 4a) or partly recompressed and refluxed at the top of the column (Figure 4b). In both cases, the raffinate exits from the bottom. Another mode of operation for the reflux process is the use of a temperature gradient in the top section of the column (the enrichment section), which serves to induce a drop in solubility, producing an internal reflux. This mode of operation can be exploited in some sCO2-oil systems, depending on the P–T region, and is based on retrograde condensation phenomena [16,118].
A few industrial applications have been established to exploit the advantages of sCO2 as a solvent, which are mostly extractions from solid matter. Examples are coffee and tea decaffeination and the extraction of essential oils from plant feedstocks [113]. Such extractions from solid material are typically performed as batch semi-continuous operations by intermittently charging batches of the solid (e.g., coffee beans) and removing part of the spent materials from the bottom of the system without depressurizing (i.e., without shut down), while adding fresh material from the top [113]. A niche industrial application of sCO2 on liquid feeds is the fractionation of perfluoropolyethers, aimed at narrowing the molecular weight distribution of polymer fractions used as lubricants [17]. In addition, separation of many other oils proved feasible using sCO2 as a solvent. Such cases are the deterpenation of citrus oils [117,119], separation of fish oil ethyl esters [118,120,121], extraction of squalene from vegetable oils [16], and purification of frying oil [122,123]. These research works show the potential of continuous countercurrent systems for oily feeds. Literature studies on sCO2 extraction applications of crude oil mainly suggest the use of sCO2 for fractionation of heavy oils and bitumens, aimed at recovering a lighter extract, separating it from a heavy asphaltenic residue. The extracts show lower molecular weight, boiling point, and viscosity, thus being more easily conveyed to other refinery units, while the residue can be used for electricity production [124,125].

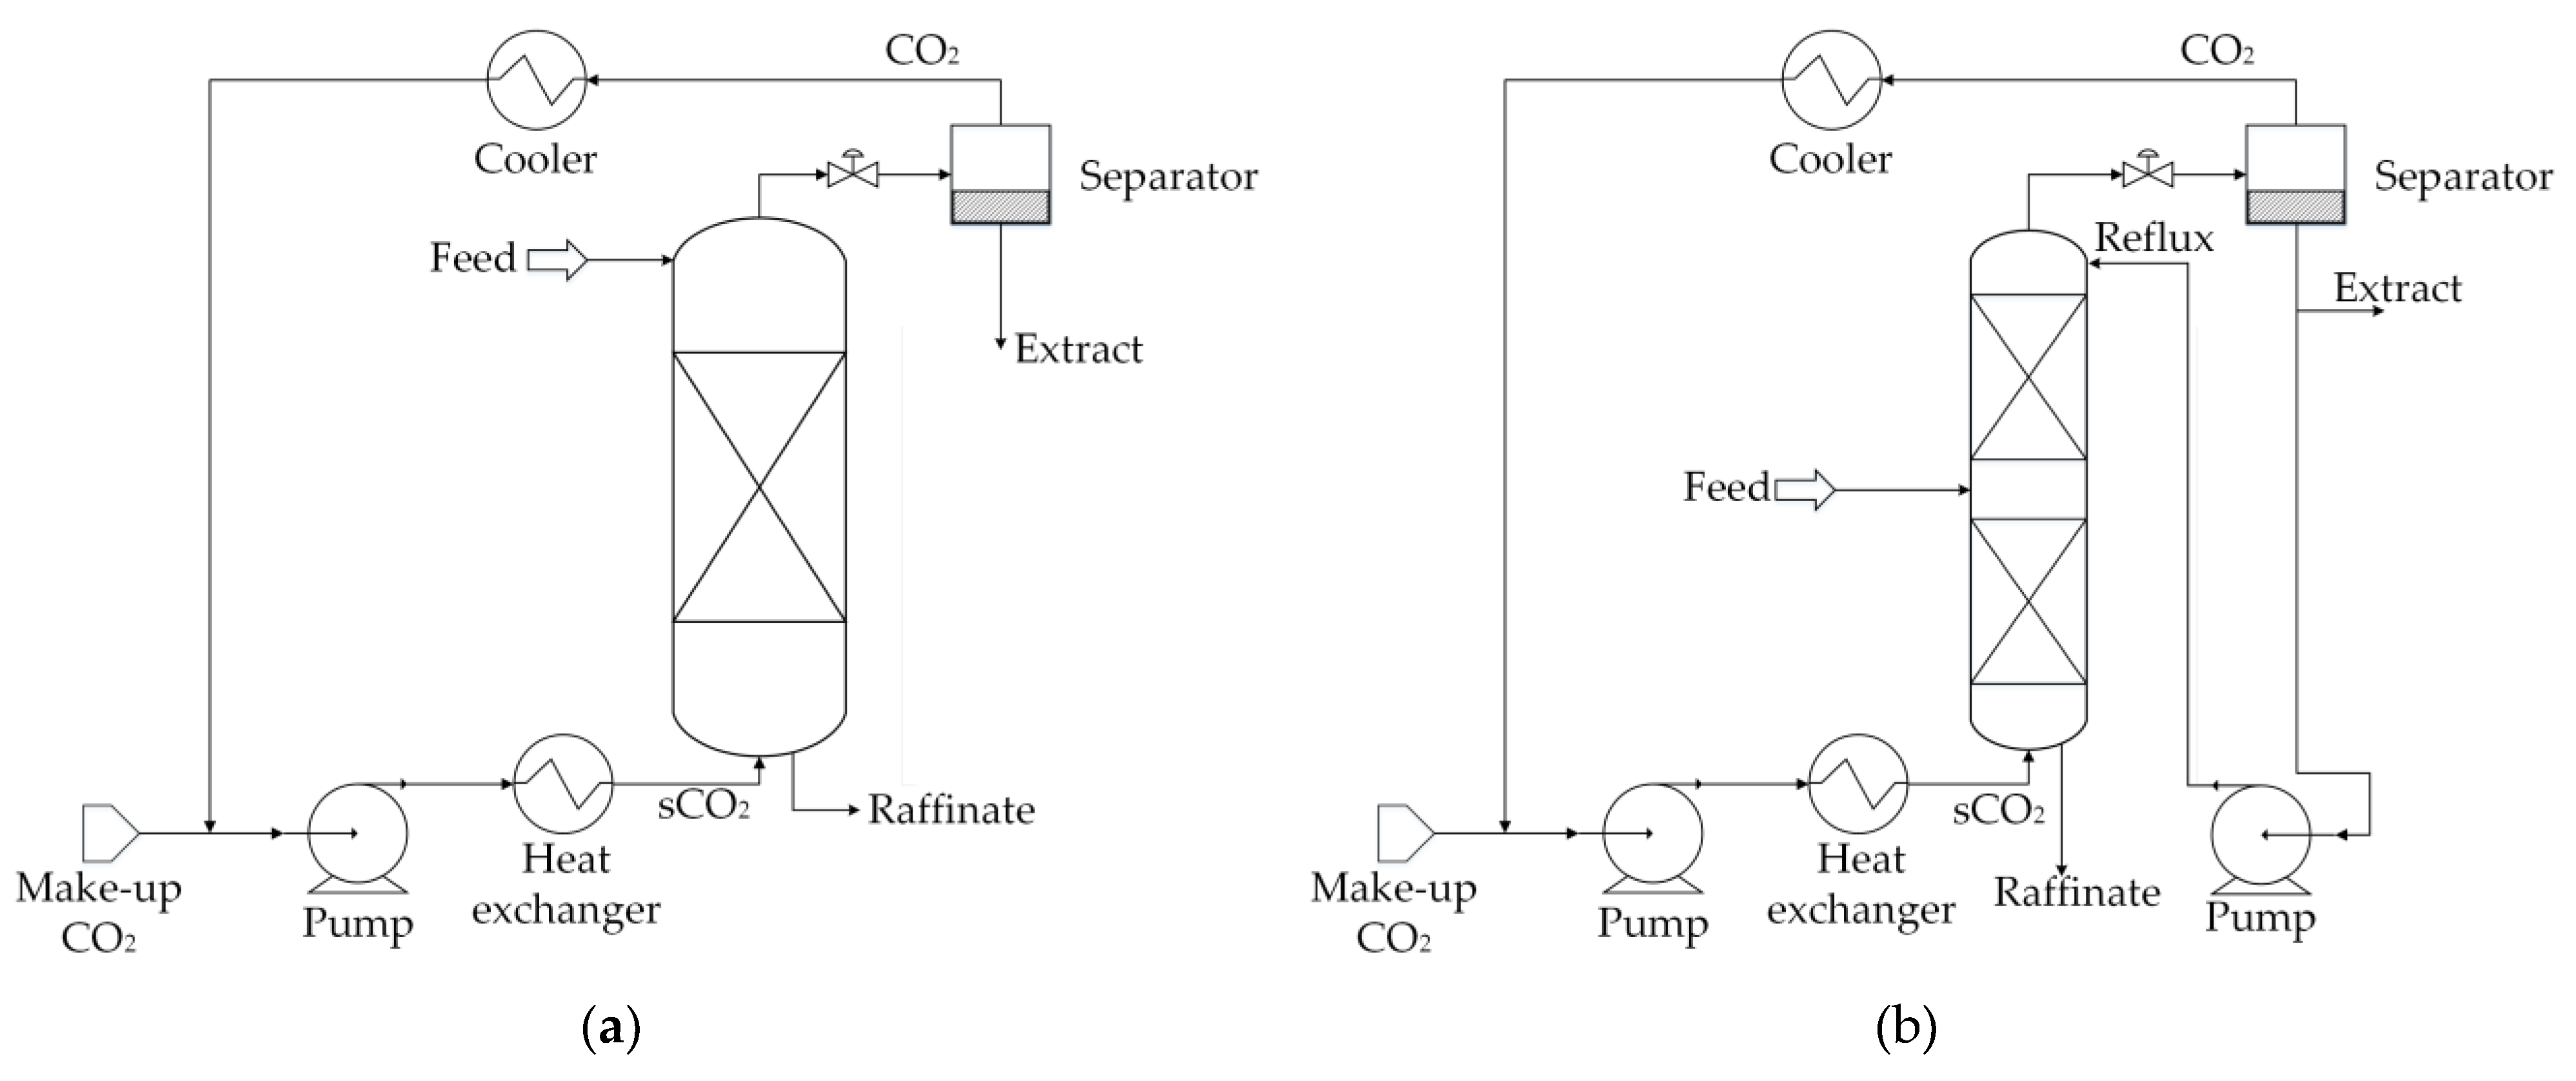
3.2. sCO2 Extraction of Lignocelulosic Bio-Oils

The majority of the literature studies on sCO2 separation of LC bio-oils refer to pyrolysis oils, with only a few cases referring to HTL biocrudes. Table 6 summarizes these works and their main aspects, regarding the nature of the biomass feedstock, the thermochemical conversion process producing the bio-oil, the system size, and the year of publication. All data so far are limited to laboratory-scale sCO2 extraction systems and the semi-continuous single-stage mode of operation, with the exception of Mudraboyina et al. [126], where the extractor was coupled with a rectification column with a temperature gradient, allowing an internal reflux operation. The data selection was delimited to literature referring to extraction of LC bio-oils obtained by phase separation (e.g., gravity settling) of the reaction products of the thermochemical process. In particular, this means that extraction of LC bio-oil species dissolved or dispersed in water or in organic solvents is not considered relevant in this context.
A generalized laboratory scale system is shown in Figure 5, which represents all literature studies except for Mudraboyina et al. [126], where the extractor was coupled with a rectification column. Such a typical system utilizes a CO2 cylinder for supplying the solvent. CO2 is subcooled via a heat exchanger and pumped as liquid to pressurize the vessel. CO2 can be supplied to the system by different types of positive displacement pumps such as pneumatic [64], syringe [126], and diaphragm [43]. In some cases, the pumped CO2 is preheated before entering the extractor [43,84,126,128,129,130]. The extraction vessel may contain an insert that can be dismounted for easy charging of the feed and retrieving the residue [64,127].
An inert packing material can be used to provide feed dispersion, thus increasing the contact area of CO2 and the feed. For this purpose, glass beads [64,103,127,128,133] can be used, or a porous media (e.g., silica, activated carbon) [43,84,130,131] on which the bio-oil can be adsorbed prior to the sCO2 extraction. In the latter case, some authors reported the introduction of effects that render the interpretation of the extraction results more complex. More specifically, Feng and Meier [43] reported different extraction yields between activated carbon and silica at the same extraction conditions, with the former achieving lower extraction yield than the latter at most extraction conditions, whereas the effect was inverted at 300 bar and 80 °C. However, the difference in these results is not adequate to provide a clear understanding of the effect of the two adsorbents. The potential of using experimental data that combine extraction and adsorption effects is limited in the perspective of scaling up the process to large-scale production, as the adsorbent use would raise issues for continuous operation. Exceptions would be presented only for batch separations aimed at extracting small quantities of high-value compounds, where solid–liquid interactions can be advantageously exploited.
With regard to practical aspects, the use of a non-return valve [64] at the bottom of the extraction vessel is advantageous in order to avoid back-flow of liquid feed and fouling of the upstream pipeline. This is particularly important for foulant residues that cannot be dissolved by pure sCO2 and are difficult to dissolve with most solvents, as is the case for LC bio-oils. The extraction vessel can be heated by a heating jacket [64], an oven [128], or a bath [126], in order to maintain a constant extraction temperature. An automatic or manual valve can be used downstream the extractor to control the flow rate of CO2. Downstream of the valve, the expanded fluid releases the components that are dissolved in sCO2, which are collected in a trapping system while CO2 gas is vented. This type of system is adequate for research purposes, although a potential industrial application would require separation of CO2 from the extracts and a solvent recycle loop.
The trapping system should be considered carefully and ensure adequate collection of the extracts. In this regard, it is particularly important to (i) ensure a low temperature to allow maximum condensation of the extracts dissolved in the CO2-rich phase (the gas phase); (ii) limit entrainment of liquid droplets and solid particles in the CO2 gas stream exiting the expansion valve; and (iii) ensure a smooth flow of viscous extracts downstream of the expansion valve until the collection container. Such a trapping system can consist of a series of elements (e.g., washing bottles) that serve to capture the condensed extract, followed by additional elements such as adsorbents (e.g., activated carbon) or absorbents (e.g., water) to reduce entrainment of fine droplets. The trap can be at ambient or freezing temperature. The latter can greatly improve the condensation as well as reduce evaporation of the collected condensed extracts exposed to CO2 flow during long extractions. This can be essential for pyrolysis oils that contain a large mass fraction of relatively low-boiling organic components (e.g., acetic acid) and water. The latest work of Feng and Meier [43] highlights this important detail, where the authors used several traps at ambient conditions, including cotton wool, activated carbon, and water, while reporting mass balance discrepancies at the range of 6 wt% to 14 wt%. The same range of losses was encountered during the extraction of HTL lignocellulosic bio-oil, albeit using a cold (approximately 5) trapping system, but no adsorbent [64,127]. Another consideration is the viscosity of the extract, which increases as the extraction progresses. This may lead to the requirement of heating the tube downstream of the expansion valve in order to improve the flow towards the trap.

3.3. Experimental Conditions, Extraction Yields, and Vapor Phase Loadings

Table 7 reports the operating parameters (i.e., extraction pressure (P) and temperature (T), initial mass of the feed (F), CO2 mass flow rate, and solvent-to-feed ratio (S/F)) and the outcome of the experiments of sCO2 extraction of LC bio-oils that were found in the literature. The outcome is reported in terms of total extraction yield (Y) and vapor phase loading (VPL). Y is the ratio of the total mass of extract to the mass of the feed. VPL is defined as the mass of extract retrieved for a given mass of sCO2 that flowed in the extraction vessel (i.e., the solute loaded in the solvent). It is typically expressed as g of extract per kg of sCO2 in a specific time interval. In addition, the density of pure sCO2 is reported, taken from the NIST database [109].
The temperature in the literature studies was in the range of 40 to 120 °C. The pressure was largely varied between 80 bar and 448 bar, with the aim of a wide range of solvent density (i.e., 221 to 961 kg/m3). However, only the studies of Chan et al. [128] and Montesantos et al. [58,64,127] explored pressures higher than 300 bar. CO2 flowrates used in these studies ranged from values much lower than 1 g/min up to 40 g/min, which, in some cases, resulted in very low extraction yields or very high solvent-to-feed ratios. Depending on the applied conditions, extraction yield values in the range 0.1 wt% to 48.9 wt% are reported using pure sCO2. Cheng et al. [131] achieved up to 71 wt% extraction yield with the use of up to 25 vol% of methanol as a co-solvent.
Regarding the effect of the extraction conditions, some important conclusions can be drawn. The increase of pressure at constant temperature is consistently reported as beneficial for extraction yields and vapor phase loadings. This is straightforwardly explained by the increase of the solvent power (i.e., increased solubility of bio-oil components in sCO2). The effect of temperature increase at constant pressure is more complex, as it leads to improved mass transfer, but it can also lead to reduced solubility. Feng and Meier [43], on pyrolysis oils, and Montesantos et al. [58,64], on HTL biocrudes, observed that a temperature increase at constant pressure generally increases Y and VPL, especially at high pressures (e.g., 300–400 bar). This indicates that, even though the increase of temperature is often associated with reduced solvent power, because of the decrease of solvent density, the enhanced mass transfer parameters improve the extraction rate and can improve Y and VPL of the process. In addition, Montesantos et al. [64] reported operational problems (i.e., sporadic clogging of the system) with HTL bio-oils at low temperatures. These problems were severe at 40 °C and moderate at 60 °C, while smooth operation was achieved at 80 °C and above.

3.4. Physical and Chemical Properties of sCO2 Extracts

sCO2 extracts exhibit lower viscosity and density compared with the bio-oil feed. Patel et al. [132] reported the kinematic viscosity of sugarcane bagasse pyrolysis oil sCO2 extracts and compared it with previously published viscosities of similar non-fractionated LC bio-oils [50]. The extracts, which accounted for only 9 wt%–15 wt% of the feed, exhibited a lower viscosity (i.e., approximately 18 cSt) than the crude bio-oil (approximately 28 cSt). It is important to note that, in an aging test of 60 days, the extracted oil showed greater stability with regard to viscosity, with an increase of only 4 cSt compared with approximately 22 cSt for the non-fractionated LC bio-oil.
Wang et al. [134] performed extraction of a corn stalk pyrolysis oil by a sequence of pressurization–depressurization steps (intermittent extraction), and reported that the density of the bio-oil (i.e., 1150 kg/m3) was reduced down to 952–980 kg/m3 for the extracts. Montesantos et al. [64] reported a reduction from 1051 kg/m3 down to 941–1017 kg/m3 for the extracts of HTL bio-oil from pinewood. Although the density reduction is moderate, from a fuel perspective, the sCO2 extracts exhibit densities in line with residual marine fuels, which are typically in the range of 920 to 1010 kg/m3 [135].
In the work of Montesantos et al. [64], TAN reductions from 129 mg KOH/g down to 61 to 120 mg KOH/g are reported for the sCO2 extracts, with the TAN values increasing with the extraction progression (i.e., over time). Carboxylic acids were sequentially extracted, with short chain fatty acids extracted at the earlier stages and long chain fatty acids at later stages of the extraction. In addition, the acidity of sCO2 residue shifted from carboxylic to phenolic nature, as the fatty acids were extracted preferentially with respect to more polar and heavier phenolic components.
Regarding water content, Feng and Meier [84] reported a reduction in both the extract and the residues for two fast pyrolysis oils. Even though this result clearly indicates the operational difficulties in collecting the extracted water in the trap, and thus the difficulties in closing the water mass balances, it also indicates that water is co-extracted. Therefore, sCO2 extraction can be used as a means for dewatering the LC bio-oil while fractionating it. In the work of Feng and Meier [84], the water content of the two feeds was 19 wt% and 43 wt%; for the extract, it ranged from 10 wt% to 13 wt% and 14 wt% to 19 wt%; and for the residues, it ranged from 6 wt% to 8 wt% and 10 wt% to 13 wt%, respectively. Reduction of water in the sCO2 extract of a HTL biocrude was observed by Montesantos et al. [58] as well, where the extracts were dewatered up to 77%, with respect to the initial water content.
Regarding metal content, in a recent work, Montesantos et al. [58] focused on the effect of sCO2 extraction on the removal of metals from HTL biocrude. The authors reported 95%–98% removal of metals (i.e., metal content reduced from 8500 mg/kg to lower than 200 mg/kg), which represents a significant improvement of the quality of the extracts, with respect to the feed biocrude, in light of the downstream hydrotreating. With regard to the elemental composition, the difference between sCO2 extracts and their respective feeds can be seen in Figure 6, where the H/C atomic ratio and the oxygen mass fractions on a water-free basis are compared. In the case of extracts, values corresponding to extractions at different pressure and temperature conditions on the same feed were averaged.
In most cases, the H/C ratio and oxygen mass fraction are not affected, or are moderately affected, by the extraction. In particular, the absence of significant variation of the oxygen content indicates that oxygen is widespread in many classes of molecules of different polarity and molecular weight, making it difficult to have a selective process in this regard. For an HTL biocrude, Montesantos et al. [58] reported a partial deoxygenation (i.e., oxygen mass fraction 0.10 down to 0.05–0.07). The oxygen reduction can be explained in terms of the increased VPL of alkylbenzenes and polyaromatic hydrocarbons, especially in the first extracts, in the presence of water in the biocrude (extraction of nondewatered bio-oil). The data from Naik et al. [103] and Rout et al. [133] appear to be strong outliers. In these works, a fast pyrolysis oil with an extremely high oxygen content is reported, which is higher than the oxygen content of the biomass feedstock. In addition, the majority of GC-MS identified components are oxygenated organic molecules, with a lower oxygen content than the oxygen reported by elemental analysis. All things considered, the data from Naik et al. [103] and Rout et al. [133] seem to show some inconsistencies.

3.5. Chemical Composition sCO2 Extracts

The components identified in the volatile fraction of sCO2 extracts of LC bio-oils can be generally grouped into the following chemical classes: (1) ketones; (2) phenols; (3) guaiacols; (4) benzenediols; (5) aldehydes; (6) esters; (7) furans; (8) syringols; (9) short chain fatty acids (SFAs); (10) long chain fatty acids (LFAs); (11) aromatic acids (ArAcid); (12) single-ring aromatic hydrocarbons (benzenes); and (13) polyaromatic hydrocarbons (PAHs). These classes, with indication of the key components reported in the literature, are presented in Table 8.
Most of these classes include low molecular weight components. Some chemical classes comprise components characterized by a narrow molecular weight range, whereas fatty acids [64] and esters [84], observed in HTL and pyrolysis oil extracts, respectively, are characterized by a wide range of molecular weight (see Table 5). The boiling point distribution in the extracts is in a wide range as well, from as low as 117 °C for acetic acid, reaching up to 400 °C for the high molecular weight fatty acids.
Most components are typically in low amounts in the sCO2 extracts (below 1 wt%) of both oils, with a few exceptions. In extracts of pyrolysis oils, short chain carboxylic acids, acetol, and glycolaldehyde are observed in large amounts; in some cases, as high as 20 wt% [43,84,130]. In addition, guaiacol, furfural, and syringol are reported with noteworthy mass fractions (1 wt%–5 wt%) in extracts of LC bio-oils of both pyrolysis and HTL. As a result of the concentration of these components, the sCO2 extracts exhibit a larger volatile fraction, with the fraction of the oil that can be identified by GC-MS being larger than the feed (e.g., up to 70 wt% [84]). On the other hand, levoglucosan (a sugar) present in pyrolysis oils (see Section 2.2.) is not extracted and remains entirely in the residue.
In an attempt of highlighting trends and providing some quantitative indication, values of distribution factors (K-values) were calculated from the available data reported in the literature. The calculated K-values are reported in Figure 7. using a box plot, covering the range of P, T, and composition corresponding to the experimental conditions. It should be noted that, as compositional information mostly refers to the lighter fraction of the bio-oil, most of the identified components are extracted preferentially, thus with K-values higher than 1.
As can be seen, guaiacols are among the most preferentially extracted components, with the highest median K-value (close to 4). Among other hydroxybenzenes, phenols, syringol, and benzenediols show descending K-values in the range of 2.8 down to 1.8. This is in line with the solubility predictions performed by Maqbool et al. [101], which show that guaiacols have the highest solubility in sCO2, followed by phenols and benzenediols. The lower K-values of benzenediols are connected with their higher polarity, owing to the presence of two hydroxyl groups. They were, however, observed to be extracted with yields up to 60 wt%, after the preferentially extracted components (e.g., guaiacols) were depleted in the feed [64]. Low molecular weight ketones and furans (see Table 8) are other classes of components preferentially extracted, with K-values close to 3. The extracted components of these classes show similar molecular weight and polarity. Glycolaldehyde is the only aldehyde found in a considerable amount in pyrolysis oils (up to 8 wt%), and has one of the lowest MWs of the reported components [43]. For this component, the available literature data do not allow calculating K-values, although it was reported by Feng and Meier [43] to be remarkably concentrated up to 16 wt%. Esters are typically not detected in the feeds, but low molecular weight esters (i.e., 100–130) were reported in a single case in the sCO2 extracts (up to 1.6 wt%), indicating high expected K-values [84].
With regard to the acids, most literature works report acetic and propionic acids, which are found in pyrolysis oil feed at high concentrations. Their K-values are typically above 2–3, which is in line with their low molecular weight. Montesantos et al. [58,64,127] identified several fatty acids ranging between C5 and C18, as well as two aromatic acids. As an example, Figure 8 shows the K-values of said acids in terms of extraction progression (extraction time increasing from left to right). All reported extractions were at 120 °C, but with different pressures (and thus different solvent densities). As can be seen, the short chain fatty acids (i.e., C5–C8, SFA) maintain high K-values for the whole duration of the extraction, which is in line with their relatively low MW. On the contrary, the long chain fatty acids (i.e., C6–C18, LFA) and the aromatic acids (i.e., dehydroabietic acid, ArAcid) initially exhibit K-values lower than 1 and, at the latest stages, they are extracted with K-values up to 8 and 4, respectively. This figure highlights the possibility of sequential extraction and fractionation of different acids on the basis of their molecular weight. From a theoretical standpoint, it also highlights the high dependency of K-values on the composition of the mixture, which reflects the strong thermodynamic non-ideality of the system sCO2 + bio-oil.
Finally, the only cases reporting the extraction of aromatic hydrocarbons are the works of Montesantos et al. [58,127] on an HTL biocrude. In these works, alkylbenzenes (e.g., o-cymene) exhibited the highest K-values (up to 6) and were extracted with yields up to 90 wt%. Polyaromatic hydrocarbons were the largest fraction of the extract (up to 23 wt%) and included some of the highest molecular weight components (e.g., retene). They exhibited increasing K-values with extraction progression, as the lower MW components were depleted from the feed, achieving extraction yields up to 83 wt%. The possibility of extracting these components is in line with the known capability of sCO2 of extracting hydrocarbons, even at a very high molecular weight.

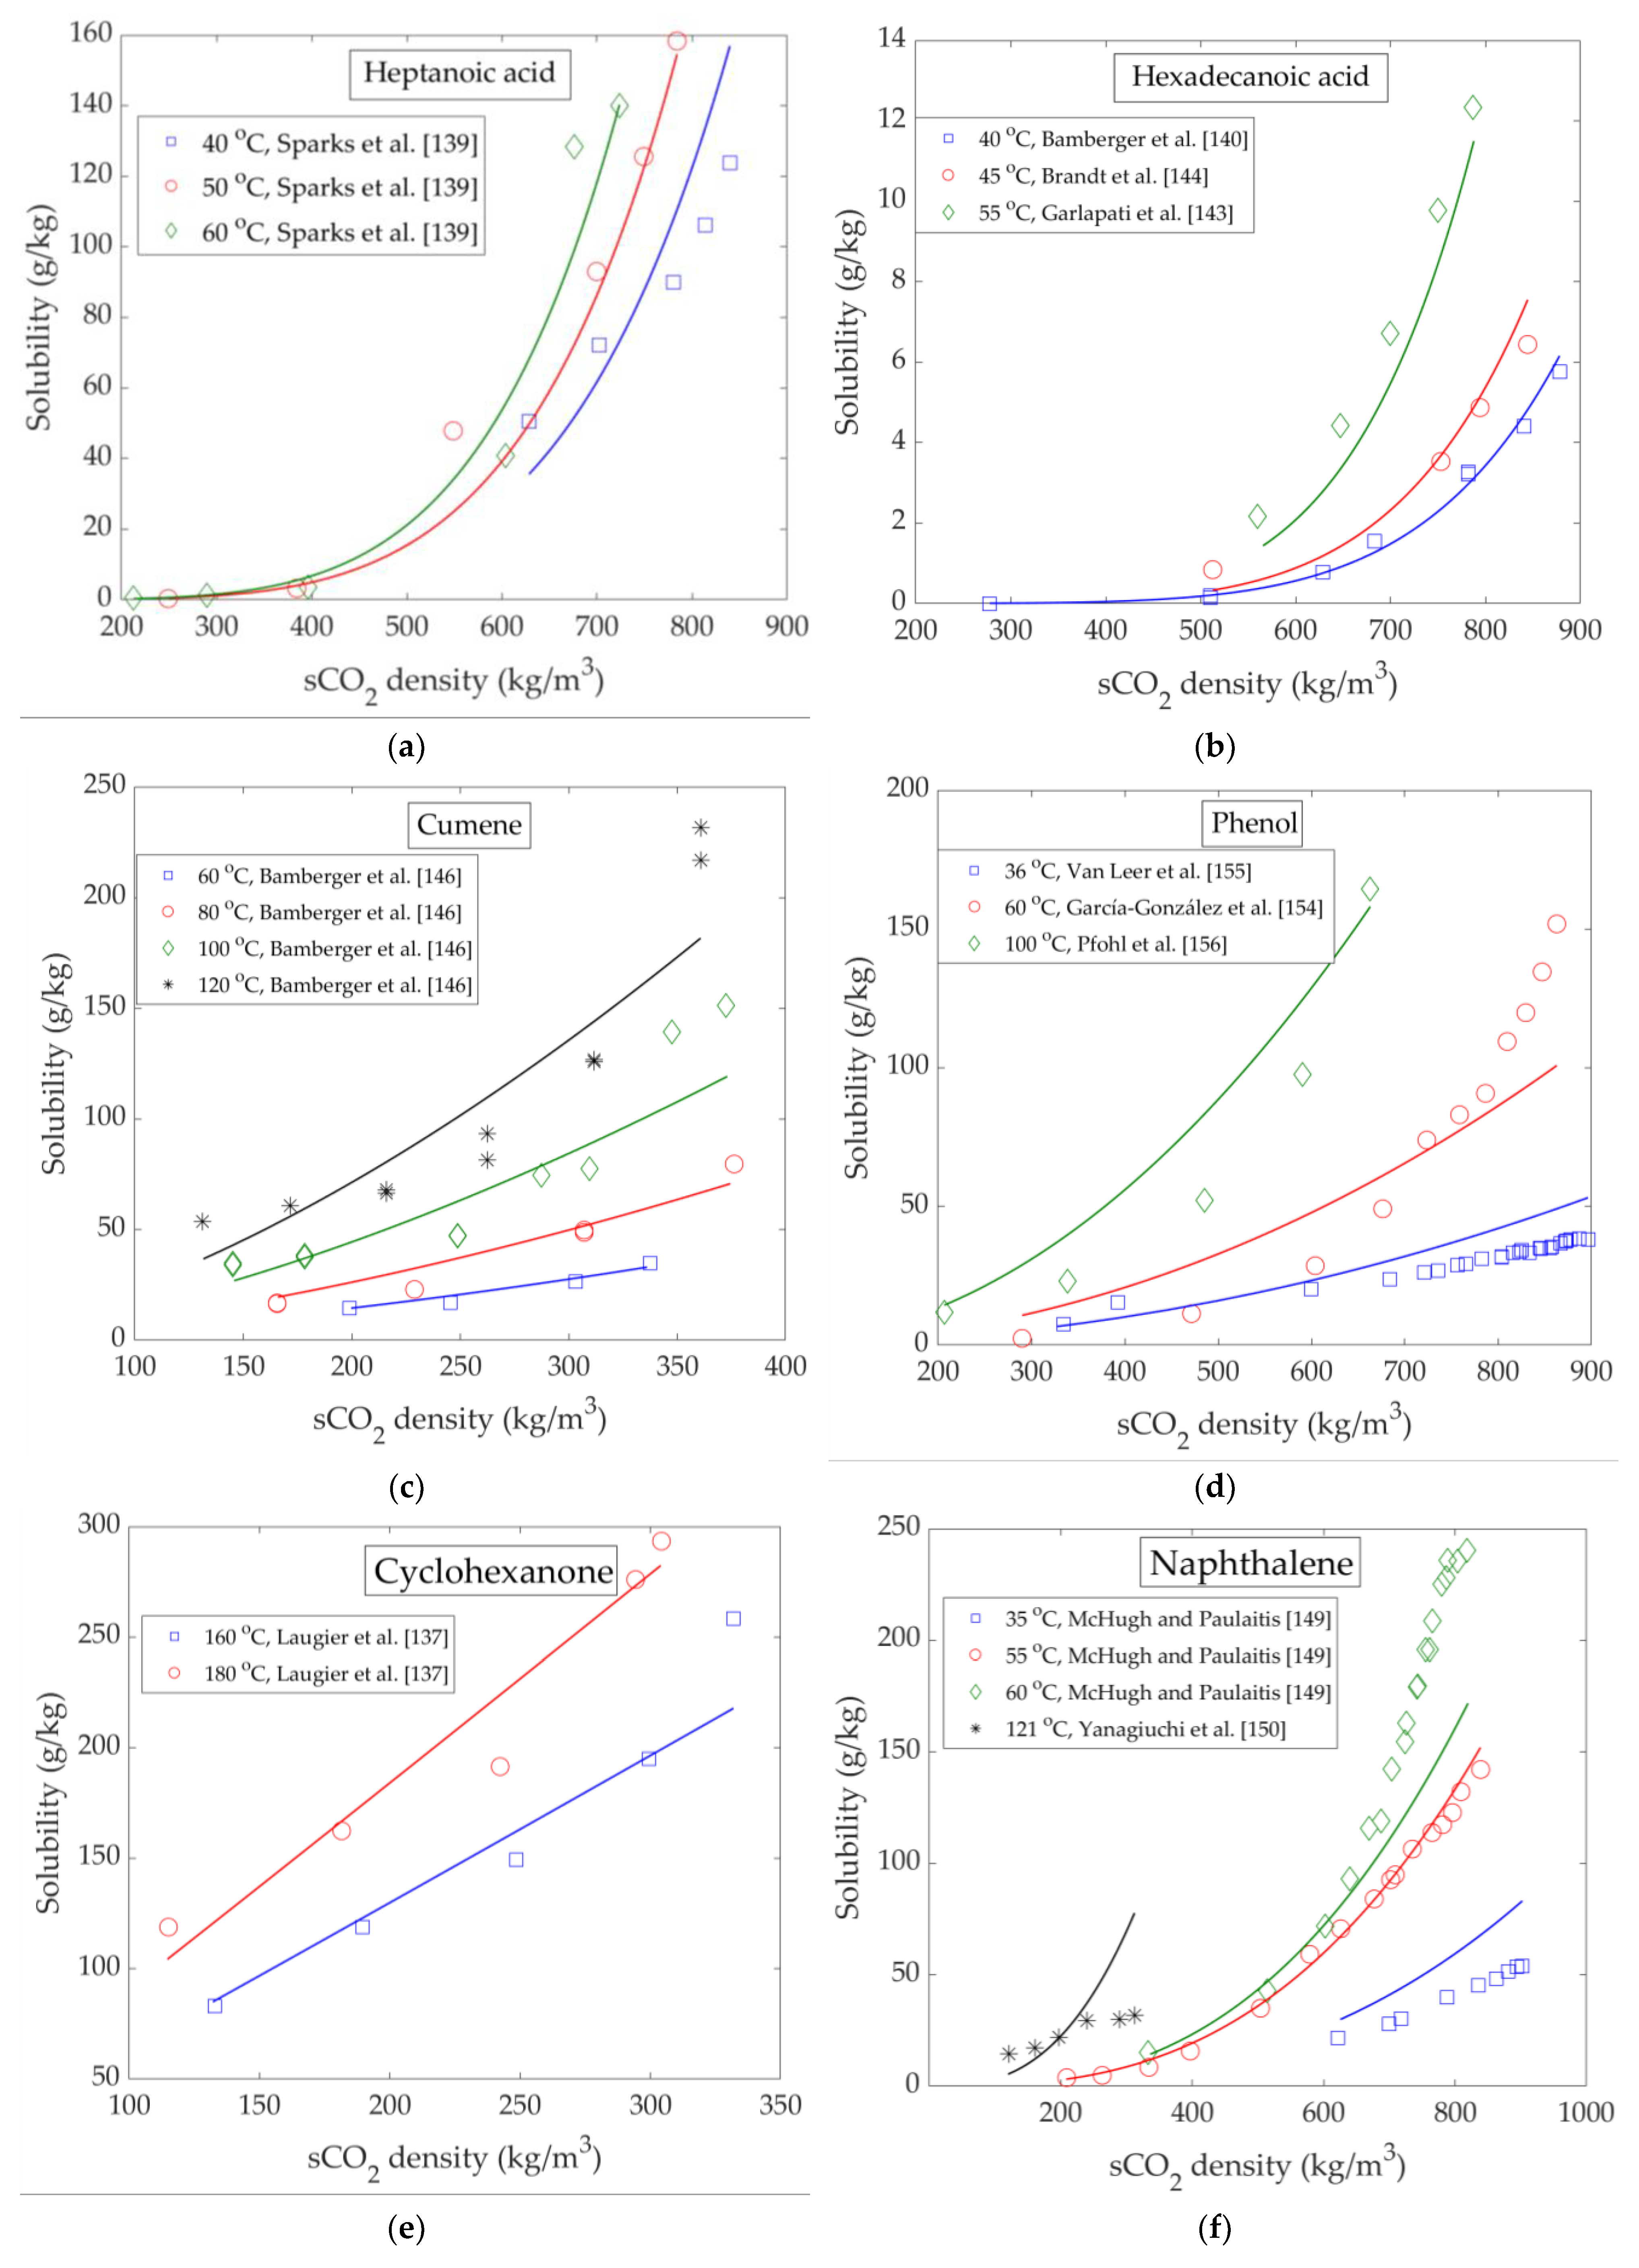
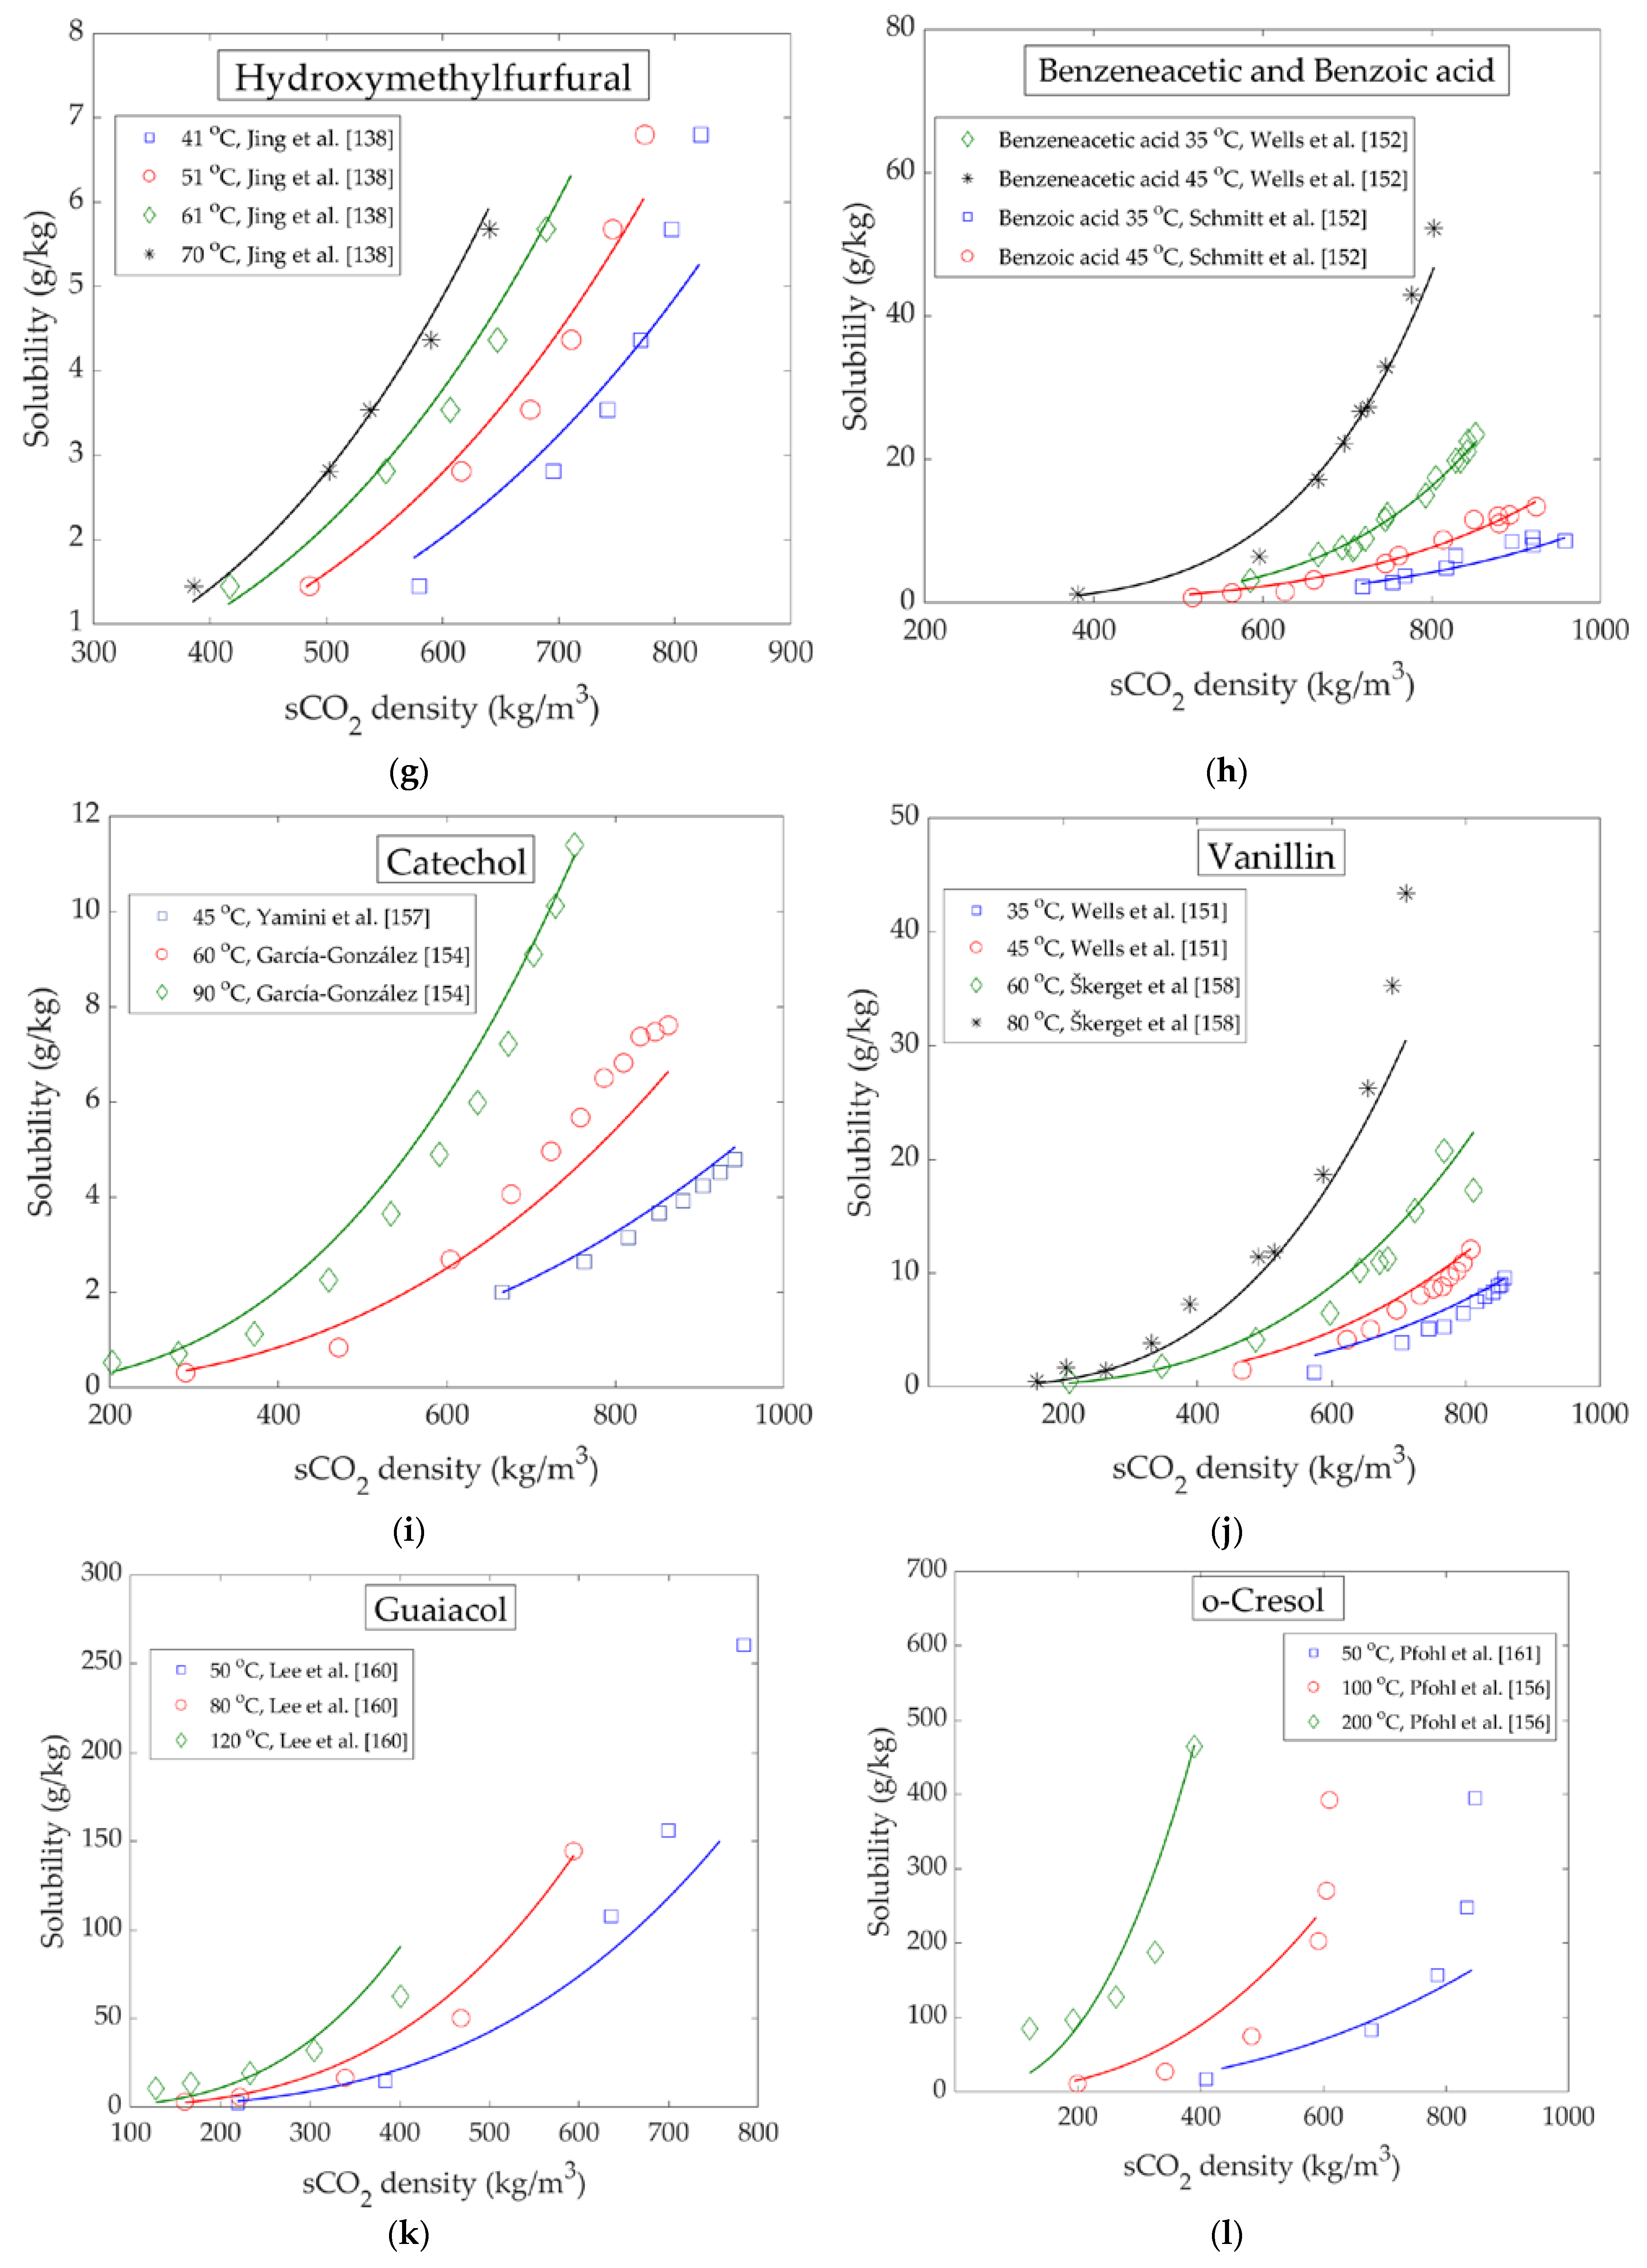
4. High Pressure Solubility Data and Modelling

The process design of sCO2 extraction and downstream separation of LC bio-oils requires the development of suitable thermodynamic models (e.g., based on cubic equations of state) in order to estimate the K-values of the different species to be separated, for a given pressure, temperature, and overall composition of the system. In turn, the development of such models for complex mixtures as LC bio-oils requires strategies of lumping bio-oil components into classes, defining thermodynamic properties (e.g., critical properties and acentric factors) for each class of components, as well as collecting experimental data of high-pressure phase equilibrium of sCO2 and selected class-representative components. Experimental data are used for model validation and model tuning by estimation of optimal values of binary interaction parameters. This procedure is analogous to what has been developed for decades for petroleum reservoir fluids, also in relation to sCO2 injection studies [136]. However, crude LC bio-oils (i.e., prior to hydrotreating) are drastically different from fossil crude oils, with a large amount of oxygen and polar components spread in the entire molecular weight range, which leads to notes of complexity in the definition of optimal lumping strategies. In addition, literature data on high-pressure phase equilibria for sCO2 and key components of LC bio-oils are very scarce. The fact that a large fraction of LC bio-oils is not fully characterized adds to this complexity.
The available solubility data of key components of LC bio-oils in the sCO2-rich phase are correlated with the semi-empirical density-based model of Chrastil [137]. This procedure proved satisfactory for systems composed of sCO2 and bio-oil components by Maqbool et al. [101] and, in this work, it is substantially extended to a larger number of components and chemical classes. The equation suggested by Chrastil takes the following form:
S = ρ k exp ( a T + b )
where:
  • S : solubility of the solute in the sCO2-rich phase (grams of solute per liters of pure solvent at the P, T conditions of interest);
  • ρ : density of the pure solvent (g/L) at the P, T conditions of interest;
  • k : association number (i.e., number of CO2 molecules associated with one solute molecule);
  • a: constant connected to the enthalpy of solvation and vaporization;
  • T : temperature (K);
  • b : constant connected to the molecular weights of the solvent and the solute.
The basic assumption of the Chrastil model is that a molecule of the solute is associated with a fixed number (k) of solvent molecules at a given temperature. The correlation proved successful for many components dissolved in sCO2 corresponding to or having a similar structure to species found in LC bio-oils (e.g., phenol, naphthalene, octadecenoic acid [101,137]). In addition, it proved successful in a wide range of pressures and temperatures, provided that the solubility of the solute is not too high (typically solubility S not above 200 g/L) [137]. Considering that the VPLs of LC bio-oils, in the range of operating conditions of interest (see Section 3), are typically below 100 g/kg, the Chrastil model is expected to be a valid tool for correlation and data analysis.

Binary Phase Equilibrium Data of LC Bio-Oil Components and sCO2

Table 9 reports a summary of the binary phase equilibrium data available in the literature, with reference to relevant components of LC bio-oils and sCO2. For each publication, the component is specified, together with the pressure and temperature range of the measurements, as well as the corresponding density of pure sCO2. The method of measurement is reported as analytical or synthetic, corresponding to the classification introduced by Dohrn and Brunner [138]. In short, the analytical method indicates that sampling and consequent analysis of the phases were performed, whereas in the synthetic method, bubble or dew point pressures are determined at given temperatures and overall compositions. With regard to the type of data, the symbol VLE indicates that both the solubility of the bio-oil components in the sCO2-rich phase and the solubility of CO2 in the liquid phase are reported. When “solubility” is indicated, the solubility of the bio-oil component in the sCO2-rich phase is the only type of data reported. The complete solubility data can be found in the Supporting Information (Table S1). Table S1 collects all numerical data that are reported by the listed publications at supercritical sCO2 conditions.
The components reported in Table 9 are chosen to represent the chemical classes indicated in Table 8, taking into account the availability of phase equilibrium data in the literature. All data retrieved in the literature were included in the analysis, with the exception of a few data sets concerning hexadecanoic acid and naphthalene. With regard to the former, six works were selected owing to the fact they show consistent data at the same P and T conditions, besides being based on high purity solutes and sound methodology. With regard to naphthalene, several literature sources exist. In this case, the work of McHugh and Paulaitis [151] was selected as their data are often used as reference by other works. In addition, the data reported by Yanagiuchi et al. [152] were chosen because they report data at high temperatures, as opposed to the typical range of 35–80 °C for all other published works.
Solubility data of LC bio-oil components in the sCO2-rich phase were correlated using the linearized form of the Chrastil equation:
ln ( S ) = k l n ( ρ ) + ( a T + b )
Equation (2) was thus used for performing a multiple linear regression analysis of the experimental data reported in Table 9, referring to the sCO2-rich phase. The density of pure CO2 is taken from the NIST webbook, whose data are based on the Span–Wagner equation of state [109]. The set of optimal values for the parameters k, a, and b is reported for each component in Table 10, together with the regression statistics.
For most data, the linearity is good, with R2 values above 0.92. Exceptions are the values for phenol and o-cresol. For the latter, it is because of several solubility values being above 100–200 g/L. In this case, the density of the mixture starts departing from the solvent density and the model becomes less accurate [137]. In all cases, the average relative deviation between the calculated and experimental values is between 2% and 21%. The association value k is generally in line with available literature values [101,137,140,143]. It is observed that phenolics have values between 3 and 4, which is in line with the values reported by Maqbool et al. [101], even though the datasets are substantially expanded in this work. Cumene (1-ring aromatic hydrocarbon) exhibits one of the lowest k (i.e., 2.6), while naphthalene exhibits a higher value (i.e., 3.8), which is in line with its higher molecular size. Fatty acids have higher values, increasing with the molecular size as well.
Experimental solubilities of LC bio-oil components in the sCO2-rich phase, expressed as grams of solute per kg of solvent, are plotted in Figure 9 as a function of the sCO2 density for different temperatures. In the same figure, isotherms predicted by the Chrastil model are shown (continuous lines) for the corresponding values of temperature and solvent density. When more than one data source for the same experimental temperature exists, the one with the largest solvent density range was plotted.
In Figure 9, the effect of density and temperature can be appreciated. It is noted that increasing the solvent density at a given temperature corresponds to increasing pressures. As expected, the solubility increases with the solvent density for all isotherms. In addition, in all cases, higher temperatures at constant density conditions (i.e., increasing pressure) result in higher solubilities.
These trends are in line with VPL values of sCO2 extraction of LC bio-oils discussed in Section 3.3. A good example of the effect of temperature is vanillin, whose solubility at 80 °C increases considerably with the increasing solvent density, while at the lower temperatures, the increase is much less significant.
The solubility of sCO2 in the liquid phase is provided only in a few cases. The available data show that sCO2 exhibits high solubility in liquid hydrocarbons. For example, the solubility of sCO2 in cumene ranges from 165 to 586 g/kg at 120 °C [148]. At the same temperature, naphthalene can dissolve 100–303 g/kg of CO2 for pressure ranging from approximately 80 to 160 bar [152] CO2. For the system sCO2 + cyclohexanone, at the relatively high temperatures reported (i.e., 160 °C and 180 °C), CO2 solubilities range from 146 to 555 g/kg [139]. A relatively large amount of CO2 is dissolved in hexadecanoic acid as well, with the range being from 244 to 415 g/kg [147]. The solubility of CO2 in phenolic components follows the trend cresols and guaiacol > phenol > vanillin [158,159,160,161,162,163,164]. In all cases, however, values above 380 g/kg were reported at the higher pressures (200–300 bar), with the exception of vanillin, where such high values were only reached at extremely high pressures (i.e., 762–1357 bar) [161]. In general, the data show that a large amount of sCO2 can be dissolved in this type of liquid components. This is a favorable property for the separation of LC bio-oils in countercurrent equipment, as the dissolution of the supercritical solvent in the liquid causes the viscosity to drop, thus improving process operability.

5. Conclusions and Perspectives

The current work reviews the state-of-the-art on sCO2 extraction of second-generation lignocellulosic bio-oils, produced by pyrolysis or hydrothermal liquefaction. sCO2 extraction is deemed a promising physical separation process that can be integrated in the downstream of the thermochemical conversion unit with the aim of valorizing the raw bio-oils. Two main application areas are envisaged: (1) high yield extraction of HTL biocrudes for drop in bio-fuel production; (2) extraction of specific chemicals from pyrolysis oils.
In the case of HTL biocrudes, the application of sCO2 allows extraction yields above 50%, with the production of extracts with favorable properties towards hydrotreatment. Namely, extracts have lower water content, lower average molecular weight, lower density, viscosity, and acidity, with the acidity nature shifted towards carboxylic instead of phenolic. In addition, the metal content of sCO2 extracts is drastically reduced, from the very high values of HTL biocrudes (e.g., 8500 mg/kg) to values below 200 mg/kg, as metals are left in the residue of the sCO2 extraction processes [58]. These properties are expected to lead to a lower deactivation rate of the hydrotreatment catalyst and reduced coking and fouling, overall leading to better process operability and economics. Moreover, the hydrotreatment products are expected to be shifted towards lighter hydrocarbon fractions, which are more valuable. On the other hand, the oxygen content of the extracts is comparable to that of the feed, or only moderately decreased, which means that significantly lower hydrogen requirements (per unit hydrotreatment feed) are not expected. However, this aspect is comparable to the experimental findings of vacuum distillation of HTL bio-oils, which also reported oxygen to be widespread in the whole range of distilled fractions. In this context, experimental works focusing on the comparison of hydrotreating of raw HTL biocrudes versus sCO2 extracts is an important knowledge gap. Future research work is needed in this area.
In the case of pyrolysis oils, sCO2 can be used for the recovery of fractions rich in short chain organic acids, such as acetic and propionic acids, short chain fatty acids, acetol, and furfural, owing to their relative abundance in this type of oil. The recovery of fractions rich in 1-ring lignin-derived phenolics (phenols and guaiacols) and their separation from benzenediols and long chain fatty acids is also deemed feasible on the basis of K-value analysis. High value chemicals like vanillin can also be recovered and made available for downstream purification. On the other hand, the sCO2 residue of pyrolysis oil is concentrated in sugars and might have the potential to be fed to other biorefinery processes such as anaerobic digestion. In the case of pyrolysis oils, the use of sCO2 for the downstream separation of the extracted components into several classes is a topic requiring further research in order to provide basic process schemes that can be evaluated in terms of process economics.
For both types of oils, the knowledge of the heavy fraction is scarce. Further studies addressing this aspect would be needed, in order to envisage possible utilizations of the residue, other than burning it for heat recovery. For example, it may have similarities with biochar and hydrochar, and can provide the base material for the production of adsorbents [165]. Phenolic oligomers from bio-oils were suggested as potential fuel antioxidants [105,107,108]. As sCO2 extracts preferentially phenolic monomers, the residue is expected to be enriched in these components. The possibility of recovering this fraction using sCO2, as pure solvent or with the use of small quantities of modifiers (e.g., ethanol, propanol), is another area of research to be developed.
As the natural competitor of sCO2 extraction on LC bio-oils is vacuum distillation, experimental works aimed at comparing the two processes would be relevant to assess the advantages and drawbacks of the two processes in terms of yields and selectivity, as well as energy requirements for continuous countercurrent processing at a large scale.

Supplementary Materials

The following are available online at https://www.mdpi.com/1996-1073/13/7/1600/s1, Literature solubility of bio-oil components in sCO2, Table S1.

Author Contributions

Conceptualization, N.M. and M.M.; methodology, N.M. and M.M.; writing—original draft preparation, N.M.; writing—review and editing, N.M. and M.M; Data Curation N.M.; Formal Analysis: N.M. and M.M.; Investigation: N.M. and M.M.; Visualization: N.M.; supervision, M.M. All authors have read and agreed to the published version of the manuscript.

Funding

This research received no external funding.

Conflicts of Interest

The authors declare no conflict of interest.

References

  1. International Energy Outlook 2019. Available online: https://www.eia.gov/outlooks/ieo/ (accessed on 17 December 2019).
  2. IEA. World Energy Statistics 2019. IEA: Paris, France, 2019. Available online: https://www.iea.org/reports/world-energy-statistics-2019 (accessed on 1 September 2019).
  3. Kosinkova, J.; Doshi, A.; Maire, J.; Ristovski, Z.; Brown, R.; Rainey, T.J. Measuring the regional availability of biomass for biofuels and the potential for microalgae. Renew. Sustain. Energy Rev. 2015, 49, 1271–1285. [Google Scholar] [CrossRef] [Green Version]
  4. US Environmental Protection Agency. Biofuels and the Environment: Second Triennial Report to Congress; US Environmental Protection Agency: Washington, DC, USA, 2018.
  5. IEA Renewables 2019. Available online: https://www.iea.org/reports/renewables-2019 (accessed on 17 December 2019).
  6. Baloch, H.A.; Nizamuddin, S.; Siddiqui, M.T.H.; Riaz, S.; Jatoi, A.S.; Dumbre, D.K.; Mubarak, N.M.; Srinivasan, M.P.; Griffin, G.J. Recent advances in production and upgrading of bio-oil from biomass: A critical overview. J. Environ. Chem. Eng. 2018, 6, 5101–5118. [Google Scholar] [CrossRef]
  7. Ramirez, J.A.; Brown, R.J.; Rainey, T.J. A review of hydrothermal liquefaction bio-crude properties and prospects for upgrading to transportation fuels. Energies 2015, 8, 6765–6794. [Google Scholar] [CrossRef] [Green Version]
  8. Bridgwater, A.V. Review of fast pyrolysis of biomass and product upgrading. Biomass Bioenergy 2012, 38, 68–94. [Google Scholar] [CrossRef]
  9. Hoffmann, J.; Jensen, C.U.; Rosendahl, L.A. Co-processing potential of HTL bio-crude at petroleum refineries-Part 1: Fractional distillation and characterization. Fuel 2016, 165, 526–535. [Google Scholar] [CrossRef]
  10. Pedersen, T.H.; Jensen, C.U.; Sandström, L.; Rosendahl, L.A. Full characterization of compounds obtained from fractional distillation and upgrading of a HTL biocrude. Appl. Energy 2017, 202, 408–419. [Google Scholar] [CrossRef] [Green Version]
  11. Elkasabi, Y.; Mullen, C.A.; Boateng, A.A. Distillation and isolation of commodity chemicals from bio-oil made by tail-gas reactive pyrolysis. ACS Sustain. Chem. Eng. 2014, 2, 2042–2052. [Google Scholar] [CrossRef]
  12. Capunitan, J.A.; Capareda, S.C. Characterization and separation of corn stover bio-oil by fractional distillation. Fuel 2013, 112, 60–73. [Google Scholar] [CrossRef]
  13. Taghipour, A.; Ramirez, J.A.; Brown, R.J.; Rainey, T.J. A review of fractional distillation to improve hydrothermal liquefaction biocrude characteristics; future outlook and prospects. Renew. Sustain. Energy Rev. 2019, 115, 109355. [Google Scholar] [CrossRef]
  14. Hu, H.S.; Wu, Y.L.; Yang, M.D. Fractionation of bio-oil produced from hydrothermal liquefaction of microalgae by liquid-liquid extraction. Biomass Bioenergy 2018, 108, 487–500. [Google Scholar] [CrossRef]
  15. Bjelić, S.; Yu, J.; Iversen, B.B.; Glasius, M.; Biller, P. Detailed investigation into the asphaltene fraction of hydrothermal liquefaction derived bio-crude and hydrotreated bio-crudes. Energy and Fuels 2018, 32, 3579–3587. [Google Scholar] [CrossRef]
  16. Brunner, G. Counter-current separations. J. Supercrit. Fluids 2009, 47, 574–582. [Google Scholar] [CrossRef]
  17. Nielsen, R.P.; Valsecchi, R.; Strandgaard, M.; Maschietti, M. Experimental study on fluid phase equilibria of hydroxyl-terminated perfluoropolyether oligomers and supercritical carbon dioxide. J. Supercrit. Fluids 2015, 101, 124–130. [Google Scholar] [CrossRef]
  18. Speight, J.G. Nonthermal methods of recovery. In Enhanced Recovery Methods for Heavy Oil and Tar Sands; Elsevier: Austin, TX, USA, 2009; pp. 185–220. ISBN 9780127999883. [Google Scholar]
  19. Kummamuru, B. Global Bioenergy Statistics; World Bioenergy Association: Stockholm, Sweden, 2017. [Google Scholar]
  20. Mateo-Sagasta, J.; Raschid-Sally, L.; Thebo, A. Global Wastewater and Sludge Production, Treatment and Use. In Wastewater: Economic Asset in an Urbanizing World; Drechsel, P., Qadir, M., Wichelns, D., Eds.; Springer: Dordrecht, The Netherlands, 2015; pp. 15–38. ISBN 978-94-017-9545-6. [Google Scholar]
  21. Lignin Products Global Market Size, Sales Data 2017-2022 & Applications in Animal Feed Industry. Available online: https://www.orbisresearch.com/contacts/request-sample/218258 (accessed on 13 May 2019).
  22. Tian, X.; Fang, Z.; Smith, R.L.; Wu, Z.; Liu, M. Properties, chemical characteristics and application of lignin and its derivatives. In Production of Biofuels and Chemicals from Lignin; Fang, Z., Smith, R.L., Jr., Eds.; Springer: Singapore, 2016; pp. 3–33. ISBN 978-981-10-1965-4. [Google Scholar]
  23. Zakzeski, J.; Bruijnincx, P.C.A.; Jongerius, A.L.; Weckhuysen, B.M. The catalytic valorization of lignin for the production of renewable chemicals. Chem. Rev. 2010, 110, 3552–3599. [Google Scholar] [CrossRef]
  24. Miliotti, E.; Dell’Orco, S.; Lotti, G.; Rizzo, A.M.; Rosi, L.; Chiaramonti, D. Lignocellulosic ethanol biorefinery: Valorization of lignin-rich stream through hydrothermal liquefaction. Energies 2019, 12, 723. [Google Scholar] [CrossRef] [Green Version]
  25. Sumathi, S.; Chai, S.P.; Mohamed, A.R. Utilization of oil palm as a source of renewable energy in Malaysia. Renew. Sustain. Energy Rev. 2008, 12, 2404–2421. [Google Scholar] [CrossRef]
  26. ECN.TNO Phyllis2, Database for Biomass and Waste. Available online: https://phyllis.nl/ (accessed on 18 November 2019).
  27. Oasmaa, A.; Van De Beld, B.; Saari, P.; Elliott, D.C.; Solantausta, Y. Norms, standards, and legislation for fast pyrolysis bio-oils from lignocellulosic biomass. Energy Fuels 2015, 29, 2471–2484. [Google Scholar] [CrossRef]
  28. Nguyen, T.D.H.; Maschietti, M.; Åmand, L.E.; Vamling, L.; Olausson, L.; Andersson, S.I.; Theliander, H. The effect of temperature on the catalytic conversion of Kraft lignin using near-critical water. Bioresour. Technol. 2014, 170, 196–203. [Google Scholar] [CrossRef] [Green Version]
  29. Feng, S.; Yuan, Z.; Leitch, M.; Xu, C.C. Hydrothermal liquefaction of barks into bio-crude - Effects of species and ash content/composition. Fuel 2014, 116, 214–220. [Google Scholar] [CrossRef]
  30. Haarlemmer, G.; Guizani, C.; Anouti, S.; Déniel, M.; Roubaud, A.; Valin, S. Analysis and comparison of bio-oils obtained by hydrothermal liquefaction and fast pyrolysis of beech wood. Fuel 2016, 174, 180–188. [Google Scholar] [CrossRef]
  31. Chen, Y.; Cao, X.; Zhu, S.; Tian, F.; Xu, Y.; Zhu, C.; Dong, L. Synergistic hydrothermal liquefaction of wheat stalk with homogeneous and heterogeneous catalyst at low temperature. Bioresour. Technol. 2019, 278, 92–98. [Google Scholar] [CrossRef]
  32. Baloch, H.A.; Nizamuddin, S.; Siddiqui, M.T.H.; Mubarak, N.M.; Dumbre, D.K.; Srinivasan, M.P.; Griffin, G.J. Sub-supercritical liquefaction of sugarcane bagasse for production of bio-oil and char: Effect of two solvents. J. Environ. Chem. Eng. 2018, 6, 6589–6601. [Google Scholar] [CrossRef]
  33. Castello, D.; Pedersen, T.; Rosendahl, L. Continuous hydrothermal liquefaction of biomass: A critical review. Energies 2018, 11, 3165. [Google Scholar] [CrossRef] [Green Version]
  34. BTG-BTL Empyro Project. Available online: https://www.btg-btl.com/en/company/projects/empyro (accessed on 22 October 2019).
  35. Ensyn Côte-Nord. Available online: http://www.ensyn.com/quebec.html (accessed on 22 October 2019).
  36. Silva Green Fuel. Available online: https://www.statkraft.com/about-statkraft/Projects/norway/value-creation-tofte/silva-green-fuel/ (accessed on 22 October 2019).
  37. Elliott, D.C.; Oasmaa, A.; Meier, D.; Preto, F.; Bridgwater, A.V. Results of the IEA round robin on viscosity and aging of fast pyrolysis bio-oils: Long-Term tests and repeatability. Energy Fuels 2012, 26, 7362–7366. [Google Scholar] [CrossRef]
  38. Ong, B.H.Y.; Walmsley, T.G.; Atkins, M.J.; Walmsley, M.R.W. Hydrothermal liquefaction of Radiata Pine with Kraft black liquor for integrated biofuel production. J. Clean. Prod. 2018, 199, 737–750. [Google Scholar] [CrossRef]
  39. Jarvis, J.M.; Albrecht, K.O.; Billing, J.M.; Schmidt, A.J.; Hallen, R.T.; Schaub, T.M. Assessment of hydrotreatment for hydrothermal liquefaction biocrudes from sewage sludge, microalgae, and pine feedstocks. Energy Fuels 2018, 32, 8483–8493. [Google Scholar] [CrossRef]
  40. Belkheiri, T.; Andersson, S.I.; Mattsson, C.; Olausson, L.; Theliander, H.; Vamling, L. Hydrothermal liquefaction of kraft lignin in sub-critical water: the influence of the sodium and potassium fraction. Biomass Convers. Biorefinery 2018, 8, 585–595. [Google Scholar] [CrossRef] [Green Version]
  41. Anastasakis, K.; Biller, P.; Madsen, R.B.; Glasius, M.; Johannsen, I. Continuous hydrothermal liquefaction of biomass in a novel pilot plant with heat recovery and hydraulic oscillation. Energies 2018, 11, 2695. [Google Scholar] [CrossRef] [Green Version]
  42. Gollakota, A.R.K.; Kishore, N.; Gu, S. A review on hydrothermal liquefaction of biomass. Renew. Sustain. Energy Rev. 2018, 81, 1378–1392. [Google Scholar] [CrossRef]
  43. Feng, Y.; Meier, D. Supercritical carbon dioxide extraction of fast pyrolysis oil from softwood. J. Supercrit. Fluids 2017, 128, 6–17. [Google Scholar] [CrossRef]
  44. Leijenhorst, E.J.; Wolters, W.; Van De Beld, L.; Prins, W. Inorganic element transfer from biomass to fast pyrolysis oil: Review and experiments. Fuel Process. Technol. 2016, 149, 96–111. [Google Scholar] [CrossRef]
  45. Sintamarean, I.M.; Grigoras, I.F.; Jensen, C.U.; Toor, S.S.; Pedersen, T.H.; Rosendahl, L.A. Two-stage alkaline hydrothermal liquefaction of wood to biocrude in a continuous bench-scale system. Biomass Convers. Biorefinery 2017, 7, 425–435. [Google Scholar] [CrossRef] [Green Version]
  46. Kosinkova, J.; Ramirez, J.A.; Ristovski, Z.D.; Brown, R.; Rainey, T.J. Physical and chemical stability of bagasse biocrude from liquefaction stored in real conditions. Energy Fuels 2016, 30, 10499–10504. [Google Scholar] [CrossRef]
  47. Elliott, D.C.; Meier, D.; Oasmaa, A.; Van De Beld, B.; Bridgwater, A.V.; Marklund, M. Results of the international energy agency round robin on fast pyrolysis bio-oil production. Energy Fuels 2017, 31, 5111–5119. [Google Scholar] [CrossRef] [Green Version]
  48. Speight, J.G. Petroleum Analysis. In The Chemistry and Technology of Petroleum; CRC Press: Boca Raton, FL, USA, 2006; pp. 274–314. ISBN 9780429118494. [Google Scholar]
  49. Fahmi, R.; Bridgwater, A.V.; Donnison, I.; Yates, N.; Jones, J.M. The effect of lignin and inorganic species in biomass on pyrolysis oil yields, quality and stability. Fuel 2008, 87, 1230–1240. [Google Scholar] [CrossRef]
  50. Das, P.; Ganesh, A.; Wangikar, P. Influence of pretreatment for deashing of sugarcane bagasse on pyrolysis products. Biomass Bioenergy 2004, 27, 445–457. [Google Scholar] [CrossRef]
  51. Minowa, T.; Kondo, T.; Sudirjo, S.T. Thermochemical liquefaction of Indonesian biomass residues. Biomass Bioenergy 1998, 14, 517–524. [Google Scholar] [CrossRef]
  52. Déniel, M.; Haarlemmer, G.; Roubaud, A.; Weiss-Hortala, E.; Fages, J. Optimisation of bio-oil production by hydrothermal liquefaction of agro-industrial residues: Blackcurrant pomace (Ribes nigrum L.) as an example. Biomass Bioenergy 2016, 95, 273–285. [Google Scholar] [CrossRef] [Green Version]
  53. Speight, J.G. Chemical Composition. In The Chemistry and Technology of Petroleum; Chemical Industries; CRC Press: Boca Raton, FL, USA, 2014; ISBN 9781439873892. [Google Scholar]
  54. Ghorbannezhad, P.; Kool, F.; Rudi, H.; Ceylan, S. Sustainable production of value-added products from fast pyrolysis of palm shell residue in tandem micro-reactor and pilot plant. Renew. Energy 2020, 145, 663–670. [Google Scholar] [CrossRef]
  55. Gómez-Monedero, B.; Bimbela, F.; Arauzo, J.; Faria, J.; Ruiz, M.P. Pyrolysis of red eucalyptus, camelina straw, and wheat straw in an ablative reactor. Energy Fuels 2015, 29, 1766–1775. [Google Scholar] [CrossRef]
  56. Hernando, H.; Jiménez-Sánchez, S.; Fermoso, J.; Pizarro, P.; Coronado, J.M.; Serrano, D.P. Assessing biomass catalytic pyrolysis in terms of deoxygenation pathways and energy yields for the efficient production of advanced biofuels. Catal. Sci. Technol. 2016, 6, 2829–2843. [Google Scholar] [CrossRef]
  57. Pedersen, T.H.; Grigoras, I.F.; Hoffmann, J.; Toor, S.S.; Daraban, I.M.; Jensen, C.U.; Iversen, S.B.; Madsen, R.B.; Glasius, M.; Arturi, K.R.; et al. Continuous hydrothermal co-liquefaction of aspen wood and glycerol with water phase recirculation. Appl. Energy 2016, 162, 1034–1041. [Google Scholar] [CrossRef] [Green Version]
  58. Montesantos, N.; Nielsen, R.P.; Maschietti, M. Upgrading of nondewatered nondemetallized lignocellulosic biocrude from hydrothermal liquefaction using supercritical carbon dioxide. Ind. Eng. Chem. Res. 2020, accepted. [Google Scholar] [CrossRef]
  59. Elliott, D.C.; Oasmaa, A.; Preto, F.; Meier, D.; Bridgwater, A.V. Results of the IEA round robin on viscosity and stability of fast pyrolysis bio-oils. Energy Fuels 2012, 26, 3769–3776. [Google Scholar] [CrossRef]
  60. Jensen, C.U.; Rodriguez Guerrero, J.K.; Karatzos, S.; Olofsson, G.; Iversen, S.B. Fundamentals of HydrofactionTM: Renewable crude oil from woody biomass. Biomass Convers. Biorefinery 2017, 7, 495–509. [Google Scholar] [CrossRef]
  61. Jarvis, J.M.; Billing, J.M.; Hallen, R.T.; Schmidt, A.J.; Schaub, T.M. Hydrothermal liquefaction biocrude compositions compared to petroleum crude and shale oil. Energy Fuels 2017, 31, 2896–2906. [Google Scholar] [CrossRef]
  62. Madsen, R.B.; Bernberg, R.Z.K.; Biller, P.; Becker, J.; Iversen, B.B.; Glasius, M. Hydrothermal co-liquefaction of biomasses-quantitative analysis of bio-crude and aqueous phase composition. Sustain. Energy Fuels 2017, 1, 789–805. [Google Scholar] [CrossRef] [Green Version]
  63. Christensen, E.D.; Chupka, G.M.; Luecke, J.; Smurthwaite, T.; Alleman, T.L.; Iisa, K.; Franz, J.A.; Elliott, D.C.; McCormick, R.L. Analysis of oxygenated compounds in hydrotreated biomass fast pyrolysis oil distillate fractions. Energy Fuels 2011, 25, 5462–5471. [Google Scholar] [CrossRef]
  64. Montesantos, N.; Pedersen, T.H.; Nielsen, R.P.; Rosendahl, L.; Maschietti, M. Supercritical carbon dioxide fractionation of bio-crude produced by hydrothermal liquefaction of pinewood. J. Supercrit. Fluids 2019, 149, 97–109. [Google Scholar] [CrossRef]
  65. ASTM International. ASTM D664-17a. Standard Test Method for Acid Number of Petroleum Products by Potentiometric Titration; ASTM: West Conshohocken, PA, USA, 2017. [Google Scholar]
  66. Jensen, C.U.; Rosendahl, L.A.; Olofsson, G. Impact of nitrogenous alkaline agent on continuous HTL of lignocellulosic biomass and biocrude upgrading. Fuel Process. Technol. 2017, 159, 376–385. [Google Scholar] [CrossRef]
  67. Jacobson, K.; Maheria, K.C.; Kumar Dalai, A. Bio-oil valorization: A review. Renew. Sustain. Energy Rev. 2013, 23, 91–106. [Google Scholar] [CrossRef]
  68. Stankovikj, F.; McDonald, A.G.; Helms, G.L.; Garcia-Perez, M. Quantification of bio-oil functional groups and evidences of the presence of pyrolytic humins. Energy Fuels 2016, 30, 6505–6524. [Google Scholar] [CrossRef]
  69. Madsen, R.B.; Anastasakis, K.; Biller, P.; Glasius, M. Rapid determination of water, total acid number, and phenolic content in bio-crude from hydrothermal liquefaction of biomass using FT-IR. Energy Fuels 2018, 32, 7660–7669. [Google Scholar] [CrossRef]
  70. Harman-Ware, A.E.; Ferrell, J.R. Methods and challenges in the determination of molecular weight metrics of bio-oils. Energy Fuels 2018, 32, 8905–8920. [Google Scholar] [CrossRef]
  71. Hwang, H.; Lee, J.H.; Choi, I.G.; Choi, J.W. Comprehensive characterization of hydrothermal liquefaction products obtained from woody biomass under various alkali catalyst concentrations. Environ. Technol. (United Kingdom) 2019, 40, 1657–1667. [Google Scholar] [CrossRef]
  72. Belkheiri, T.; Vamling, L.; Nguyen, T.D.H.; Maschietti, M.; Olausson, L.; Andersson, S.-I.; Åmand, L.-E.; Theliander, H. Kraft lignin depolymerization in near-critical water: effect of changing co-solvent. Cell Chem. Technol. 2014, 48, 813–818. [Google Scholar]
  73. Lyckeskog, H.N.; Mattsson, C.; Olausson, L.; Andersson, S.I.; Vamling, L.; Theliander, H. Thermal stability of low and high Mw fractions of bio-oil derived from lignin conversion in subcritical water. Biomass Convers. Biorefinery 2017, 7, 401–414. [Google Scholar] [CrossRef] [Green Version]
  74. Conrad, S.; Blajin, C.; Schulzke, T.; Deerberg, G. Comparison of fast pyrolysis bio-oils from straw and miscanthus. Environ. Prog. Sustain. Energy 2019, 38, e13287. [Google Scholar] [CrossRef]
  75. Yildiz, G.; Ronsse, F.; Venderbosch, R.; van Duren, R.; Kersten, S.R.A.; Prins, W. Effect of biomass ash in catalytic fast pyrolysis of pine wood. Appl. Catal. B Environ. 2015, 168–169, 203–211. [Google Scholar] [CrossRef]
  76. Doassans-Carrère, N.; Ferrasse, J.H.; Boutin, O.; Mauviel, G.; Lédé, J. Comparative study of biomass fast pyrolysis and direct liquefaction for bio-oils production: Products yield and characterizations. Energy Fuels 2014, 28, 5103–5111. [Google Scholar] [CrossRef]
  77. Azargohar, R.; Jacobson, K.L.; Powell, E.E.; Dalai, A.K. Evaluation of properties of fast pyrolysis products obtained, from Canadian waste biomass. J. Anal. Appl. Pyrolysis 2013, 104, 330–340. [Google Scholar] [CrossRef]
  78. Undri, A.; Abou-Zaid, M.; Briens, C.; Berruti, F.; Rosi, L.; Bartoli, M.; Frediani, M.; Frediani, P. A simple procedure for chromatographic analysis of bio-oils from pyrolysis. J. Anal. Appl. Pyrolysis 2015, 114, 208–221. [Google Scholar] [CrossRef]
  79. Nguyen Lyckeskog, H.; Mattsson, C.; Åmand, L.E.; Olausson, L.; Andersson, S.I.; Vamling, L.; Theliander, H. Storage stability of bio-oils derived from the catalytic conversion of softwood Kraft lignin in subcritical water. Energy Fuels 2016, 30, 3097–3106. [Google Scholar] [CrossRef] [Green Version]
  80. Nguyen, T.D.H.; Maschietti, M.; Belkheiri, T.; Åmand, L.E.; Theliander, H.; Vamling, L.; Olausson, L.; Andersson, S.I. Catalytic depolymerisation and conversion of Kraft lignin into liquid products using near-critical water. J. Supercrit. Fluids 2014, 86, 67–75. [Google Scholar] [CrossRef] [Green Version]
  81. Maddi, B.; Viamajala, S.; Varanasi, S. Comparative study of pyrolysis of algal biomass from natural lake blooms with lignocellulosic biomass. Bioresour. Technol. 2011, 102, 11018–11026. [Google Scholar] [CrossRef]
  82. Aqsha, A.; Tijani, M.M.; Moghtaderi, B.; Mahinpey, N. Catalytic pyrolysis of straw biomasses (wheat, flax, oat and barley) and the comparison of their product yields. J. Anal. Appl. Pyrolysis 2017, 125, 201–208. [Google Scholar] [CrossRef]
  83. Zhu, Z.; Rosendahl, L.; Toor, S.S.; Yu, D.; Chen, G. Hydrothermal liquefaction of barley straw to bio-crude oil: Effects of reaction temperature and aqueous phase recirculation. Appl. Energy 2015, 137, 183–192. [Google Scholar] [CrossRef]
  84. Feng, Y.; Meier, D. Extraction of value-added chemicals from pyrolysis liquids with supercritical carbon dioxide. J. Anal. Appl. Pyrolysis 2015, 113, 174–185. [Google Scholar] [CrossRef]
  85. Li, C.; Zhao, X.; Wang, A.; Huber, G.W.; Zhang, T. Catalytic transformation of lignin for the production of chemicals and fuels. Chem. Rev. 2015, 115, 11559–11624. [Google Scholar] [CrossRef]
  86. Nanda, S.; Mohammad, J.; Reddy, S.N.; Kozinski, J.A.; Dalai, A.K. Pathways of lignocellulosic biomass conversion to renewable fuels. Biomass Convers. Biorefinery 2014, 4, 157–191. [Google Scholar] [CrossRef]
  87. Chan, Y.H.; Quitain, A.T.; Yusup, S.; Uemura, Y.; Sasaki, M.; Kida, T. Liquefaction of palm kernel shell in sub- and supercritical water for bio-oil production. J. Energy Inst. 2018, 91, 721–732. [Google Scholar] [CrossRef]
  88. Kokayeff, P.; Zink, S.; Roxas, P. Hydrotreating in petroleum processing. In Handbook of Petroleum Processing; Treese, S.A., Pujadó, P.R., Jones, D.S.J., Eds.; Springer International Publishing: Berlin/Heidelberg, Germany, 1995; pp. 363–434. ISBN 978-3-319-14529-7. [Google Scholar]
  89. Castello, D.; Haider, M.S.; Rosendahl, L.A. Catalytic upgrading of hydrothermal liquefaction biocrudes: Different challenges for different feedstocks. Renew. Energy 2019, 141, 420–430. [Google Scholar] [CrossRef] [Green Version]
  90. Jensen, C.U.; Hoffmann, J.; Rosendahl, L.A. Co-processing potential of HTL bio-crude at petroleum refineries. Part 2: A parametric hydrotreating study. Fuel 2016, 165, 536–543. [Google Scholar] [CrossRef]
  91. Gollakota, A.R.K.; Reddy, M.; Subramanyam, M.D.; Kishore, N. A review on the upgradation techniques of pyrolysis oil. Renew. Sustain. Energy Rev. 2016, 58, 1543–1568. [Google Scholar] [CrossRef]
  92. Hoffmann, J.; Pedersen, T.H.; Rosendahl, L.A. Near-critical and supercritical water and their applications for biorefineries. In Biofuels and Biorefineries; Fang, Z., Xu, C., Eds.; Biofuels and Biorefineries; Springer: Dordrecht, The Netherlands, 2014; Volume 2, pp. 373–400. ISBN 978-94-017-8922-6. [Google Scholar]
  93. Han, Y.; Gholizadeh, M.; Tran, C.-C.; Kaliaguine, S.; Li, C.-Z.; Olarte, M.; Garcia-Perez, M. Hydrotreatment of pyrolysis bio-oil: A review. Fuel Process. Technol. 2019, 195, 106140. [Google Scholar] [CrossRef]
  94. Furimsky, E.; Massoth, F.E. Deactivation of hydroprocessing catalysts. Catal. Today 1999, 52, 381–495. [Google Scholar] [CrossRef]
  95. Mohamad, M.H.; Awang, R.; Yunus, W.Z.W. A Review of acetol: Application and production. Am. J. Appl. Sci. 2011, 8, 1135–1139. [Google Scholar] [CrossRef]
  96. Chen, L.; Zhao, J.; Pradhan, S.; Brinson, B.E.; Scuseria, G.E.; Zhang, Z.C.; Wong, M.S. Ring-locking enables selective anhydrosugar synthesis from carbohydrate pyrolysis. Green Chem. 2016, 18, 5438–5447. [Google Scholar] [CrossRef] [Green Version]
  97. Rover, M.R.; Aui, A.; Wright, M.M.; Smith, R.G.; Brown, R.C. Production and purification of crystallized levoglucosan from pyrolysis of lignocellulosic biomass. Green Chem. 2019, 21, 5980–5989. [Google Scholar] [CrossRef] [Green Version]
  98. Werpy, T.; Petersen, G. Top Value Added Chemicals from Biomass: Volume I-Results of Screening for Potential Candidates from Sugars and Synthesis Gas; National Renewable Energy Laboratory (NREL): Golden, CO, USA, 2004. [Google Scholar]
  99. Longley, C.J.; Fung, D.P.C. Potential Applications and Markets for Biomass-Derived Levoglucosan. In Advances in Thermochemical Biomass Conversion; Springer: Dordrecht, The Netherlands, 1993; pp. 1484–1494. ISBN 978-94-011-1336-6. [Google Scholar]
  100. What’s New in Phenol Production? Available online: https://www.acs.org/content/acs/en/pressroom/cutting-edge-chemistry/what-s-new-in-phenol-production-.html (accessed on 12 August 2019).
  101. Maqbool, W.; Hobson, P.; Dunn, K.; Doherty, W. Supercritical carbon dioxide separation of carboxylic scids and phenolics from bio-oil of lignocellulosic origin: Understanding bio-oil compositions, compound solubilities, and their fractionation. Ind. Eng. Chem. Res. 2017, 56, 3129–3144. [Google Scholar] [CrossRef] [Green Version]
  102. Fiege, H.; Voges, H.-W.; Hamamoto, T.; Umemura, S.; Iwata, T.; Miki, H.; Fujita, Y.; Buysch, H.-J.; Garbe, D.; Paulus, W. Phenol Derivatives. In Ullmann’s Encyclopedia of Industrial Chemistry; Wiley-VCH Verlag GmbH & Co. KGaA: Weinheim, Germany, 2012; Volume 26, pp. 552–553. [Google Scholar]
  103. Naik, S.; Goud, V.V.; Rout, P.K.; Dalai, A.K. Supercritical CO2 fractionation of bio-oil produced from wheat-hemlock biomass. Bioresour. Technol. 2010, 101, 7605–7613. [Google Scholar] [CrossRef] [PubMed]
  104. Vanilla and Vanillin Market: Global Industry Trends, Share, Size, Growth, Opportunity and Forecast 2019-2024. Available online: https://www.researchandmarkets.com/research/n4fxw5/global_vanilla?w=12 (accessed on 28 October 2019).
  105. Wu, X.F.; Zhou, Q.; Li, M.F.; Li, S.X.; Bian, J.; Peng, F. Conversion of poplar into bio-oil via subcritical hydrothermal liquefaction: Structure and antioxidant capacity. Bioresour. Technol. 2018, 270, 216–222. [Google Scholar] [CrossRef] [PubMed]
  106. Larson, R.A.; Sharma, B.K.; Marley, K.A.; Kunwar, B.; Murali, D.; Scott, J. Potential antioxidants for biodiesel from a softwood lignin pyrolyzate. Ind. Crops Prod. 2017, 109, 476–482. [Google Scholar] [CrossRef]
  107. Chandrasekaran, S.R.; Murali, D.; Marley, K.A.; Larson, R.A.; Doll, K.M.; Moser, B.R.; Scott, J.; Sharma, B.K. Antioxidants from slow pyrolysis bio-oil of birch wood: Application for biodiesel and biobased lubricants. ACS Sustain. Chem. Eng. 2016, 4, 1414–1421. [Google Scholar] [CrossRef]
  108. Qazi, S.S.; Li, D.; Briens, C.; Berruti, F.; Abou-Zaid, M.M. Antioxidant activity of the lignins derived from fluidized-bed fast pyrolysis. Molecules 2017, 22, 372. [Google Scholar] [CrossRef] [PubMed] [Green Version]
  109. Lemmon, E.W.; McLinden, M.O.; Friend, D.G. Thermophysical Properties of Fluid Systems. In NIST Chemistry WebBook, NIST Standard Reference Database Number 69; Linstrom, P.J., Mallard, W.G., Eds.; National Institute of Standards and Technology: Gaithersburg, MD, USA, 1998. [Google Scholar]
  110. Michels, A.; Blaisse, B.; Hoogschagen, J. The melting line of carbon dioxide up to 2800 atmospheres. Physica 1942, 9, 565–573. [Google Scholar] [CrossRef]
  111. Dortmund Data Bank. Available online: http://www.ddbst.com/en/EED/PCP/VAP_C1050.php (accessed on 29 October 2019).
  112. Brunner, G. Supercritical fluids: Technology and application to food processing. J. Food Eng. 2005, 67, 21–33. [Google Scholar] [CrossRef]
  113. McHugh, M.A.; Krukonis, V.J. Supercritical Fluid Extraction, 2nd ed.; Brenner, H., Ed.; Butterworth-Heinemann series in chemical engineering; Elsevier: Amsterdam, The Netherlands, 1994; ISBN 9780080518176. [Google Scholar]
  114. Gupta, R.B.; Shim, J.-J. Solubility in Supercritical Carbon Dioxide; Gupta, R.B., Shim, J.-J., Eds.; CRC Press: Boca Raton, FL, USA, 2006; ISBN 9780429122088. [Google Scholar]
  115. Reverchon, E.; De Marco, I. Supercritical fluid extraction and fractionation of natural matter. J. Supercrit. Fluids 2006, 38, 146–166. [Google Scholar] [CrossRef]
  116. McHugh, M.A.; Krukonis, V.J. Processing Pharmaceuticals, Natural Products, Specialty Chemicals, and Waste Streams. In Supercritical Fluid Extraction; Butterworth-Heinemann: Oxford, UK, 1994; pp. 293–310. ISBN 9780080518176. [Google Scholar]
  117. Gironi, F.; Maschietti, M. Supercritical carbon dioxide fractionation of lemon oil by means of a batch process with an external reflux. J. Supercrit. Fluids 2005, 35, 227–234. [Google Scholar] [CrossRef]
  118. Maschietti, M.; Pedacchia, A. Supercritical carbon dioxide separation of fish oil ethyl esters by means of a continuous countercurrent process with an internal reflux. J. Supercrit. Fluids 2014, 86, 76–84. [Google Scholar] [CrossRef]
  119. Gironi, F.; Maschietti, M. Continuous countercurrent deterpenation of lemon essential oil by means of supercritical carbon dioxide: Experimental data and process modelling. Chem. Eng. Sci. 2008, 63, 651–661. [Google Scholar] [CrossRef]
  120. Gironi, F.; Maschietti, M. Separation of fish oils ethyl esters by means of supercritical carbon dioxide: Thermodynamic analysis and process modelling. Chem. Eng. Sci. 2006, 61, 5114–5126. [Google Scholar] [CrossRef]
  121. Riha, V.; Brunner, G. Separation of fish oil ethyl esters with supercritical carbon dioxide. J. Supercrit. Fluids 2000, 17, 55–64. [Google Scholar] [CrossRef]
  122. Osséo, L.S.; Caputo, G.; Gracia, I.; Reverchon, E. Continuous fractionation of used frying oil by supercritical CO2. JAOCS J. Am. Oil Chem. Soc. 2004, 81, 879–885. [Google Scholar] [CrossRef]
  123. Kim, S.K.; Han, J.Y.; Hong, S.A.; Lee, Y.W.; Kim, J. Supercritical CO2-purification of waste cooking oil for high-yield diesel-like hydrocarbons via catalytic hydrodeoxygenation. Fuel 2013, 111, 510–518. [Google Scholar] [CrossRef]
  124. Meyer, T. Extracting and upgrading heavy hydrocarbons using supercritical carbon dioxide 2011. UK Patent GB 2471862 A, 19 January 2011. [Google Scholar]
  125. Subramanian, A.; Floyd, R. Residuum oil supercritical extraction process 2011. US Patent 2011/0094937 A1, 28 April 2011. [Google Scholar]
  126. Mudraboyina, B.P.; Fu, D.; Jessop, P.G. Supercritical fluid rectification of lignin microwave-pyrolysis oil. Green Chem. 2015, 17, 169–172. [Google Scholar] [CrossRef]
  127. Montesantos, N.; Pedersen, T.H.; Nielsen, R.P.; Rosendahl, L.A.; Maschietti, M. High-temperature extraction of lignocellulosic bio-crude by supercritical carbon dioxide. Chem. Eng. Trans. 2019, 74, 799–804. [Google Scholar]
  128. Chan, Y.H.; Yusup, S.; Quitain, A.T.; Chai, Y.H.; Uemura, Y.; Loh, S.K. Extraction of palm kernel shell derived pyrolysis oil by supercritical carbon dioxide: Evaluation and modeling of phenol solubility. Biomass Bioenergy 2018, 116, 106–112. [Google Scholar] [CrossRef]
  129. Chan, Y.H.; Yusup, S.; Quitain, A.T.; Uemura, Y.; Loh, S.K. Fractionation of pyrolysis oil via supercritical carbon dioxide extraction: Optimization study using response surface methodology (RSM). Biomass Bioenergy 2017, 107, 155–163. [Google Scholar] [CrossRef]
  130. Feng, Y.; Meier, D. Comparison of supercritical CO2, liquid CO2, and solvent extraction of chemicals from a commercial slow pyrolysis liquid of beech wood. Biomass Bioenergy 2016, 85, 346–354. [Google Scholar] [CrossRef]
  131. Cheng, T.; Han, Y.; Zhang, Y.; Xu, C. Molecular composition of oxygenated compounds in fast pyrolysis bio-oil and its supercritical fluid extracts. Fuel 2016, 172, 49–57. [Google Scholar] [CrossRef]
  132. Patel, R.N.; Bandyopadhyay, S.; Ganesh, A. Extraction of cardanol and phenol from bio-oils obtained through vacuum pyrolysis of biomass using supercritical fluid extraction. Energy 2011, 36, 1535–1542. [Google Scholar] [CrossRef]
  133. Rout, P.K.; Naik, M.K.; Naik, S.N.; Goud, V.V.; Das, L.M.; Dalai, A.K. Supercritical CO2 fractionation of bio-oil produced from mixed biomass of wheat and wood sawdust. Energy Fuels 2009, 23, 6181–6188. [Google Scholar] [CrossRef]
  134. Wang, J.; Cui, H.; Wei, S.; Zhuo, S.; Wang, L.; Li, Z.; Yi, W. Separation of biomass pyrolysis oil by supercritical CO2 extraction. Smart Grid Renew. Energy 2010, 01, 98–107. [Google Scholar] [CrossRef] [Green Version]
  135. ISO 8217:2017. Petroleum Products-Fuels (class F)-Specifications of Marine Fuels; ISO: Geneva, Switzerland, 2017. [Google Scholar]
  136. Pedersen, K.S.; Christensen, P.L.; Shaikh, J.A. Phase Behavior of Petroleum Reservoir Fluids, 2nd ed.; CRC Press: Boca Raton, FL, USA, 2014; ISBN 9780429110306. [Google Scholar]
  137. Chrastil, J. Solubility of solids and liquids in supercritical gases. J. Phys. Chem. 1982, 86, 3016–3021. [Google Scholar] [CrossRef]
  138. Dohrn, R.; Brunner, G. High-pressure fluid-phase equilibria: Experimental methods and systems investigated (1988–1993). Fluid Phase Equilib. 1995, 106, 213–282. [Google Scholar] [CrossRef]
  139. Laugier, S.; Richon, D. High-pressure vapor-liquid equilibria of two binary systems: Carbon dioxide + cyclohexanol and carbon dioxide + cyclohexanone. J. Chem. Eng. Data 1997, 42, 155–159. [Google Scholar] [CrossRef]
  140. Jing, Y.; Hou, Y.; Wu, W.; Liu, W.; Zhang, B. Solubility of 5-Hydroxymethylfurfural in supercritical carbon dioxide with and without ethanol as cosolvent at (314.1 to 343.2) K. J. Chem. Eng. Data 2011, 56, 298–302. [Google Scholar] [CrossRef]
  141. Sparks, D.L.; Hernandez, R.; Estévez, L.A.; Holmes, W.E.; French, W.T. Solubility of small-chain fatty acids in supercritical carbon dioxide. AIChE Annu. Meet. Conf. Proc. 2008, 55, 4922–4927. [Google Scholar]
  142. Bamberger, T.; Erickson, J.C.; Cooney, C.L.; Kumar, S.K. Measurement and model prediction of solubilities of pure fatty acids, pure triglycerides, and mixtures of triglycerides in supercritical carbon dioxide. J. Chem. Eng. Data 1988, 33, 327–333. [Google Scholar] [CrossRef]
  143. Maheshwari, P.; Nikolov, Z.L.; White, T.M.; Hartel, R. Solubility of fatty acids in supercritical carbon dioxide. J. Am. Oil Chem. Soc. 1992, 69, 1069–1076. [Google Scholar] [CrossRef]
  144. Iwai, Y.; Fukuda, T.; Koga, Y.; Arai, Y. Solubilities of myristic acid, palmitic acid, and cetyl alcohol in supercritical carbon dioxide at 35 °C. J. Chem. Eng. Data 1991, 36, 430–432. [Google Scholar] [CrossRef]
  145. Garlapati, C.; Madras, G. Solubilities of palmitic and stearic fatty acids in supercritical carbon dioxide. J. Chem. Thermodyn. 2010, 42, 193–197. [Google Scholar] [CrossRef]
  146. Brandt, L.; Elizalde-Solis, O.; Galicia-Luna, L.A.; Gmehling, J. Solubility and density measurements of palmitic acid in supercritical carbon dioxide + alcohol mixtures. Fluid Phase Equilib. 2010, 289, 72–79. [Google Scholar] [CrossRef]
  147. Schwarz, C.E.; Knoetze, J.H. Phase equilibrium measurements of long chain acids in supercritical carbon dioxide. J. Supercrit. Fluids 2012, 66, 36–48. [Google Scholar] [CrossRef]
  148. Bamberger, A.; Schmelzer, J.; Walther, D.; Maurer, G. High-pressure vapour-liquid equilibria in binary mixtures of carbon dioxide and benzene compounds: experimental data for mixtures with ethylbenzene, isopropylbenzene, 1,2,4-trimethylbenzene, 1,3,5-trimethylbenzene, ethenylbenzene and isopropenylbenzene, and their correlation with the generalized Bender and Skjold-Jorgensen’s group contribution equation of state. Fluid Phase Equilib. 1994, 97, 167–189. [Google Scholar] [CrossRef]
  149. Jennings, D.W.; Schucker, R.C. Comparison of high-pressure vapor-liquid equilibria of mixtures of CO2 or propane with nonane and C9 alkylbenzenes. J. Chem. Eng. Data 1996, 41, 831–838. [Google Scholar] [CrossRef]
  150. Phiong, H.S.; Lucien, F.P. Volumetric expansion and vapour-liquid equilibria of α-methylstyrene and cumene with carbon dioxide at elevated pressure. J. Supercrit. Fluids 2003, 25, 99–107. [Google Scholar] [CrossRef]
  151. McHugh, M.; Paulaitls, M.E. Solid solubilities of naphthalene and biphenyl in supercritical carbon dioxide. J. Chem. Eng. Data 1980, 25, 326–329. [Google Scholar] [CrossRef]
  152. Yanagiuchi, M.; Ueda, T.; Matsubara, K.; Inomata, H.; Arai, K.; Saito, S. Fundamental investigation on supercritical extraction of coal-derived aromatic compounds. J. Supercrit. Fluids 1991, 4, 145–151. [Google Scholar] [CrossRef]
  153. Wells, P.A.; Chaplin, R.P.; Foster, N.R. Solubility of phenylacetic acid and vanillan in supercritical carbon dioxide. J. Supercrit. Fluids 1990, 3, 8–14. [Google Scholar] [CrossRef]
  154. Schmitt, W.J.; Reid, R.C. Solubility of monofunctional organic solids in chemically diverse supercritical fluids. J. Chem. Eng. Data 1986, 31, 204–212. [Google Scholar] [CrossRef]
  155. Kurnlk, R.T.; Holla, S.J.; Reid, R.C. Solubility of solids in supercritical carbon dioxide and ethylene. J. Chem. Eng. Data 1981, 26, 47–51. [Google Scholar] [CrossRef]
  156. García-González, J.; Molina, M.J.; Rodríguez, F.; Mirada, F. Solubilities of phenol and pyrocatechol in supercritical carbon dioxide. J. Chem. Eng. Data 2001, 46, 918–921. [Google Scholar] [CrossRef]
  157. Van Leer, R.A.; Paulaitis, M.E. Solubilities of phenol and chlorinated phenols in supercritical carbon dioxide. J. Chem. Eng. Data 1980, 25, 257–259. [Google Scholar] [CrossRef]
  158. Pfohl, O.; Brunner, G. Two-and three-phase equilibria in systems containing benzene derivatives, carbon dioxide, and water at 373.15 K and 10–30 MPa. Fluid Phase Equilibria 1997, 141, 179–206. [Google Scholar] [CrossRef]
  159. Yamini, Y.; Fat’Hi, M.R.; Alizadeh, N.; Shamsipur, M. Solubility of dihydroxybenzene isomers in supercritical carbon dioxide. Fluid Phase Equilibria 1998, 152, 299–305. [Google Scholar] [CrossRef]
  160. Škerget, M.; Čretnik, L.; Knez, Ž.; Škrinjar, M. Influence of the aromatic ring substituents on phase equilibria of vanillins in binary systems with CO2. Fluid Phase Equilibria 2005, 231, 11–19. [Google Scholar] [CrossRef]
  161. Liu, J.; Kim, Y.; McHugh, M.A. Phase behavior of the vanillin-CO2 system at high pressures. J. Supercrit. Fluids 2006, 39, 201–205. [Google Scholar] [CrossRef]
  162. Lee, M.J.; Kou, C.F.; Cheng, J.W.; Lin, H.M. Vapor-liquid equilibria for binary mixtures of carbon dioxide with 1,2-dimethoxybenzene, 2-methoxyphenol, or p-cresol at elevated pressures. Fluid Phase Equilibria 1999, 162, 211–224. [Google Scholar] [CrossRef]
  163. Pfohl, O.; Pagel, A.; Brunner, G. Phase equilibria in systems containing o-cresol, p-cresol, carbon dioxide, and ethanol at 323.15-473.15 K and 10-35 MPa. Fluid Phase Equilibria 1999, 157, 53–79. [Google Scholar] [CrossRef]
  164. Lee, R.J.; Chao, K.C. Extraction of 1-methylnaphthalene and m-cresol with supercritical carbon dioxide and ethane. Fluid Phase Equilibria 1988, 43, 329–340. [Google Scholar] [CrossRef]
  165. Kambo, H.S.; Dutta, A. A comparative review of biochar and hydrochar in terms of production, physico-chemical properties and applications. Renew. Sustain. Energy Rev. 2015, 45, 359–378. [Google Scholar] [CrossRef]
Figure 1. Example of lignocellulosic bio-oil from pinewood. (a) hydrothermal liquefaction (HTL); (b) pyrolysis.
Energies 13 01600 g001
Figure 2. CO2 phase diagram. Data taken from the literature [109,110,111].
Energies 13 01600 g002
Figure 3. Flow diagram of semi-continuous extraction processes. (a) Single stage; (b) multi-stage.
Energies 13 01600 g003
Figure 4. Flow diagram of continuous countercurrent extraction process. (a) Without reflux; (b) with reflux.
Energies 13 01600 g004
Figure 5. Generalized semi-continuous sCO2 extraction system.
Energies 13 01600 g005
Figure 6. (a) H/C atomic ratio and (b) oxygen mass fraction of bio-oils (feed) and their sCO2 extracts on a water-free basis. A: Montesantos et al. [58]; B: Montesantos et al. [64]; C: Chan et al. [129]; D: Feng and Meier [130]; E1–E3: Feng and Meier [84]; F: Naik et al. [103]; G: Rout et al. [133]. E1–E3 correspond to different feeds. 1 It was assumed that the data were reported on a water-free basis (unspecified by the authors); 2 it was assumed that the data were reported including water (unspecified by the authors).
Energies 13 01600 g006
Figure 7. Distribution factors (K-values) of component classes identified in the literature. K-values correspond to the pressure, temperature, and compositional ranges reported in the literature. The boxes include the 50% distributed around the average, the red line is the median value, the whiskers are the extreme values (over 75% and under 25%), and the “+” denotes values considered outliers [58,64,84,126,127,129,130]. SFA, short chain fatty acid; LFA, long chain fatty acid; PAH, polyaromatic hydrocarbon.
Energies 13 01600 g007
Figure 8. Variation of K-values with extraction progression (left to right) of different types of acids: short chain fatty acids (SFAs); long chain fatty acids (LFAs); aromatic acids (ArAcid). Extraction temperature: 120 °C. Three different solvent densities [127].
Energies 13 01600 g008
Figure 9. Solubility isotherms vs. sCO2 density for all components studied. Markers indicate experimental data, while continuous lines are obtained with the Chrastil model. (a) Heptanoic acid; (b) Hexadecanoic acid; (c) Cumene; (d) Phenol; (e) Cyclohexanone; (f) Naphthalene; (g) Hydroxymethylfurfural; (h) Benzeneacetic and benzoic acid; (i) Catechol; (j) Vanillin; (k) Guaiacol; (l) o-Cresol; (m) m-Cresol; (n) p-Cresol.
Energies 13 01600 g009aEnergies 13 01600 g009bEnergies 13 01600 g009c
Table 1. Lignocellulosic biomass and distribution of cellulose, hemicellulose, lignin, and ash (wt%) on a water-free basis [26].
Residual Biomass TypeForestryAgriculturalIndustrialMunicipal
PoplarPineSugarcane BagasseWheat StrawKraft LigninSewage Sludge1
Cellulose41–4938–5034–4229 –520–1-
Hemicellulose17–3318–3019–4311–390–1-
Lignin18–3223–2819–218–3090-
Ash0–20–62–121–141–226–55
1 Organic content is reported as total volatile matter in the range of 40 wt%–74 wt%.
Table 2. Examples of lignocellulosic biomass, studied for bio-oil production, and their properties. Elemental composition, ash, and higher heating value (HHV) are reported on a water-free basis. Water content is also reported when available.
Biomass TypeIndustrial ResidueSoftwoodHardwoodEnergy CropsAgricultural Residues
Kraft LigninPine BarkBeechWheat StalkSugarcane Bagasse
Water (wt%)32.6NA8.710.5NA
Oxygen (wt%)2642.1344.547.952.5
H/C1.041.381.381.532.00
O/C0.310.640.690.791.00
Ash0.81.070.8NANA
HHV (MJ/kg)27.6720.2119.2117.8116.41
Reference[28][29][30][31][32]
1 Calculated; NA: not reported.
Table 3. Thermochemical conversion methods for bio-oil production [8,33]. HTL, hydrothermal liquefaction.
ProcessPretreatmentTemperaturePressureBio-Oil Yield
PyrolysisDrying, size reduction500–600 °CAtmosphericup to 75 wt%
HTLSize reduction 250–450 °C100–350 barup to 75 wt%
Table 4. Properties of HTL bio-oils for different biomass feedstocks. Oxygen (O), H/C, O/C, ash, and higher heating value (HHV) on a water-free basis.
Biomass TypeIndustrial ResidueSoftwoodHardwoodEnergy CropAgricultural Residue
Kraft LigninPalm ShellPine BarkBeechEucalyptusWheat StalkWheat StrawSugarcane Bagasse
ProcessHTLPyrolysisHTLHTLPyrolysisHTLPyrolysisHTL
Oxygen (wt%)213328.327.323.918.840.036.3
H/C1.111.741.21.191.081.291.351.64
O/C0.230.430.330.300.260.200.560.49
HHV (MJ/kg)31.72727.4128.3129.232.4121.924.81
Reference[28][54][29][30][55][31][56][32]
1 Calculated as reported in the literature [27].
Table 5. Typical chemical classes identified by gas-chromatography coupled with mass spectrometry (GC-MS) in bio-oils with examples of mass fractions in pyrolysis oils and HTL biocrudes from pinewood and examples of specific components [10,43,57,58,76,81,82,83,84]. MW, molecular weight.
Chemical ClassPyrolysis [43]HTL [58]MWCarbon NumberExamples
KetonesUp to 8 wt%Up to 0.5 wt%74–124C3–C10Hydroxyacetone
Cyclopenten-1-one, 2-
Cyclopentanone, 2,5-dimethyl
PhenolsUp to 0.1 wt%Up to 0.3 wt%94–122 C6–C8Phenol
o-Cresol
4-Ethylphenol
GuaiacolsUp to 0.5 wt%Up to 0.6 wt%124–178C7–C10Guaiacol
Eugenol
Creosol
Benzenediols-Up to 1.7 wt%110–124C6–C8 Catechol
4-Ethylcatechol
Short chain fatty acids1Up to 5 wt%Up to 0.2 wt%60–144C2–C8Acetic acid
Octanoic acid
Long chain fatty acids-Up to 3.8 wt%172–284C10–C19Decanoic acid
Octadecanoic acid
Aromatic acids-Up to 1.8 wt%152–300 C8–C20Dehydroabietic acid
Benzeneacetic acid, 3-hydroxy
FuransUp to 0.5 wt%-84–132C4–C8Furfural
Furanone, 2(5H)-
AldehydesUp to 8 wt%-60–152C2–C8 Glycolaldehyde
Benzaldehyde, 3-hydroxy-4-methyl-
Esters--130–296 C6–C19Benzoic acid, 4-methoxy-, methyl ester
Furoic acid methylester
SugarsUp to 10 wt%-132–144C5–C6 Levoglucosan
2,3-Anhydro-d-galactosan
Benzenes-Up to 1 wt%92–134C7–C10 o-Cymene
Toluene
Polyaromatic hydrocarbons-Up to 9 wt%128–234C10–C18Naphthalene
Retene
1 For simplicity, small carboxylic acids (i.e., acetic, propanoic) are included in this class.
Table 6. Experimental studies of semi-continuous sCO2 fractionation of bio-oils.
FeedstockThermochemical ProcessExtractor Volume (cm3) YearRef.
PineHTL1782020[58]
PineHTL1782019[127]
PineHTL1782019[64]
Palm kernel shellSlow pyrolysis502018[128]
PineFast pyrolysis6402017[43]
Palm kernel shellSlow pyrolysis502017[129]
BeechSlow pyrolysis6402016[130]
Red pineFast pyrolysis252016[131]
Kraft ligninMicrowave pyrolysis16012015[126]
BeechSlow pyrolysis and fast pyrolysis6002015[84]
Sugarcane bagasse and cashew shellsPyrolysis-2011[132]
Wheat-hemlockFast pyrolysis-2010[103]
Wheat-sawdustFast pyrolysis-2009[133]
1 The extractor was coupled with a rectification column.
Table 7. Experimental conditions and technical data of experiments of sCO2 extraction of lignocellulosic bio-oils found in the literature. Pressure (P), temperature (T), CO2 density, feed mass (F), CO2 mass flow rate, solvent-to-feed ratio (S/F), total extraction yield (Y), and vapor phase loading (VPL) are reported.
P (bar)T (°C)CO2 Density (kg/m3)F (g)CO2 Flow (g/min)S/F (g/g)Y (wt%)VPL (g/kg)Ref.
330–45080–150531–85149–544.7–5.930.0–36.744.1–53.4 5.9–99.7[58]
247–448120500–73028.0–30.84.8–6.940.6–50.933.9–48.92.7–46.5[127]
112–40040–120548–88240.9–51.13.2–7.012.8–85.517.1–41.813.1–36.5[64]
300–40050–70788–9231.8–2.43.1–3.878.7–116.34.7–12.00.4–1.0[128]
100–30060–80221–83010018.3 130 10.1–14.30.03–4.8[43]
150–40033–66691–9612.51.1–8.326.6–199.04.2–30.40.9–2.2[129]
2006072340–808.337.5–75.023.4–40.93.1–10.9[130]
100–30050384–8701.00.4–0.956.371.1 230.6 3[131]
80–10035 (45–95) 4490–7002–52–1040–10011–312.2–5.1[126]
150–25060603–7868010457.3–41.41.6–11.5[84]
120–30050510–87010011.7–2021–369–154.2–4.3[132]
100–30040628–9105040288460.7–2.16[103]
250–30045857–8905030288450.7–2.8[133]
1 Normalized data are provided only; 2 achieved with the use of co-solvent (i.e., methanol); 3 average value; 4 rectification column temperatures in parentheses.
Table 8. Typical chemical classes and key components observed in sCO2 extracts [43,58,64,84,103,126,129,130,132,133].
NumberClassMW RangeKey ComponentsCarbon Number
1Ketones74–124Acetol3
Acetylacetone5
2-pentanone5
Propan-2-one. 1-acetyloxy-5
2-Cyclopenten-1-one, 2,3-dimethyl-7
2Phenols94–122Phenol6
o-cresol7
m-cresol7
p-cresol7
2,5-Dimethylphenol (p-xylenol)8
3Guaiacols124–178Guaiacol7
4-methyl guaiacol8
4-ethyl guaiacol8
4-propyl guaiacol8
Eugenol10
Isoeugenol10
Creosol8
Vanillin8
4Benzenediols110–1241,2-Benzenediol6
5Aldehydes60–152Glycolaldehyde2
6Esters130–296Pentanoic acid. 4-oxo-. methylester6
7Furans84–126Furfural5
5-Hydroxymethylfurfural6
8Syringols154Syringol8
9Short chain fatty acids60–144Acetic acid2
Propionic acid3
Hexanoic acid6
10Long chain fatty acids256–284n-Hexadecanoic acid16
n-Octadecanoic acid18
11Aromatic acids136Benzeneacetic acid, 3-hydroxy8
12Benzenes120o-Cumene10
13Polyaromatic hydrocarbons128Naphthalene10
Table 9. Chemical components studied and experimental conditions of measured phase equilibrium data with sCO2 in the literature. Temperature range (T), pressure range (P), sCO2 density range (ρ), type of measurement (method), and type of data (data) are reported.
ComponentT (°C)P (bar)ρ (kg/m3)1MethodDataRef.
Cyclohexanone160–18090–220115–332AnalyticalVLE[139]
5-Hydroxymethylfurfural41–7097–196390–823SyntheticSolubility[140]
Heptanoic acid40–6085–200212–840AnalyticalSolubility[141]
Hexadecanoic acid4080–248278–878AnalyticalSolubility[142]
35–55138–414610–977AnalyticalSolubility[143]
3599–230709–888AnalyticalSolubility[144]
35–55128–226560–885AnalyticalSolubility[145]
40–45101–233512–864SyntheticSolubility[146]
64–78105–260643–759SyntheticVLE[147]
Cumene40–12076–183131–376AnalyticalVLE[148]
7087–116197–324AnalyticalVLE[149]
5080–88220–270AnalyticalVLE[150]
Naphthalene35–6581–287208–903AnalyticalSolubility[151]
121–16277–166120–313AnalyticalVLE[152]
Benzeneacetic acid35–4590–200381–852AnalyticalSolubility[153]
Benzoic acid35–70101–364252–958AnalyticalSolubility[154]
45–65120–280384–878AnalyticalSolubility[155]
Phenol60–90100–350203–863AnalyticalSolubility[156]
36–6079–249334–897AnalyticalSolubility[157]
100107–301 207–663AnalyticalVLE[158]
Catechol60–90100–350 203–863AnalyticalSolubility[156]
35–65 122–405396–974AnalyticalSolubility[159]
Vanillin40–8080–277160–895AnalyticalSolubility[160]
35–4583–195 466–857AnalyticalSolubility[153]
68–136216–1341561–1115SyntheticVLE[161]
Guaiacol50–12080–200128–784AnalyticalVLE[162]
o-Cresol100104–263199–610AnalyticalVLE[158]
50–20099–300121–848Analytical VLE[163]
m-Cresol35–55 80–240204–895AnalyticalVLE[164]
100102–300194–662 AnalyticalVLE[158]
p-Cresol50–200100–348123–898AnalyticalVLE[163]
80–15080–200113–594AnalyticalVLE[162]
100103–302196–663Analytical VLE[158]
1 Taken from NIST [109].
Table 10. Chrastil solubility constants (k, a, b) for the binary systems of bio-oil components and sCO2, statistical properties of the regression (R2, ARD), and number of experimental data regressed (N).
Regressed ParameterGoodness of Fit
Componentka (K)bR2ARD %N
Cyclohexanone2.0216−3425.30.454050.9842.010
5-Hydroxymethylfurfural4.0412−3263.6−15.2670.9739.019
Heptanoic acid6.0527−3806.1−23.7330.9878.115
Hexadecanoic acid7.5664−9042.3−20.7060.95019.062
Cumene2.5852−3481.6−2.18350.9639.341
Naphthalene3.7852−4080.9−8.19750.94014.763
Benzeneacetic acid6.1072−10177−5.23140.9864.924
Benzoic acid5.2174−5860.4−14.6360.98613.453
Phenol3.0544−3081.46.93310.72910.873
Catechol3.7457−3716.1−12.4170.97718.262
Vanillin4.0675−4210.7−11.7070.94818.474
Guaiacol4.0447−2597.8−14.0420.96521.013
o-Cresol3.4937−3026.3−9.24130.86713.116
m-Cresol3.8196−2950.5−12.3830.9818.023
p-Cresol3.2734−3441.3−7.57470.92415.730

