Abstract
Reaction times are often used as an indicator of the efficiency of the processes in the central nervous system. While extensive research has been conducted on the possible response time correlates, the role of eye movements in visual tasks is yet unclear. Here we report data to support the role of eye movements during visual choice reaction time training. Participant performance, reaction times, and total session duration improved. Eyemovements showed expected changes in saccade amplitude and resulted in improvement in visual target searching.
Keywords:
response time; eye movement; eye tracking; saccades; fixation; learning; gaze; CRT; visual choice reaction time task Introduction
Visual reaction time (RT) is an important expression of human cognitive functioning (Luce, 1991; Townsend & Ashby, 1983). As a correlate of cognitive functions such as awareness, spatial orientation as well as executive functions (Jones et al., 2016) 2016), it is commonly considered one of the most important measures of central nervous system (CNS) efficiency (Antonova et al., 2016).
A number of factors, such as participant age, sex and dominant hand, can affect RT. Fatigue is known to slow down responses, while practice can reduce reaction time (Baayen & Milin, 2015). Furthermore, visual reaction times can also be affected by low-level stimulus properties, such as colour (Balakrishnan et al., 2014), visual complexity (Tuch, Bargas-Avila, Opwis, & Wilhelm, 2009) and intensity, e.g., font size, brightness of a visual stimulus or sound loudness (Hsieh, Lin, & Chen, 2007; Tuch et al., 2009). Additionally, the experiment conditions can also alter the participant’s performance, e.g., there are suggestions that presenting an additional auditory stimulus together with the visual stimulus results in faster response times by statistical facilitation (Destrebecqz et al., 2010; Land, 2016; Watanabe, Ishida, Tanabe, & Nojima, 2016).
Besides visual stimulus properties, reaction times are also affected by the task context. Three main types of RT tasks and associated reaction time measures have been proposed: simple, recognition and choice reaction times. Simple reaction times refer to situations where the task is to simply respond as soon as a stimulus is detected. Recognition RTs are measured when the task is to respond as soon as a particular stimulus is detected. Finally, choice reaction times are found when one stimuli is responded to in one way, while the other stimulus is responded to in another way. Typically, response times are lowest in the simple response time task, followed by the recognition and the choice reaction time tasks (Damos & Wickens, 1977; Kosinski & Cummings, 1999; Wifall, Hazeltine, & Mordkoff, 2015).
Visual choice reaction time (CRT) task is usually considered as a complex task consisting of stages, e.g., Woodwart et al. (2014) mention three stages: perceptual analysis, response selection and response production, while Balakrishnan et al. (2014) distinguish four stages: the receipt of information, processing, decision making and motor reaction. The phase of motor reaction is also analysed by Salvia et al. (2016). Some researchers additionally mention a stimulus detection phase (Watanabe et al., 2016; Woods, Wyma, Yund, Herron, & Reed, 2015), for instance Woods et al. (2015) analysed the duration of this stage by subtracting movement initiation time from the simple reaction time.
Research has also shown that reaction times can be shortened through practice (Dye, Green, & Bavelier, 2009). Such training effects have been shown in the context of meditation (Ching, Koo, Tsai, & Chen, 2015), physical exercise (Lieberman et al., 2014), and playing computer games (Ballesteros et al., 2014; Dye et al., 2009). Given the importance of short reaction times for certain tasks, such as driving, it is therefore important to establish the most efficient training paradigms for reducing reaction times both for patients needing neurorehabilitation (Kwon & Kwon, 2013) as well as healthy adults using cognitive training (Bergman, Johansson, Almkvist, & Lundberg, 2016).
In many day-to-day situations consistently fast reaction times are important, such as in driving a vehicle on a busy road. (Inami et al., 2016; Salvia et al., 2016; Desapriya et al., 2014; Sun, Xia, Falkmer, & Lee, 2016). Various professions place strong focus on fast response times, and therefore reaction time testing is a key component in assessments for pilots (Truszczynski, Lewkowicz, Wojtkowiak, & Biernacki, 2014) and cosmonauts (Bock, Weigelt, & Bloomberg, 2010).
RT can vary from trial-to-trial depending on different factors. A number of studies have been published on using RT variability as a potential predictor of psychopathology, including mental disorders and illnesses, such as ADHD (Weigard, Huang-Pollock, & Brown, 2016), autism (Tye et al., 2016) and schizophrenia (Shiraishi, Suzuki, Harada, Suzuki, & Kimura, 2016; Woodward et al., 2014). Reaction time variability in choice reaction time (CRT) task has also been suggested as a marker for CNS damage or neurodegenerative disorders, such as dementia and Parkinson’s (Knopman, 1991; Murtha, Cismaru, Waechter, & Chertkow, 2002).
Studies in different participant groups have shown a number of RT correlates in CRT task, but very few of them have addressed the effect of saccadic efficiency on the overall improvement in task performance (Bunce et al., 2016; Tye et al., 2016; Murtha et al., 2002). Townsend and Ashby described a test procedure with an accompanying description of serial and parallel processing (Townsend & Ashby, 1983, p. 9) where they refer to eye movements as potentially interfering with the results of the procedure. They aimed at eliminating eye movement influence by shortening the time of stimuli exposition (Townsend & Ashby, 1983, p. 116). Our study focused on that influence to analyze oculomotor components.
The above suggests that reduction of reaction times can be achieved through training. However, it is unclear what exactly leads to such shorter reaction times. Here we investigate the role of eye movements in localising the visual target in improvements of reaction times through training. To increase the likelihood of finding effects on eye movements, we used a task in which we presented visual targets randomly in one of the screen corners. Participants performed this task across different sessions, allowing for effect on reaction times and eye movements to be studied. We have been searching for eye tracking correlates of improvement in CRT task and indicators of fatigue influences in the process.
Methods
The aim of this study was to analyse the effect of eye movement efficiency of RT improvement achieved during a one-day CRT task training.
Participants. Eleven unpaid female volunteers consented to participate in this experiment. The mean age of the participants was 22.9 (SD=1.9) and they all met the predefined inclusion criteria, by being right-handed, having right dominant eye, full uncorrected or best corrected visual acuity, no known psychological or mental disorder and by remaining drug and alcohol free at the moment of participation. They were all asked not to make any significant changes to their regular daily routines.
Ethics statement. The experimental procedures were approved by the local Committee of Bioethics.
Experimental design. The test procedure was based on a visual choice reaction time task, in which a set of letters were presented to participants as stimuli (see Figure 1). Participants were instructed to respond with a specific keyboard keystroke (left or right arrow key). Each participant performed 3 sessions during the day: in the morning between 8–9 a.m. (AM), in the afternoon between 3–4 p.m. (NOON), and in the evening between 10–11 p.m. (PM). A single session consisted of 23 trials using Latin alphabet capital letters as stimuli presented on the screen. Each participant was instructed to look at the screen and press the right arrow key when a predefined letter (i.e., target stimulus) was displayed and the left arrow key for all other letters. Different sets of letters and different target letter stimuli were used for each of three sessions and presented to all participants. The target stimulus was displayed four times during each session.
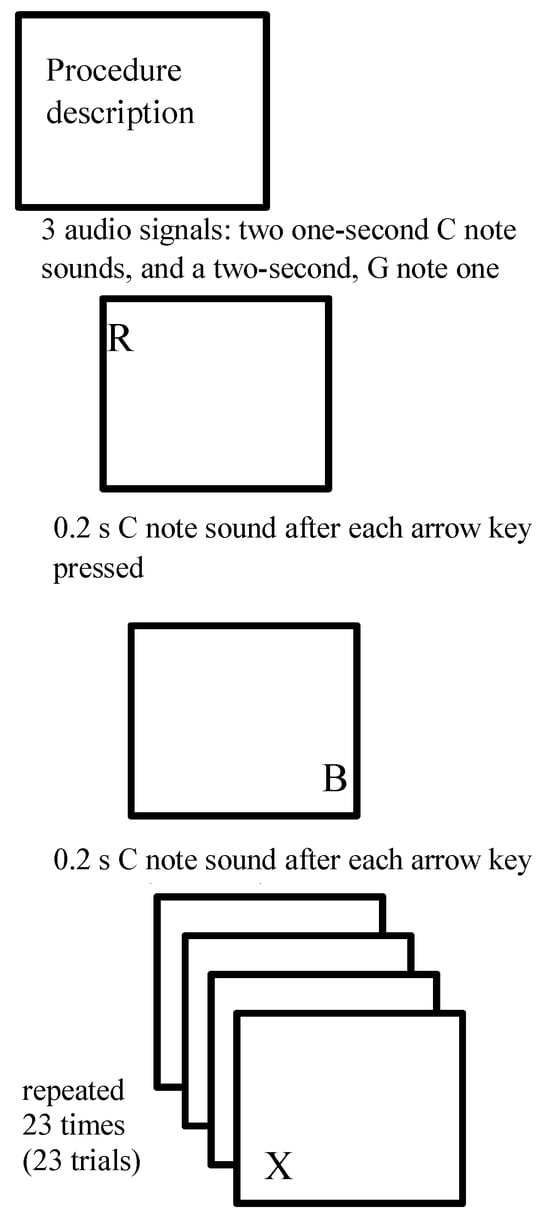
Figure 1.
The sequence of a single session test procedure consisted of 23 trials using Latin alphabet capital letters as stimuli presented on the screen. The participant was looking at the screen and was instructed to press right arrow key when a preselected target letter was displayed and the left arrow key for all other letters. The target letter was shown four times within a single session. The same set of letters within each session were displayed to every participant.
Stimuli. Because we were interested in finding the paradigm that led to the fastest possible reaction times learning process was facilitated by additional auditory stimulation (Davidson & Martin, 2013; Watanabe et al., 2016). At the beginning of the test procedure three audio signals were played. There was also an auditory notification after each key was pressed by the participant. Initially, a signal indicating the beginning of the session was used, consisting of notes C, C and G, played consecutively for one second, one second and two seconds, respectively. The higher pitch at the end of auditory stimulus emphasized the participant’s need to focus as the session was about to begin. Another auditory signal was used after each trial (participant’s keystroke response), (G note, 0.2 s) regardless of response accuracy (see Figure 2). The location of the stimuli on the screen differed; the consecutive single letters were presented randomly in one of the screen corners. Participants had no prior knowledge of the experiment and the possible letter location on the screen.
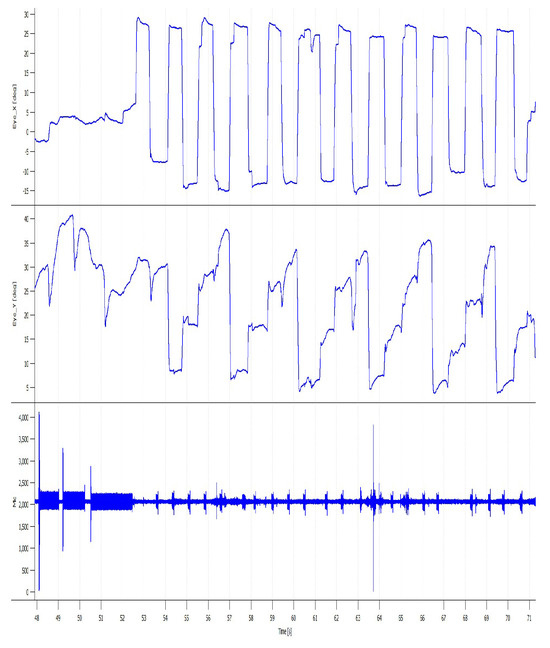
Figure 2.
An exemplary eye-movement recording of a test session with accompanying audio signals. Note that for each target the participant moved their eyes to the target and stayed there until the presentation of the next target.
Apparatus. The stimuli were presented on a 15″ computer screen with a resolution of 1920 x 1080 pixels at 60 Hz. The participants were sat at the distance of 60 cm from the screen. The experimental procedure script written in Python programming language was presented using the PsychoPy v1.83.01 software as a set of predefined stimuli, collecting participant keyboard responses at the same time (Peirce, 2009).
Additionally, eye movements were recorded with the Jazz-novo, a head-mounted infrared oculography-based eye-tracker (Ober et al., 2003). Participant head was stabilized on a chin rest. Before the session commenced for each participant, a standard horizontal and vertical calibration procedure was carried out by the JazzRecorder software (JazzRecorder, 2016). As a part of the calibration, a small cross sign (1° high and wide) was displayed in five predefined places on the screen: the first one in the center and four others towards the upper, lower, left and right edges of the screen. The eye tracker data was calculated and exported using the dedicated JazzManager proprietary software (JazzManager, 2016).
Results
Separate ANOVAs for repeated measurements were performed using the SPSS statistical package for session duration, participant’s average RT, performance quotient and a selection of oculomotor measures provided by the eye-tracking device: saccade count, standard deviation (SD) of saccade duration, maximum saccade duration, minimum saccade amplitude and the duration of fixation. Greenhouse-Geisser corrections were applied when the sphericity assumption was violated. Bonferroni corrected post-hoc tests were calculated and effect sizes were reported as eta squared (η2) values (Cohen, 1988), effect sizes were computed with JASP software (JASP (2016)). In cases where the main effect was not statistically significant, contrast analysis was carried out (Rosnow & Rosenthal, 1989).
The repeated measures ANOVA with a GreenhouseGeisser correction showed a significant effect of time of the day (AM, NOON, PM) on the mean participant RT measured in each session. The mean participant RT expressed in seconds differed significantly [F(1.217, 12.165) = 15.846, p < .001, η2 = 0.613] between AM (M = 0.662, SD = 0.17), NOON (M = 0.534, SD = 0.067) and PM (M = 0.504, SD = 0.085) sessions. Eta-squared values measuring the effect size for the group mean differences were high (Cohen, 1988). Bonferroni-corrected post-hoc tests revealed statistically significant differences in the mean response time between AM—NOON (p < .012) and AM—PM (p < .004) sessions, whereas the NOON—PM response time difference was not significantly significant (p < .152) (Figure 3a).
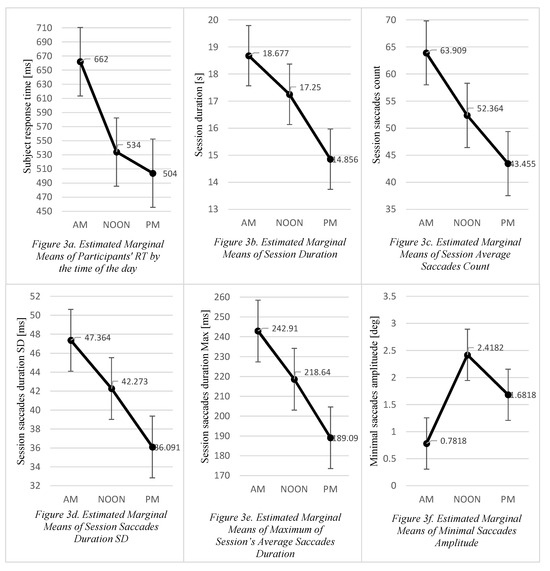
Figure 3.
Subplots (a-f) presenting estimated marginal means. Standard error bars are added as grey lines on each subplot.
Session duration time (DT) was calculated as a sum of 23 trial RTs within a single session. The mean session DTs expressed in seconds differed significantly [F(2, 20) = 6.149, p < .008, η2 = 0.381] between the AM (M = 18.67, SD = 4.02), NOON (M = 17.25, SD = 4.24) and PM (M = 14.86, SD = 1.90) sessions and the effect size was considered high. The post hoc tests confirmed the statistical significance of the DT difference between the AM and PM sessions only (p < .005) (Figure 3b, Figure 5).
Differences between the AM (M = 63.91, SD = 39.38), NOON (M = 52.36, SD = 34.24) and PM (M = 43.46, SD = 8.97) saccade counts were not statistically significant [F(2, 20) = 1.561, p < .234, η2 = 0.135] and the effect size can be considered as high. Although the main effect was not significant, the contrast analysis was carried out to examine the eye movement changes between sessions (Rosnow & Rosenthal, 1989).
It revealed the large effect size for the NOON—AM (p < .304, η2 = 0.105) and PM—AM (p < .127, η2 = 0.217) session differences, so we concluded that the trend was noticeable (Figure 3c).
The differences in the SD of saccade duration between AM (M = 47.36, SD = 17.87), NOON (M = 42.27, SD = 15.07) and PM (M = 36.01, SD = 13.21) sessions were not statistically significant (F(2, 20) = 1.309, p < .292, η2 = 0.292) and the effect size was considered medium. The contrast analysis indicated a meaningful trend in the NOON—AM (p < .508, η2 = 0.045) and PM—AM (p < .179, η2 = 0.173) session data (Figure 3d).
The changes in maximum saccade duration between the three sessions were also analysed. The differences in maximum saccade duration between the AM (M = 242.90, SD = 53.20), NOON (M = 218.64, SD = 55.76) and PM (M = 189.09, SD = 60.10) sessions were not statistically significant (F(2, 20) = 2.573, p < .101, η2 = 0.205) and the effect size was considered large. The contrast analysis confirmed the large effect size for the differences in maximum saccade duration between AM—PM (p < .082, η2 = 0.272) and NOON—PM (p < .087, η2 = 0.265) sessions and as seen in the chart (Figure 3e) the decreasing trend was noticeable.
The differences in minimum saccade amplitudes between the AM (M = 0.782, SD = 0.86), NOON (M = 2.4, SD = 2.70) and PM (M = 1.68, SD = 1.04) sessions were not statistically significant (F(1.210, 12.095) = 2.323, p < .151, η2 = 0.189) and the effect size was considered large. The contrast analysis demonstrated a statistically significant differences in minimum saccade amplitudes between the NOON—PM (p < .451, η2 = 0.058) and AM—PM (p < .026, η2 = 0.406) sessions (Figure 3f).
The differences of participants fixation duration SD between the AM (M = 203.8, SD = 135.70), NOON (M = 184.91, SD = 69.39) and PM (M = 161.18, SD = 66.25) sessions were not statistically significant (F(2, 20) = 5020.394, p < .592, η2 = 0.051), which was further confirmed with contrast analysis.
In order to assess performance efficiency of our participants, we determined a performance quotient (PQ). Our experimental design provided for a response—correct or incorrect to every stimulus, so it was possible to devise a simple metric based on the frequency of correct responses. Hence, the PQ was defined as the number of correct responses in the session duration time, calculated using the following formula
 where ncorrect was the number of correct responses during a given session, ncorrect ϵ (0,23⟩, and t was the session DT expressed in seconds. The mean participant PQ differed significantly between sessions [F(2, 20) = 12.766, p < .001, η2 = 0.561]. The post hoc tests demonstrated statistical significance (p < .05) of differences in PQ between all sessions except for the NOON—PM one (p < .124). Accordingly, we conclude that there was a statistically significant performance improvement between the sessions, except for the NOON-PM difference (Figure 4).
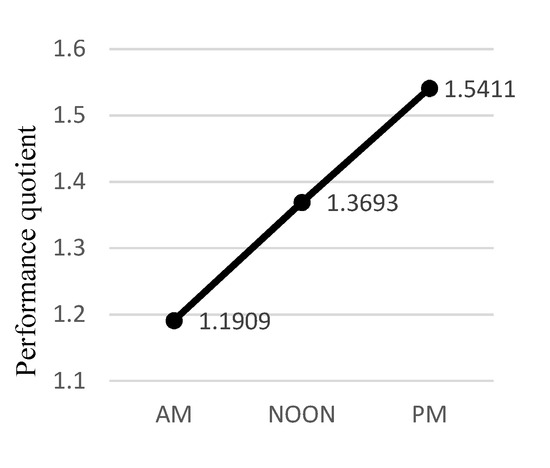
Figure 4.
Estimated Marginal Means for the performance quotient.
To assess whether PQ changes can show how learning speed changed throughout the session, each session was divided into tertiles and the mean RTs for each tertile were calculated. The differences in delta between the 3rd and 1st tertile were statistically significant for all sessions [t-paired test, p < .002]. The PQ value was decreasing in the consecutive sessions.
We have also compared the mean response time for target and non-target stimuli. In each of the three sessions, the RT to target stimuli was longer than for nontarget ones, however the differences were statistically significant only for the PM session [t-paired, t(10) = 3.836 ; p < .003, d Cohen = -1.16].
Discussion
As expected the RTs in every participant varied from trial to trial (Ribeiro, Paiva, & Castelo-Branco, 2016), however the mean RT analysis showed that across all 11 participants, there were significant improvements throughout the experimental procedure. We included the RT and accuracy in our analyses to determine the correlation between these two variables, which is a previously used approach (Davidson & Martin, 2013). Thus we used a simple, correct response frequency-based metric as a participant performance measure (performance quotient, PQ), (see Figure 6).
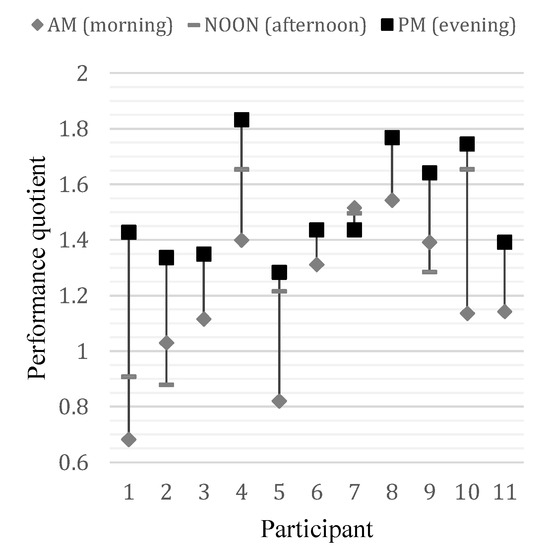
Figure 6.
Performance quotient differences between sessions in every participant. PQ was the highest during the PM session in all but one participant.
Our task required quick visual search within a wide visual field. Therefore, the required eye movements were high amplitude saccades, which are uncommon in everyday activities (Bahill, Clark, & Stark, 1975), yet typical in situations requiring quick response to a visual stimulus, such as some sports (e.g., baseball) and emergency situations, e.g., in aviation, traffic or public safety (Inami et al., 2016; Truszczynski et al., 2014). Despite a relatively short task duration, it required quite extensive effort of the oculomotor component of the visual system, hence the oculomotor learning process was utilized. We have anticipated to observe changes in indicators of participant visual activity with practice. We found the expected differences in saccadic activity: the SD of saccade duration and saccade count (Figure 3c and 3d). The observed modification can be interpreted as indicators of improved saccades efficiency (Meermeier, Gremmler, & Lappe, 2016).
Participant’s fixation on a letter is a prerequisite to recognizing the stimulus and making the decision (Chung, 2002; Kuperman, Drieghe, Keuleers, & Brysbaert, 2013; Perea, Marcet, Uixera, & Ver-gara-Martínez, 2016). Although, reading using peripheral vision is possible (Bernard, Aguilar, & Castet, 2016) it requires at least 6–10 hours of training (Liu & Kwon, 2016). Therefore the recorded changes in eye movements can be interpreted as indicators of improved accuracy in target searching. The decreasing saccade amplitude is linked to increasing accuracy of saccadic eye movements and thus to the lower count of the corrective saccades (Federighi et al., 2011; Munuera, Morel, Duhamel, & Deneve, 2009), (compare Figure 2).
Ribeiro, Paiva, and Castelo-Branco (2016) analysed the sensory processing stage stating that the variability of RT in each trial was linked to a visual sensory process. Having examined the association between the visual evoked potentials (VEP) in a single trial and inter-trial RT variability, they were able to draw conclusions about the cortical activity. Our analysis suggests that two sources of stimulus reaching phase can be distinguished at visual search stage: peripheral field detection, which can be explained with the “pop-out” effect (Duchowski, 2007, p. 225) and saccadic movement to the target with potential corrective saccades if needed. With participant familiarization with the procedure, a visual strategy started emerging: they learned that letters could appear only at a particular positions on the screen, so they minimized saccadic movement error with practice. Similar conclusions were presented by Meermeier et al. (2016).
Furthermore, the eye movement analysis demonstrated indicators of changes in fixation time. Although these changes were not statistically significant there was a noticeable trend. Fixation time can be discussed in terms of its links to attention and information processing (Deubel, 2008; Parkhurst, Law, & Niebur, 2002). Therefore reduced fixation time as the participant gets familiarized with the procedure can be interpreted as consistent with research showing the significance of processing phase in RT decrease (Salvia et al., 2016; Watanabe et al., 2016). Despite the generally better performance in the CRT task and more efficient execution of it within a particular session, the learning effect was decreasing after each session due to the effect of fatigue, which was analysed from differences between session tertiles (Figure 7).
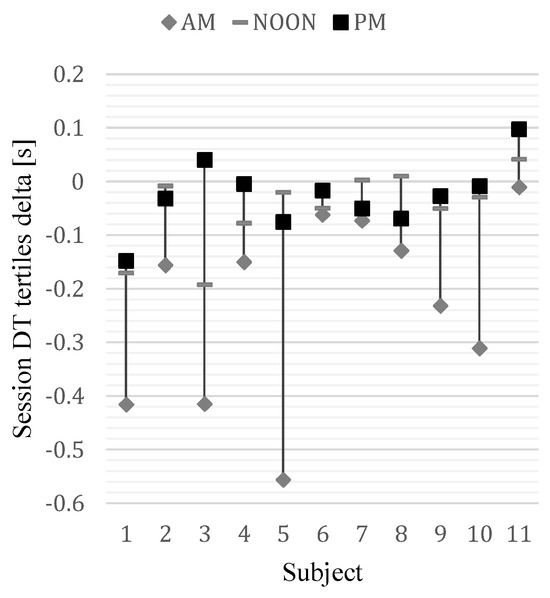
Figure 7.
Differences in session duration tertiles (3rd vs 1st) in each session of every participant.
We have observed the phenomenon previously reported by Yabe and Goodale (2015) that the mean RT to target stimuli tended to be longer than to the non-target stimuli, however in our study the differences were statistically significant only for the evening session (PM). According to Yabe and Goodale (2015), the difference is attributable to programming rather than execution of the action. Our analysis also supports that conclusion indicating the disturbance of the process involving the inhibition of the frequently repeated, non-target reaction and the switch to a different, less automated, target one.
Conclusions
The performance of our participants during the visual CRT task done in a relatively short time of a single day has improved while the principles of learning such as repetition and auditory stimulation of RT during consecutive sessions were maintained.
Performance improvement in the task requiring an intensive scan of the visual field, perceptiveness and proper reaction to a stimulus is partially attributable to learning the exact location of the anticipated stimulus (Hoffman & Subramaniam, 1995). Our findings suggest that the eye movement aspect should also be taken into account when examining changes in RT to a visual stimulus in CRT task.
Acknowledgments
This research was funded by Pomeranian Medical University through a non-commercial Program for Science Facilitation.
The authors declare that there is no conflict of interest regarding the publication of this paper.
The authors gratefully acknowledge the assistance of Karolina Kalisz, in proofreading the manuscript.
References
- Antonova, I., C. van Swam, D. Hubl, T. Dierks, I. Griskova-Bulanova, and T. Koenig. 2016. Reaction Time in a Visual 4-Choice Reaction Time Task: ERP Effects of Motor Preparation and Hemispheric Involvement. Brain Topography 29, 4: 491–505. [Google Scholar] [CrossRef] [PubMed]
- Baayen, R. H., and P. Milin. 2015. Analyzing reaction times. International Journal of Psychological Research 3, 2: 12–28. [Google Scholar] [CrossRef]
- Bahill, A. T., M. R. Clark, and L. Stark. 1975. The main sequence, a tool for studying human eye movements. Mathematical Biosciences 24, 3: 191–204. [Google Scholar] [CrossRef]
- Balakrishnan, G., G. Uppinakudru, G. Girwar Singh, S. Bangera, A. Dutt Raghavendra, and D. Thangavel. 2014. A Comparative Study on Visual Choice Reaction Time for Different Colors in Females. Neurology Research International. [Google Scholar] [CrossRef]
- Ballesteros, S., A. Prieto, J. Mayas, P. Toril, C. Pita, L. Ponce de León, and J. Waterworth. 2014. Brain training with non-action video games enhances aspects of cognition in older adults: A randomized controlled trial. Frontiers in Aging Neuroscience 6. [Google Scholar] [CrossRef]
- Bergman, I., K. Johansson, O. Almkvist, and C. Lundberg. 2016. Health-adjusted neuropsychological test norms based on 463 older Swedish car drivers. Scandinavian Journal of Psychology 57, 2: 93–107. [Google Scholar] [CrossRef]
- Bernard, J.-B., C. Aguilar, and E. Castet. 2016. A New Font, Specifically Designed for Peripheral Vision, Improves Peripheral Letter and Word Recognition, but Not Eye-Mediated Reading Performance. PLoS ONE 11, 4: e0152506. [Google Scholar] [CrossRef]
- Bock, O., C. Weigelt, and J. J. Bloomberg. 2010. Cognitive Demand of Human Sensorimotor Performance During an Extended Space Mission: A Dual-Task Study. Aviation, Space, and Environmental Medicine 81, 9: 819–824. [Google Scholar] [CrossRef]
- Bunce, D., B. I. Haynes, S. R. Lord, Y. J. Gschwind, N. A. Kochan, S. Reppermund, and K. Delbaere. 2016. Intraindividual Stepping Reaction Time Variability Predicts Falls in Older Adults With Mild Cognitive Impairment. The Journals of Gerontology Series A: Biological Sciences and Medical Sciences, glw164. [Google Scholar] [CrossRef]
- Ching, H.-H., M. Koo, T.-H. Tsai, and C.-Y. Chen. 2015. Effects of a Mindfulness Meditation Course on Learning and Cognitive Performance among University Students in Taiwan. Evidence-Based Complementary and Alternative Medicine: eCAM. [Google Scholar] [CrossRef]
- Chung, S. T. L. 2002. The Effect of Letter Spacing on Reading Speed in Central and Peripheral Vision. Investigative Ophthalmology & Visual Science 43, 4: 1270–1276. [Google Scholar]
- Cohen, J. 1988. Statistical power analysis for the behavior science. Lawrance Eribaum Association. [Google Scholar]
- Damos, D. L., and C. D. Wickens. 1977. Dual-task performance and the hick-hyman law of choice reaction time. Journal of Motor Behavior 9, 3: 209–215. [Google Scholar] [CrossRef] [PubMed]
- Davidson, D. J., and A. E. Martin. 2013. Modeling accuracy as a function of response time with the generalized linear mixed effects model. Acta Psychologica 144, 1: 83–96. [Google Scholar] [CrossRef] [PubMed]
- Desapriya, E., R. Harjee, J. Brubacher, H. Chan, D. S. Hewapathirane, S. Subzwari, and I. Pike. 2014. Vision screening of older drivers for preventing road traffic injuries and fatalities. The Cochrane Database of Systematic Reviews (2): CD006252. [Google Scholar] [CrossRef]
- Destrebecqz, A., P. Perruchet, A. Cleeremans, S. Laureys, P. Maquet, and P. Peigneux. 2010. The influence of temporal factors on automatic priming and conscious expectancy in a simple reaction time task. The Quarterly Journal of Experimental Psychology 63, 2: 291–309. [Google Scholar] [CrossRef]
- Deubel, H. 2008. The time course of presaccadic attention shifts. Psychological Research 72, 6: 630–640. [Google Scholar] [CrossRef]
- Duchowski, A. T. 2007. Eye tracking methodology: Theory and practice, 2nd ed. London: Springer. [Google Scholar]
- Dye, M. W. G., C. S. Green, and D. Bavelier. 2009. Increasing Speed of Processing With Action Video Games. Current Directions in Psychological Science 18, 6: 321–326. [Google Scholar] [CrossRef]
- Federighi, P., G. Cevenini, M. T. Dotti, F. Rosini, E. Pretegiani, A. Federico, and A. Rufa. 2011. Differences in saccade dynamics between spinocerebellar ataxia 2 and late-onset cerebellar ataxias. Brain 134, 3: 879–891. [Google Scholar] [CrossRef]
- Hoffman, J. E., and B. Subramaniam. 1995. The role of visual attention in saccadic eye movements. Perception & Psychophysics 57, 6: 787–795. [Google Scholar] [CrossRef]
- Hsieh, Y.-H., C. J. Lin, and H.-C. Chen. 2007. Effect of vibration on visual display terminal work performance. Perceptual and Motor Skills 105, 3 Pt 2: 1055–1058. [Google Scholar] [CrossRef] [PubMed]
- Inami, A., R. Matsuda, T. Grobosch, H. Komamura, K. Takeda, Y. Yamada, and M. Tashiro. 2016. A simulated car-driving study on the effects of acute administration of levocetirizine, fexofenadine, and diphenhydramine in healthy Japanese volunteers. Human Psychopharmacology 31, 3: 167–177. [Google Scholar] [CrossRef] [PubMed]
- JASP Team. 2016. JASP (Version 0.7.5.6). Available online: https://jasp-stats.org.
- Jones, S. A. H., B. C. Butler, F. Kintzel, A. Johnson, R. M. Klein, and G. A. Eskes. 2016. Measuring the Performance of Attention Networks with the Dalhousie Computerized Attention Battery (DalCAB): Methodology and Reliability in Healthy Adults. Frontiers in Psychology 7: 823. [Google Scholar] [CrossRef]
- Knopman, D. 1991. Long-term retention of implicitly acquired learning in patients with Alzheimer’s disease. Journal of Clinical and Experimental Neuropsychology 13, 6: 880–894. [Google Scholar] [CrossRef]
- Kosinski, B., and J. Cummings. 1999. The scientific method: An introduction using reaction time. Tested Studies for Laboratory Teaching (ABLE Proceedings) 25: 219–234. [Google Scholar]
- Kuperman, V., D. Drieghe, E. Keuleers, and M. Brysbaert. 2013. How strongly do word reading times and lexical decision times correlate? Combining data from eye movement corpora and megastudies. Quarterly Journal of Experimental Psychology (2006) 66, 3: 563–580. [Google Scholar] [CrossRef]
- Kwon, Y. H., and J. W. Kwon. 2013. Is transcranial direct current stimulation a potential method for improving response inhibition? Neural Regeneration Research 8, 11: 1048–1054. [Google Scholar] [CrossRef]
- Land, W. M. 2016. Action Effects and Task Knowledge: The Influence of Anticipatory Priming on the Identification of Task-Related Stimuli in Experts. PLoS ONE 11, 6. [Google Scholar] [CrossRef]
- Lieberman, H. R., J. P. Karl, P. J. Niro, K. W. Williams, E. K. Farina, S. J. Cable, and J. P. McClung. 2014. Positive Effects of Basic Training on Cognitive Performance and Mood of Adult Females. Human Factors: The Journal of the Human Factors and Ergonomics Society 56, 6: 1113–1123. [Google Scholar] [CrossRef]
- Liu, R., and M. Kwon. 2016. Integrating oculomotor and perceptual training to induce a pseudofovea: A model system for studying central vision loss. Journal of Vision 16, 6: 10. [Google Scholar] [CrossRef]
- Luce, R. D. 1991. Response Times: Their Role in Inferring Elementary Mental Organization. Oxford University Press. [Google Scholar]
- Meermeier, A., S. Gremmler, and M. Lappe. 2016. The influence of image content on oculomotor plasticity. Journal of Vision 16, 8: 17. [Google Scholar] [CrossRef] [PubMed][Green Version]
- Munuera, J., P. Morel, J.-R. Duhamel, and S. Deneve. 2009. Optimal Sensorimotor Control in Eye Movement Sequences. The Journal of Neuroscience 29, 10: 3026–3035. [Google Scholar] [CrossRef] [PubMed]
- Murtha, S., R. Cismaru, R. Waechter, and H. Chertkow. 2002. Increased variability accompanies frontal lobe damage in dementia. Journal of the International Neuropsychological Society 8, 3: 360–372. [Google Scholar] [CrossRef] [PubMed]
- Parkhurst, D., K. Law, and E. Niebur. 2002. Modeling the role of salience in the allocation of overt visual attention. Vision Research 42, 1: 107–123. [Google Scholar] [CrossRef]
- Peirce, J. W. 2009. Generating stimuli for neuroscience using PsychoPy. Frontiers in Neuroinformatics 2: 10. [Google Scholar] [CrossRef]
- Perea, M., A. Marcet, B. Uixera, and M. Vergara-Martínez. 2016. Eye movements when reading sentences with handwritten words. Quarterly Journal of Experimental Psychology (2006), 1–25. [Google Scholar] [CrossRef]
- Ribeiro, M. J., J. S. Paiva, and M. Castelo-Branco. 2016. Spontaneous Fluctuations in Sensory Processing Predict Within-Subject Reaction Time Variability. Frontiers in Human Neuroscience 10: 200. [Google Scholar] [CrossRef]
- Rosnow, R. L., and R. Rosenthal. 1989. Statistical procedures and the justification of knowledge in psychological science. American Psychologist 44, 10: 1276–1284. [Google Scholar] [CrossRef]
- Salvia, E., C. Petit, S. Champely, R. Chomette, F. Di Rienzo, and C. Collet. 2016. Effects of Age and Task Load on Drivers’ Response Accuracy and Reaction Time When Responding to Traffic Lights. Frontiers in Aging Neuroscience 8. [Google Scholar] [CrossRef]
- Shiraishi, E., K. Suzuki, A. Harada, N. Suzuki, and H. Kimura. 2016. The Phosphodiesterase 10A Selective Inhibitor TAK-063 Improves Cognitive Functions Associated with Schizophrenia in Rodent Models. The Journal of Pharmacology and Experimental Therapeutics 356, 3: 587–595. [Google Scholar] [CrossRef]
- Sun, Q., J. (Cecilia) Xia, T. Falkmer, and H. Lee. 2016. Investigating the Spatial Pattern of Older Drivers’ Eye Fixation Behaviour and Associations with Their Visual Capacity. Journal of Eye Movement Research 9, 6. [Google Scholar] [CrossRef]
- Townsend, J. T., and F. G. Ashby. 1983. Stochastic Modeling of Elementary Psychological Processes. CUP Archive. [Google Scholar]
- Truszczynski, O., R. Lewkowicz, M. Wojtkowiak, and M. P. Biernacki. 2014. Reaction time in pilots during intervals of high sustained g. Aviation, Space, and Environmental Medicine 85, 11: 1114–1120. [Google Scholar] [CrossRef] [PubMed]
- Tuch, A. N., J. A. Bargas-Avila, K. Opwis, and F. H. Wilhelm. 2009. Visual complexity of websites: Effects on users’ experience, physiology, performance, and memory. International Journal of Human-Computer Studies 67, 9: 703–715. [Google Scholar] [CrossRef]
- Tye, C., K. A. Johnson, S. P. Kelly, P. Asherson, J. Kuntsi, K. L. Ashwood, and G. McLoughlin. 2016. Response time variability under slow and fastincentive conditions in children with ASD, ADHD and ASD+ADHD. Journal of Child Psychology and Psychiatry. [Google Scholar] [CrossRef]
- Watanabe, T., K. Ishida, S. Tanabe, and I. Nojima. 2016. Preparatory state and postural adjustment strategies for choice reaction step initiation. Neuroscience 332: 140–148. [Google Scholar] [CrossRef]
- Weigard, A., C. Huang-Pollock, and S. Brown. 2016. Evaluating the consequences of impaired monitoring of learned behavior in attention-deficit/hyperactivity disorder using a Bayesian hierarchical model of choice response time. Neuropsychology 30, 4: 502–515. [Google Scholar] [CrossRef]
- Wifall, T., E. Hazeltine, and J. T. Mordkoff. 2015. The roles of stimulus and response uncertainty in forcedchoice performance: An amendment to Hick/Hyman Law. Psychological Research 80, 4: 555–565. [Google Scholar] [CrossRef]
- Woods, D. L., J. M. Wyma, E. W. Yund, T. J. Herron, and B. Reed. 2015. Factors influencing the latency of simple reaction time. Frontiers in Human Neuroscience 9. [Google Scholar] [CrossRef]
- Woodward, N. D., B. Duffy, and H. Karbasforoushan. 2014. Response selection impairment in schizophrenia transcends sensory and motor modalities. Schizophrenia Research 152: 446–449. [Google Scholar] [CrossRef][Green Version]
- Yabe, Y., and M. A. Goodale. 2015. Time Flies When We Intend to Act: Temporal Distortion in a Go/NoGo Task. The Journal of Neuroscience 35, 12: 5023–5029. [Google Scholar] [CrossRef]

© 2016 by the authors. Licensee MDPI, Basel, Switzerland. This article is an open access article distributed under the terms and conditions of the Creative Commons Attribution (CC BY) license (https://creativecommons.org/licenses/by/4.0/).