Introduction
Today, an interesting research and design topic in human computer interaction is the use of the eye as an input device in graphical user interfaces (
Jacob, 1991;
Vertegaal, 2008;
Ware & Mikaelian, 1987). The use of the eyes as a pointing device has been proposed to improve human quality of life, especially for the disabled, because eye movement involves some of the fastest muscles in the human body (
Bobick & Balaban, 2008) and users can detect an object before initiating and moving the hand (
Jacob, 1991). Research also shows the eye can perform repetitive actions (
Vertegaal, 2008). In addition to the needs of the disabled, using the eye as a potential pointing device is advantageous because the hands of the user can be free for other tasks.
To study whether eye movements can be reliably used as a pointing device, the Fitts’ law model has been widely used (
Fitts, 1954). Fitts’ law has been shown to be a reliable predictor of eye movement time for rapid aiming tasks, selected tasks, and head movements (
Chi & Lin, 1997;
Radwin, Vanderheiden, & Lin, 1990). Often, the movement time is found to be a linear function of the movement task difficulty and a regression r
2 value is used to indicate how well the linear function fits the data. Several reported eye pointing performance studies in terms of the Fitts’ law model are presented as follow.
In 1999, Zhai, Morimoto, & Ihde conducted a study to show that the MAGIC (Mouse and Gaze Input Cascaded) pointing technique might reduce physical effort and fatigue, increase the accuracy level of pointing, and possibly increase movement speed as compared to traditional pointing. The study used Fitts’ law to model the eye movement time and found that the r
2 values ranged from 0.716 to 0.912 in different conditions, indicating a reliable performance using the eye as a pointing device.
Miniotas (
2000) reported the application of Fitts’ law to eye gaze interaction. In that study, subjects moved the 2D cursor inside the target ribbon on a display using their eyes. The results indicated the r
2 values were as high as 0.991.
Vertegaal (
2008) conducted research on a screen pointing technique by comparing two manual devices (mouse and stylus) with eye pointing. The results of the Fitts’ law model showed that the r
2 values were 0.99 for the mouse, 0.98 for the stylus, 0.87 for eye pointing and clicking with a mouse, and, 0.99 for eye pointing with eye dwelling as the clicking action. Based on these reported models of eye movements, the eye shows promise as a pointing device. However, most of the previous studies were conducted in a 2D (non-stereoscopic or 3D) visual display environment.
Today, 3D computing technology allows virtual images and objects to be created and displayed such that the user can navigate within and interact with the virtual reality environment (
Vince, 2004). Applications of virtual reality are implemented in the military, phobia therapy, entertainment (
Bowman & McMahan, 2007), medical surgery simulation (
Bogdanova, Boulanger, & Zheng, 2015), and manufacturing (
Nee, Ong, Chryssolouris, & Mourtzis, 2012) where interaction with virtual images and objects is needed. In virtual reality applications, pointing to a virtual object is typically achieved with an input device that acts as an intermediary between the users and the graphical object being pointed to. Eye pointing may be a potential user interface in virtual reality based on the high performance of pointing found previously in most 2D studies. In 3D environments, the eye will be used to perceive depth information. Whether this change in environment will affect the performance of eye pointing is unknown.
One common display technology used in virtual reality systems is the stereoscopic display, in which users are able to see 3D virtual objects at different depths from the eye. The depth perception is based on the binocular disparity of vision, which is defined by the positional difference between two retina projections on the fixation points in the fovea (
Bogdanova, Boulanger, & Zheng, 2015). When the eyes see the objects from different angles, the eyeballs rotate inwards (converge) and outwards (diverge), and the two optical axes meet, allowing the viewer to perceive the depths of objects at different distances (
Bogdanova, Boulanger, & Zheng, 2015). During eye pointing in stereoscopic viewing, this convergence may be affected immediately after the eye tries to point to a certain target. The interaction between convergence to perceive depth in a virtual environment and movement of the eye to point to a target may thus affect the pointing performance of the eye in stereoscopic conditions. Further, in the 3D display, vergence accommodation conflict tended to reduce the ability to fuse the binocular stimulus and caused discomfort and fatigue for the viewer (
Hoffman, Girshick, Akeley, & Banks, 2008). This problem might also affect the pointing performance of the eye in 3D environment.
Additionally, several other major perception problems may also affect the performance of eye pointing in stereoscopic conditions. These include difficulties with stereovision based on binocular disparity perception and differences of interpupillary distance (
Craig, 2013). Discomfort and visual fatigue can affect the physiological and psychological demands on the perception of 3D or stereoscopic conditions (
Urvoy, Barkowsky, & Le Callet, 2013).
Lin and Woldegiorgis (
2015) identified the main problems in stereoscopic displays: distance estimation and visual discomfort. They stated that inaccurate distance estimation is caused by the distance perception tasks, the quality of computer graphics, stereoscopic conditions, experience with virtual reality, and distance cues.
Since perceptual and interactive limitations exist in stereoscopic conditions, as documented in the literature, eye pointing performance may not be as good in stereoscopic displays as in 2D display environment. Therefore, we investigated the effects of stereoscopic display on eye pointing performance with the Fitts’ law tapping task in the 3D visual environment.
Method
This study was conducted using the typical reciprocal tapping task (
ISO, 2000) in a stereoscopic display. The participants were required to move the 3D cursor to a ball, similarly to the pointing task using a mouse in a desktop computer display, except that this task was performed in a 3D environment. Eye movement was recorded with an eye tracker simultaneously during the time the hand moved the 3D cursor. We used three different levels of parallax to vary the perceived depth of the virtual ball; that is, a 3D virtual ball appearing at the screen, 20 cm in front of the screen, or 50 cm in front of the screen. All of the experiments were conducted in a completely random order for each participant.
Participants
Seven male and three female graduate students at the National Taiwan University of Science and Technology were recruited as participants in this study. Their mean age was 25 years with a standard deviation of four years. All participants had normal or corrected to normal visual acuity (1.0 in decimal units), and they could see the object clearly in the stereoscopic display. All volunteered for this study and received no monetary reward. The experiment was conducted according to the ethical guidelines of the Research Ethics Committee of National Taiwan University. All participants filled out a consent form prior to participating in the study.
Apparatus and Stimuli
The Tobii X2-60 Eye Tracker was used as a remote eye tracker at a sampling rate of 60 Hz. The fixation filter setting used in this device was Velocity-Threshold Identification (I-VT) (
Salvucci & Goldberg, 2000). The velocity threshold implemented in this study was 30°/sec (
Goldberg, 2014). The accuracy of the eye tracker device was 0.4 degrees of visual angle. Tobii’s Studio eye tracking was used as the analysis package software.
The participant was asked to wear a pair of ViewSonic 3D glasses PDF-250, which was integrated with a 3D Vision IR Emitter NVIDIA and 3D ViewSonic (PJD6251) projector in order to perceive the stereoscopic 3D environment. The tapping task was developed on the Unity 3D platform (version 4.3.4) and processed on a PC Asus Windows Core i5. During the experiment, a Logitech webcam C-920 recorded the screen display which was integrated with the Tobii eye tracker, to record the fixation point and eye movement.
Figure 1 shows the experimental layout of this study. Participants sat at 64 cm in front of the Tobii Eye Tracker. The ViewSonic 3D projector was placed 89 cm from the screen. The participant wore the ViewSonic 3D glasses in order to visualize the 3D objects. The entire experiment room was 3.6 m x 3.2 m x 2.5 m and had black curtains and walls to avoid unwanted light and to create an excellent stereoscopic environment.
Experimental Variables
Fitts’ law is a model of human psychomotor behavior (
Fitts, 1954) and it discovers a formal relationship between the movement time, target width and the required amplitude to reach the target. This study used reciprocal tapping, which requires the user to hit the ball presented in a virtual environment. A general mathematical formulation of Fitts’ Law (
Fitts & Peterson, 1964) is presented in Equation (1).
Movement time was the time taken from hitting the origin ball to hit the destination ball. This study examined and compared the movement of the hand and the eye gaze in a stereoscopic task. The tapping test was used to measure the pointing performance of the hand and the eye in different directions.
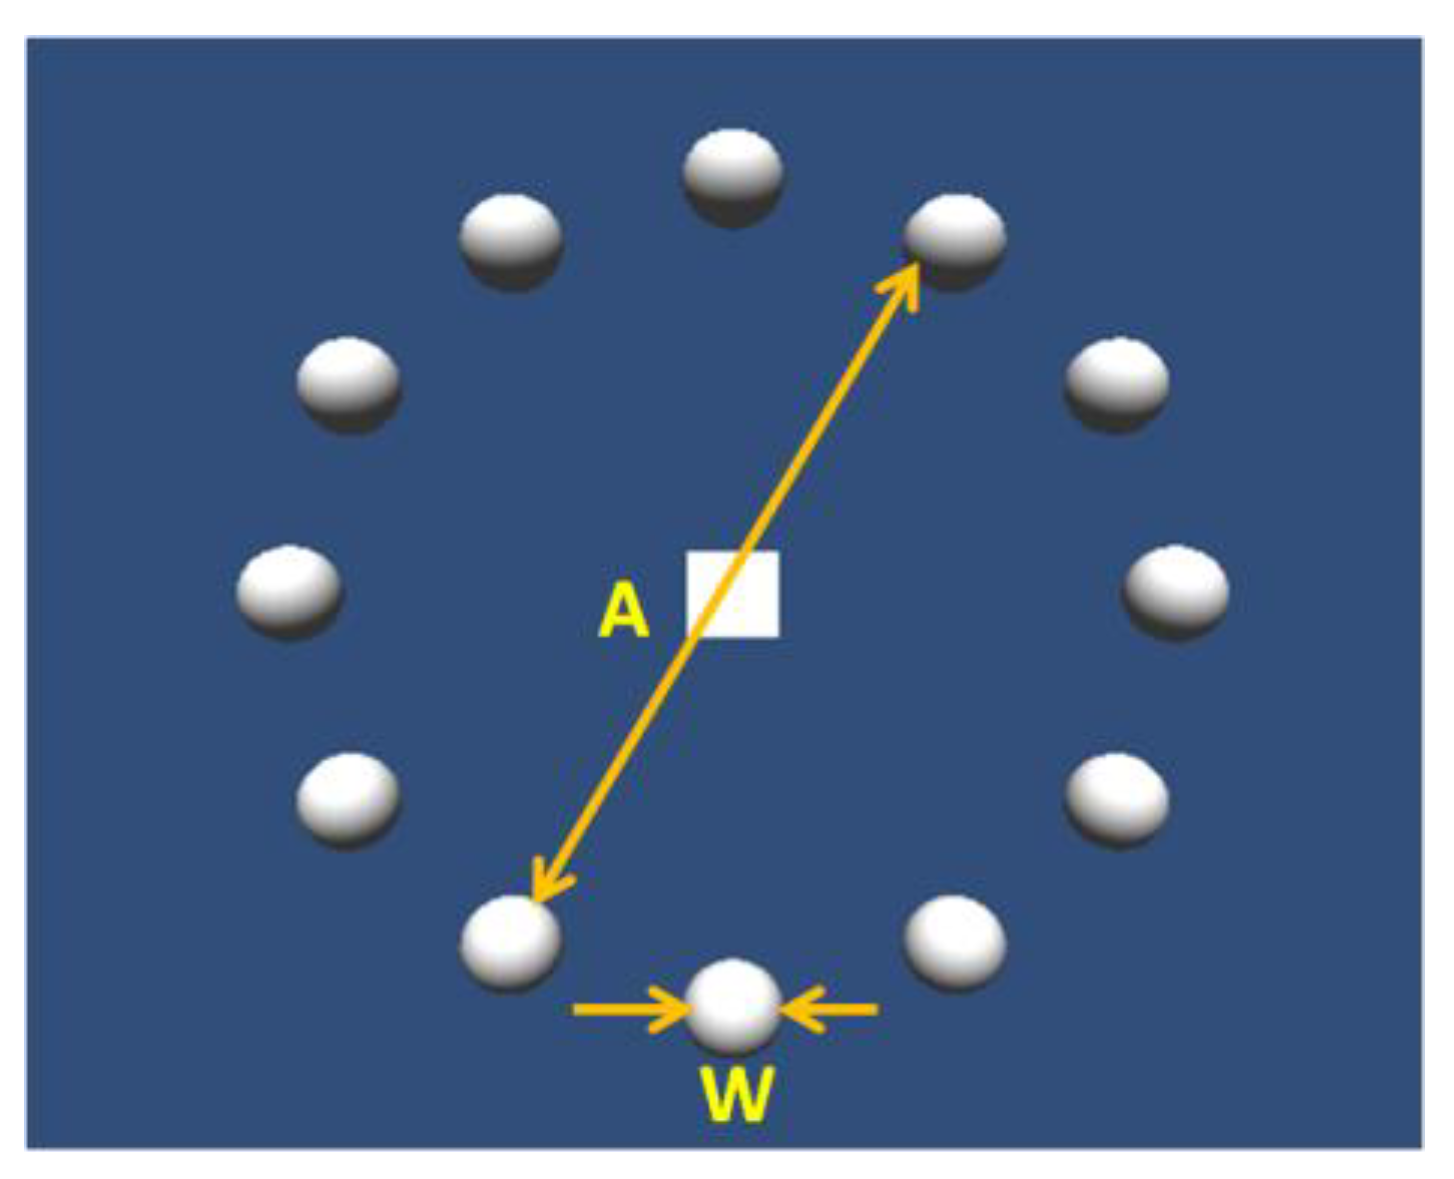
Figure 2 shows an illustration of the tapping task consisting of 12 balls. Tapping task is suggested for the evaluation of the usability of the non-keyboard input device (
ISO, 2000). In the tapping task, participants should hit all the balls as fast and as accurate as possible (
Hourcade, Bederson, Druin, & Guimbretière, 2004).
In this test the participant was required to move the cursor across a large circle to sequentially numbered balls. As shown in
Figure 2, the target object is a small ball around the circumference of the large circle and each ball was equally spaced, so that the distance of the movements are nearly equal to the diameter of the large circle (
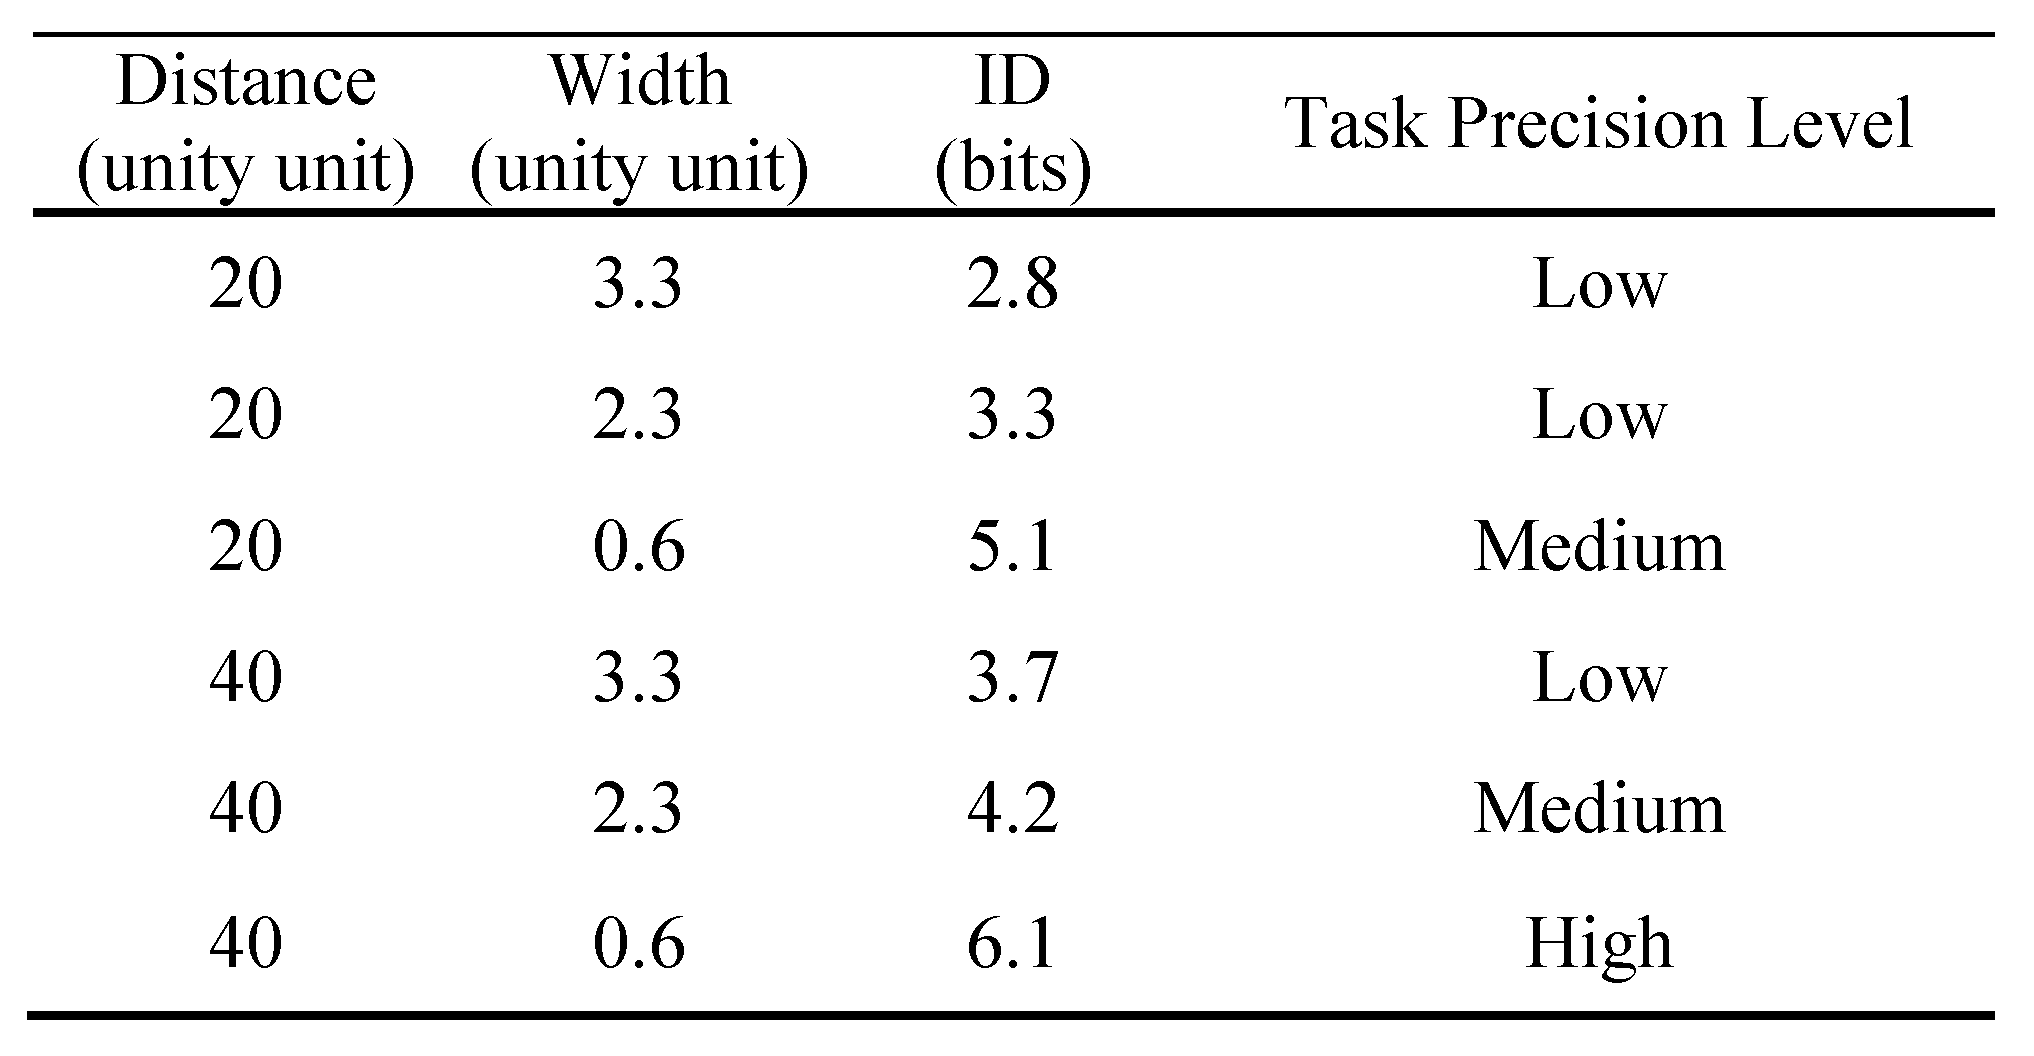
ISO, 2000). The tapping task was conducted in six levels of difficulty by varying the width (diameter of the ball) and amplitude (diameter of the large circle). The six levels of difficulty were decided based on object width (the ball) and amplitude of movement distance (the diameter of the large circle).
Index of difficulty indicates task difficulty and precision level determined by movement distance and object width (
Park, Hong, & Lee, 2012) in the tapping task. Based on the classification of task precision in ISO 9241-9, it was classified into three levels to measure the accuracy for pointing task, specifically low, medium, and high precision levels. Low, medium, and high levels of precision are an index of difficulty less than or equal to 4, greater than or equal to 6, and greater than 6.
Table 1 shows the index of difficulty of the tapping tasks. The tapping tasks had six levels of index of difficulty. In
Table 1, index of difficulty (
Fitts & Peterson, 1964) is calculated in bits by:
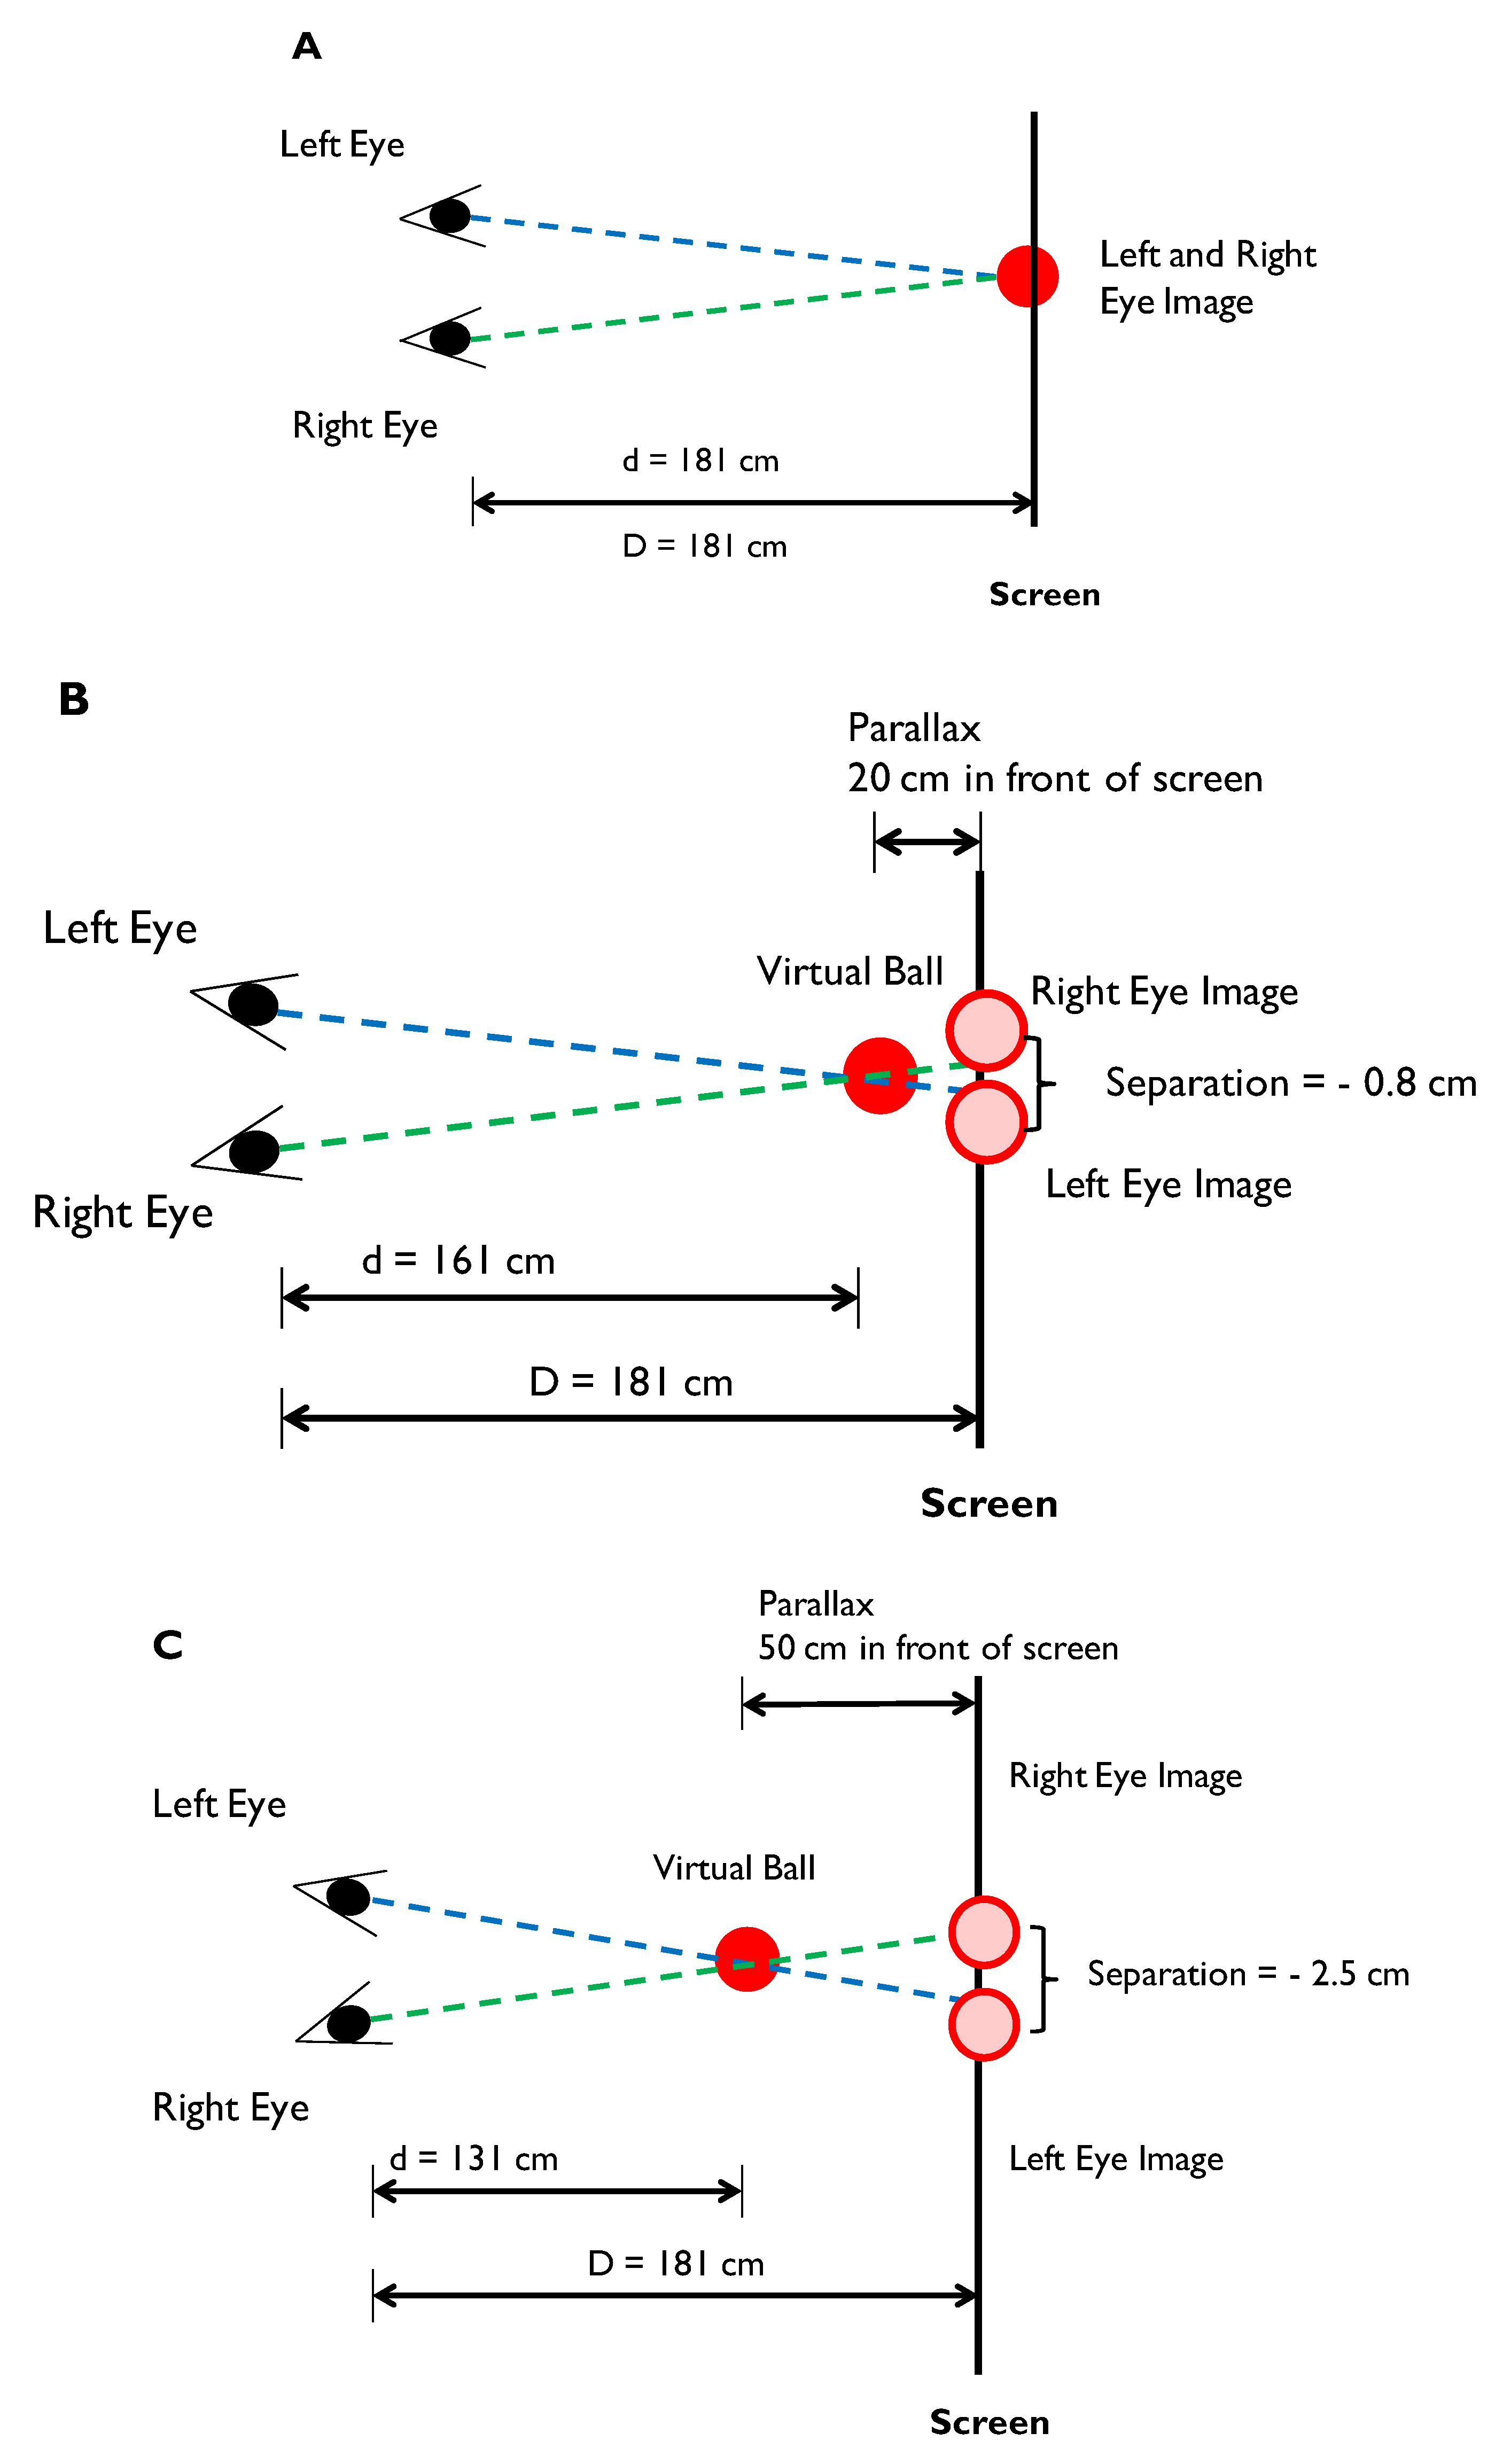
The independent variable for this study was the parallax, which was set to make the virtual ball to appear at a position between the participant’s eyes and the screen. A 3D projector was used to create a virtual image of a ball in the air. The image of the balls were separated horizontally into two images and projected at the screen. The following Equation 3 expresses the horizontal separation of the two images at the screen (
Seigle, 2009).
Figure 3A presents an illustration of the first parallax condition in which the virtual ball appears at the screen. The two images were projected at the same location at the screen with a separation value 0. In this study, a virtual ball appeared 20 cm and 50 cm in front of the screen as the second and third parallax conditions. Based on the calculation result from Equation 3, the horizontal separation for two images projected in the screen was 0.8 cm and 2.5 cm for the virtual balls appeared 20 cm and 50 cm in front of the screen (See.
Figure 3B and
Figure 3C), respectively. Greater horizontal separation (parallax) of the two images at the screen brought the virtual image closer to the participant’s eyes.
The dependent variables were hand movement time, eye gaze movement time, error rate, index of performance (IP) for hand clicks and IP for eye gaze. Hand movement time was measured as the time taken from the starting ball to the destination ball using the mouse 3D cursor provided in the tapping task. The participant was required to click on the mouse button as soon as the ball was reached. Eye gaze movement data were collected with an eye tracker. Eye gaze movement time was the elapsed time from the fixation point of the eye on the starting ball to the fixation point on the destination ball. An algorithm, described in more details in Data collection and analyses, was used to select the appropriate eye fixation points for the eye movement.
Index of performance was calculated by dividing the index of difficulty (ID) by the movement time, as shown in Equation 4 (
MacKenzie, 1992).
IP is the information processing rate of human motor system (
MacKenzie, 1992). The IP values show the glob-al index of participant performance, which considers speed and accuracy. The higher values of IP indicate high performance of accuracy and speed, i.e., the participant performs the task with high speed and accuracy.
In this study, both movement time and percentage error were measured. An error was made when there was a click outside the target ball. The participant was re-quired to click inside the ball again until there was a hit. If no error was made, the total number of clicks was 12 because there were 12 balls to finish. The percentage error was thus estimated using Equation 5.
Procedure
Prior to the experiment, participants filled out participant consent forms, which explained the purpose, procedure, and experimental task of this study. The participant then individually entered the experiment room, where they were immersed in a completely dark environment except for the projected virtual balls. Each participant sat on the chair stably and wore the ViewSonic 3D glasses.
In the beginning of the experiment, a calibration procedure was performed for each participant to ensure that the Tobii eye tracker detected the participant’s eye movement. We used the regular calibration setting from Tobii eye tracker with five red dots shown as default to capture the participant’s eye gaze binocularly. The experimental task was then displayed in the stereoscopic environment. The participant was required to click 12 balls as the target object in the tapping task, with a mouse, and the participant’s eye movements were recorded by the eye tracker simultaneously.
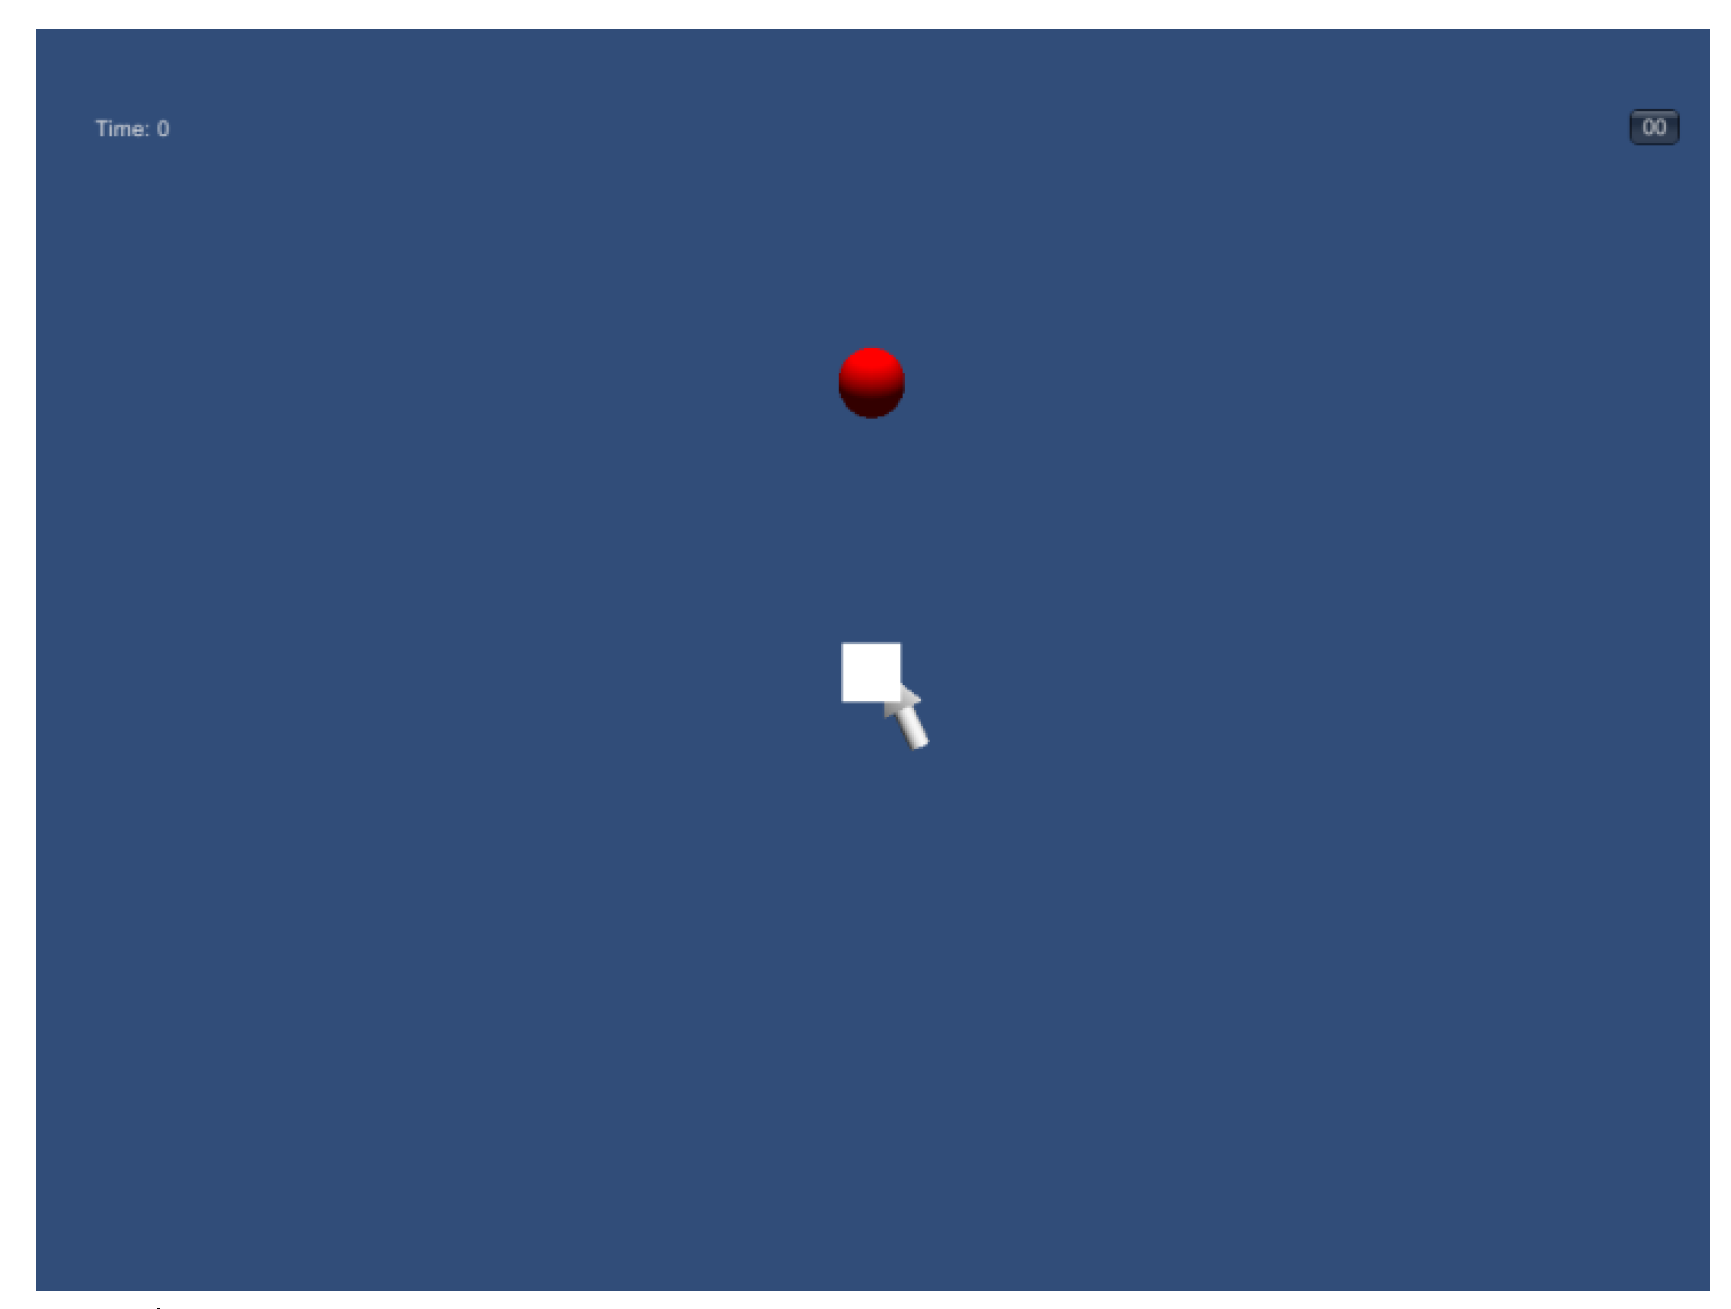
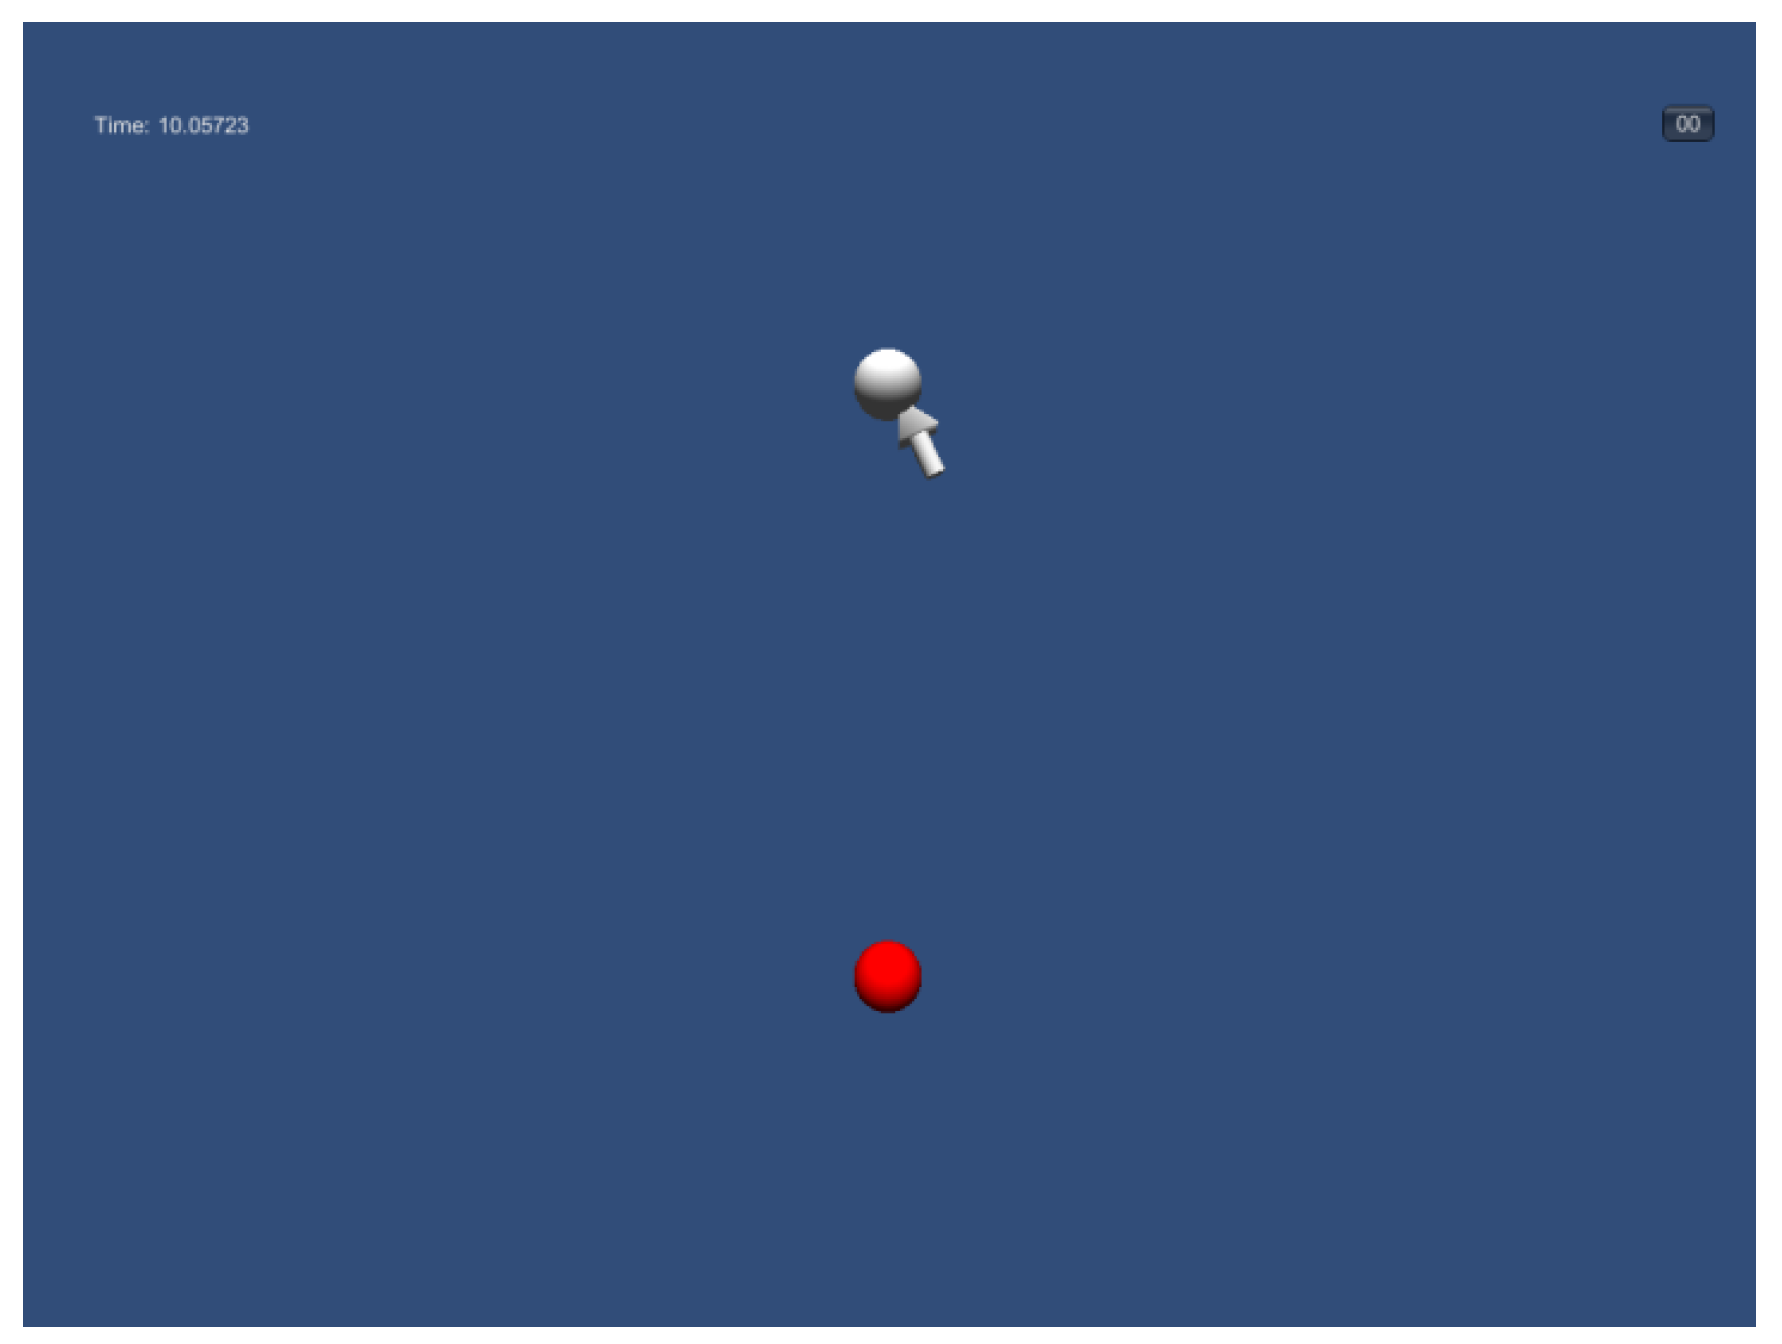
The ball was programmed and projected as 3D image. One ball in the circle would appear at a time, and the participant had to move the 3D cursor to hit the ball. The initial 3D cursor was placed at the center cube, and the participant had to click on the cube to start the test. Then, the first ball would appear in red (See.
Figure 4). When the participant hit the ball, the ball would turn white, and the next ball would appear in red (See.
Figure 5). The changing color of the ball guided the participant to look at the balls in sequence until all 12 balls were clicked.
Each participant completed all six ID trials in one of the three parallax conditions (at the screen, 20 cm in front of the screen, and 50 cm in front of the screen) and then performed the other two levels of parallax, selected randomly. Participants should complete 18 trials of tapping tasks. Each trial took 12 to 17 seconds. Then, we asked the participant to take breaks for five minutes, while we prepared the calibration process and the next parallax level for the next trial. With the frequent breaks and the short task duration, visual fatigue could be avoided as much as possible.
Data Collection and Analysis
Data on hand movement time was recorded based on the mouse clicks in the tapping task. As mentioned earlier, data on eye movement needed to be analyzed with additional steps because the eye movement time from the origin ball to destination ball was to be decided based on fixation points near the ball, and there could be many of them. One of the fixation points near the ball would be considered a signal of an eye click (which should not be determined by the hand click) on the ball. The eye click should be initiated by the computer rather than the hand if the eye is to be used as a pointing device. The algorithm will automatically make judgment and detection as the eye gaze data satisfied the criteria for the intended click. Therefore, fixation data from the eye tracker were screened, and appropriate data were selected for movement time calculations.
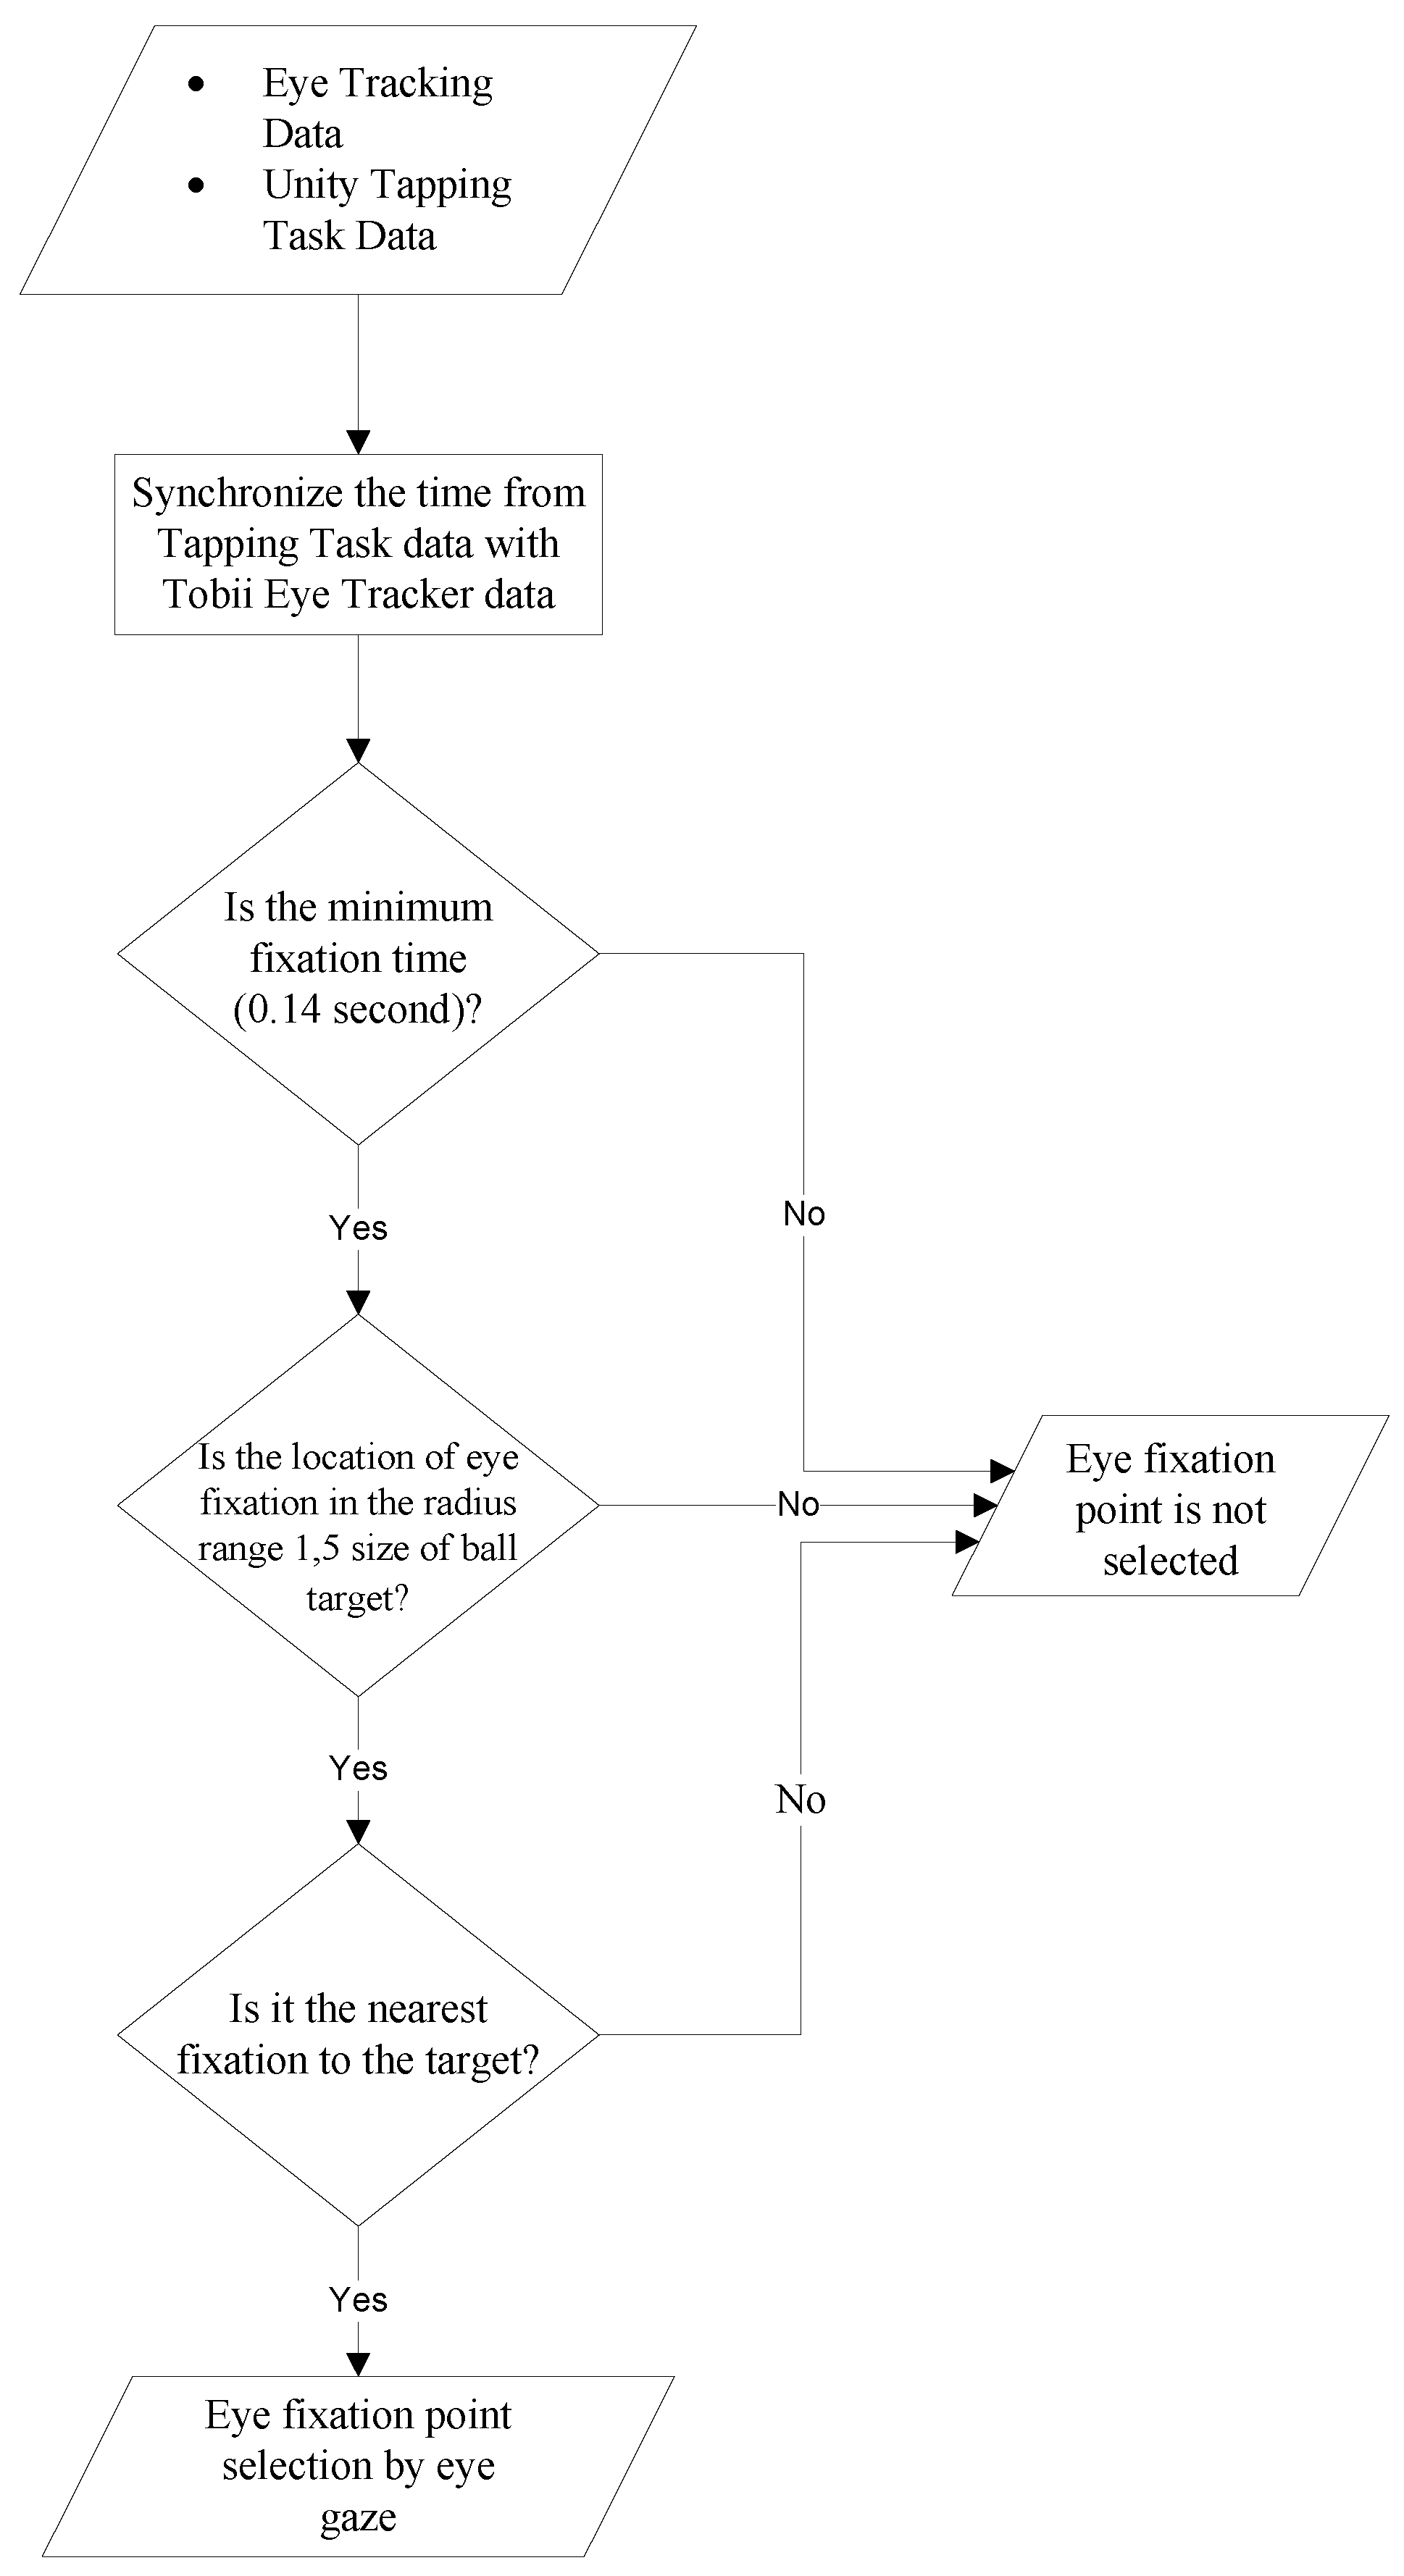
Figure 6 shows the flowchart of the algorithm for choosing the appropriate fixation points.
In this procedure, we synchronized the time stamp from the eye tracker data with the tapping task data in the program developed in Unity. Based on the synchronized data, the fixation points with time stamps between the two mouse clicks were considered candidates. If the fixation time was below 0.14 seconds, it will be eliminated. The duration of 0.14 seconds was set as the criterion fixation duration because it was a multiple of 0.07 second fixation duration provided by the Tobii I-VT filter and it was assumed that a longer fixation would indicate the intention to click on the ball. The fixation points close to the ball were further candidates. Basically, each participant generated more than one eye fixation point between fixations on the origin ball to the destination ball before clicking the object. It was unknown which fixation was the one intended as the touchdown on the ball, so we treated the nearest one as the intended touchdown. The nearest fixation is the one that counts because the closest fixation to the ball indicates the eye gaze close to the ball position. To find the closest one, a reduced sample space determined by a circle with a diameter 1.5 times that of the ball and concentric with the ball was used. Only fixation points within this circle were used in the calculation of the nearest fixation point to the ball. We intended to choose the closest fixation point to minimize inaccuracy in predicting the location of the eye gaze on the ball position. This algorithm was used to accelerate the calculations considerably.
Discussion
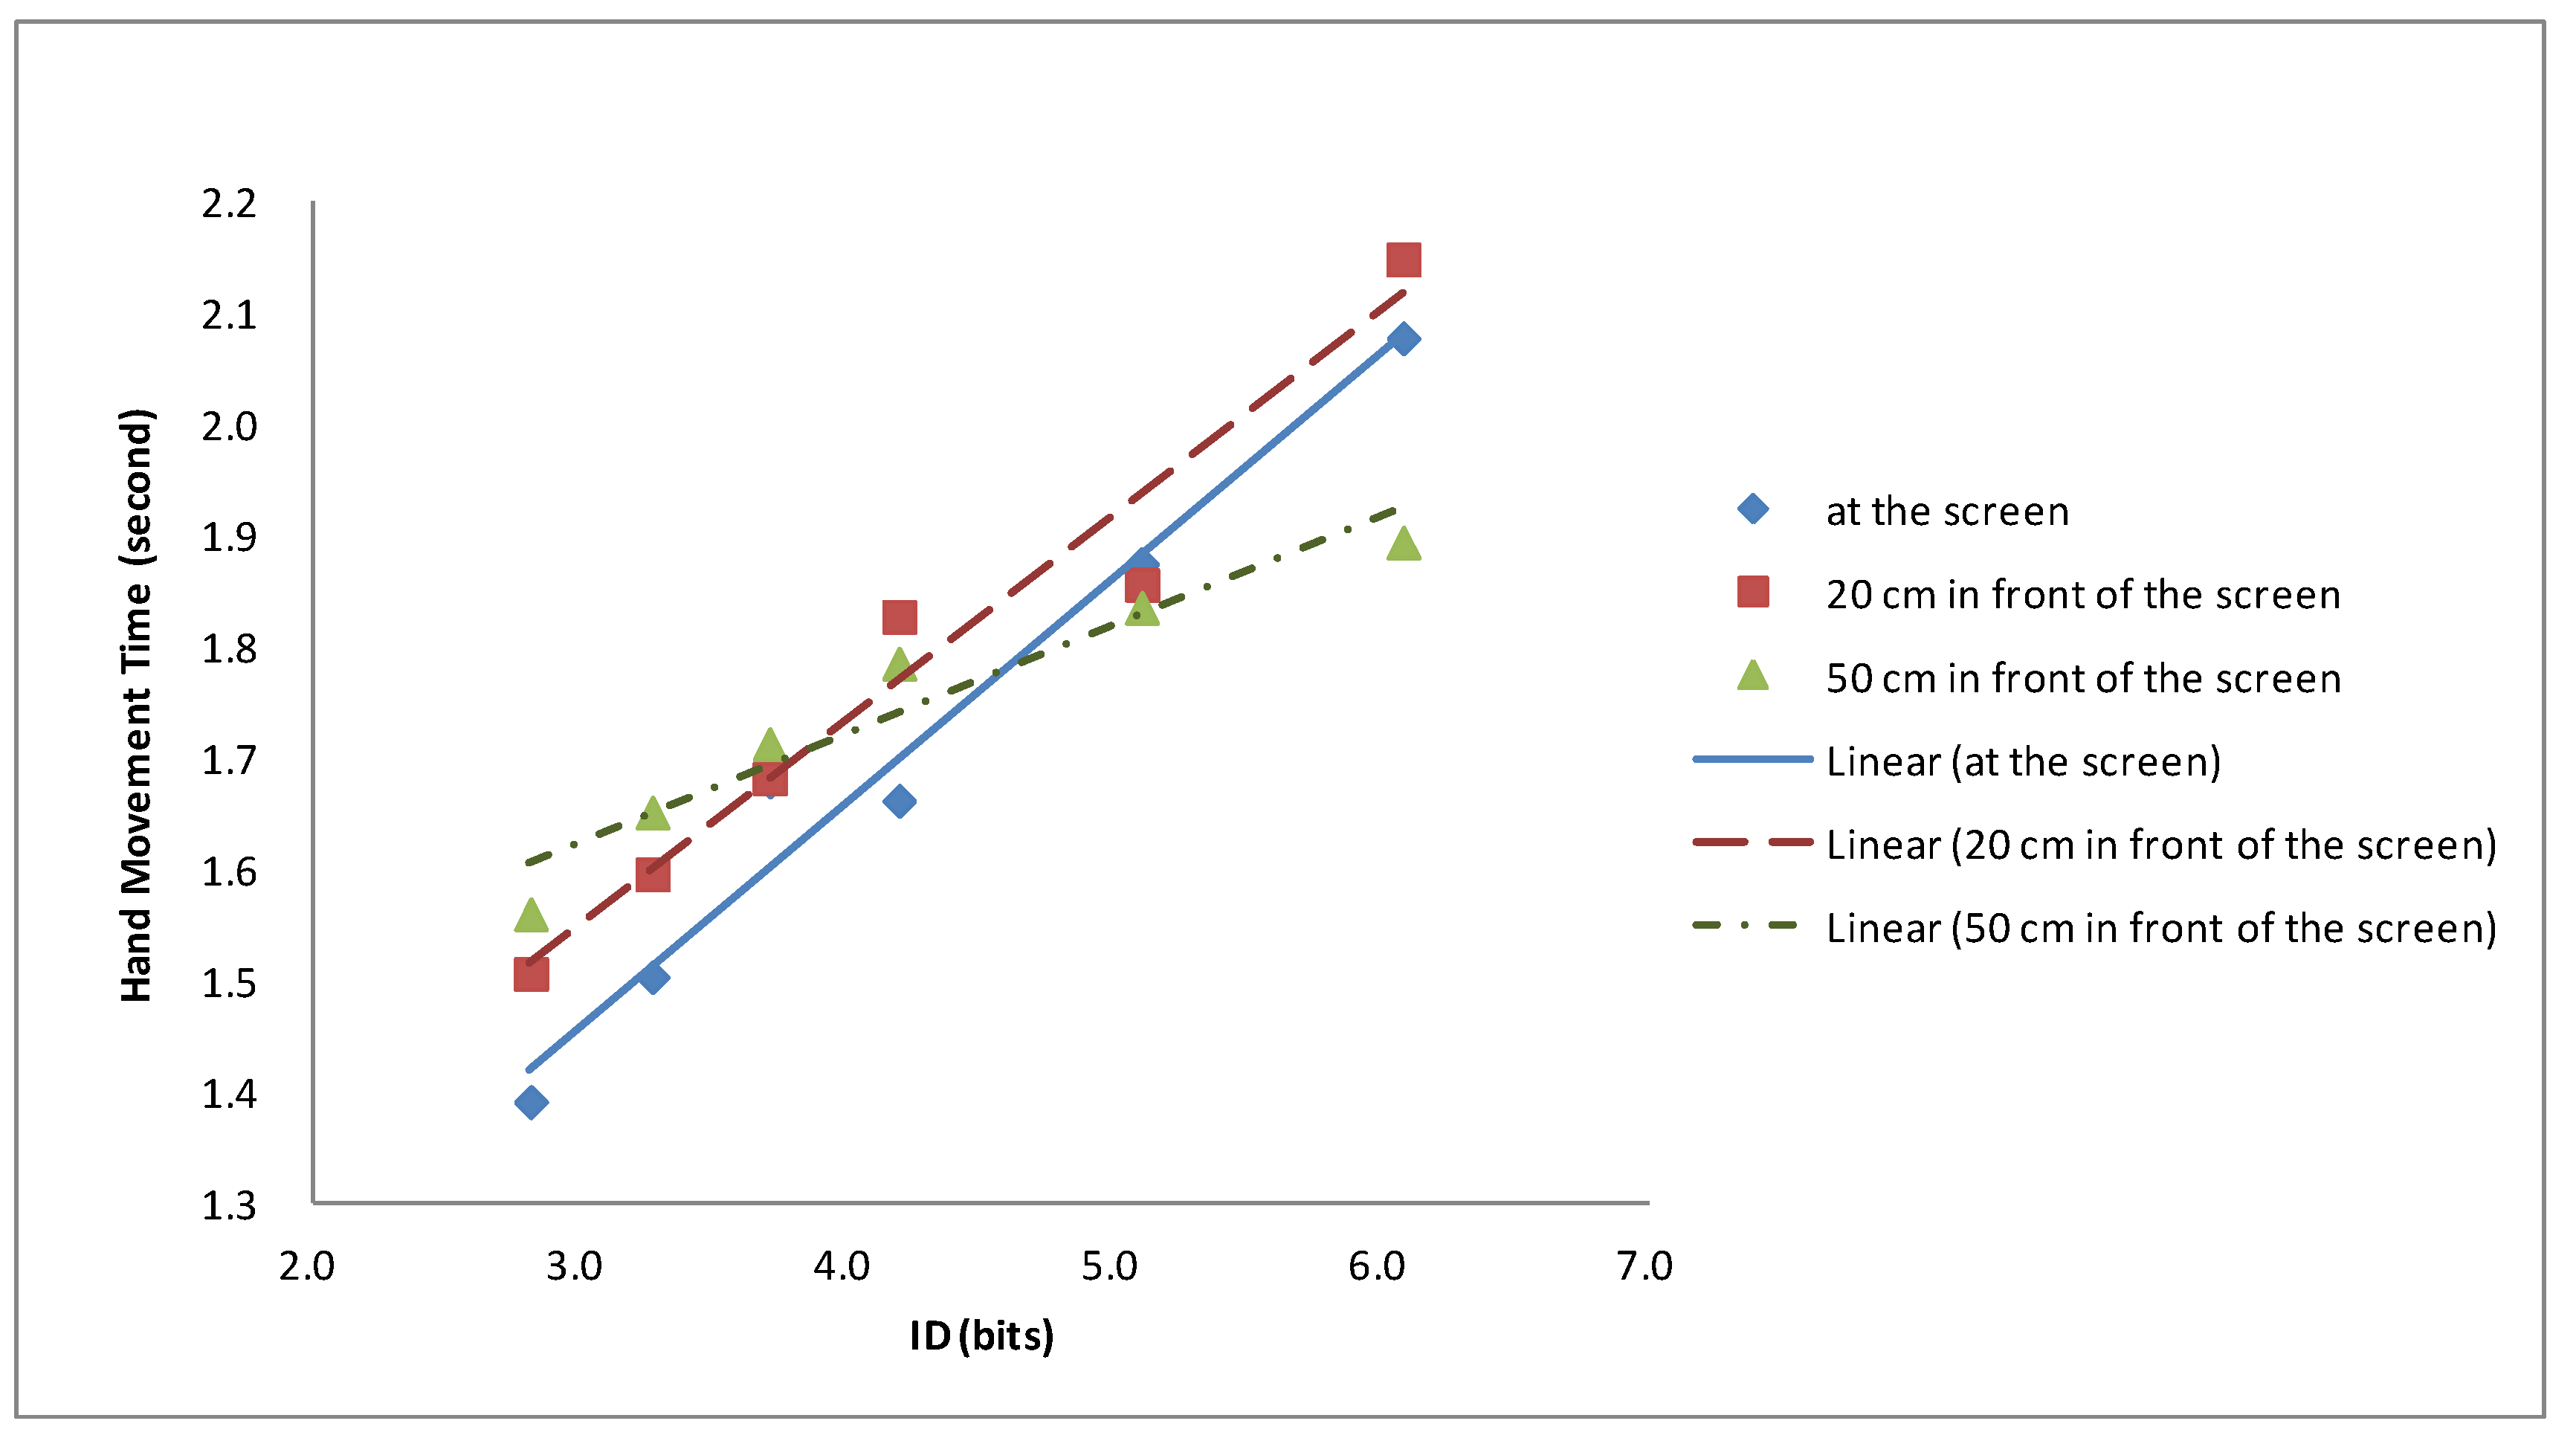
This study investigated the effects of parallax setting in a stereoscopic display on eye pointing movement performance using the Fitts’ law tapping task in a 3D visual environment. Parallax, as the independent variable, was varied for three different conditions, with the virtual ball seen at the screen, at 20 cm in front of the screen, and at 50 cm in front of the screen. The dependent variables included several performance indicators for hand movement, and eye gaze movement during the pointing movement.
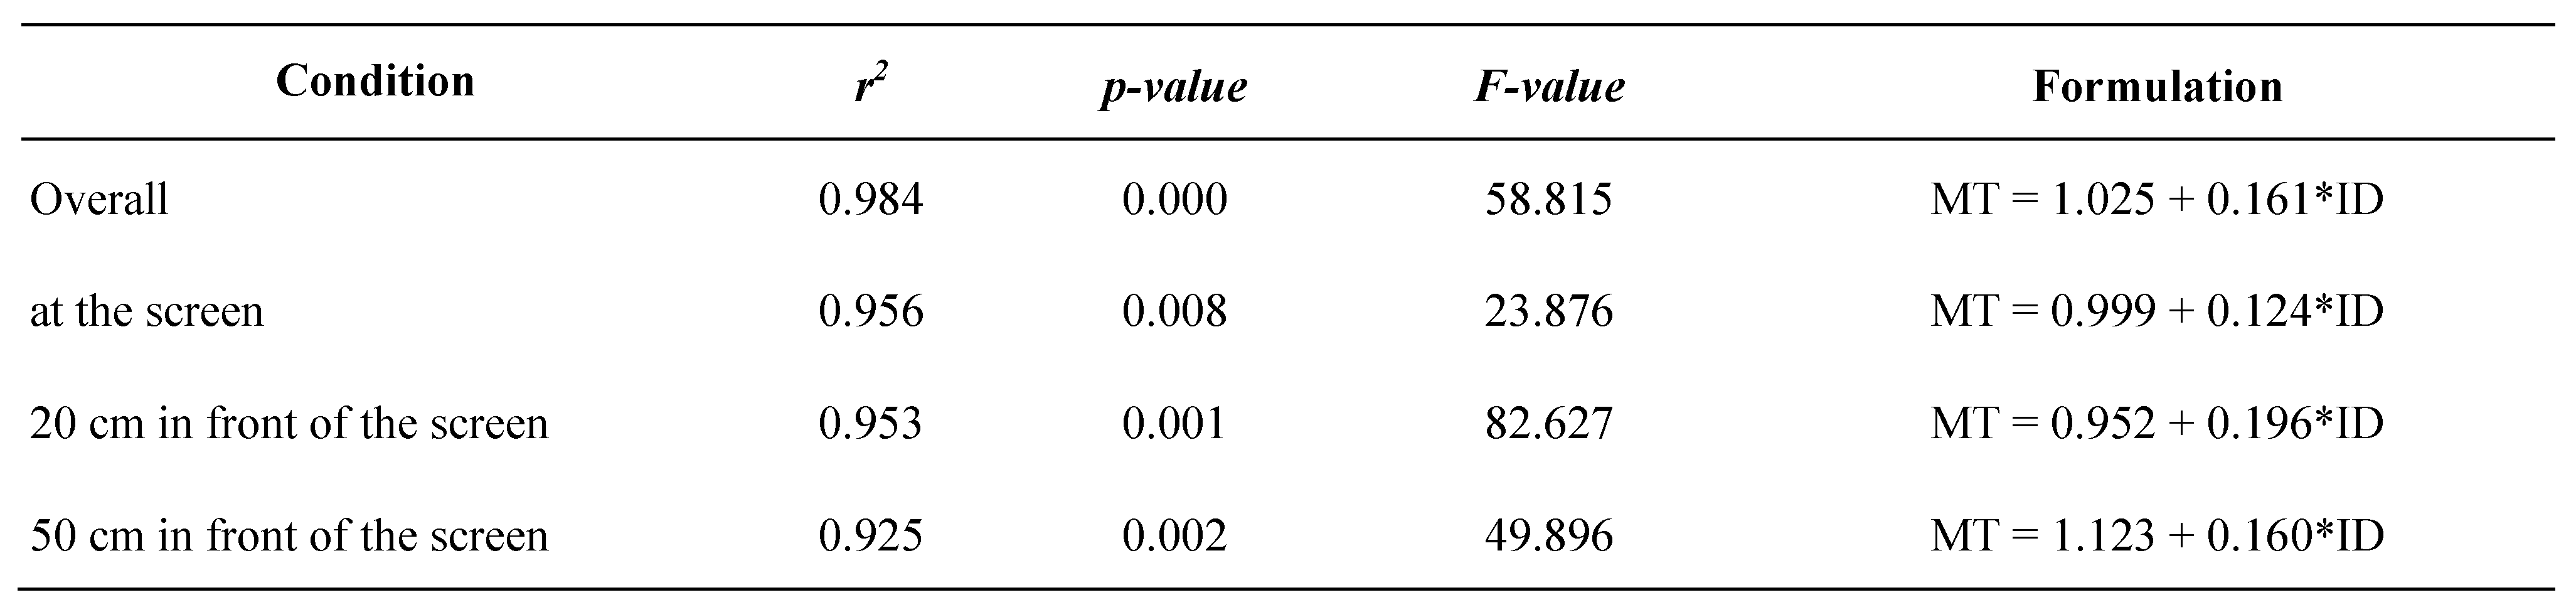
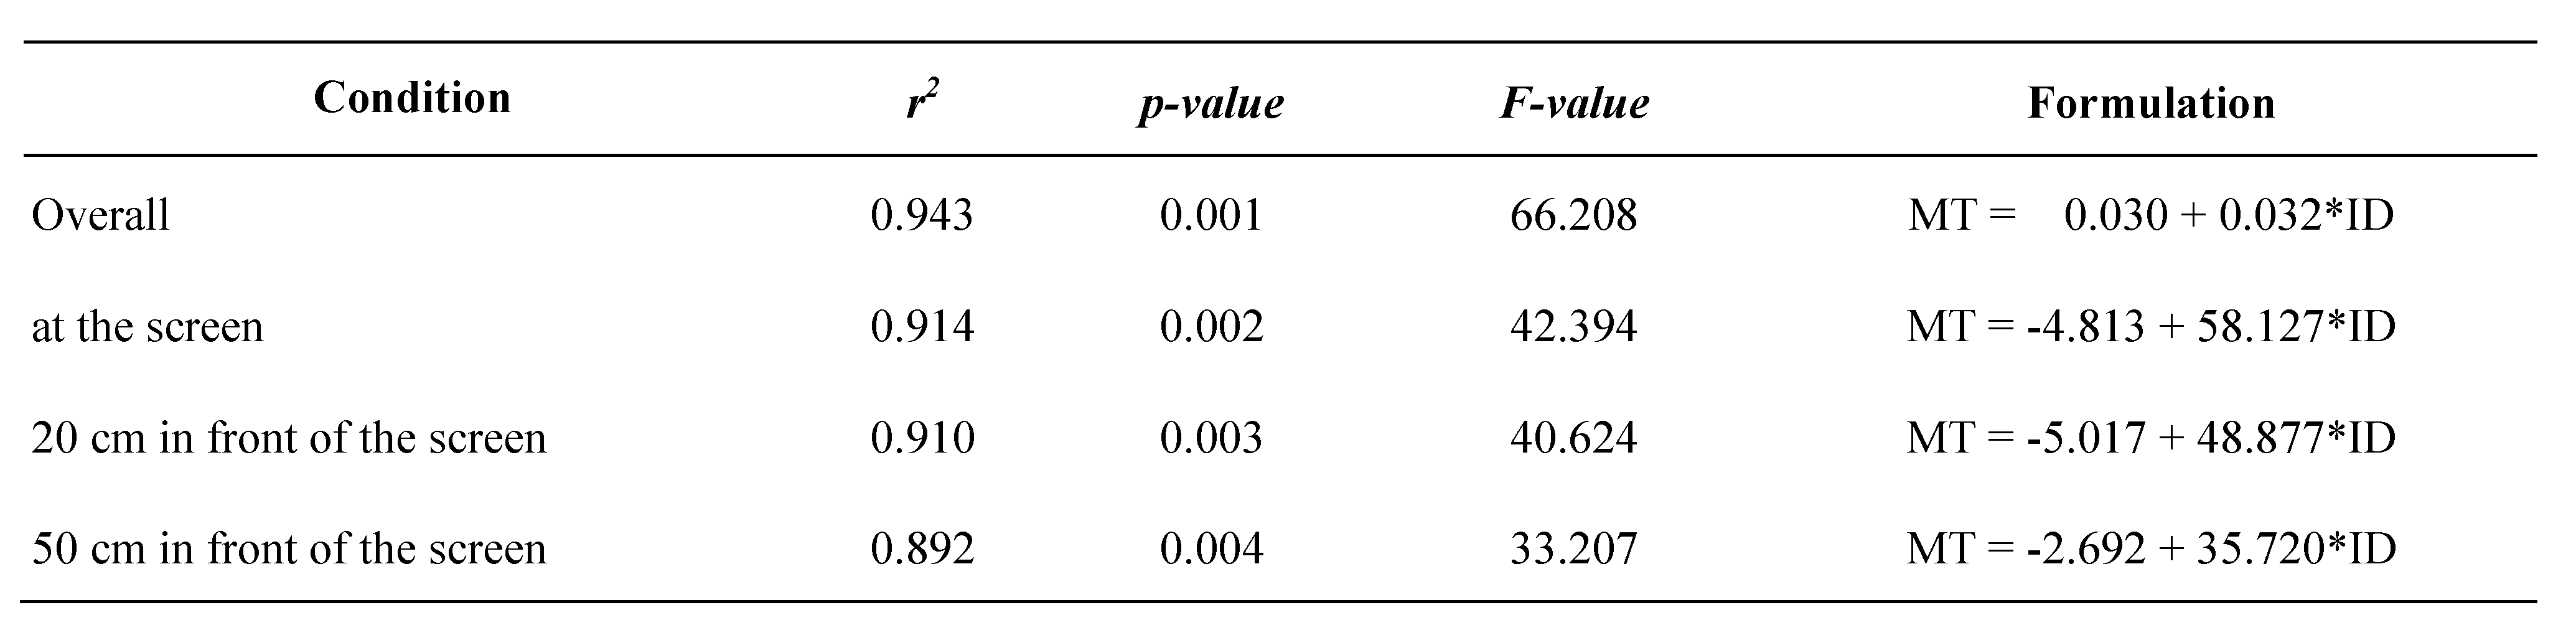
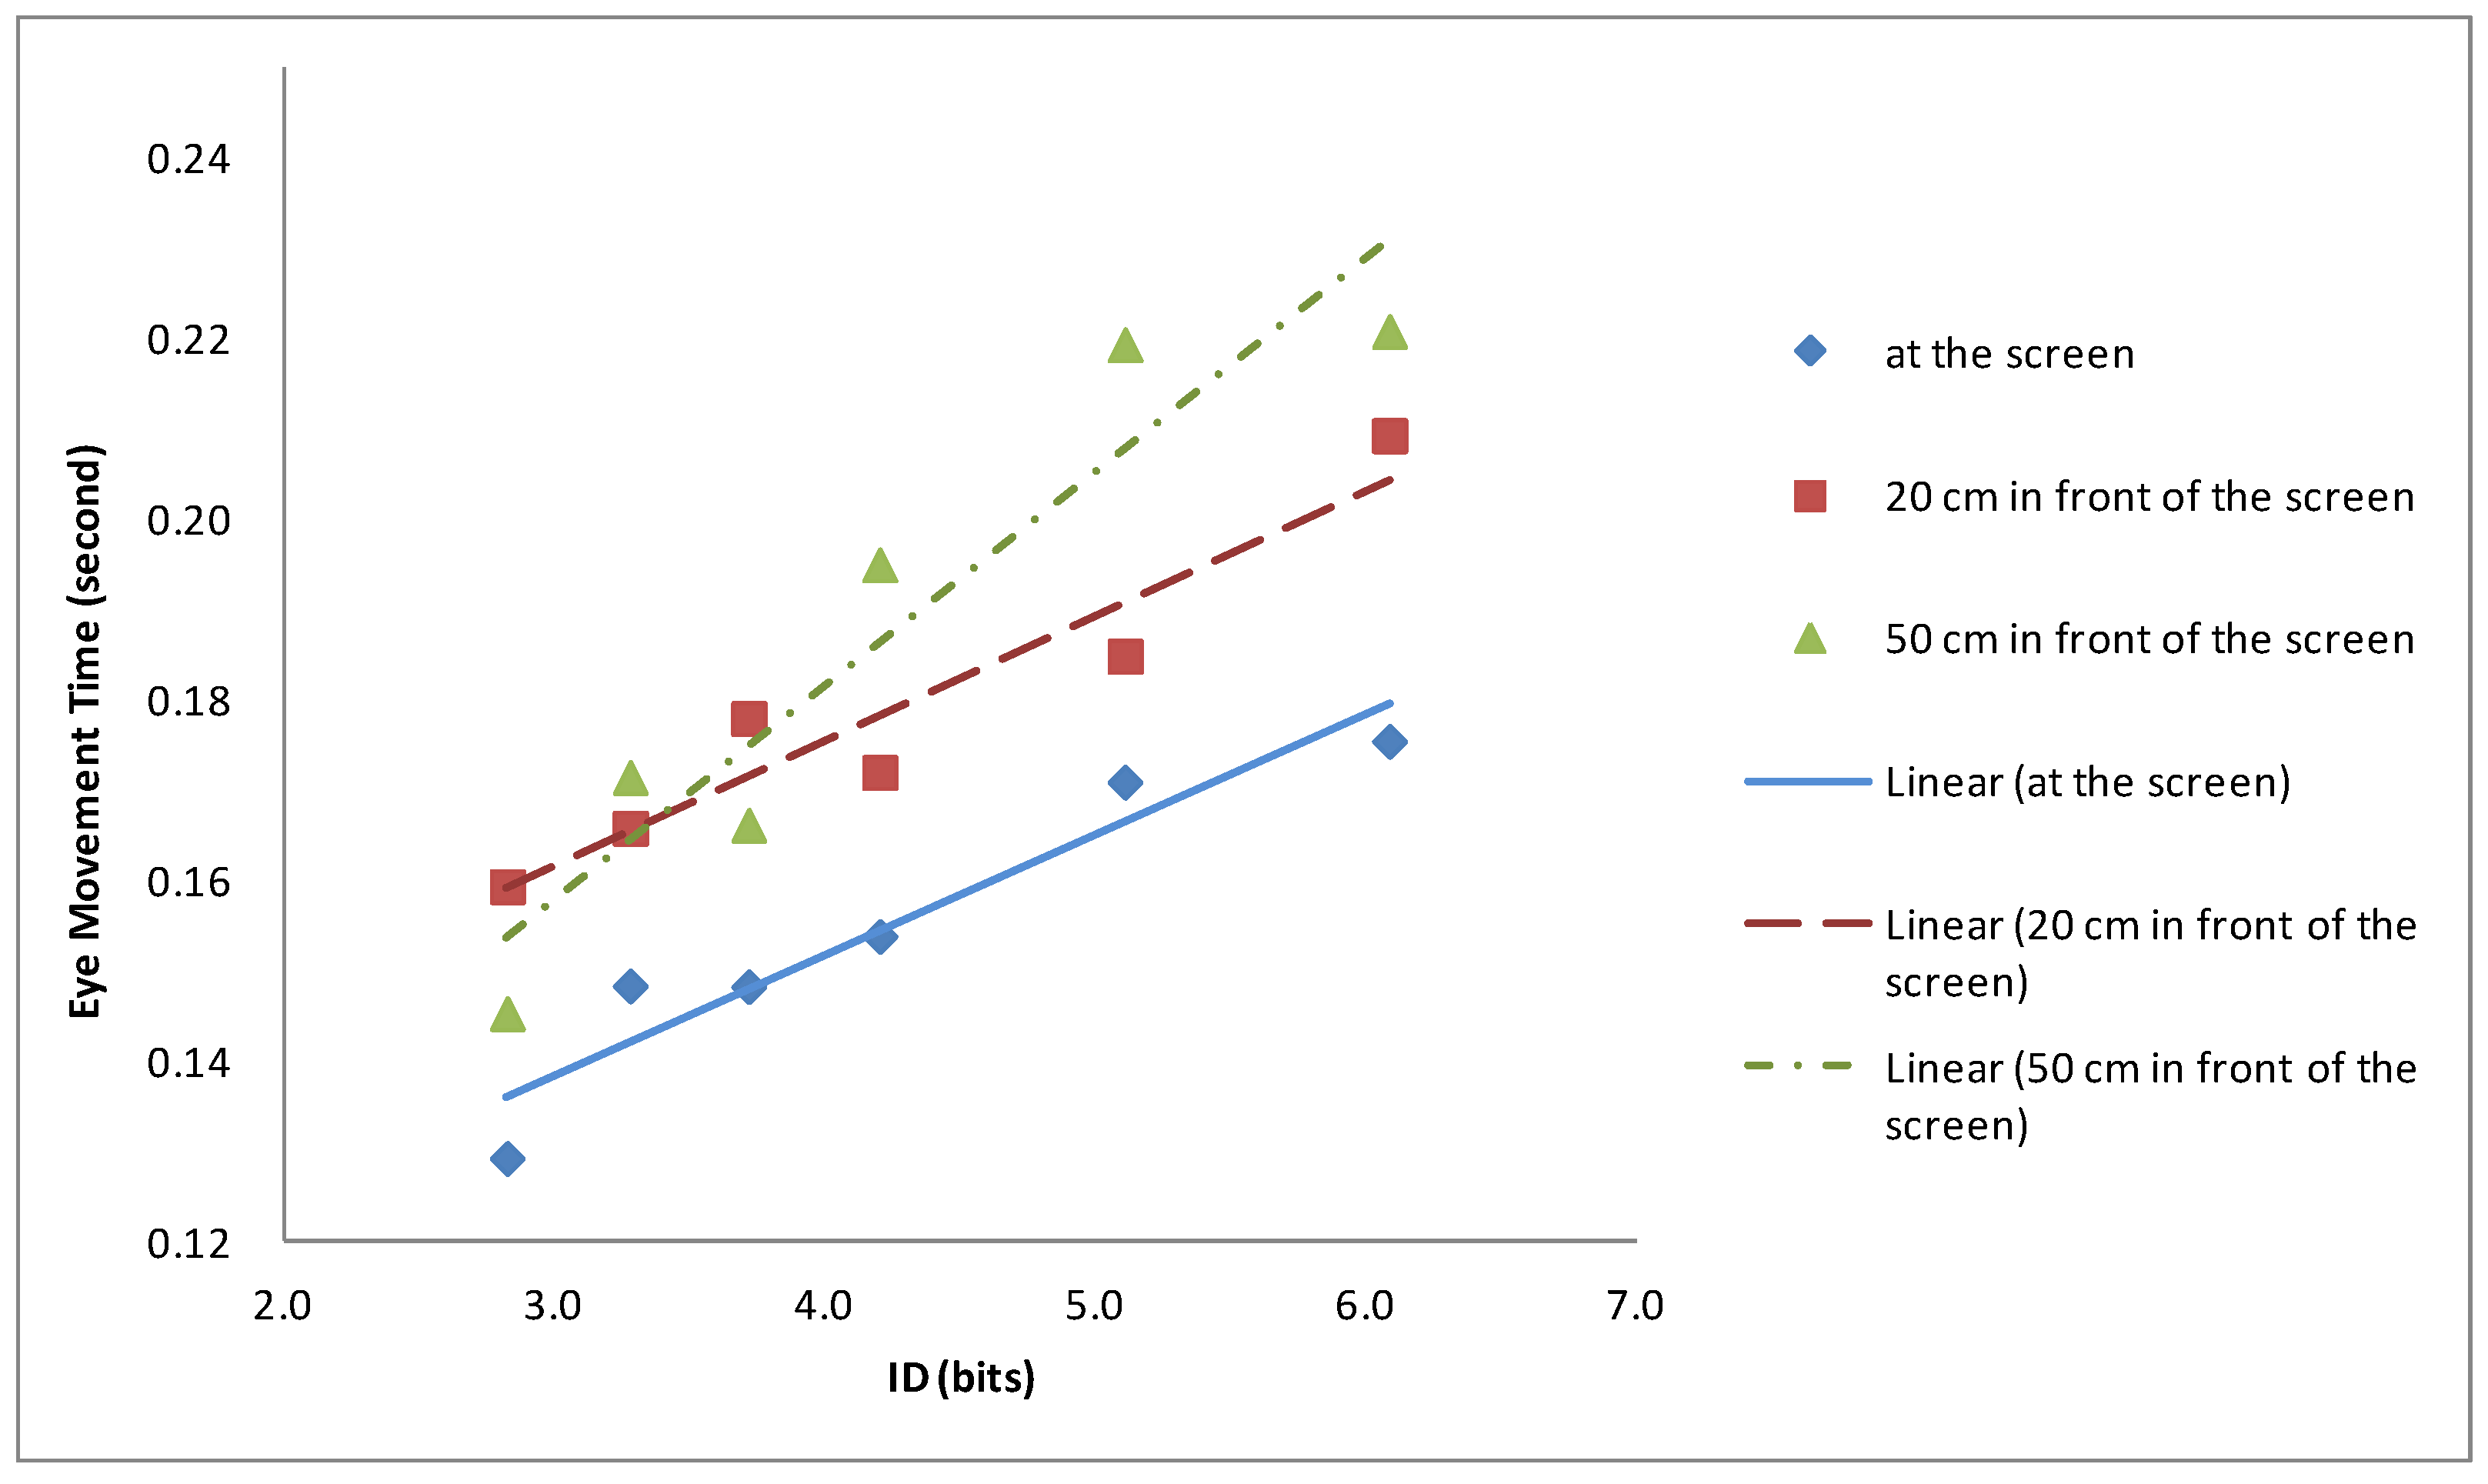
The findings showed that both hand pointing movement and eye pointing movement followed Fitts’ law in the stereoscopic display. The regression results showed that the r
2 values for hand movement were higher than those for eye gaze movement. This could be expected due to the complexity of eye movement and the lack of a reliable algorithm in the eye tracker data collection and analysis (
Zhai, Morimoto, & Ihde, 1999).
Ware & Mikaelian (
1987) stated that the eyes may not follow the exact concept of target size and instead only pursue a spot of interest, whereas the hand guides the mouse to hit the ball object precisely during hand pointing movements. The eye fixation may dwell only on the area of interest and not exactly on the centre of the ball as targeted object. Nevertheless, the r
2 values of the fitted regression lines for the Fitts’ law on hand and eye movements in the stereoscopic display were both above 0.892 in this study. In the literature, little is available on the Fitts’ law modeling of the eye movement in stereoscopic environment. This study documents eye pointing movement time in 3D environments with Fitts’ law regression models. Although the hand movement has better model fitting (higher r
2 values) in our study than eye movement, in our view, the eye movement seems to indicate a promising pointing technique in the stereoscopic display condition. Studies of eye movement in 2D or screen displays (
Chi & Lin, 1997;
Zhai, Morimoto, & Ihde, 1999;
Vertegaal, 2008) reported the r
2 value to be 0.143 to 0.374, 0.804, and 0.87. The results of our study reported that the r
2 value of eye movement were 0.892 to 0.914 in 3D (stereoscopic display), a significant improvement over the consistency of eye movement time determination using the Fitts’ law modeling tool. In our study, the proposed algorithm to choose the eye gaze point was effective to improve the model fitting r
2 value.
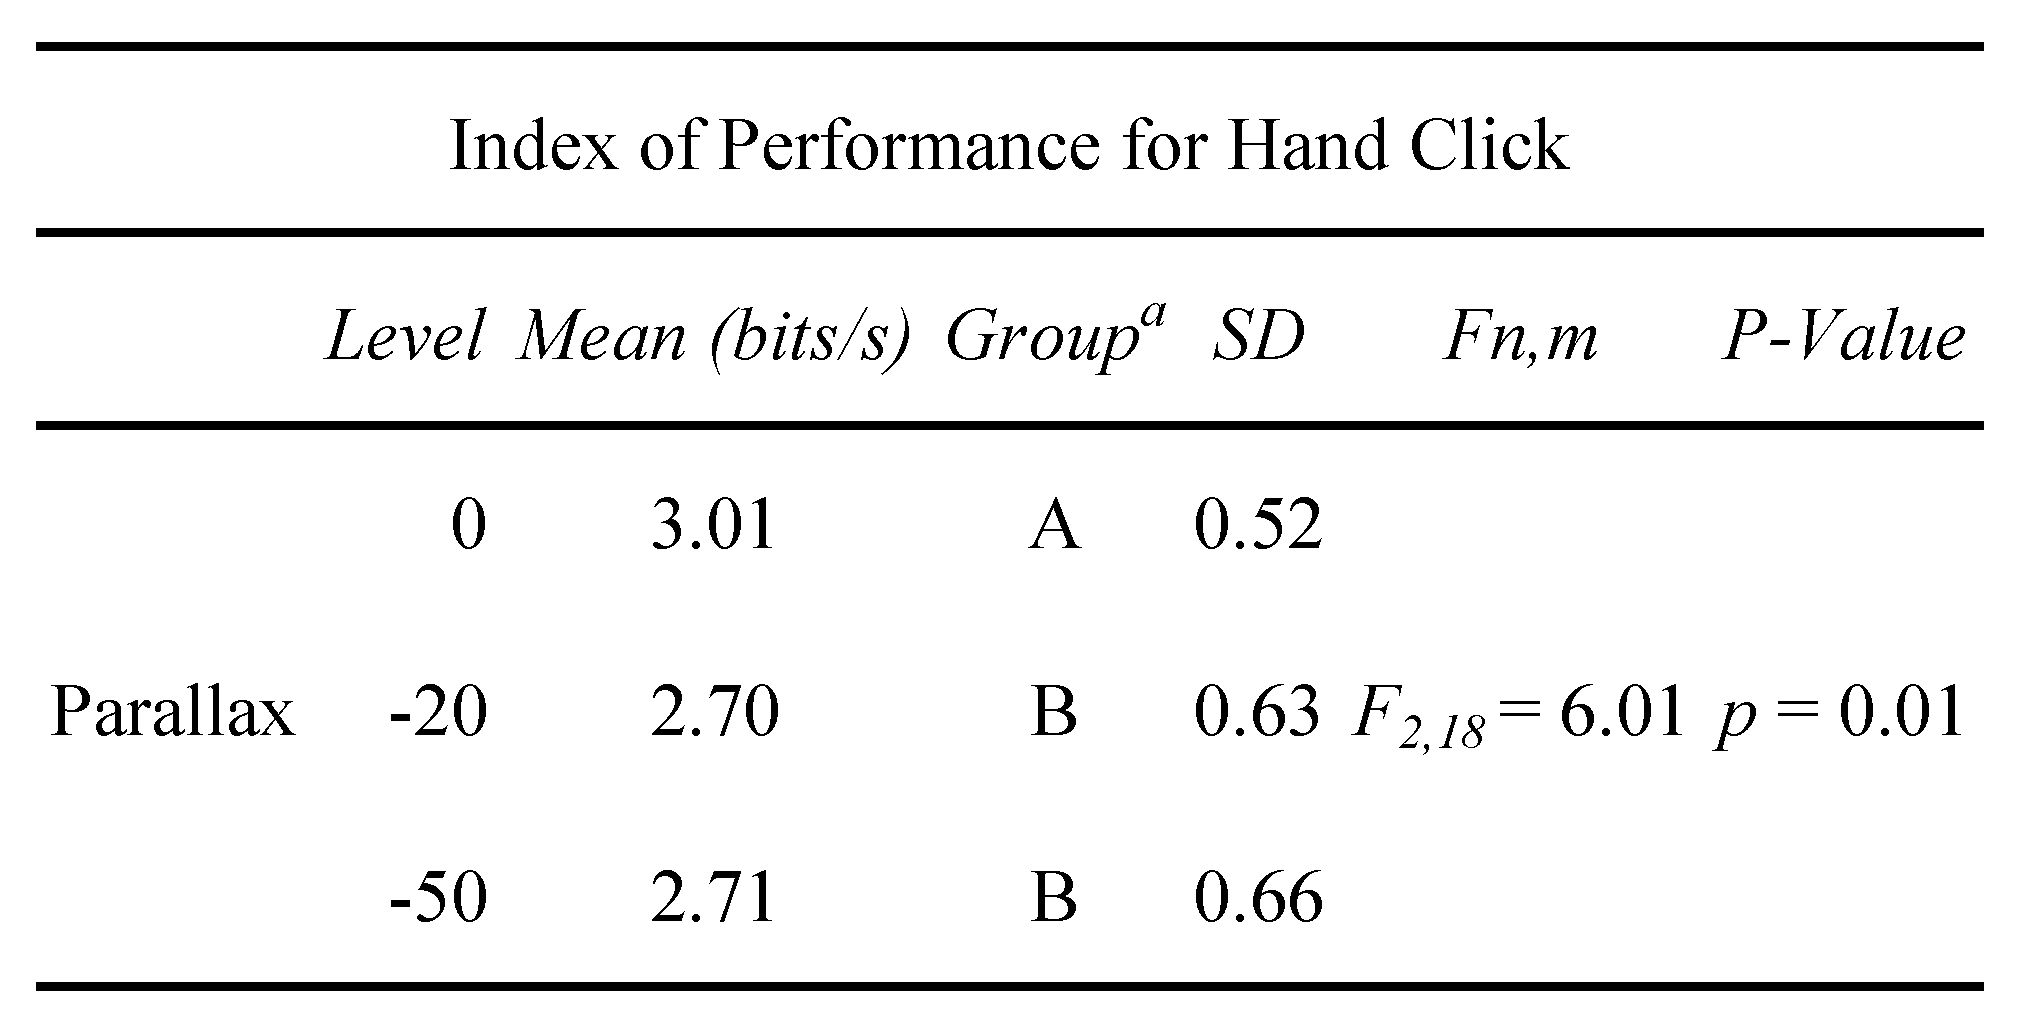
The ANOVA results showed that parallax has significant effects on the hand movement time, eye gaze movement time, index of performance with hand click, and index of performance with eye gaze. A general pattern is that the difference occurs between parallax at the screen and the other two conditions. When the ball was seen at 20 cm or 50 cm in front of the screen, the participant spent more time and had lower index of performance, than when the ball was seen at the screen. It must be noted that when the ball was seen at the screen, it was still a virtual 3D ball, not just a 2D round circle. The accommodation-vergence conflict may be the reason why movement time is higher and index of performance is lower when the balls occur between the screen and the eye. When the balls are brought away from the screen plane, this condition will increase eye rotation inward trying to view the virtual ball while each eye still focuses on the light source projected on the screen. The discrepancy between dual eye vergence point (at the virtual target) and each single eye accommodation point (at the screen light source) may lead to the degradation of the pointing performance and hence the longer movement time. This visual experience, accommodation-vergence conflict, has been reported to cause visual discomfort (
Emoto, Niida, & Okano, 2005;
Hoffman, Girshick, Akeley, & Banks, 2008;
Inoue & Ohzu, 1997;
Lambooij, Fortuin, Heynderickx, & IJsselsteijn, 2009;
Shibata et al., 2005;
Wann & Mon-Williams, 1997;
Yano, Emoto, & Mitsuhashi, 2004). It can be caused by the vergence point and accommodation points not being synchronized since the accommodation point is created by the eyes in the screen display, but the vergence point is created by the position of the virtual target (
Urvoy, Barkowsky, & Le Callet, 2013). Our results showed that the lower performance of tapping task of virtual ball in stereoscopic display may also have been attributable to the accommodation-vergence conflict.
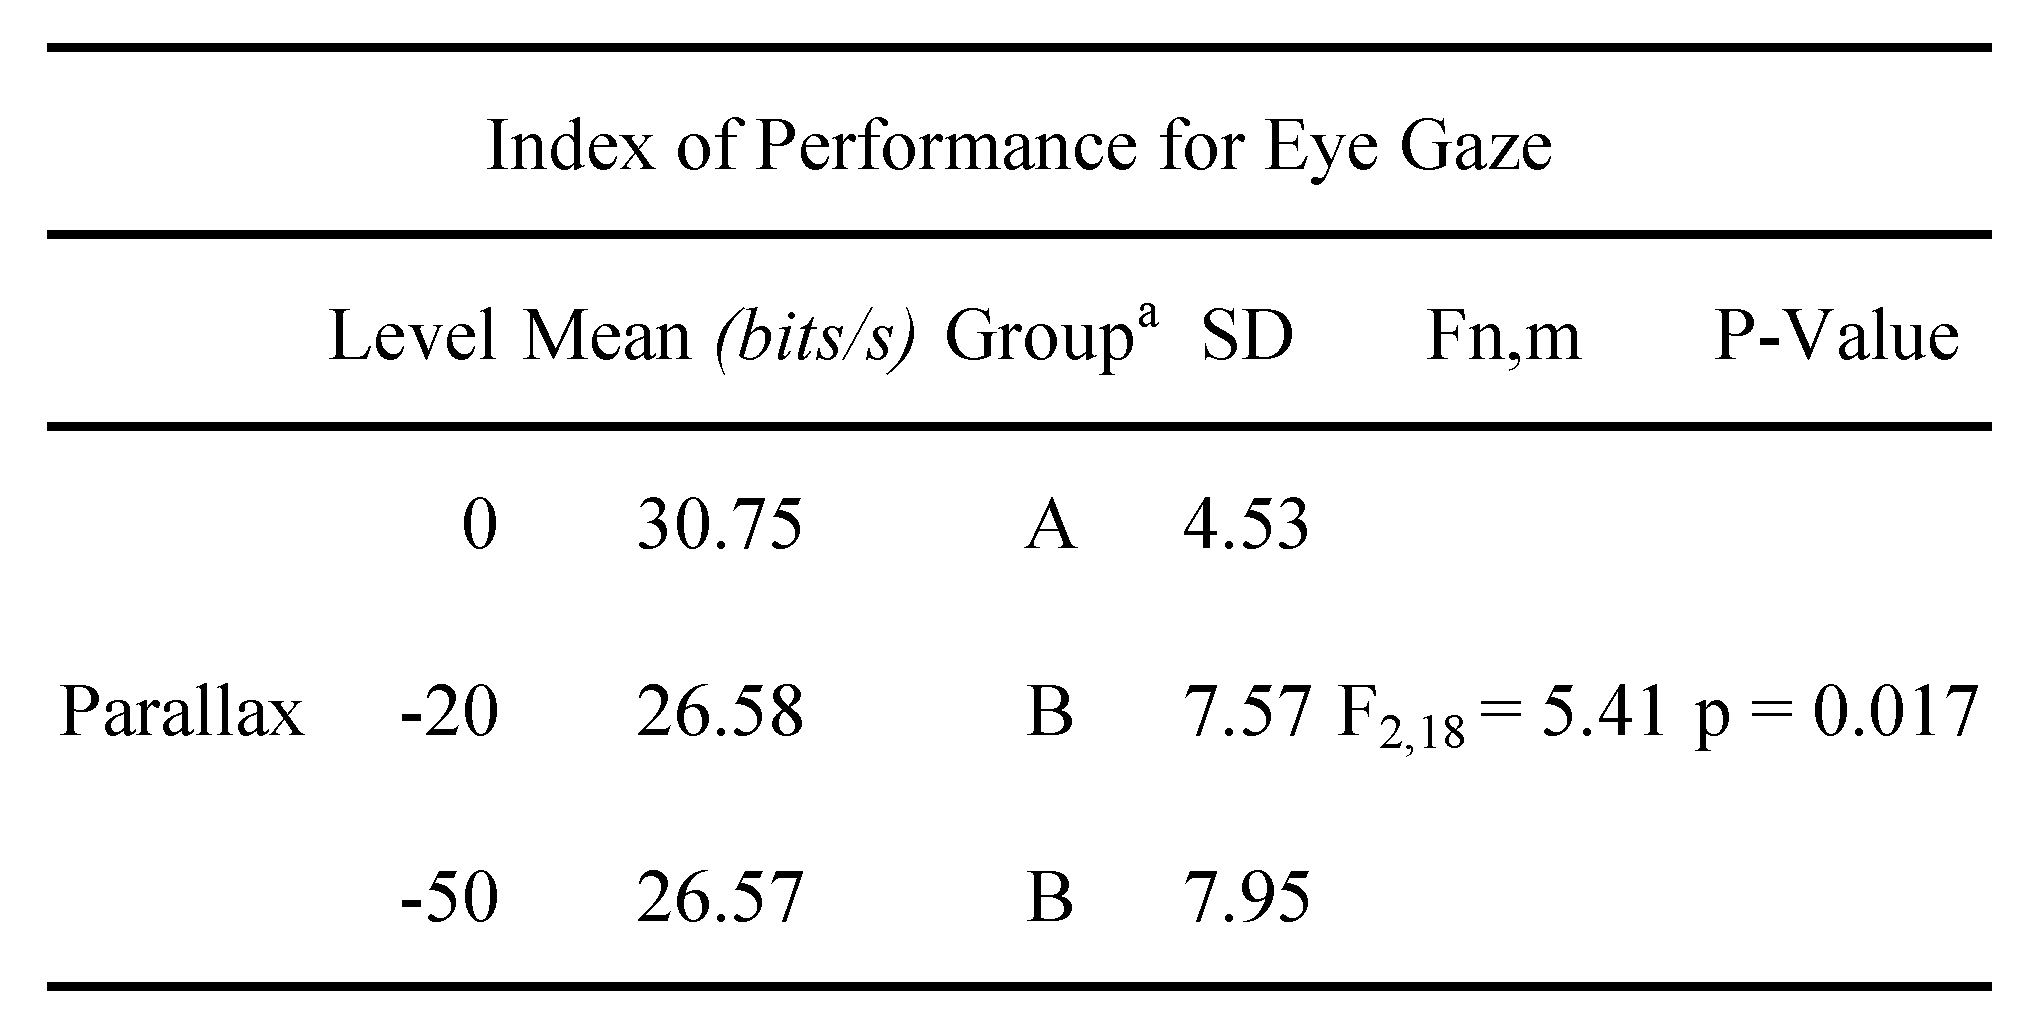
Notably, the index of performance with eye gaze were 30.75 bits/s, 26.58 bits/s, and 26.57 bits/s for parallax at the screen, 20 cm in front of the screen, and 50 cm in front of the screen, respectively, a much higher values than the usual hand movement performance index. In this regard, Vertegaal (2000) also found that the eye tracking performance with dwell time click provided the fastest technique, with an index of performance much higher than that of hand click. Our results are consistent with their finding. Theoretically, the extra ocular muscles that move the eye are among the fastest muscles in the human body (
Bobick & Balaban, 2008). Therefore, the speed gains of the eyes are quite advantageous over movements covering great distances. The difficulty lies in finding the dwell position to be used as a signal of the intended click at the end of the movement, since there can be many gaze points on the ball. It is difficult to know from the eye tracker data which one should be considered as the click. In this study, we developed a method to determine the eye click. The nearest fixation position to the ball within the area of interest was used as the click. The use of thenearest fixation position resulted in a good movement time fit to the Fitts’ law, and the high index of performance was also obtained using this algorithm. This algorithm was shown to be able to select the appropriate eye gaze automatically for eye pointing click without having to use the hand click which occurs much later. With this algorithm, eye movement has the potential for use as a pointing device in the stereoscopic display.

