Abstract
Controversy exists in the literature regarding the basic neural control structure that mediates convergence responses. This study constructed and simulated two models, the switched-channel feedback model and the dual-mode model consisting of preprogrammed with feedback control. Models were constructed and compared to experimental data. The stimuli consisted of 2° and 4° vergence steps. Both closedand open-loop settings were utilized. After parameter adjustment, both models could accurately simulate step responses from subjects having a range of response dynamics. The model with a preprogrammed element required less parameter modification when stimulus amplitude changed. Both models could accurately simulate some attributes of vergence; however, neither model could represent the modifications commonly observed within the transient portion of the vergence response.
Introduction
There are several basic neurological control strategies to move the eyes to a desired target. Saccade and smooth pursuit motor control components move the eyes in tandem while vergence control components move the eyes in opposition. Vergence mediates the inward (convergence) or outward (divergence) eye movements and are used to fixate objects at different depths aligning them with the fovea.
Model development and simulation have proven to be useful tools to aid our understanding of complex physiological systems. Vergence eye movements were first modeled using a simple feedback control system reported by Rashbass and Westheimer (Rashbass & Westheimer, 1961). Numerous models have been developed since this first model but controversy still exists regarding the basic control structure mediating the vergence motor response. Models of vergence control can be classified into three basic configurations: single channel continuous feedback, switched-channel with feedback, and preprogrammed with feedback control. (Jiang, Hung, & Ciuffreda, 2002).
The first model by Rashbass and Westheimer from 1961 used linear feedback with a feedfoward controller consisting of an integrator and a delay. The feedfoward controller was configured based upon findings from open-loop experiments where the disparity (i.e., the error between desired and actual vergence response) was kept constant. These experiments showed that for small disparities up to 0.2°, the response velocity was proportional to the input disparity one reaction time prior (approximately 160 msec). The model was not able to accurately simulate the phase shift observed during sinusoidal disparity stimuli as the experimental data had shorter lags compared to those predicted by the model (These shortened phase lags were due to prediction, a higher level function rarely incorporated into basic control models. Here we follow the strategy used by most modelers and use stimuli that are not predictable to eliminate this complex control component from the response.). This model also had difficulties modeling step responses that had faster dynamics because it became unstable with faster control signals due to the presence of long processing delays. Krishnan and Stark developed a more advanced feedback model by adding a derivative element to the controller in parallel with the integrator (Krishnan & Stark, 1977). The integrator was modeled as a first-order element because pure integrators are unlikely to be found in a neural system. This “leaky integrator” generated a sustained signal while the derivative element produced a transient component that enhanced the velocity of the transient response. The next modification was by Schor who added a threshold to trigger vergence change creating a small dead zone (Schor, 1979). He also added a first-order element with a very long time constant to account for slow adaptive modifications known as “prism adaptation.” One problem with both these models is that sustained error, also known as “fixation disparity,” was much greater than found experimentally (Hung & Semmlow, 1980).
Pobuda and Erkelens were the first to present a model with parallel channels in the feedforward path (Pobuda & Erkelens, 1993). Their model was based upon the following assumptions: 1) vergence processes disparity via channels that could be represented as leaky integrators, 2) the channel selected depends upon the amplitude of disparity, 3) vergence loops have delays of 80 to 120 msec rather than the 160 msec delays previously reported, and 4) the vergence loop outside the disparity channels is not sensitive to the disparity change. One criticism of this model is that its simulated responses were significantly slower than those observed in many subjects experimentally (Semmlow, Hung, & Ciuffreda, 1986).
Other models have expanded the switched-channel model using a neural network architecture (Patel, Ogmen, White, & Jiang, 1997). Their model incorporated a variation of the switched-channel model into one of the neural layers and used velocity to select the input channel rather than disparity. One reported limitation of this model is it could not simulate the high-velocity steplike component observed in faster ramps identified by Semmlow and colleagues (Semmlow et al., 1986).
A different approach to vergence modeling uses a preprogrammed open-loop element in conjunction with feedback control (Hung, Semmlow, & Ciuffreda, 1986). This dual-mode model consists of a rapid, preprogrammed, "transient" control component followed by a much slower, "sustained" component guided by feedback (Semmlow et al., 1986; Semmlow, Hung, Horng, & Ciuffreda, 1993; Semmlow, Hung, Horng, & Ciuffreda, 1994). The primary behavioral evidence that supports preprogrammed control was initially published by Jones in 1980 and confirmed by Semmlow and colleagues (Semmlow et al., 1986). A non-fusible target (such as a horizontal line paired with a vertical line) moved in a step-like manner produces a transient vergence response that then decays to the baseline position (Jones, 1980). A sustained response requires a fusible target (such as stereoscopically paired lines). There is considerable additional behavioral support for the dualmode theory (Alvarez, Semmlow, & Yuan, 1998; Alvarez, Semmlow, Yuan, & Munoz, 2002; Semmlow et al., 1986; Semmlow et al., 1993; Semmlow et al., 1994; Lee, Chen, & Alvarez 2008).
The purpose of this study is to compare the switchedchannel and dual-mode models through simulations of a variety of experimental conditions to determine how the models compare to experimental behavior and to identify potential limitations of these models. One criterion for any model is the ability to simulate a range of behaviors. Hence, we will test both models using 2° and 4° symmetrical vergence responses from subjects who have faster and slower vergence peak velocities using both closedand open-loop experimental conditions.
Methods
Subjects
Ten subjects (5 females and 5 males between 19 and 30 years of age) who could all easily perform the task described below participated in this study. A group of ten subjects was studied to investigate the velocity range of response dynamics. All subjects had normal binocular vision assessed by the Randot Stereopsis Test, near point of convergence, and vergence ranges using procedures described in our previous study (Alvarez et al., 2010). Subjects used refractive correction if needed during the experiment. Subjects S2 and S4 were myopes with an average prescription of -1D while the remaining subjects were emmetropes. All subjects signed written informed consent forms prior to the experiment which was approved by the New Jersey Institute of Technology (NJIT) Institute Review Board (IRB).
Materials and Apparatus
Visual targets were displayed via a haploscope to stimulate disparity vergence while keeping the stimulus to accommodation constant. Proximal cues were minimized by having visual stimuli presented in a dark environment. Two computer screens were used to generate a symmetrical disparity vergence stimulus consisting of a pair of vertical lines 6 cm in height and 2 mm in width that remained constant throughout the experiment. The stimulus displays were placed 40 cm away from the subject. Two partially reflecting mirrors were positioned along the midline of the subject’s vision to project the two vertical lines from the computer screens into the subject’s field of view. Before the experiment, the targets projecting from the computer screen were adjusted using the mirrors to calibrate the visual stimulus against real targets located at measured distances from the subject’s eyes. The subject’s head was restrained using a custom chin and head rest, thus avoiding any vestibular influences in the experiment.
Vergence eye movements were recorded using an infrared (λ = 950 nm) limbal tracking system manufactured by Skalar Iris (model 6500, Netherlands). All of the eye movements were within the linear range of the system (±25°) and had an empirically measured resolution of 0.1°. The leftand right-eye movement responses were individually calibrated, recorded and saved separately for offline analysis. Digitization of the eye movements was performed with a 12-bit digital acquisition (DAQ) hardware card using a range of ± 5 volts (National Instruments 6024 E series, Austin, TX, USA). The entire system was controlled by a custom LabVIEWTM program (Guo, Kim, & Alvarez, 2011) which generated the visual stimulus. Individual eye movements were digitized using a sampling rate of 200 Hz, which was well above the Nyquist frequency for vergence eye movements. A custom MatlabTM (Waltham, MA, USA) program was used for offline data analysis.
Experimental design
All subjects participated in the convergence closedloop step experiment. A closed-loop step experiment involves a simple step change in target angular vergence position. The step change began at an initial vergence demand of 4º and changed symmetrically to a final position (4° or 2°) more convergent than the initial vergence angle. The subject initiated an experimental trial using a trigger button and the step stimuli were presented following a random delay of 0.5 to 2.0 sec. Convergence stimuli were randomly intermixed with divergence stimuli of 2° so that the subject could not predict the direction, magnitude, or onset time of the stimulus. Hence, this protocol reduced predictive cues which are known to influence temporal and velocity behaviors in vergence responses. (Alvarez, Bhavsar, Semmlow, Bergen, & Pedrono, 2005; Alvarez, et al., 2002)
Simulations were conducted of the slowest (from S1) and fastest (from S10) vergence responses. Since, normative data is not readily available for vergence, we sampled ten subjects. If responses of the fastest and slowest peak velocities can be simulated then any of the movements within this range can also be modeled.
The subjects with the fastest and slowest peak velocities (S1 and S10) participated in a convergence openloop experiment. There were two sequential segments to this stimulus: an initial 2º convergence step was followed by movement of the target which was dependent on eye position. In the target-dependent segment, eye position was monitored and target position was continuously changed to maintain a constant disparity of 2º between the target vergence and the ocular vergence angle. The stimulus was presented for either a 2.5 sec duration or until convergence reached a maximum vergence angle of 16°. The purpose of this experimental protocol was to open the feedback loop within the vergence system so that the vergence response has no influence on the vergence stimulus (Alvarez, Semmlow, Yuan, & Munoz, 2000).
Subjects were dark adapted for approximately five minutes to minimize any influences from phoria which is known to influence vergence dynamics (Kim, GrangerDonetti, Vicci, & Alvarez, 2010; Kim, Vicci, Granger-Donetti, & Alvarez, 2011; Kim, Vicci, Han, & Alvarez, 2011; Lee, Granger-Donetti, Chang, & Alvarez, 2009). Since the stimulus was initiated by a button press from the subject, the subject could pause at any time to avoid fatigue before initiating another trial. Repetitive eye movements can induce fatigue and decrease vergence peak velocity. (Yuan & Semmlow, 2000) Sessions lasted for approximately 20 minutes and no subject reported fatigue.
All stimuli were presented along the midline to evoke pure symmetrical retinal disparity inputs. Although this input should not evoke conjugate movements, saccades are commonly observed especially with larger movements. Coubard and Kapoula (2008) characterized saccades during symmetrical 8.2° convergence steps and 6.2° divergence steps with an initial vergence angle of 8.5°. They reported that saccades were found in up to 84% of the vergence responses and identified six morphologies of the saccadic components. Ying and Zee (2006) reported differences in the timing and amplitude of the saccades within divergence movements after short and long periods of sustained symmetrical convergence. (Ying & Zee, 2006) Semmlow and colleagues (2008) demonstrated that the initial saccades occurred in a preferred direction (leftward or rightward) during 4° symmetrical vergence responses. (Semmlow, Chen, Pedrono & Alvarez, 2008) These investigators concluded that horizontal saccades in symmetrical vergence tend to quickly bring one eye closer to the target since saccadic peak velocities are typically an order of magnitude faster than vergence peak velocities. (Coubard & Kapoula, 2008; Semmlow, Chen, Granger & Alvarez, 2009; Semmlow et al. 2008; Ying & Zee, 2006) We have also shown that the frequency of saccades was inversely correlated to the maximum velocity of vergence. (Kim & Alvarez, 2012
As the aforementioned studies report, saccades are commonly observed in symmetrical vergence even though the visual input does not directly stimulate a conjugate response. Since neither the dual-mode nor the switched-channel models incorporate the influence of saccades in vergence movements, we purposely studied smaller vergence movements (2° and 4°) which have a lower frequency of saccades (Kim & Alvarez, 2012). For model simulation comparisons, we compared the model simulation with an experimental response that did not contain saccades.
Model construction
Two different models are compared in this research, the dual-mode (Figure 1A) and the switched-channel model (Figure 1B). For the dual-mode model, the vergence response is driven by the combined activity of a transient component that is preprogrammed and a sustained component that is driven by the error signal (disparity) through a feedback loop.
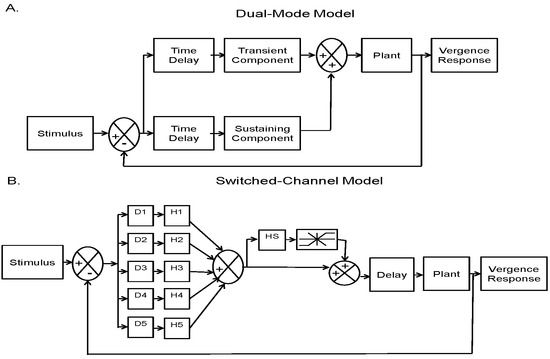
Figure 1.
Block diagram of the (A) Dual-mode model and (B) Switched-channel model.
For the switched-channel model, retinal disparity drives five parallel channels, though additional channels could be added if larger stimuli were involved. Each channel processes a specific disparity range. Channels contain a delay element (D1 to D5) and a leaky integrator. The integrator has different gains and time constants (transfer functions H1 to H5) dependent on the specific channel. In Pobuda’s configuration, the integrators having larger gain and longer time constants are driven by smaller disparities while integrators with smaller gains and shorter time constants are driven by larger disparities. (Pobuda & Erkelens, 1993).
In the original switched-channel model, the oculomotor plant (which represents the extraocular muscles and orbital mechanics) used by Pobuda and Erkelens (1993) had faster time constants than those reported by other investigators. In our research, responses will be simulated using the plant proposed by Pobuda and Erkelens as well as the more widely accepted plant described by Robinson et al. (Robinson, Gordon, & Gordon, 1986). Simulations of the dual-mode model used only the Robinson plant (Hung et al., 1986). Using the same representation of the oculomotor plant will facilitate comparison between the two model controllers.
When the slower plant described by Robinson (1985) was used in conjunction with the switch-channel model, it was necessary to add a nonlinear rate limiter element to the feed-forward path in the switched-channel model. This limiter was required to attain a good fit to experimental responses having the fastest peak velocities of our sample. This element represents an upper limit in the rate of change of a neurological signal and it models limitations imposed by the underlying neurophysiology. Although it was not in the original model, its presence is physiologically reasonable and such limiters have appeared in other models of the vergence system (Yuan, Semmlow, Alvarez, & Munoz, 1999).
The models were constructed using the Simulink software package in Matlab. Model parameters were adjusted to generate vergence responses that matched those found experimentally. Parameter adjustment was done initially using visual comparisons and then parameters were optimized using a local minimizer: the Matlab ‘fmins’ routine which is based on the Simplex search method. To simulate the open-loop experimental condition, the feedback loop was removed from both models. In the switched-channel model, only a single disparity channel was activated, the channel corresponding to the open-loop disparity stimulus. These modifications allowed us to compare the transient component of the dual-mode model to a single disparity channel within the switched-channel model.
Experimental data analysis
Data analysis was performed with a custom Matlab program. Left-eye and right-eye movements were first converted to degrees using the individual calibration data. The system has a high degree of linearity, within 3% between 25° horizontally (Horng, Semmlow, Hung, & Ciuffreda, 1998). This study used a two-point calibration protocol. The left and right eye movement responses were calibrated separately and then the disparity vergence responses were subtracted to yield a net vergence response. Convergence is plotted as positive in all plots. Responses with blinks and saccades were omitted from the analysis. Blinks and saccadic eye movements were easily identified due to their faster dynamics compared to vergence dynamics. Vergence velocities were computed using the two-point central difference algorithm (Bahill, Kallman, & Lieberman, 1982).
The evaluation of simulation compared to the experimental response was based on the error between the two responses. Error was calculated as the summed absolute value of the difference between the simulation and the experimental response over the entire response (2 sec). Differences between simulations were assessed using a student t-test.
Results
Figure 2 shows simulated 4° vergence step responses using the dual-mode published model parameters (Hung et al., 1986) and switched-channel published model parameters (Pobuda & Erkelens, 1993) to validate that the models generated within Matlab matched those reported in the literature. Note, Pobuda and Erkelens’ published model parameters produce simulations that are slower than responses observed experimentally; however, using different parameters, our simulations of their model generated faster responses as shown below.
The dual-mode model signal component (Figure 2A) includes a transient and sustained component (blue and red line, respectively) while the switched-channel model response (Figure 2B) consists of the linear summation of five signal components each generated by a different channel. When the switched-channel model simulates a 4° step stimulus, channel 5 is triggered first since channel 5 processes the largest (i.e., 4°) disparity. There are differences in the time scales between the two simulated responses. The dual-mode model attains the steady-state after approximately 400 msec; whereas, the switchedchannel model using the parameters reported in the literature (Pobuda & Erkelens, 1993) attains the steady-state after 1500 msec. Again, using a different set of model parameters, the switched-channel model can simulate the dynamics of experimental vergence responses.
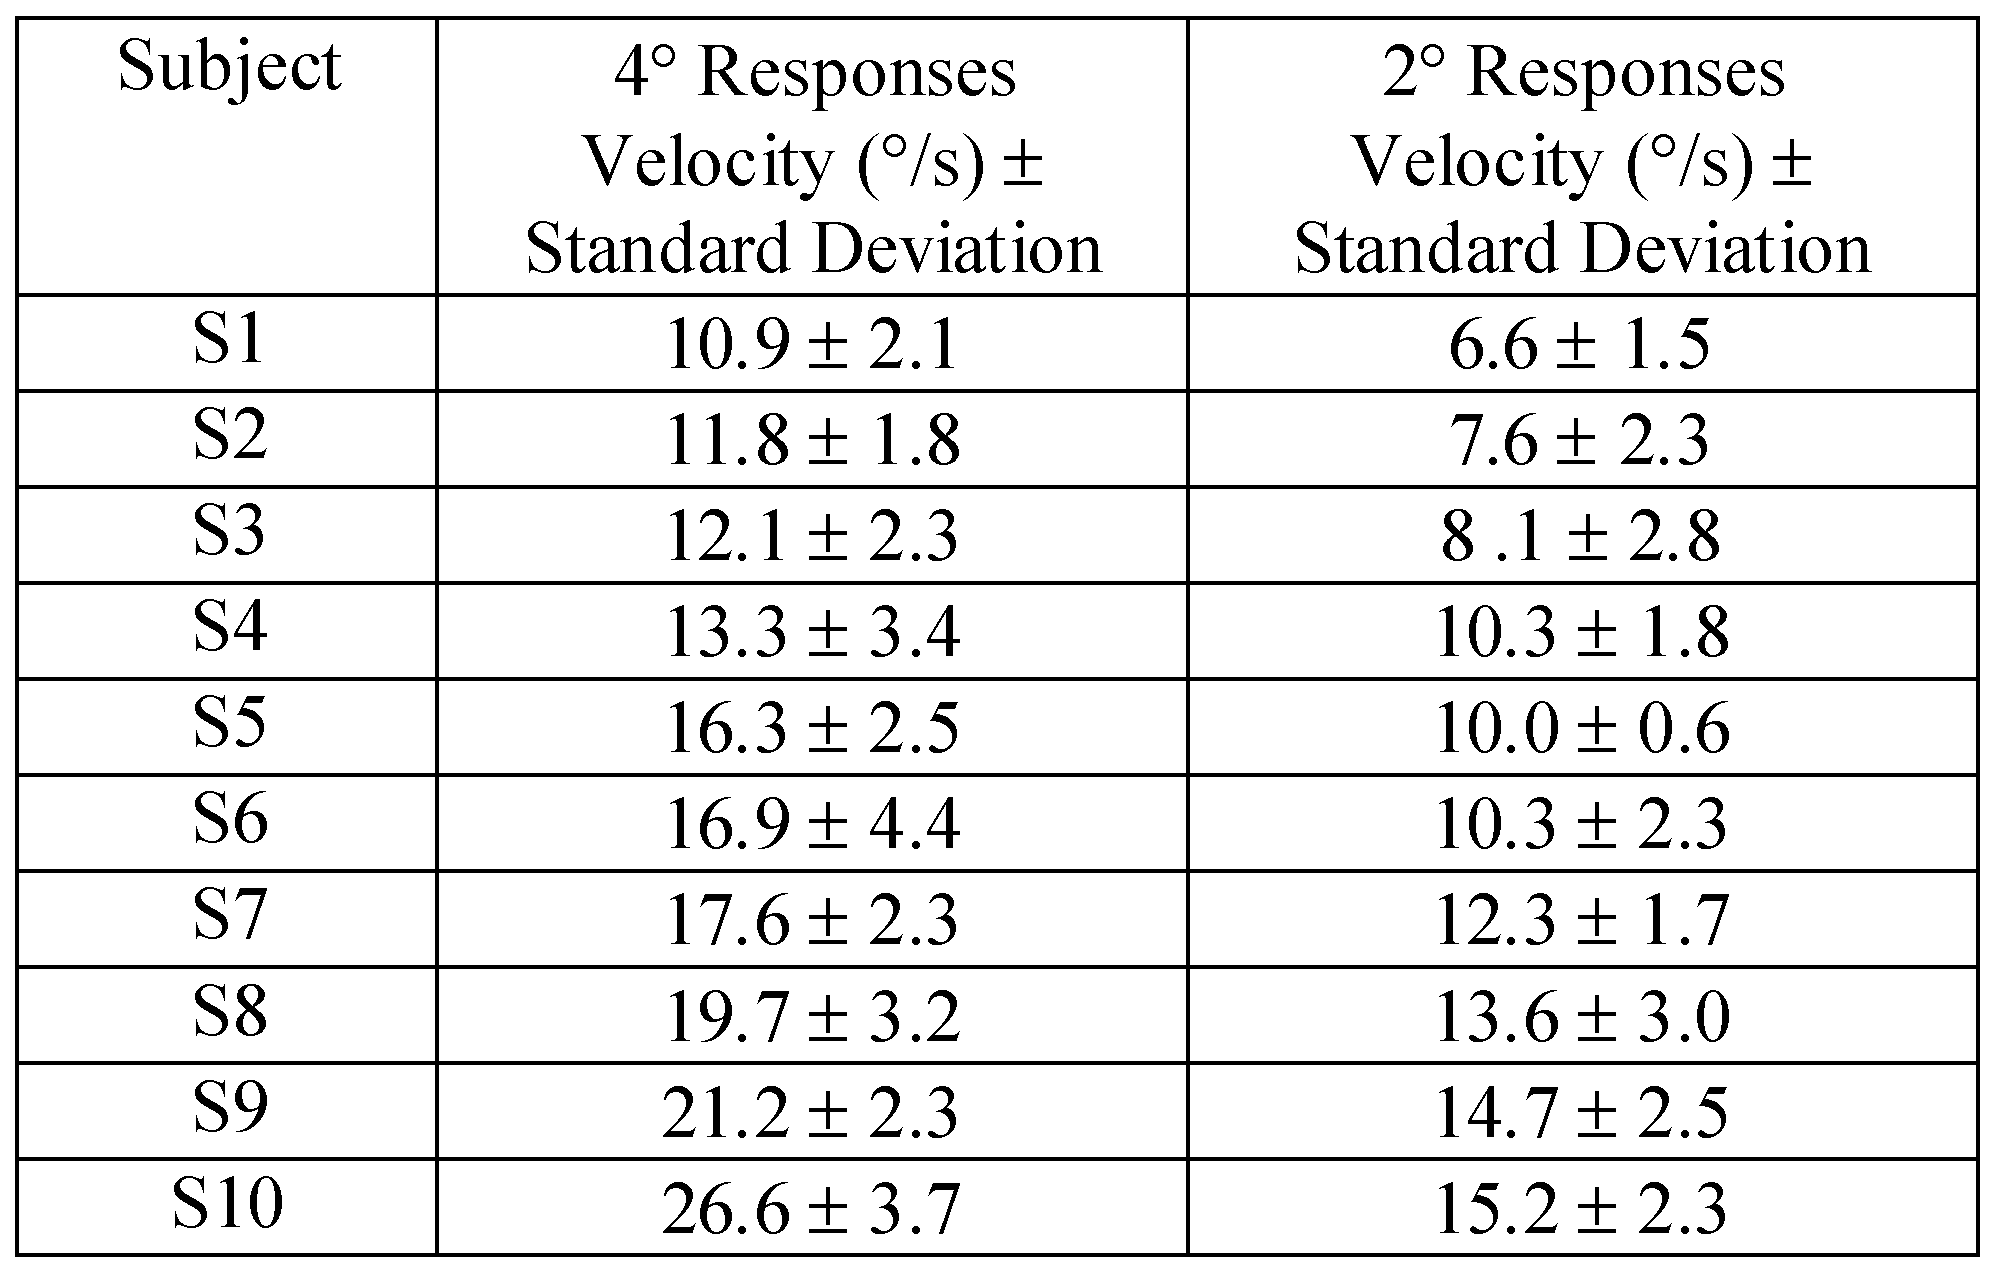
Figure 3 shows ensembles of experimental 4° and 2° convergence responses recorded from subjects S1 and S10. These two subjects had the slowest and fastest peak velocities from our sample of 10 subjects. Results are reported in Table 1. Data were collected from 10 subjects to observe the typical inter-subject variation for 2° and 4° step vergence responses from symmetrical vergence stimuli.
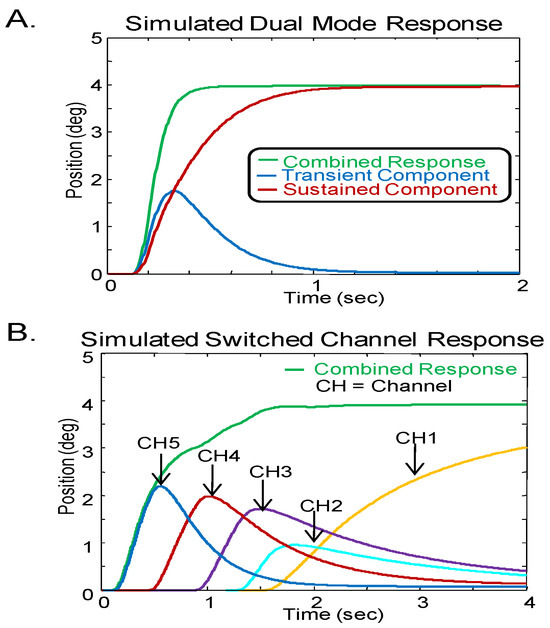
Figure 2.
Model responses from (A) Dual-mode model and (B) Switched-channel model using parameters reported in the literature. In the dual-mode model response, the blue line is the transient component while the red line shows the sustained component. In the switched-channel model, the five channels are represented by yellow, turquoise, purple, red and blue respectively. Both models show the combined response in green. Note, the time scales are different between the models.
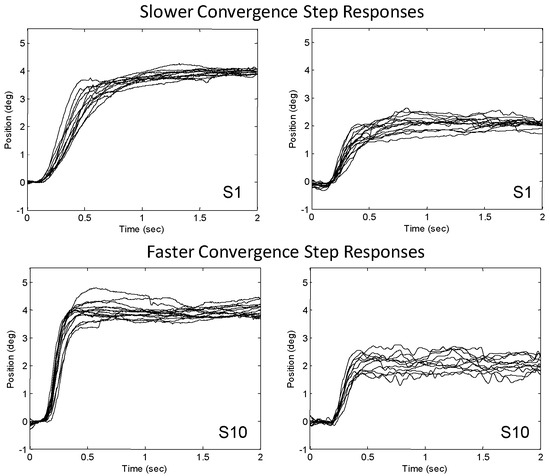
Figure 3.
Typical vergence responses from two subjects, S1 and S10 who had the slowest and fastest peak velocities of the 10 subjects studied, respectively. Left side: 4o responses; right side 2o responses.

Table 1.
Peak Velocity with one standard deviation from 10 Subjects to 4° and 2° symmetrical disparity step stimuli.
Table 1.
Peak Velocity with one standard deviation from 10 Subjects to 4° and 2° symmetrical disparity step stimuli.
In this study, both the dual-mode model and switched-channel model were adjusted to give the best fit between simulated response and a typical 4° experimental responses selected from the ensemble of responses shown in Figure 3. Examples from both the slower responses of subject S1 (Figure 4, left) and the faster responses of subject S10 (Figure 4, right) are shown. The corresponding experimental and simulated velocity responses are shown in figure 5 using the format of Figure 4. Simulation and experimental responses are superimposed for easier comparison. Model parameters used to obtain these simulations are reported in the Appendix. Figure 4 and Figure 5 compare the dual-mode model using the plant parameters proposed by Robinson (upper traces) with the switched-channel model simulated using both the plant proposed in Pobuda and Erkelens’ original paper (middle traces) and the one from Robinson (lower traces).
When the slower plant described by Robinson (1985) was used, it was necessary to add a nonlinear rate limiter element to attain a good fit for the faster dynamic vergence responses, Figure 1B. As mentioned previously, this nonlinear element is a reflection of the maximum positive and negative rates of change of the feed-forward neural signal. The limits were set empirically to 1000°/s and 100°/s respectively as shown in the Appendix along with other model parameters. The model responses shown in Figure 4 and Figure 5 are very similar to experimental responses indicating that these behaviors of can be described by both dual-mode and switchedchannel models over the range of dynamics oberved in our subjects.
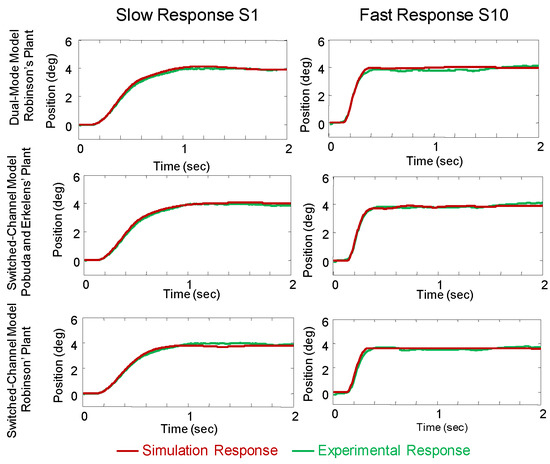
Figure 4.
Comparison of slow and fast position responses using dual-mode and switched-channel models with plants described by either Robinson or Pobuda and Erkelens. The model simulations are plotted as red lines and are compared with typical experimental vergence responses to 4° step stimuli selected from the response ensembles shown in Figure 3 (green lines). Comparisons are shown for both subject S1 who had the slowest average peak velocity and subject S10 who had the fastest average peak velocity of all subjects studied. The dualmode model simulations using Robinson’s plant are shown in the upper plots. The switched-channel model using Pobuda and Erkelens’ original plant and Robinson’s plant are shown in middle plots and lower plots, respectively. Both models with either plant can represent the experimental responses.
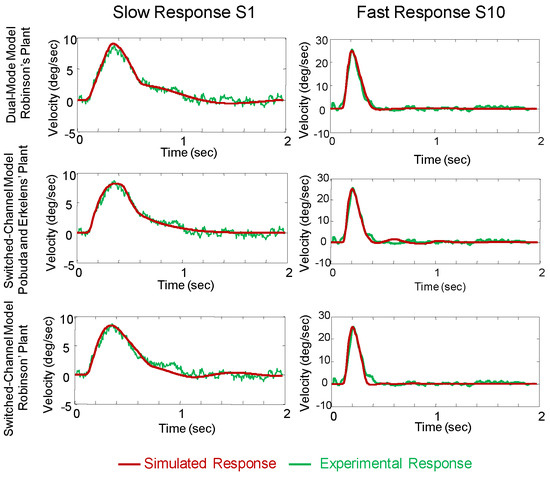
Figure 5.
Comparison of slow and fast velocity responses using dual-mode and switched-channel models following the format used in figure 4. Note, the velocity axes are different scales for the slow and fast responses from S1 and S10. Both models with either plant can model the experimental responses.
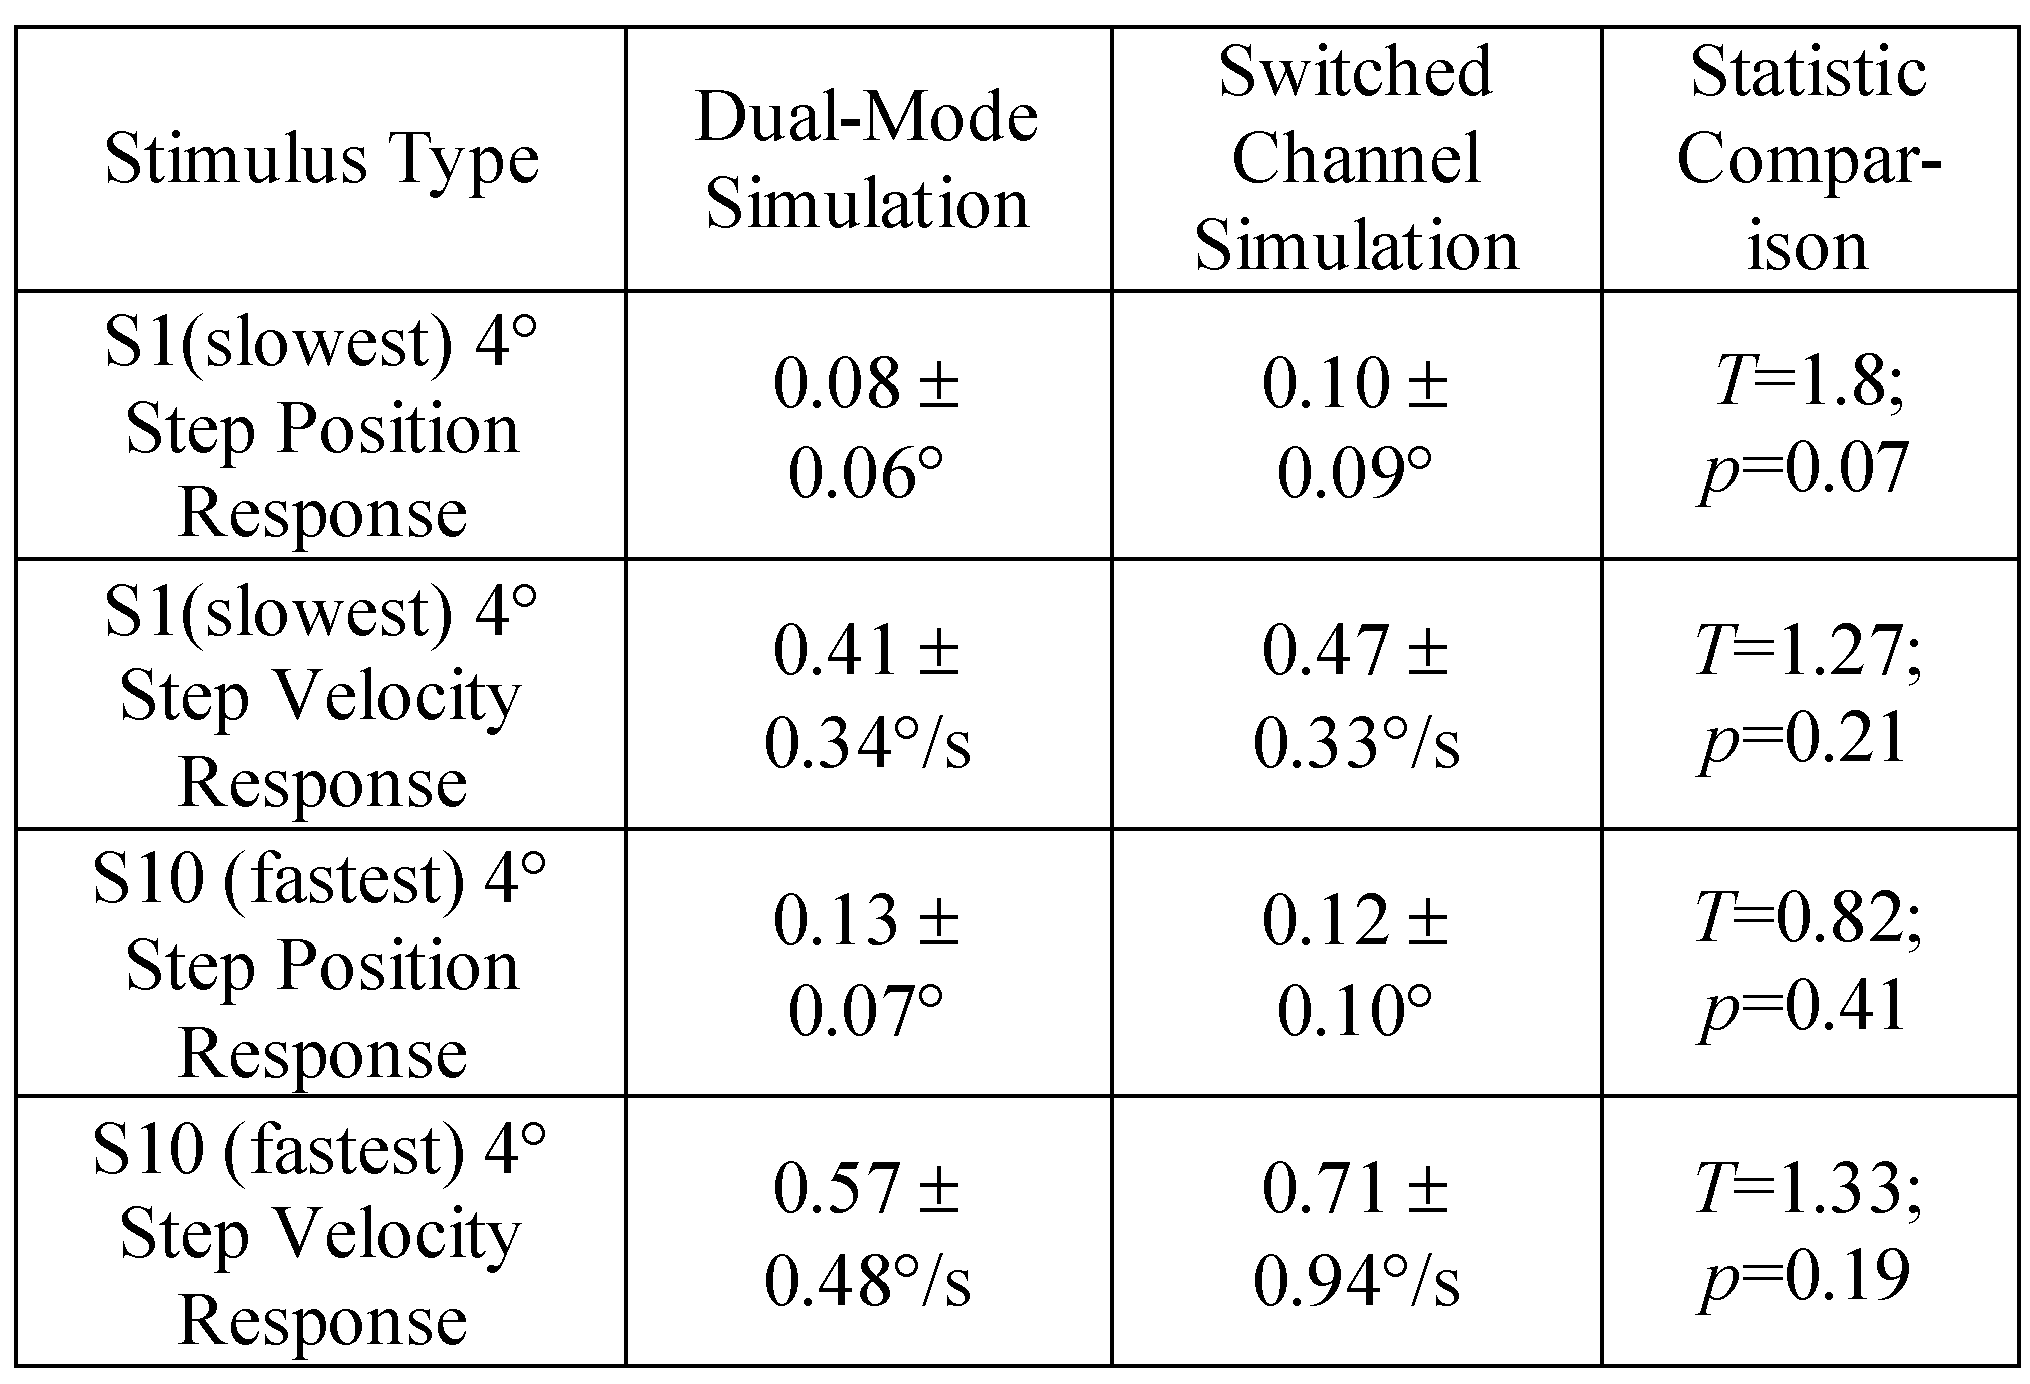
The absolute value of the difference between the experimental response and the simulation was summed over the entire 2.0 sec response for both the slower and faster position and velocity responses. Average errors with one standard deviation are reported in table 2. The dual-mode 4° simulation for the slower response produced a similar average error compared to the switched-channel simulation. A similar trend was observed with the velocity traces. More error was observed with the simulations of S10 who had the faster vergence peak velocity compared to S1. However, the differences were not significantly difference between the two models.

Table 2.
Average error with one standard deviation for the entire response for the dual-mode and switched-channel simulations compared to the 4° experimental responses with a paired t-test statistical comparision.
Table 2.
Average error with one standard deviation for the entire response for the dual-mode and switched-channel simulations compared to the 4° experimental responses with a paired t-test statistical comparision.
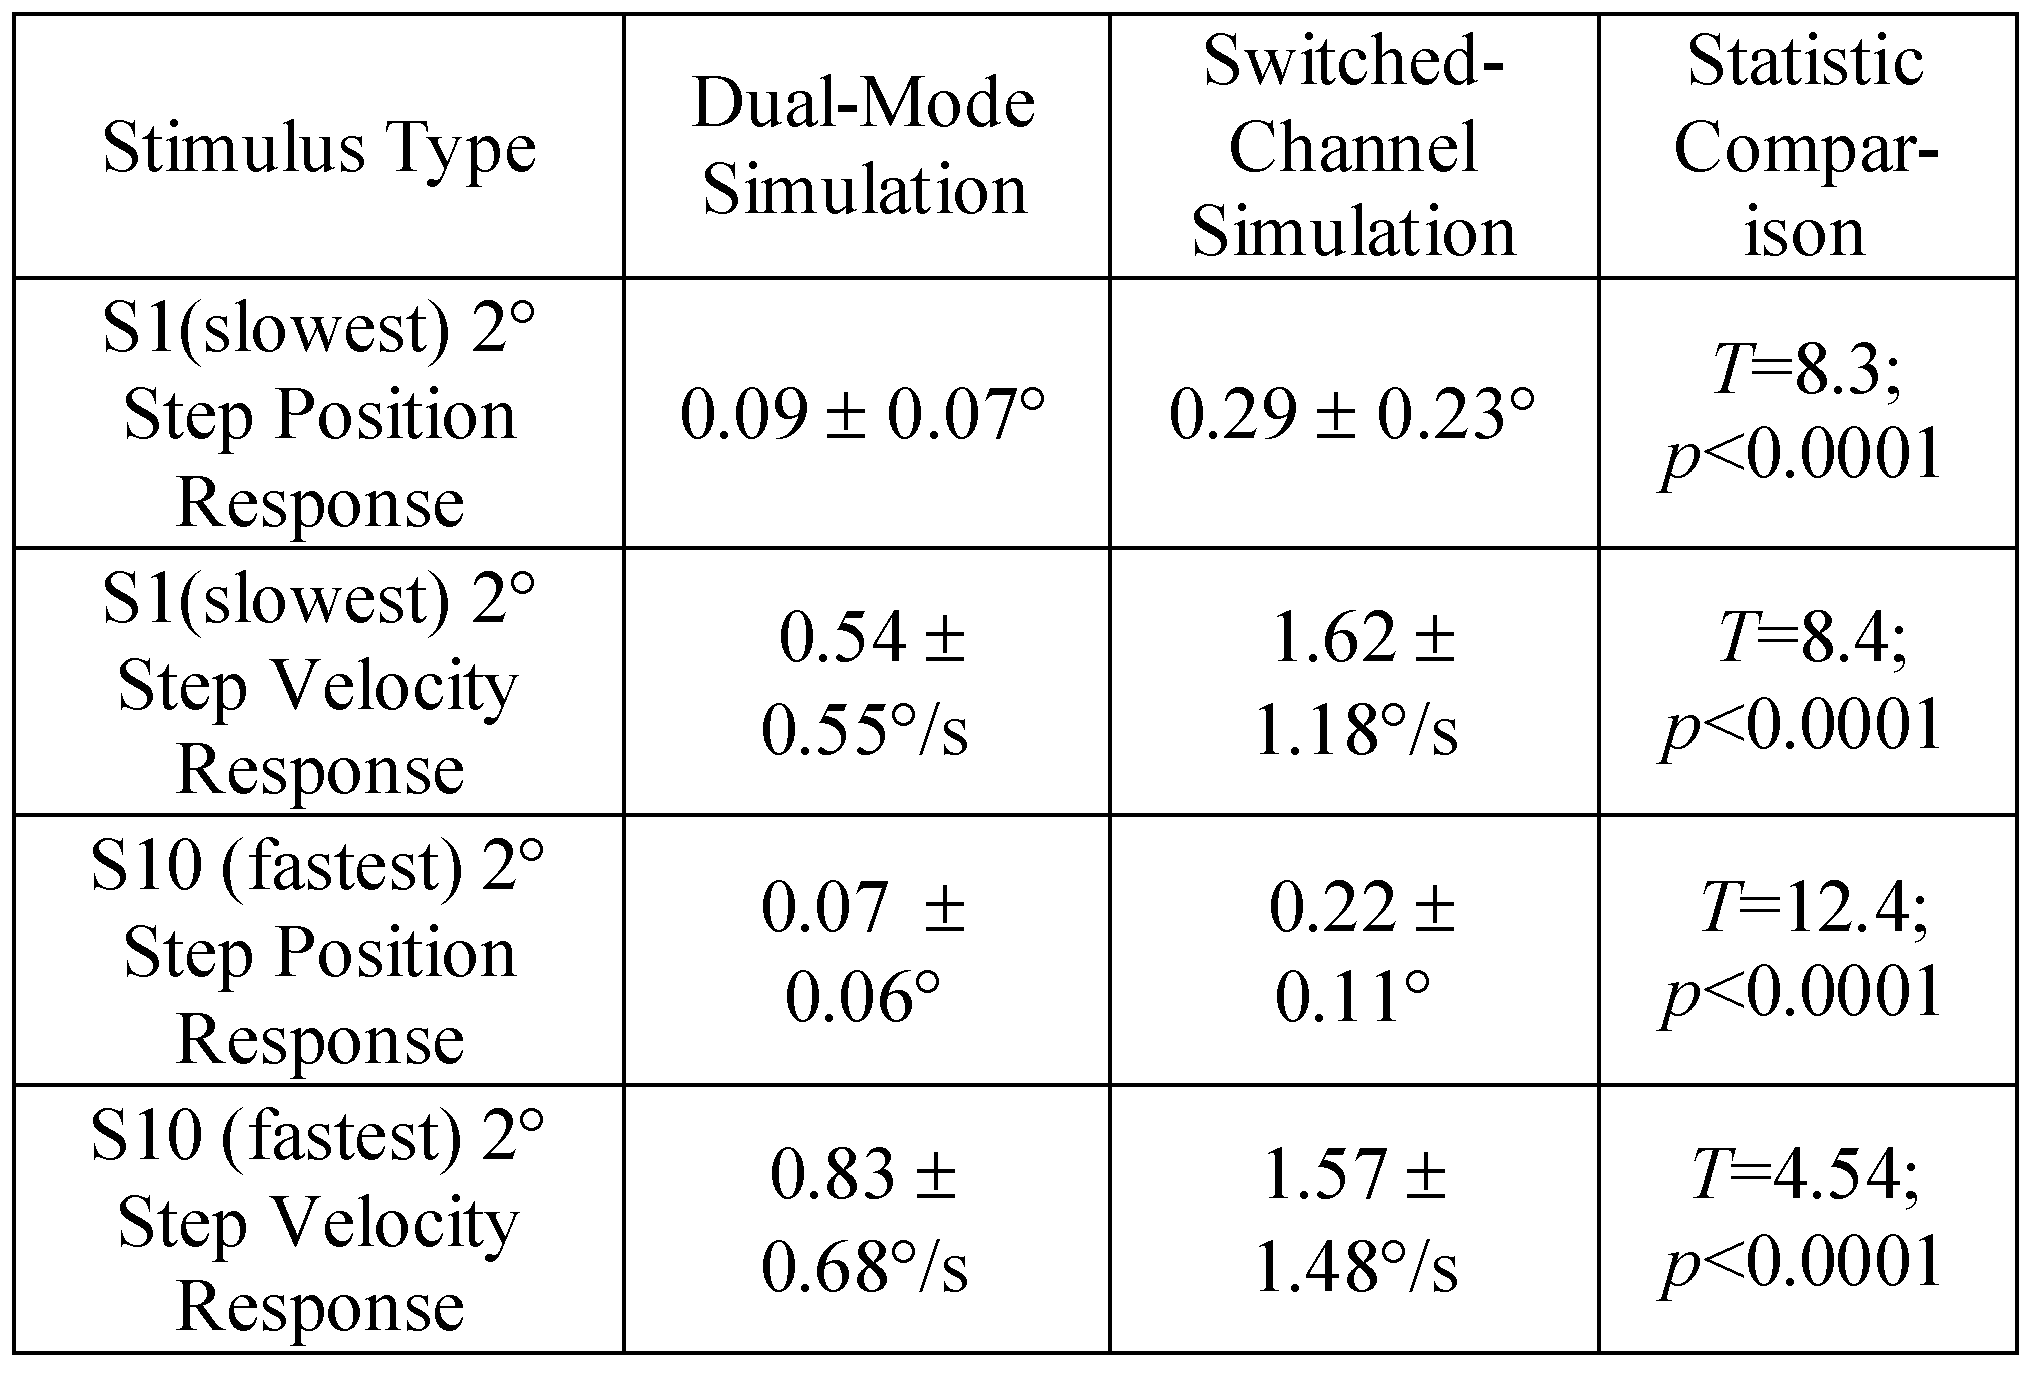
After adjusting parameters for both models using the same plant proposed by Robinson to best represent the 4° vergence responses (Figure 4 for position and Figure 5 for velocity), the simulated input was reduced to 2° to investigate how closely the model would simulate the smaller stimulus (Figure 6). When only reducing the value of the input stimulus, the dual-mode model accurately models the 2° response while the switchedchannel model simulation shows oscillation that produces error (Figure 6A compared to 6B). These errors are summarized in Table 3 where the error is significantly less in with the dual-mode compared to switchedchannel simulations.
The velocity profiles of the slow and fast 2° simulation responses with the experimental response are shown in Figure 7A for the dual-mode, Figure 7B without modification of the switched-channel model and Figure 7C for the switched-channel simulation after the parameters were adjusted for a better fit. The dual-mode model shows a good fit without model adjustments. Similar to the average error within the position traces, the average error for the velocity responses was calculated to assess how well the model simulation represented the experimental response. These errors are summarized in Table 3.

Table 3.
Average error with one standard deviation for the entire response for the dual-mode and switched-channel simulations when input was reduced from 4° to 2° and compared to a 2° experimental responses. A student t-test was used for statistical comparision.
Table 3.
Average error with one standard deviation for the entire response for the dual-mode and switched-channel simulations when input was reduced from 4° to 2° and compared to a 2° experimental responses. A student t-test was used for statistical comparision.
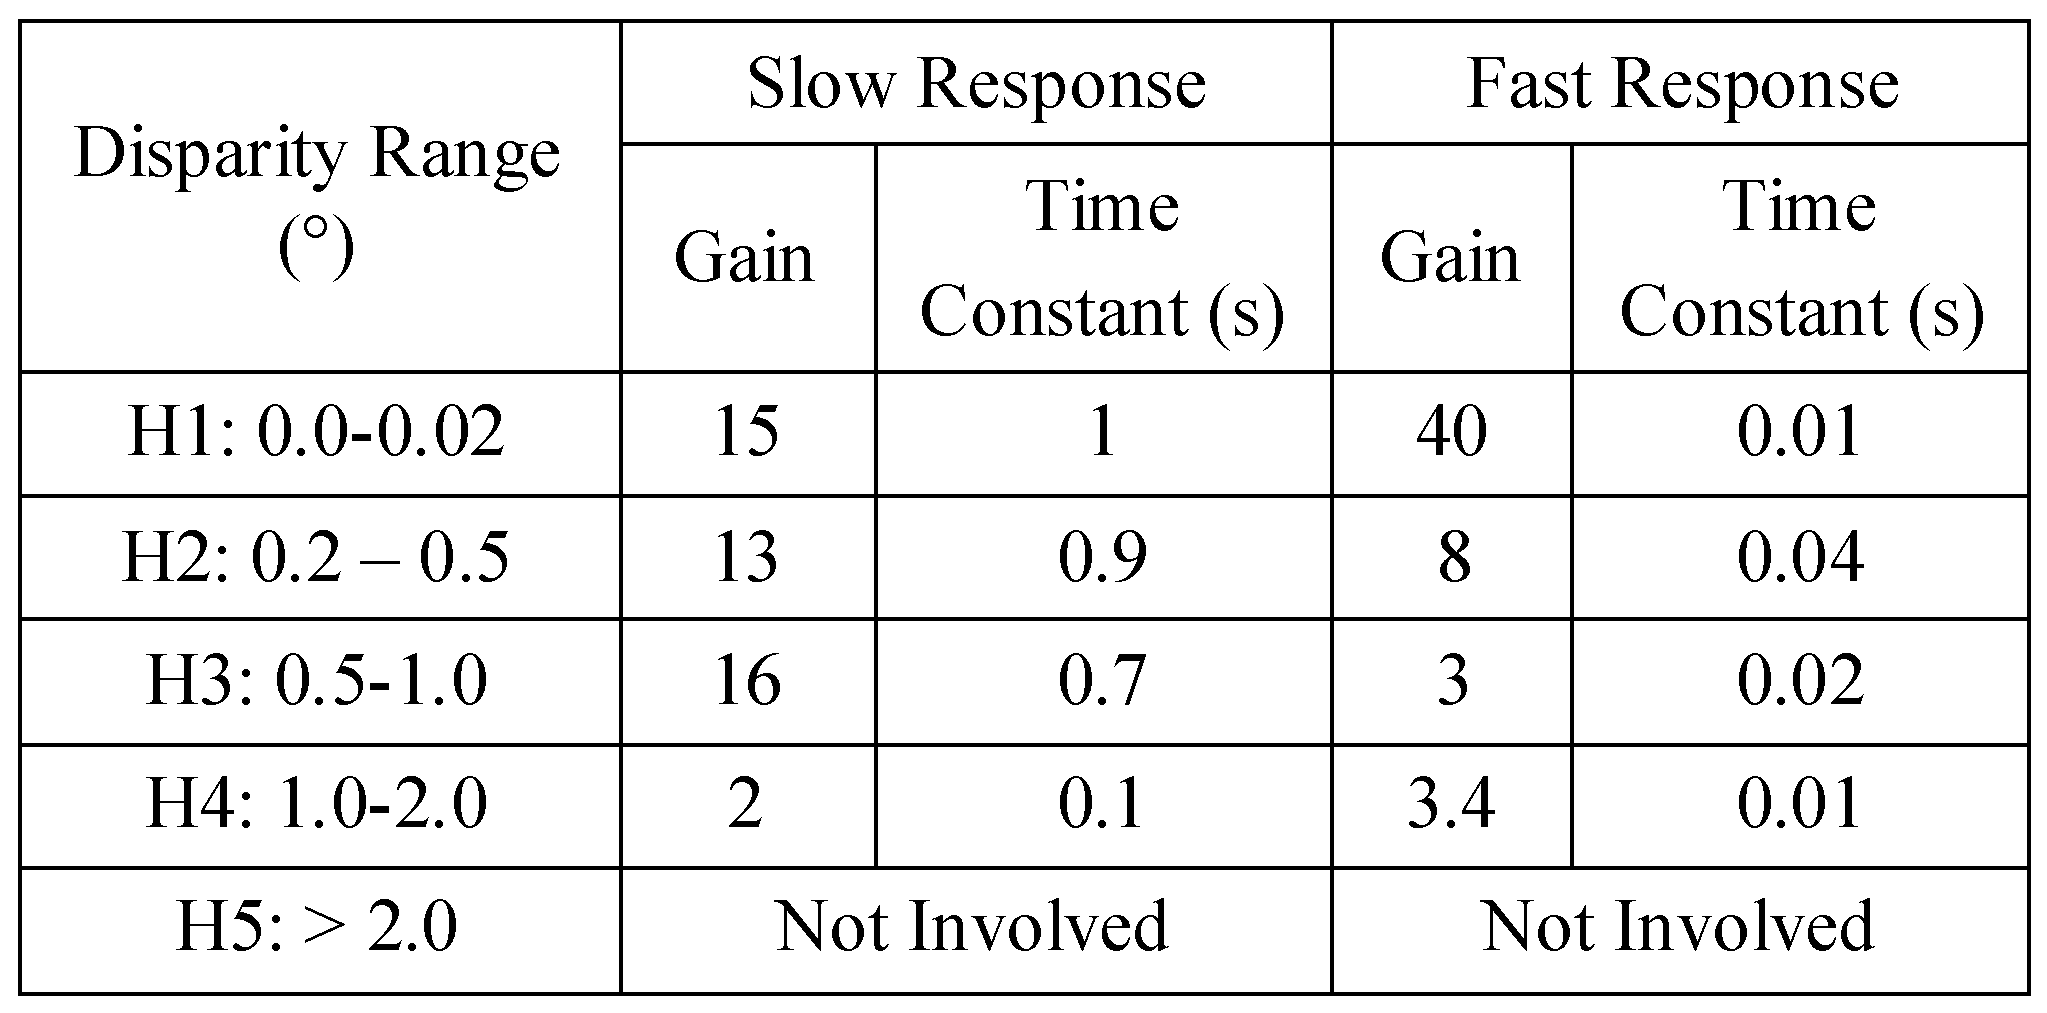
The model parameters in channels 1 through 4 were then adjusted to produce the more reasonable 2° simulations shown in Figure 6C. The exact parameters are shown in the Appendix. The model parameters of channel 5 were not changed because this channel was outside the range of the 2° stimulus and was not involved in mediating the resultant response. There was no significant difference between the average error from the dual-mode and switched-channel model simulations for position or velocity traces after the modification. Average error is reported in Table 4.

Table 4.
Average Error with one standard deviation for the entire response for the Dual-mode and Switched-channel simulations for 2° responses after the Switched-Channel model was adjusted. A student t-test was used for statistical comparision.
Table 4.
Average Error with one standard deviation for the entire response for the Dual-mode and Switched-channel simulations for 2° responses after the Switched-Channel model was adjusted. A student t-test was used for statistical comparision.
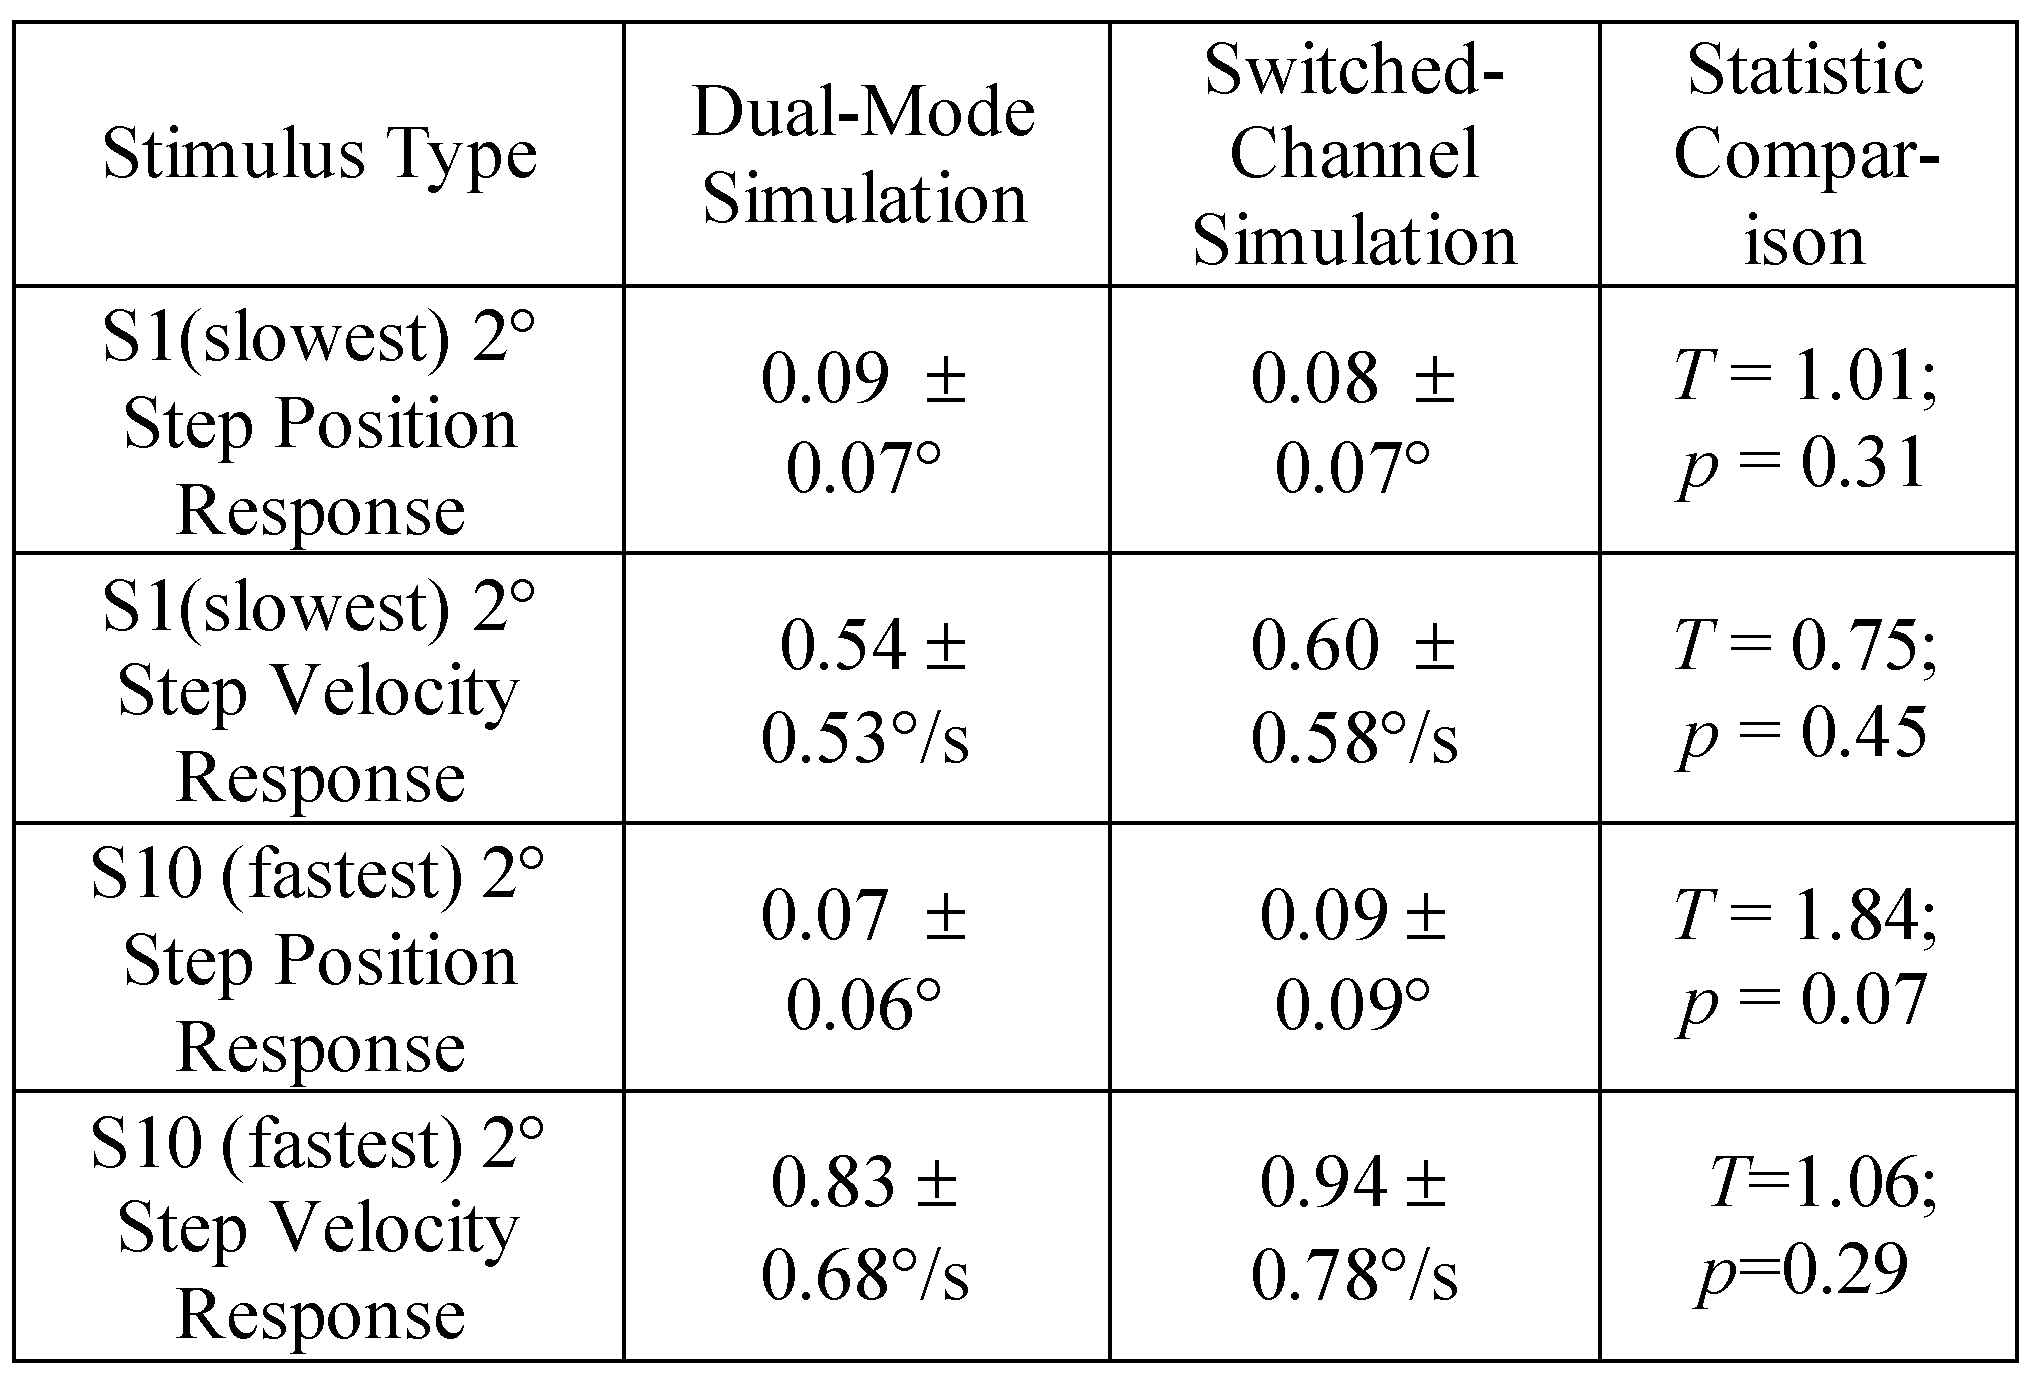
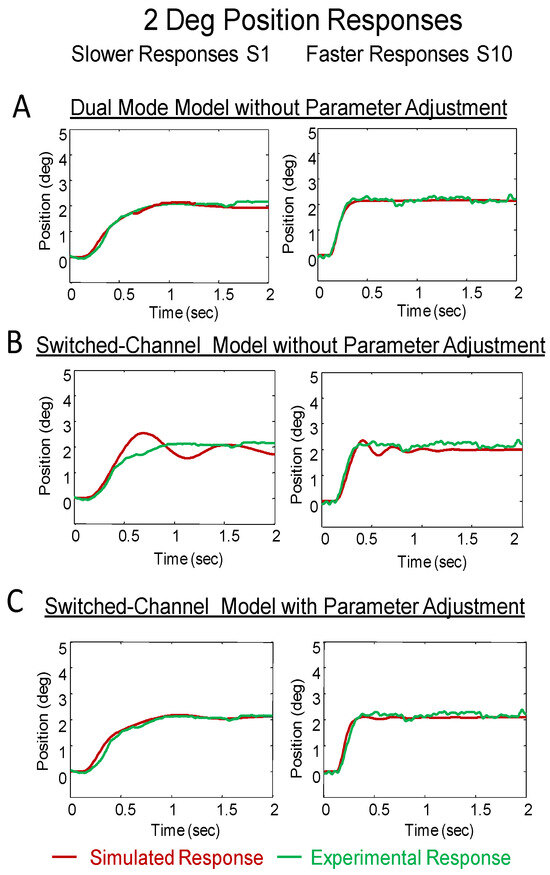
Figure 6.
Comparison of dual-mode and switched-channel models simulation to a slower (left) response from subject S1 and a faster response (right) from subject S10. The simulation is shown in red and the experimental response is in green. The models were adjusted using 4° data then the amplitude of the response was decreased to 2° and compared to several 2° responses. The response with the best fit is shown (Plot A for dual-mode and Plot B for switched-channel). The switchedchannel model could represent the 2° response but only after parameter adjustment (Plot C). All models used the plant pro- posed by Robinson.
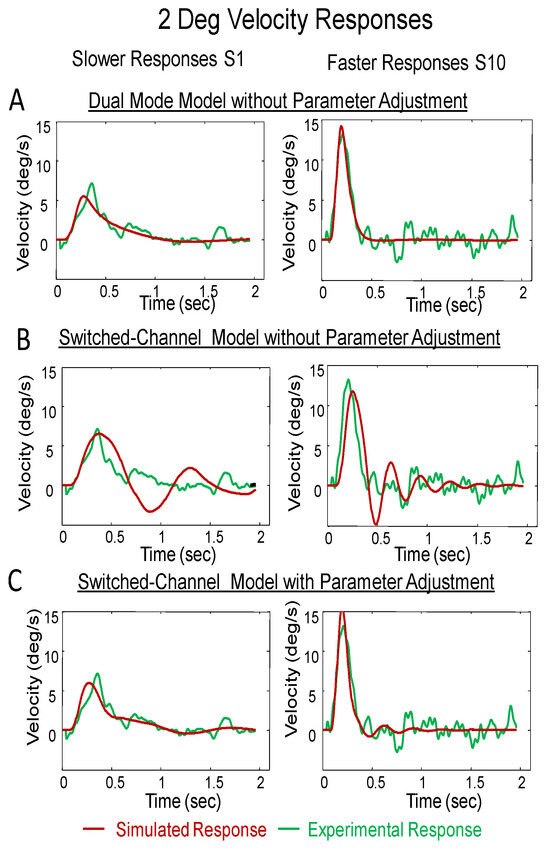
Figure 7.
Experimental responses (green), dual-mode model simulations (blue) and switched-channel model simulations (green) for 2° response from S1 who has slower movements (left) and S10 who has faster movements (right). Plot A and B shows the velocity traces without modification to either the dual-mode or the switched-channel mode, respectively. Plot C shows the velocity traces after modification to the switchedchannel model. All models used the plant proposed by Robinson.
Open-loop responses are important behaviors reported in the literature. (Alvarez et al., 2000; Satgunam, Gowrisankaran, & Fogt, 2009; Sheliga & Miles, 2003) Figure 8 (upper plots) shows the responses from subjects S1 and S10 to a 2° open-loop stimulus in which disparity is held constant. The simulations produced by either the dual-mode (Figure 8 middle plots) or the switchedchannel (Figure 8 lower plots) model do not accurately represent the experimental data. The red line plots the position trajectory while the blue line represents the velocity trajectory. Multiple step-like behaviors are seen in the experimental responses of both subjects, yet this behavior is not found in simulations of open-loop responses generated by either model.
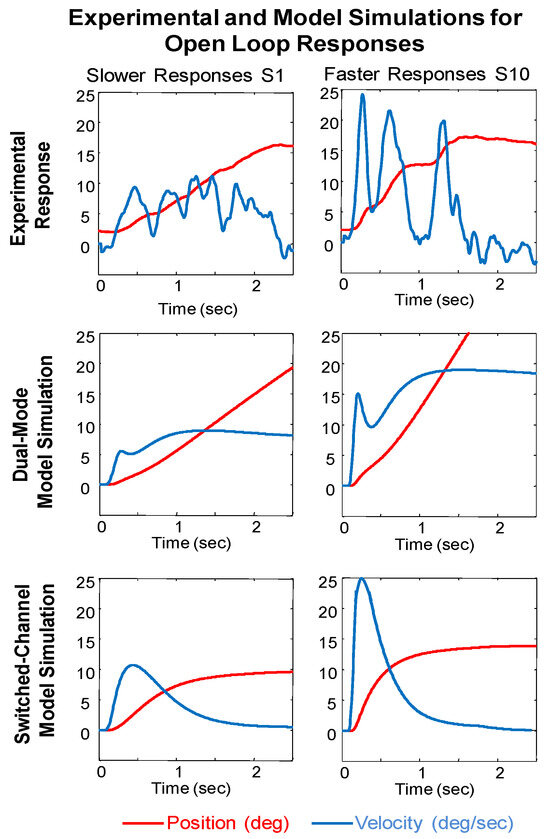
Figure 8.
Open loop 2° experiment. Experimental responses (upper plots), dual-mode model simulations (middle plots) and switched-channel model simulations for response from subject S1 who has slower vergence dynamics (left plots) and from subject S10 who has faster vergence dynamics (right plots). The models used the plant proposed by Robinson. Position is plotted in red and velocity is plotted in blue.
Discussion
Comparison between Models:
In this study, the dual-mode and switched-channel models simulated experimental vergence responses. Results showed that both the dual-mode and switchedchannel model could accurately represent 4° vergence responses of subjects having either slow or fast dynamics. However, when the switched-channel model with Robinson’s plant was used to simulate faster 4° vergence responses, an additional rate-limiter element had to be applied to attain a good fit between the experimental and simulated responses.
The dual-mode model could produce 2° vergence responses that were similar to those obtained experimentally using the same parameter values that were used to simulate 4° responses. In the switched-channel model, most of the parameters had to be readjusted to attain a 2° vergence response that was similar to the experimental response. Prior to readjustment of the switched-channel model parameters, oscillations were seen in simulated responses that were not observed experimentally. The average errors of position and velocity traces were significantly more in the switched-channel compared to the dual-mode when comparing the 2° simulations without any parameter adjustment. In this sense, the dual-mode model is more general than the switched-channel model as it can simulate different amplitudes with fewer parameter changes.
Despite differences in their configuration, the models have interesting similarities in their behavior. The transient component signal from a 4° step stimulus generated using the dual-mode model is similar to the simulated signal from the H5 channel of the switched-channel model: the channel that processes the largest disparity as well as an experimental response. The similarity between these two signals demonstrates why both models can generate essentially the same dynamics. The dualmode model generates the fast transient component in the preprogrammed control element while in the switched-channel model this signal is generated by the outer channel. The outer channel becomes open-loop once channel switching occurs so this channel functions as a preprogrammed (i.e. open-loop) pathway in the switched-channel model.
Neurophysiological Basis of Each Model:
The underlying neurophysiology should be a major consideration in the design and evaluation of biological models. The dual-mode model configuration reflects the neurophysiology of the brainstem where single cell recording on primates found burst and tonic cells in the midbrain which they also termed ‘velocity-encoding’ and ‘position-encoding’ cells respectively (Gamlin & Mays, 1992; Mays & Porter, 1984; Mays, Porter, Gamlin, & Tello, 1986). In the dual-mode model, the tonic signal would be the sustaining component and the burst cell would be the transient component. However, the dual-mode model configuration does not reflect the disparity tuned cells reported in the striate cortex.
A substantial number of neurons in the striate cortex (V1) are shown to be related to the horizontal positional disparity (Barlow, Blakemore, & Pettigrew, 1967; Pettigrew, Nikara, & Bishop, 1968; Poggio, 1995; Poggio, Gonzalez, & Krause, 1988). Disparity tuned cells are represented by the disparity channels within the switched-channel model where the sensory signal is processed by different pathways depending upon the amount of disparity present in the system.
Thus, each model is supported by a portion of the underlying neurophysiology: the dual-mode model better reflects the motor side while the switched-channel model reflects the sensory side of this complex motor control system.
Considerations for Future Models:
Open Loop Responses:
There are several important behavioral responses that neither model can adequately simulate. In the open-loop experiment, the error signal or disparity is held constant and multiple step-like behaviors are seen in the resulting vergence movement (Figure 8). Neither the dual-mode model nor the switched-channel model could accurately simulate the open-loop vergence responses.
The oscillatory behavior seen in the open-loop experimental data have been well studied and are produced by a nonlinear switching operator that is activated when the disparity exceeds a given threshold of approximately 2.7° (Semmlow, Hung, & Ciuffreda, 1986).
Double Step Responses:
Another behavior that was not represented by either model was the double step-like movements sometimes seen in response to a simple step input (Alvarez et al., 1998). If the initial transient convergence does not attain approximately 80% of the intended amplitude, then a secondary high-velocity component was frequently generated. The first-order dynamics of both the first and second high-velocity components were similar indicating the two step-like components were probably produced by the same neural control mechanism. Our laboratory showed that this secondary step-like movement is probably generated by an efference copy signal. (Alvarez et al., 2000) A newer model of dual visual-local feedback model supports an efference copy within its design. (Erkelens, 2011) In their current configurations, the dual-mode, switched-channel or the dual visual-local feedback can mimic this double step behavior. However, both the open-loop and double step behaviors indicate the presence of some type of preprogrammed control in the vergence system.
Dependence on Initial Vergence Angle and Direction:
Our current investigation has shown simulations and experimental results of convergence (inward turning) movements only. Yet, empirical data support that divergence responses at far will be slower than divergence responses at near, and convergence responses at near will be slower than those at far. (Alvarez, Semmlow, & Pedrono, 2005; Kim et al., 2010; Kim, Vicci, Han, & Alvarez, 2011; Lee et al., 2009; Patel, Jiang, & Ogmen, 2001; Patel, et al., 1997). Neither model incorporates an initial vergence angle or direction dependency.
Influence of Phoria and its Adaptation:
Adaptation has many forms. Neither model can represent the influence of phoria or its adaptation. Studies have shown that vergence velocity is a function of a person’s phoria level. Specifically, esophoric subjects have faster convergence peak velocities compared to divergence peak velocities. Conversely, exophoric subjects have faster divergence compared to convergence peak velocities. (Kim et al., 2010) Several more subtle behaviors are also not represented by either model. For example, Patel and colleagues have shown that divergence dynamic can be modified by a sustained fixation (Patel, Jiang, White, & Ogmen, 1999). Others have found similar behavior in both convergence and divergence movements (Kim, et al., 2010; Kim, Vicci, Granger-Donetti, et al., 2011; Kim, Vicci, et al., 2011b; Lee, et al., 2009; Satgunam, et al., 2009).
Modification of Vergence Peak Velocity from Prior Stimuli:
External stimulus conditions have been shown to influence vergence peak velocity. Predictive cues such as prior knowledge of timing, direction and / or magnitude of the stimulus can alter vergence dynamics.(Alvarez, Alkan, Gohel, Douglas Ward, & Biswal, 2010; Alvarez, et al., 2002; Krishnan, Farazian, & Stark, 1973) Vergence gain can also be increased or decreased depending on previous stimuli referred to as conditioning stimuli (Alvarez, Bhavsar, et al., 2005; Munoz, Semmlow, Yuan, & Alvarez, 1999; Takagi et al., 2001; Takagi, Trillenberg, & Zee, 2001).
Saccade – Vergence Interaction:
Neither the dual-mode nor the switched-channel models account for saccade-vergence interaction. Controversies exist in the literature concerning the interaction between saccade and vergence eye movements. (Cullen & Van Horn, 2011; King, 2011; Leigh & Zee, 2006) Previous studies have supported that complex, nonlinear interactions exist between the saccade and vergence subsystems. (van Leeuwen, Collewijn, & Erkelens, 1998; Zee, Fitzgibbon, & Optican, 1992) Several models have been proposed to describe the enhancement of vergence peak velocity response induced by saccade-vergence stimuli (i.e. looking between targets (side-to-side) that are located in different depths (near to far)). These models are based upon 1) the inhibition of the saccadic omnipause neurons (OPN) (Mays & Gamlin, 1995; Zee et al., 1992), 2) both the saccadic pulse and omnipause neuron inhibition (Kumar, Han, Dell'Osso, Durand, & Leigh, 2005; Kumar et al., 2006), 3) a multiplicative interaction between a weighted saccadic burst signal and vergence motor error (Busettini & Mays, 2005), and 4) dual visual with local feedback mechanisms (Erkelens, 2011).
However, a recent study by Van Horn and Cullen suggests that the saccadic system, specifically the saccadic burst neurons (SBNs), by itself can encode the saccade facilitated vergence eye movements. (Van Horn & Cullen, 2008).
It is important to note that the visual stimuli within our study were pure, symmetrical disparity step stimuli and hence generated no retinal stimulation to the saccadic system. For this study, responses with saccades were omitted. Our laboratory and other investigators have published that even when symmetrical vergence stimuli are presented to a subject, many of the responses contain horizontal saccades. (Coubard & Kapoula, 2008; Semmlow et al., 2009; Semmlow et al., 2008).
Conclusion
Simulations of two popular model configurations of vergence motor control have been compared to experimental findings across a range of response dynamics. Although both models can accurately simulate step responses, many important behaviors cannot be produced by either model. Clearly, a new more comprehensive model is warranted that extends behavior capability and takes into account the underlying neurophysiology of both the primary visual cortex and the final common pathway.
Acknowledgements
This work was supported in part by a CAREER award from the National Science Foundation (BES0447713).
Appendix

Table 5.
Parameters used in dual-mode model to generate a 4° simulation response.
Table 5.
Parameters used in dual-mode model to generate a 4° simulation response.
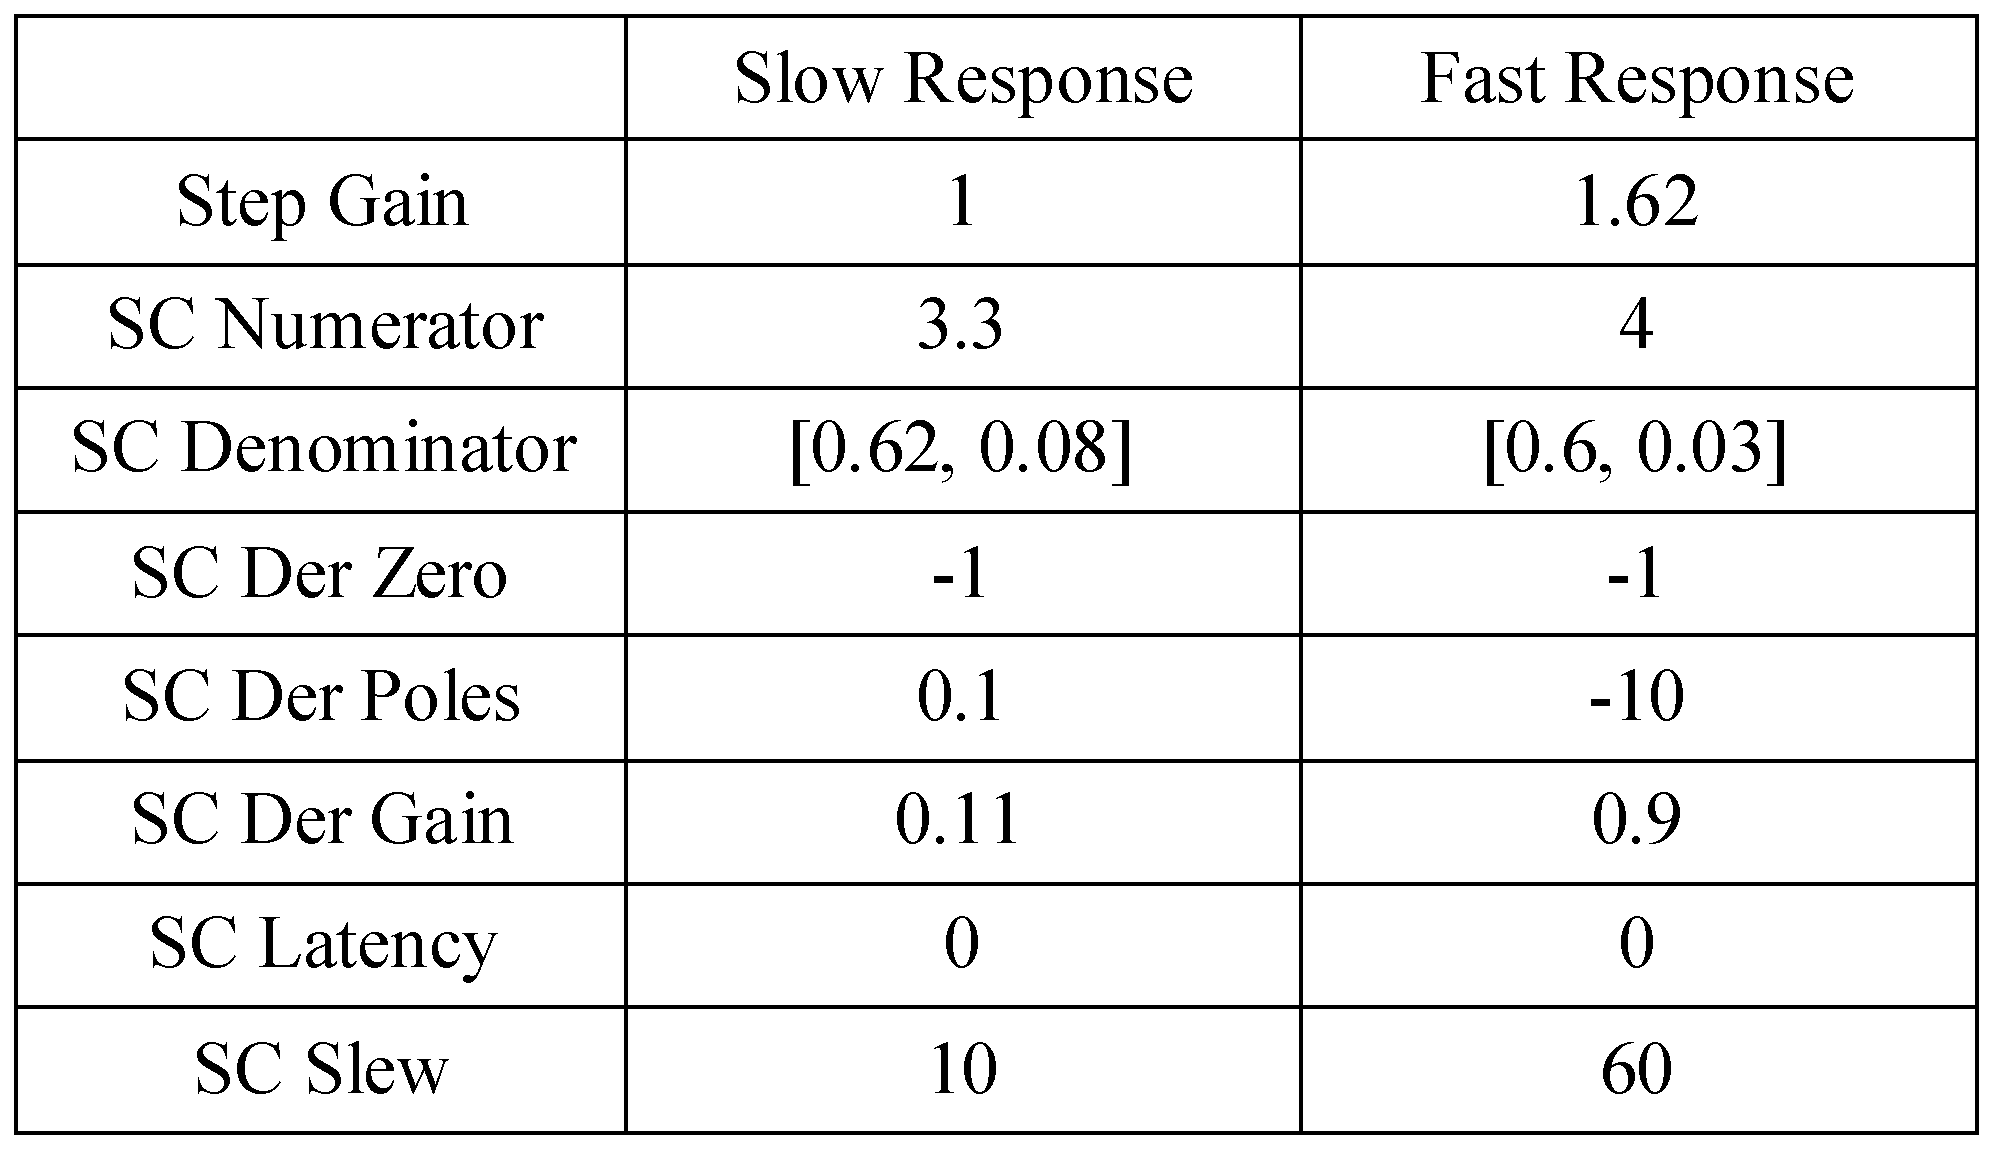

Table 6.
Parameters used in the switched-channel model to generated 4° responses. Rate limiters were placed on H4 and H5 (larger disparity channels) where the rising slew rate was 1000°/s and the falling slew rate was 100° /s. Since 1000° /s is extremely fast for vergence response, it was the falling slew rate that had an impact on the simulations.
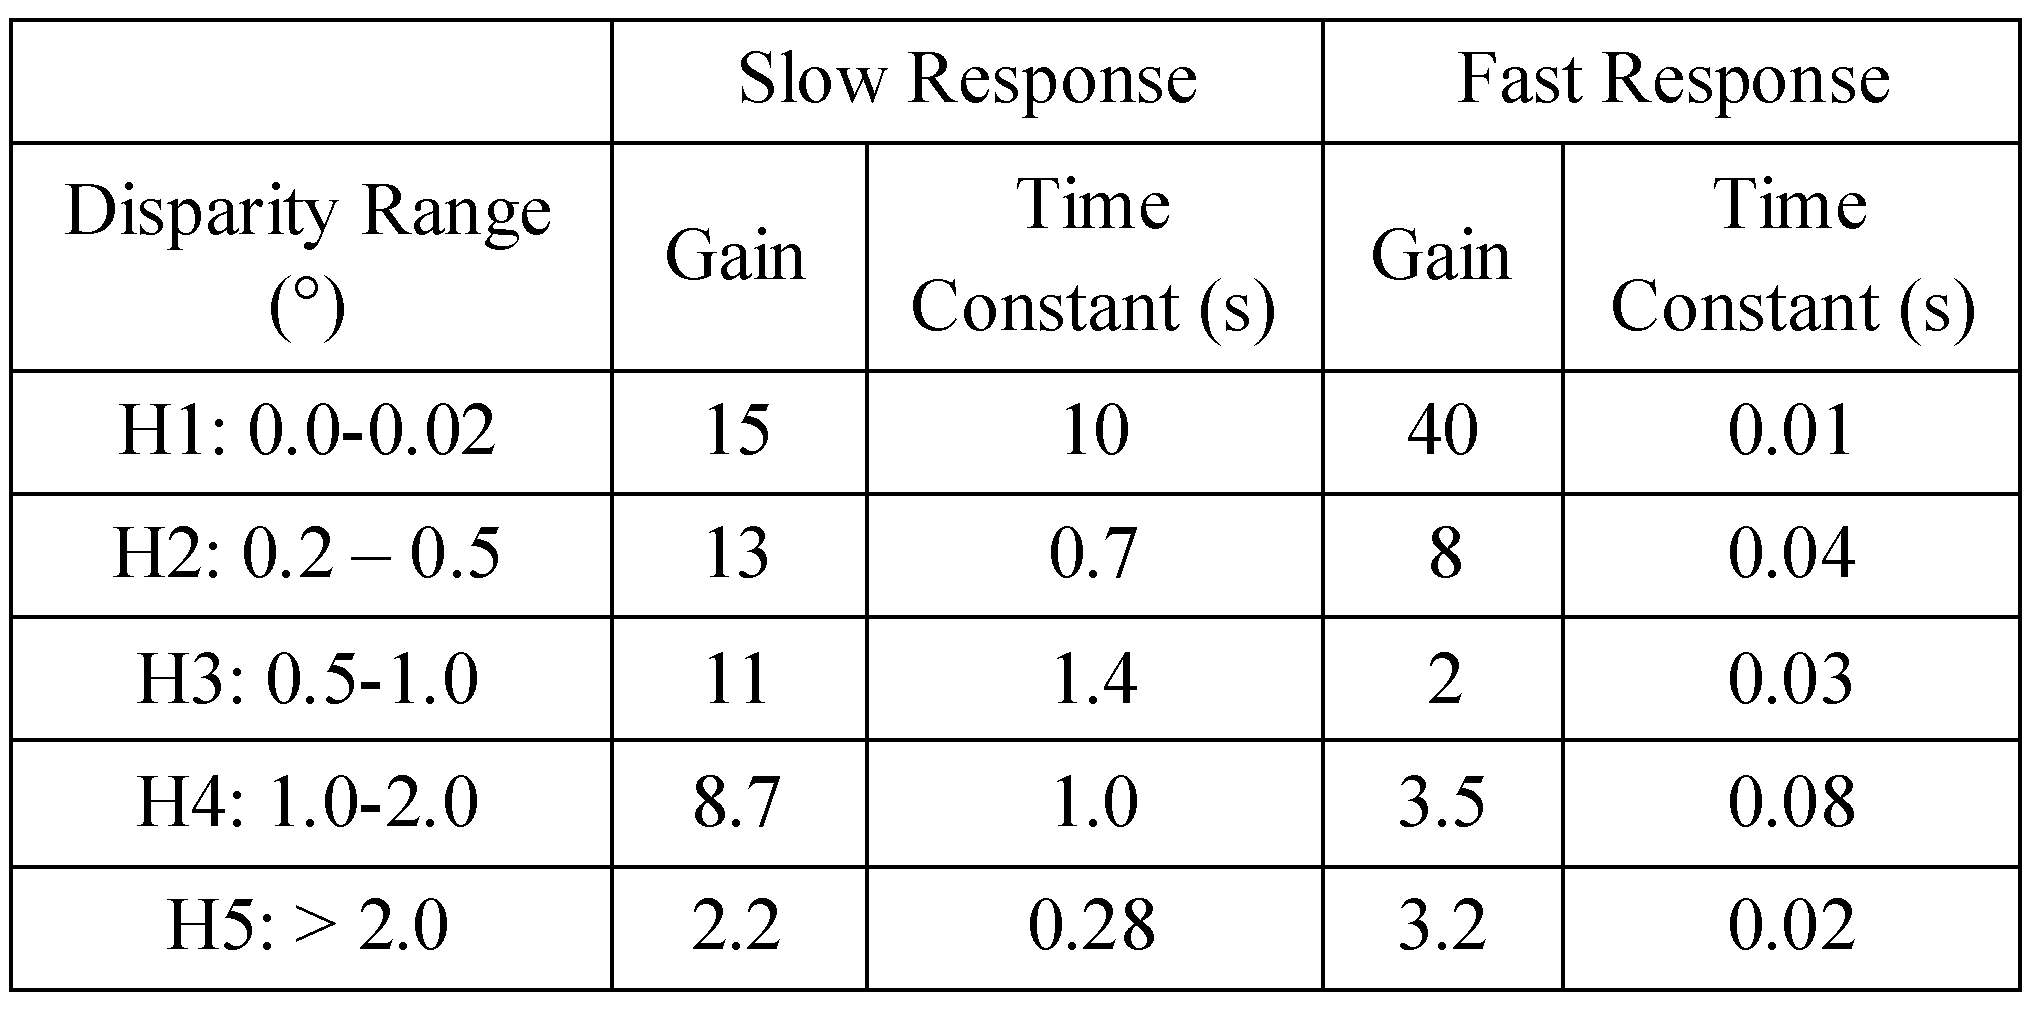

Table 7.
Parameters in switched-channel model used to attain a better fit for the experimental 2° responses.
Table 7.
Parameters in switched-channel model used to attain a better fit for the experimental 2° responses.
References
- Alvarez, T. L., Y. Alkan, S. Gohel, B. Douglas Ward, and B. B. Biswal. 2010. Functional anatomy of predictive vergence and saccade eye movements in humans: a functional MRI investigation. Vision Research 50, 21: 2163–2175. [Google Scholar] [CrossRef]
- Alvarez, T. L., M. Bhavsar, J. L. Semmlow, M. T. Bergen, and C. Pedrono. 2005. Short-term predictive changes in the dynamics of disparity vergence eye movements. Journal of Vision 5, 7: 640–649. [Google Scholar] [CrossRef] [PubMed]
- Alvarez, T. L., J. L. Semmlow, and C. Pedrono. 2005. Divergence eye movements are dependent on initial stimulus position. Vision Research 45, 14: 1847–1855. [Google Scholar] [CrossRef]
- Alvarez, T. L., J. L. Semmlow, and W. Yuan. 1998. Closely spaced, fast dynamic movements in disparity vergence. Journal of Neurophysiology 79, 1: 37–44. [Google Scholar] [CrossRef]
- Alvarez, T. L., J. L. Semmlow, W. Yuan, and P. Munoz. 2000. Disparity vergence double responses processed by internal error. Vision Research 40, 3: 341–347. [Google Scholar] [CrossRef]
- Alvarez, T. L., J. L. Semmlow, W. Yuan, and P. Munoz. 2002. Comparison of Disparity Vergence System Responses to Predictable and Non-predictable Stimulations. Current Pscyhology of Cognition 21, 243–261. [Google Scholar]
- Alvarez, T. L., V. R. Vicci, Y. Alkan, E. H. Kim, S. Gohel, A. M. Barrett, and et al. 2010. Vision Therapy in Adults with Convergence Insufficiency: Clinical and Functional Magnetic Resonance Imaging Measures. Optometry & Visual Science 87, 12: E985–1002. [Google Scholar]
- Bahill, A. T., J. S. Kallman, and J. E. Lieberman. 1982. Frequency limitations of the two-point central difference differentiation algorithm. Biological Cybernetics 45, 1: 1–4. [Google Scholar] [CrossRef]
- Barlow, H. B., C. Blakemore, and J. D. Pettigrew. 1967. The neural mechanism of binocular depth discrimination. Journal of Physiology 193, 2: 327–342. [Google Scholar] [CrossRef]
- Busettini, C., and L. E. Mays. 2005. Saccade-vergence interactions in macaques. II. Vergence enhancement as the product of a local feedback vergence motor error and a weighted saccadic burst. Journal of Neurophysiology 94, 4: 2312–2330. [Google Scholar] [CrossRef]
- Coubard, O. A., and Z. Kapoula. 2008. Saccades during symmetrical vergence. Graefe's Archives of Clinical and Experimental Ophthalmology 246, 4: 521–536. [Google Scholar] [CrossRef] [PubMed]
- Cullen, K. E., and M. R. Van Horn. 2011. The neural control of fast vs. slow vergence eye movements. European Journal of Neuroscience 33, 11: 2147–2154. [Google Scholar] [CrossRef] [PubMed]
- Erkelens, C. J. 2011. A dual visual-local feedback model of the vergence eye movement system. Journal of Vision 11, 10: 1–14. [Google Scholar] [CrossRef][Green Version]
- Gamlin, P. D., and L. E. Mays. 1992. Dynamic properties of medial rectus motoneurons during vergence eye movements. Journal of Neurophysiology 67, 1: 64–74. [Google Scholar] [CrossRef] [PubMed]
- Guo, Y., E. Kim, and T. Alvarez. 2011. VisualEyes: A Modular Software System for Oculomotor Experimentation. Journal of Visualized Experiments. [Google Scholar] [CrossRef]
- Horng, J. L., J. L. Semmlow, G. K. Hung, and K. J. Ciuffreda. 1998. Initial component control in disparity vergence: a model-based study. Institute of Electrical and Electronic Engineers Transactions of Biomedical Engineering 45, 2: 249–257. [Google Scholar]
- Hung, G. K., and J. L. Semmlow. 1980. Static behavior of accommodation and vergence: computer simulation of an interactive dual-feedback system. Institute of Electrical and Electronic Engineers Transactions of Biomedical Engineering 27, 8: 439–447. [Google Scholar] [CrossRef]
- Hung, G. K., J. L. Semmlow, and K. J. Ciuffreda. 1986. A dual-mode dynamic model of the vergence eye movement system. Institute of Electrical and Electronic Engineers Transactions of Biomedical Engineering 33, 11: 1021–1028. [Google Scholar] [CrossRef]
- Jiang, B. C., G. K. Hung, and K. J. Ciuffreda. 2002. Models of the Visual System. New York: Kluwer Academic/ Plenum Publishers. [Google Scholar]
- Jones, R. 1980. Fusional vergence: sustained and transient components. American Journal of Optometry Physiological Optics 57, 9: 640–644. [Google Scholar] [CrossRef]
- Kim, E. H., and T. L. Alvarez. 2012. The frequency of horizontal saccades in near and far symmetrical disparity vergence. Vision Research Accepted. [Google Scholar]
- Kim, E. H., B. Granger-Donetti, V. R. Vicci, and T. L. Alvarez. 2010. The relationship between phoria and the ratio of convergence peak velocity to divergence peak velocity. Investigative Ophthalmology and Visual Science 51, 8: 4017–4027. [Google Scholar] [CrossRef]
- Kim, E. H., V. R. Vicci, B. Granger-Donetti, and T. L. Alvarez. 2011. Short-Term Adaptations of the Dynamic Disparity Vergence and Phoria Systems. Experimental Brain Research 212, 2: 267–78. [Google Scholar] [CrossRef] [PubMed]
- Kim, E. H., V. R. Vicci, S. J. Han, and T. L. Alvarez. 2011. Sustained fixation induced changes in phoria and convergence peak velocity. Public Library of Science (PLoS) One 6, 6: e20883. [Google Scholar] [CrossRef]
- King, W. M. 2011. Binocular coordination of eye movements--Hering's Law of equal innervation or uniocular control? European Journal of Neuroscience 33, 11: 2139–2146. [Google Scholar] [CrossRef]
- Krishnan, V. V., F. Farazian, and L. Stark. 1973. An analysis of latencies and prediction in the fusional vergence system. American Journal of Optometry and Archives of the American Academy of Optometry 50, 12: 933–939. [Google Scholar] [CrossRef] [PubMed]
- Krishnan, V. V., and L. Stark. 1977. A heuristic model for the human vergence eye movement system. Institute of Electrical and Electronic Engineers Transactions of Biomedical Engineering 24, 1: 44–49. [Google Scholar] [CrossRef]
- Kumar, A. N., Y. Han, L. F. Dell'Osso, D. M. Durand, and R. J. Leigh. 2005. Directional asymmetry during combined saccade-vergence movements. Journal of Neurophysiology 93, 5: 2797–2808. [Google Scholar] [CrossRef] [PubMed]
- Kumar, A. N., Y. H. Han, R. F. Kirsch, L. F. Dell'Osso, W. M. King, and R. J. Leigh. 2006. Tests of models for saccade-vergence interaction using novel stimulus conditions. Biological Cybernetics 95, 2: 143–157. [Google Scholar] [CrossRef]
- Lee, Y. Y., B. Granger-Donetti, C. Chang, and T. L. Alvarez. 2009. Sustained convergence induced changes in phoria and divergence dynamics. Vision Research 49, 24: 2960–2972. [Google Scholar] [CrossRef]
- Lee, Y. Y., T. Chen, and T.L. Alvarez. 2008. Quantitative assessment of divergence eye movements. Journal of Vision 8, 12: 1–13. [Google Scholar]
- Leigh, R. J., and D. S. Zee. 2006. The Neurology of Eye Movements, 4th ed. New York: Oxford University Press. [Google Scholar]
- Mays, L. E., and P. D. R. Gamlin. 1995. Edited by J. M. Findlay, R. Walker and R.W. K. A neural mechanism subserving saccade-vergence interactions. In Eye Movement Research: Mechanisms, Processess and Applications. Amsterdam: Elsevier: pp. 215–223. [Google Scholar]
- Mays, L. E., and J. D. Porter. 1984. Neural control of vergence eye movements: activity of abducens and oculomotor neurons. Journal of Neurophysiology 52, 4: 743–761. [Google Scholar] [CrossRef]
- Mays, L. E., J. D. Porter, P. D. Gamlin, and C. A. Tello. 1986. Neural control of vergence eye movements: neurons encoding vergence velocity. Journal of Neurophysiology 56, 4: 1007–1021. [Google Scholar] [CrossRef] [PubMed]
- Munoz, P., J. L. Semmlow, W. Yuan, and T. L. Alvarez. 1999. Short term modification of disparity vergence eye movements. Vision Research 39, 9: 1695–1705. [Google Scholar] [CrossRef]
- Patel, S. S., B. C. Jiang, and H. Ogmen. 2001. Vergence dynamics predict fixation disparity. Neural Computation 13, 7: 1495–1525. [Google Scholar] [CrossRef]
- Patel, S. S., B. C. Jiang, J. M. White, and H. Ogmen. 1999. Nonlinear alteration of transient vergence dynamics after sustained convergence. Optometry & Visual Science 76, 9: 656–663. [Google Scholar]
- Patel, S. S., H. Ogmen, J. M. White, and B. C. Jiang. 1997. Neural network model of short-term horizontal disparity vergence dynamics. Vision Research 37, 10: 1383–1399. [Google Scholar] [CrossRef]
- Pettigrew, J. D., T. Nikara, and P. O. Bishop. 1968. Binocular interaction on single units in cat striate cortex: simultaneous stimulation by single moving slit with receptive fields in correspondence. Experimental Brain Research 6, 4: 391–410. [Google Scholar] [CrossRef]
- Pobuda, M., and C. J. Erkelens. 1993. The relationship between absolute disparity and ocular vergence. Biological Cybernetics 68, 3: 221–228. [Google Scholar] [CrossRef] [PubMed]
- Poggio, G. E. 1995. Mechanisms of stereopsis in monkey visual cortex. Cerebral Cortex 5, 3: 193–204. [Google Scholar] [CrossRef]
- Poggio, G. F., F. Gonzalez, and F. Krause. 1988. Stereoscopic mechanisms in monkey visual cortex: binocular correlation and disparity selectivity. Journal of Neuroscience 8, 12: 4531–4550. [Google Scholar] [CrossRef]
- Rashbass, C., and G. Westheimer. 1961. Disjunctive eye movements. Journal of Physiology 159, 336–339. [Google Scholar] [CrossRef]
- Robinson, D. A., J. L. Gordon, and S. E. Gordon. 1986. A model of the smooth pursuit eye movement system. Biological Cybernetics 55, 1: 43–57. [Google Scholar] [CrossRef] [PubMed]
- Satgunam, P., S. Gowrisankaran, and N. Fogt. 2009. The influence of vergence adaptation on open-loop vergence dynamics. Vision Research 49, 14: 1795–1804. [Google Scholar] [CrossRef]
- Schor, C. M. 1979. The relationship between fusional vergence eye movements and fixation disparity. Vision Research 19, 12: 1359–1367. [Google Scholar] [CrossRef]
- Semmlow, G. K. Hung, and K. J. Ciuffreda. 1986. Quantitative assessment of disparity vergence components. Investigative Ophthalmology and Visual Science 27, 4: 558–564. [Google Scholar]
- Semmlow, J. L., Y. F. Chen, B. Granger-Donnetti, and T. L. Alvarez. 2009. Correction of Saccade-Induced Midline Errors in Responses to Pure Disparity Vergence Stimuli. Journal of Eye Movement Research 2, 5: 1–13. [Google Scholar] [CrossRef]
- Semmlow, J. L., Y. F. Chen, C. Pedrono, and T. Alvarez. 2008. Saccadic Behavior during the response to Pure Disparity Vergence Stimuli I: General Properties. Journal of Eye Movement Research 1, 1–11. [Google Scholar]
- Semmlow, J. L., G. K. Hung, J. L. Horng, and K. Ciuffreda. 1993. Initial control component in disparity vergence eye movements. Ophthalmic and Physiological Optics 13, 1: 48–55. [Google Scholar] [CrossRef]
- Semmlow, J. L., G. K. Hung, J. L. Horng, and K. J. Ciuffreda. 1994. Disparity vergence eye movements exhibit preprogrammed motor control. Vision Research 34, 10: 1335–1343. [Google Scholar] [CrossRef] [PubMed]
- Semmlow, J. L., G. K. Hung, and K. J. Ciuffreda. 1986. Quantitative Assessment of Disparity Vergence Components. Investigative Ophthalmology and Visual Science 27, (4): 558–564. [Google Scholar]
- Sheliga, B. M., and F. A. Miles. 2003. Perception can influence the vergence responses associated with open-loop gaze shifts in 3D. Journal of Vision 3, 11: 654–676. [Google Scholar] [CrossRef][Green Version]
- Takagi, M., H. Oyamada, H. Abe, D. S. Zee, H. Hasebe, A. Miki, and et al. 2001. Adaptive changes in dynamic properties of human disparity-induced vergence. Investigative Ophthalmology and Visual Science 42, 7: 1479–1486. [Google Scholar] [PubMed]
- Takagi, M., P. Trillenberg, and D. S. Zee. 2001. Adaptive control of pursuit, vergence and eye torsion in humans: basic and clinical implications. Vision Research 41, 25–26: 3331–3344. [Google Scholar] [CrossRef] [PubMed]
- Van Horn, M. R., and K. E. Cullen. 2008. Dynamic coding of vertical facilitated vergence by premotor saccadic burst neurons. Journal of Neurophysiology 100, 4: 1967–1982. [Google Scholar] [CrossRef] [PubMed]
- van Leeuwen, A. F., H. Collewijn, and C. J. Erkelens. 1998. Dynamics of horizontal vergence movements: interaction with horizontal and vertical saccades and relation with monocular preferences. Vision Research 38, 24: 3943–3954. [Google Scholar] [CrossRef]
- Ying, S. H., and D. S. Zee. 2006. Phoria adaptation after sustained symmetrical convergence: Influence of saccades. Experimental Brain Research 171, 3: 297–305. [Google Scholar] [CrossRef]
- Yuan, W., and J. L. Semmlow. 2000. The influence of repetitive eye movements on vergence performance. Vision Research 40, 22: 3089–3098. [Google Scholar] [CrossRef]
- Yuan, W., J. L. Semmlow, T. L. Alvarez, and P. Munoz. 1999. Dynamics of the disparity vergence step response: a model-based analysis. Institute of Electrical and Electronic Engineers Transactions of Biomedical Engineering 46, 10: 1191–1198. [Google Scholar]
- Zee, D. S., E. J. Fitzgibbon, and L. M. Optican. 1992. Saccade-vergence interactions in humans. Journal of Neurophysiology 68, 5: 1624–1641. [Google Scholar] [CrossRef]
© 2012 by the authors. This article is licensed under a Creative Commons Attribution 4.0 International License.