Next Article in Journal
Assessment of Dual-Mode and Switched-Channel Models with Experimental Vergence Responses
Previous Article in Journal
Individual Differences in Eye-Movements During Reading: Working Memory and Speed-of-Processing Effects
 
 
Journal of Eye Movement Research is published by MDPI from Volume 18 Issue 1 (2025). Previous articles were published by another publisher in Open Access under a CC-BY (or CC-BY-NC-ND) licence, and they are hosted by MDPI on mdpi.com as a courtesy and upon agreement with Bern Open Publishing (BOP).
Article

Vergence Tracking: A Tool to Assess Oculomotor Performance in Stereoscopic Displays

by
Pascaline Neveu
1,
Matthieu Philippe
1,
Anne-Emmanuelle Priot
1,
Philippe Fuchs
2 and
Corinne Roumes
1
1
IRBA, France
2
Mines ParisTech, France
J. Eye Mov. Res. 2012, 5(2), 1-8; https://doi.org/10.16910/jemr.5.2.1
Published: 20 April 2012

Abstract

:
Oculomotor conflict induced between the accommodative and vergence components in stereoscopic displays represents an unnatural viewing condition. There is now some evidence that stereoscopic viewing may induce discomfort and changes in oculomotor parameters. The present study sought to measure oculomotor performance during stereoscopic viewing. Using a 3D stereo setup and an eye-tracker, vergence responses were measured during 20-min exposure to a virtual visual target oscillating in depth, which participants had to track. The results showed a significant decline in the amplitude of the in-depth oscillatory vergence response over time. We propose that eye-tracking provides a useful tool to objectively assess the time-varying alterations of the vergence system when using stereoscopic displays.

Introduction

Stereoscopic displays are used increasingly in cinema, television, and video-game industries, among others. A particularity of these displays is that they produce a mismatch between accommodation and vergence (Akeley, Watt, Girshick, & Banks, 2004; Eadie, Gray, Carlin, & Mon-Williams, 2000; Hoffman, Girshick, Akeley, & Banks, 2008; Howarth, 2011; Kim, Shibata, Hoffman, & Banks, 2011; Peli, 1995; Rushton & Riddell, 1999; Ukai & Howarth, 2008; Wann, Rushton, & Mon-Williams, 1995; Yang & Sheedy, 2011). Under natural viewing conditions, accommodation and vergence are coupled in order to maintain clarity and singleness of the fixated object (Fincham & Walton, 1957; Morgan, 1944a). The mismatch between accommodation and vergence in stereoscopic displays corresponds to an unnatural viewing condition. The impact of this mismatch on the oculomotor system is not well understood. The accommodative-vergence conflict is inherent to all techniques used for creating an artificial impression of depth in stereoscopic displays (Hoffman, et al., 2008). To provide depth perception with a stereoscopic device, the vergence demand must lie closer to, or farther than, the image display (depending on the location of the fixated object), while the accommodation demand remains fixed on the image display so that a clear view of the virtual scene can be obtained. Many studies have demonstrated changes in oculomotor responses after exposition to stereoscopic displays (Eadie, et al., 2000; Emoto, Nojiri, & Okano, 2004; Hoffman, et al., 2008; Sharples, Cobb, Moody, & Wilson, 2008; Ukai & Howarth, 2008). The oculomotor alteration is traditionally measured via comparison of oculomotor parameters measured before and after the stereoscopic viewing. However, these oculomotor alterations likely result from a continuous phenomenon. To our knowledge, the objective time course of this phenomenon has not been examined in detail. A previous study by Shibata et al. (2011) assessed the time course of the discomfort experienced by viewers exposed to various stereoscopic-viewing conditions. However, this assessment was limited to subjective symptoms. Some studies indicate that individual differences (interocular distance, zone of comfort…) might affect the comfort during stereoscopic viewing (Lambooij, Ijsselsteijn, & Heynderickx, 2007; Shibata, et al., 2011). Nevertheless, individual abilities to manage the oculomotor demand during stereoscopic viewing remain unclear.
The long-term goal of the present study was to develop an objective measure of the time course of individual oculomotor performance in stereoscopic displays. Since relief perception depends on vergence, we reasoned that the time course of vergence could provide an objective indicator of individual oculomotor performance during stereoscopic viewing.
The temporal characteristics of the vergence response in stereoscopic viewing can be quantified objectively by measuring vergence during the use of a stereoscopic device. Exposure to a sinusoidal oscillation has been used for vergence stimulation (Eadie, et al., 2000; Howard, Fang, Allison, & Zacher, 2000; Krishnan, Phillips, & Stark, 1973; Mon-Williams & Wann, 1998; Rashbass & Westheimer, 1961). The oscillatory stimulus induces a periodic variation of the vergence demand, which continuously modulates the accommodative-vergence conflict during stereoscopic viewing. This type of stimulus was used to investigate oculomotor performance in a stereoscopic task in the present study. The amplitude of the sinusoidal response was compared to the corresponding amplitude of the sinusoidal demand. Moreover, the phase lag of the vergence response was measured to determine the time delay of the response. These two objective parameters (amplitude and phase) were used to characterize the time course of the vergence response.
Considering that stereoscopic displays impose an oculomotor conflict, we hypothesized that oculomotor performance would vary over time during the exposure and that individual differences in time course would be observed.

Methods

Participants

Twelve subjects (three males and nine females aged 24-36 years; mean age = 27 ± 5 years) participated in the experiment. All subjects gave informed consent and were naïve to the goals of the study, which was conducted in accordance with the Declaration of Helsinki and under the terms of the local legislation. Inclusion criteria were as follows:
  • Monocular visual acuity (evaluated using a decimal scale chart) better than 10/10;
  • No history of functional or organic ocular pathology;
  • No use of medication that might interfere with oculomotor performance;
  • No visual complaint (such as headache, eyestrain, or reddening of the eyes) prior to the experiment.

Apparatus

A Wheatstone stereoscope consisting of two screens and two pairs of mirrors at 45° angle relative to the midsagittal plane was utilized (Figure 1). The visual targets were displayed on 22'' LCD ViewSonic screens, 1680 x 1050 pixels, with a pitch of 0.282 mm/pixel and a 120-Hz refresh rate. They were placed at 0.67 m from the center of rotation of the subject’s eye. This viewing distance corresponded to 1.5 meter angle (MA) resulting in a vergence demand of approximately 5°, depending on the interocular distance of the observer. The stereoscope was adjusted so that the visual field was approximately 26° wide for all subjects. The field of view was limited by small central mirrors (see Figure 1). The subject’s head was stabilized using a bite bar.
During stimulation, the vergence response was recorded using an eye-tracking device. Vergence tracking was performed using the Eyelink II eye-tracker in binocular vision. During the experiment, the head-tracking component was not used because, firstly, this piece equipment (worn on the head) was not compatible with the configuration of the stereoscope and, secondly, the subject’s head was stabilized using a bite bar, which made it unnecessary to use head tracking. The two cameras of the eye-tracker were placed on the stereoscope, close to the subject’s eyes and under the subject’s line of sight. Each camera contained two infrared LEDs (925 nm) to illuminate the subject's eyes, allowing accurate measurements under any lighting condition. As in previous studies of vergence in a virtual environment using the Eyelink system (Jaschinski, Jainta, & Hoormann, 2008; Yang & Sheedy, 2011), a high acquisition frequency (500 Hz) was used. The device offered a 0.5° average error, and a 0.01° resolution (Jainta, Hoormann, & Jaschinski, 2007; Jaschinski, et al., 2008).
The eye-tracking device was calibrated for each eye separately. The calibration procedure involved successive fixations of nine targets in random order. Data for which the pupil was not measured (due to, e.g., blinks) were rejected.

Stimuli

The visual target was a white orthogonal cross, 10-by-10 pixels with a 2-pixel thickness and a luminance of 230 cd/m². It subtended a visual angle of 14.5 minutes of arc (0.24°) with a minimum angle of resolution (MAR) of 3 minutes of arc. It was displayed on a gray background with a luminance of 30 cd/m². The stimulus contrast, expressed in accordance with the Weber law, was equal to 6.6. These stimulus parameters were chosen specifically to induce accurate accommodation (Ciuffreda, 2006). To stimulate fusion, a single target was displayed on each screen.
The range of the vergence demand was chosen after Eadie et al. (2000) and Wann and Mon-Williams (2002). In these studies, the vergence demand ranged either from 0 to 3 MA, or from 0 to 6 MA, and it followed a sinusoidal 0.3-Hz motion. To limit the divergence constraint and in relation with the divergence/convergence asymmetry of the human zone of clear and single binocular vision (Morgan, 1944b), the target, in the present study, was moved in virtual depth symmetrically from the screens. With respect to the two screens placed at 1.5 MA from the observer (667 mm), the target moved from 1 MA (1000 mm) to 3 MA (333 mm). Thus, the amplitude of the displacement in depth was 333 mm. For the virtual target located at 1000 mm, the required vergence demand was 3.4°, while for the target located at 333 mm, the vergence demand was equal to 10°. These vergence demands fall within the range of the zone of clear single binocular vision for an average observer. The relative divergence was in the comfort zone defined by Percival’s criterion who states that the comfort zone is defined by the middle third of the zone of clear single binocular vision (Hofstetter, 1945).

Procedure

After the position of the subject was adjusted, the eye-tracker was calibrated and the recording of eye movements started. The subject was then exposed to stereoscopic viewing for 20 minutes (360 cycles of sinusoidal oscillations in depth). After the completion of the exposure phase, the subject filled-in a visual-and-physical-discomfort questionnaire, which included the following questions:
-
Did you experience diplopia during the session? Yes / No
-
If so, what percentage of time did you experience diplopia on a scale from 10 to 100% (in steps of 10).
-
Did you experience any discomfort? Yes / No
-
If so, which disorder did you experience (multiple answers can be checked)? Headaches / Reddening of the eyes / Eyes that draw / Fatigue / Blurred vision / Other (explain).
-
Please quantify your discomfort (if any) on a scale from 0 to 10, with 10 corresponding to maximum discomfort.

Data processing

All data processing was performed offline.
The Eyelink II requires periodic calibration to ensure reliable measurement. However, since in the present experiment, continuous (sustained) exposure to the constraint was mandatory, it was not possible to calibrate the device during the exposure phase. Therefore, the response signals was realigned relative to the stimulus to compensate for the drift in the eye-tracker signal over time. This was achieved by dividing the response signal into 60 slots (20 s each), such that each slot contained 6 sinusoidal cycles.
Oculomotor data corresponding to saccades were removed from further analysis.
The intersection of the two eye directions measured by the Eyelink was determined using the INRA-Matlab toolbox (geom3d). The intersection point obtained corresponded to the location where the vergence occurred instantaneously. Because all stimuli were at eye level, only horizontal data were used. For reconstruction in virtual space, occasional outliers (defined as points falling below 0.05 m or above 5 m) were removed. Eliminated data points were approximated using linear interpolation.
The stimulation signal was sinusoidal with a frequency of 0.3-Hz, we reasoned that the response signal should exhibit the same profile. Standard signal-processing tools to evaluate the amplitude and the phase lag of the response signal were used. The amplitude of the sinusoidal response signal was determined using a fast Fourier transform (FFT). The instantaneous phases of the stimulation and response signals were determined using a Hilbert transform (Le Van Quyen et al., 2001). The phase lag between the stimulus and response signals was computed to determine the time delay of the response. The amplitude and phase lag of the vergence response were computed for each slot.

Statistical analysis

The statistical analysis of the eye-tracker data involved the computation of nonparametric (Spearman) correlation coefficients between the vergence response and the slot number. A nonparametric analysis was chosen because no linear relationship between vergence response and time was specifically expected. The critical p value was set at 0.05. Due to a dysfunction of the eye-tracker during the experiment, the data of one subject could not be analysed.

Results

Figure 2 shows a typical vergence response measured during exposure for one of the participants.
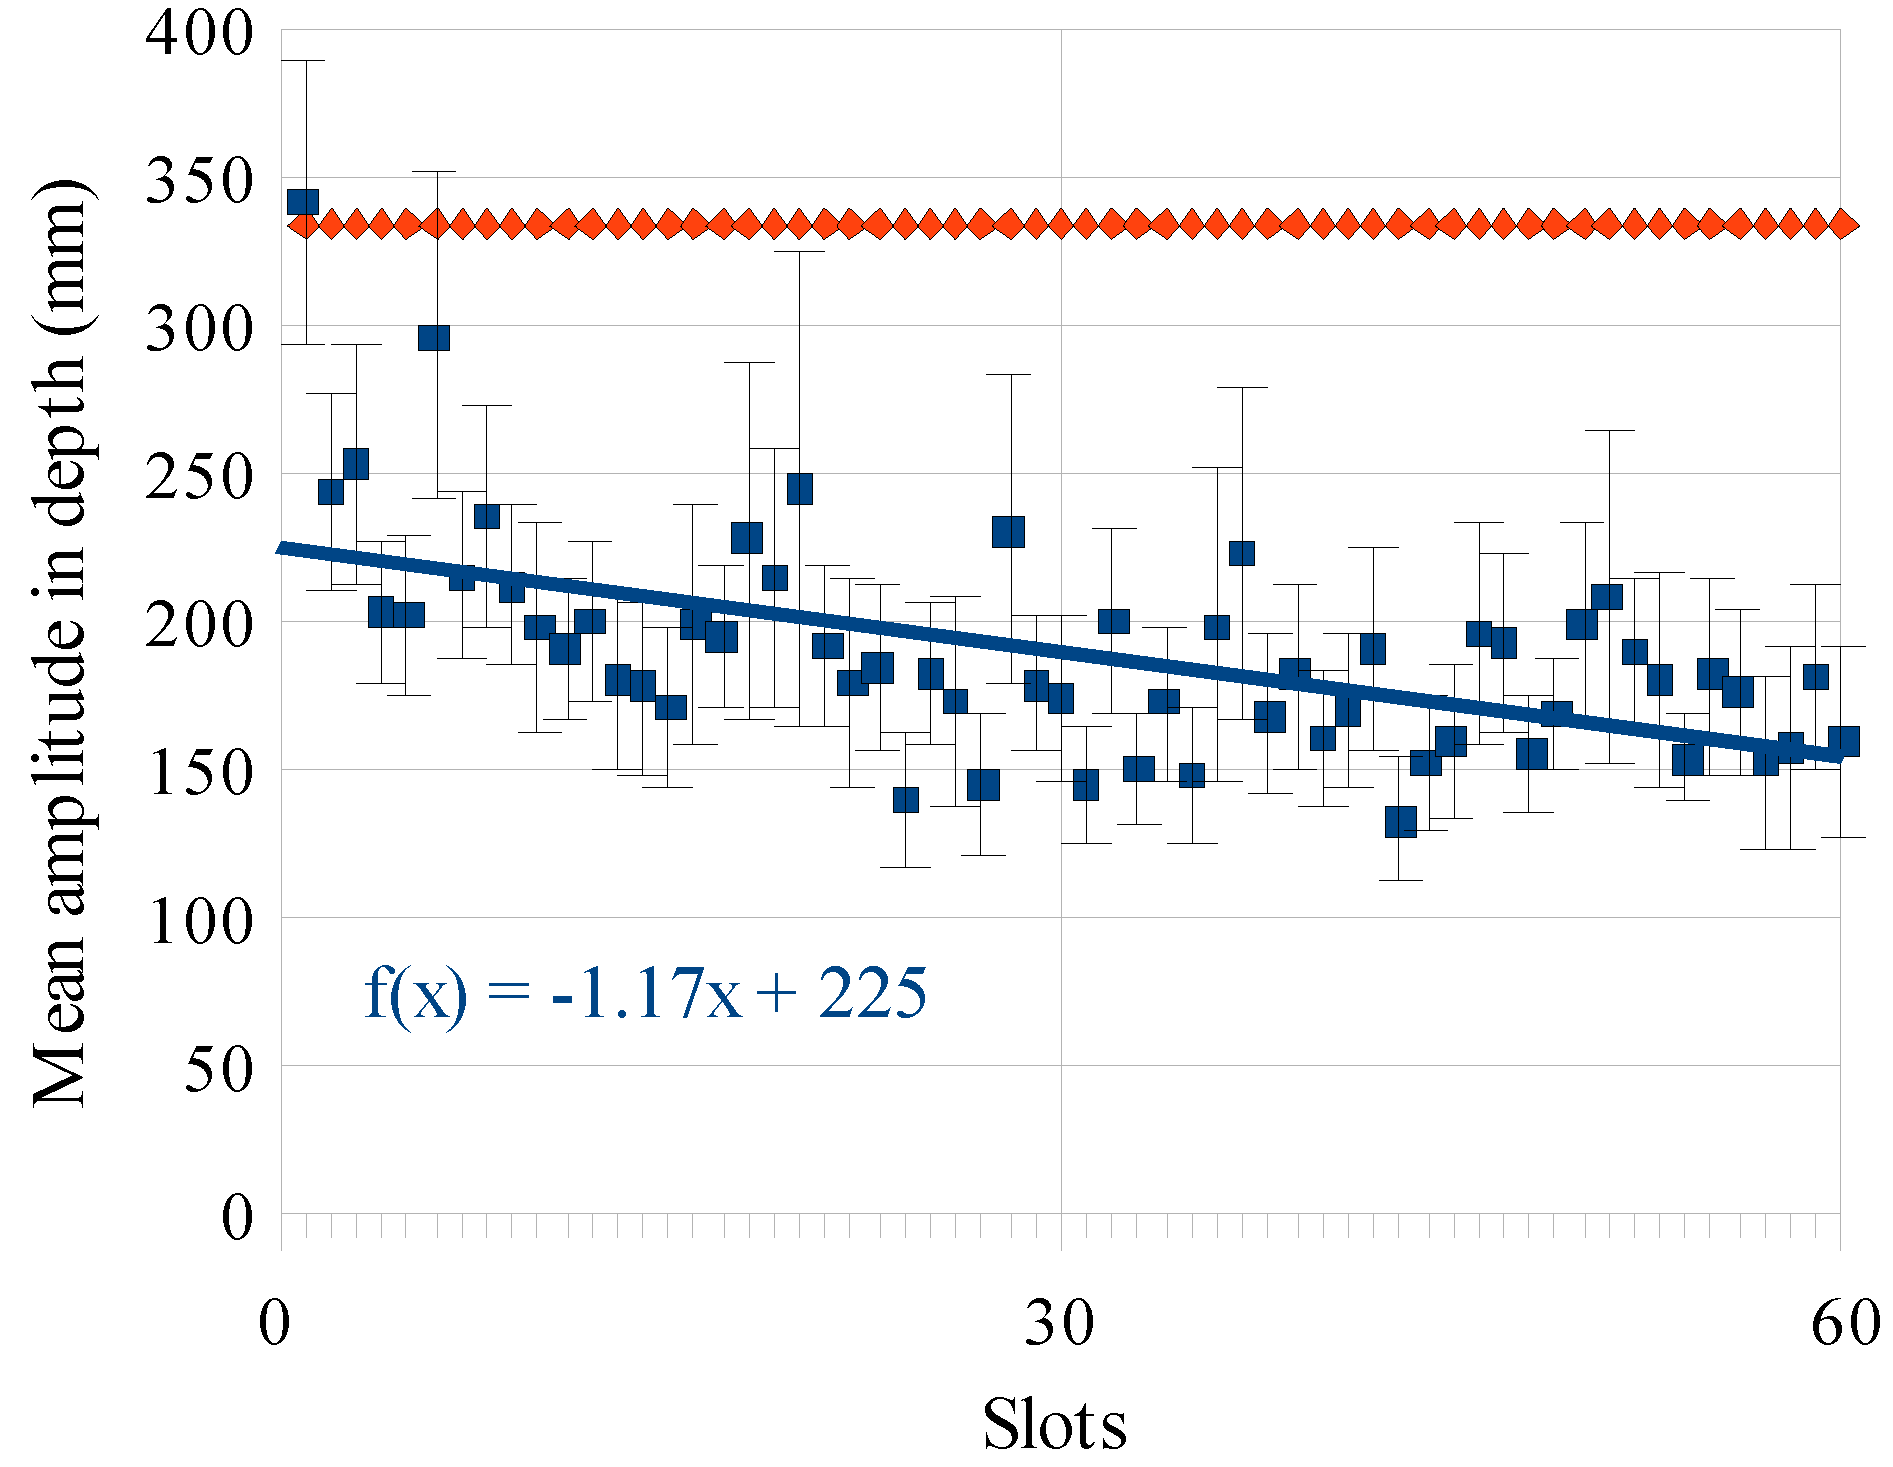
Figure 3 shows the mean amplitude of the vergence response across subjects as a function of exposure time expressed as the slot number. The mean amplitude of the first six slots (10% of the exposure) is 255.89 mm versus 167.42 mm for the last six slots which represent a gain of 0.77 and 0.50. A negative correlation between the amplitude of the vergence response and the slot number was observed (ρ = -0.55, p < 0.01), indicating a general decline of oculomotor performance over time. On average across the 60 slots, the response declined at a rate of 1.17 mm/slot.
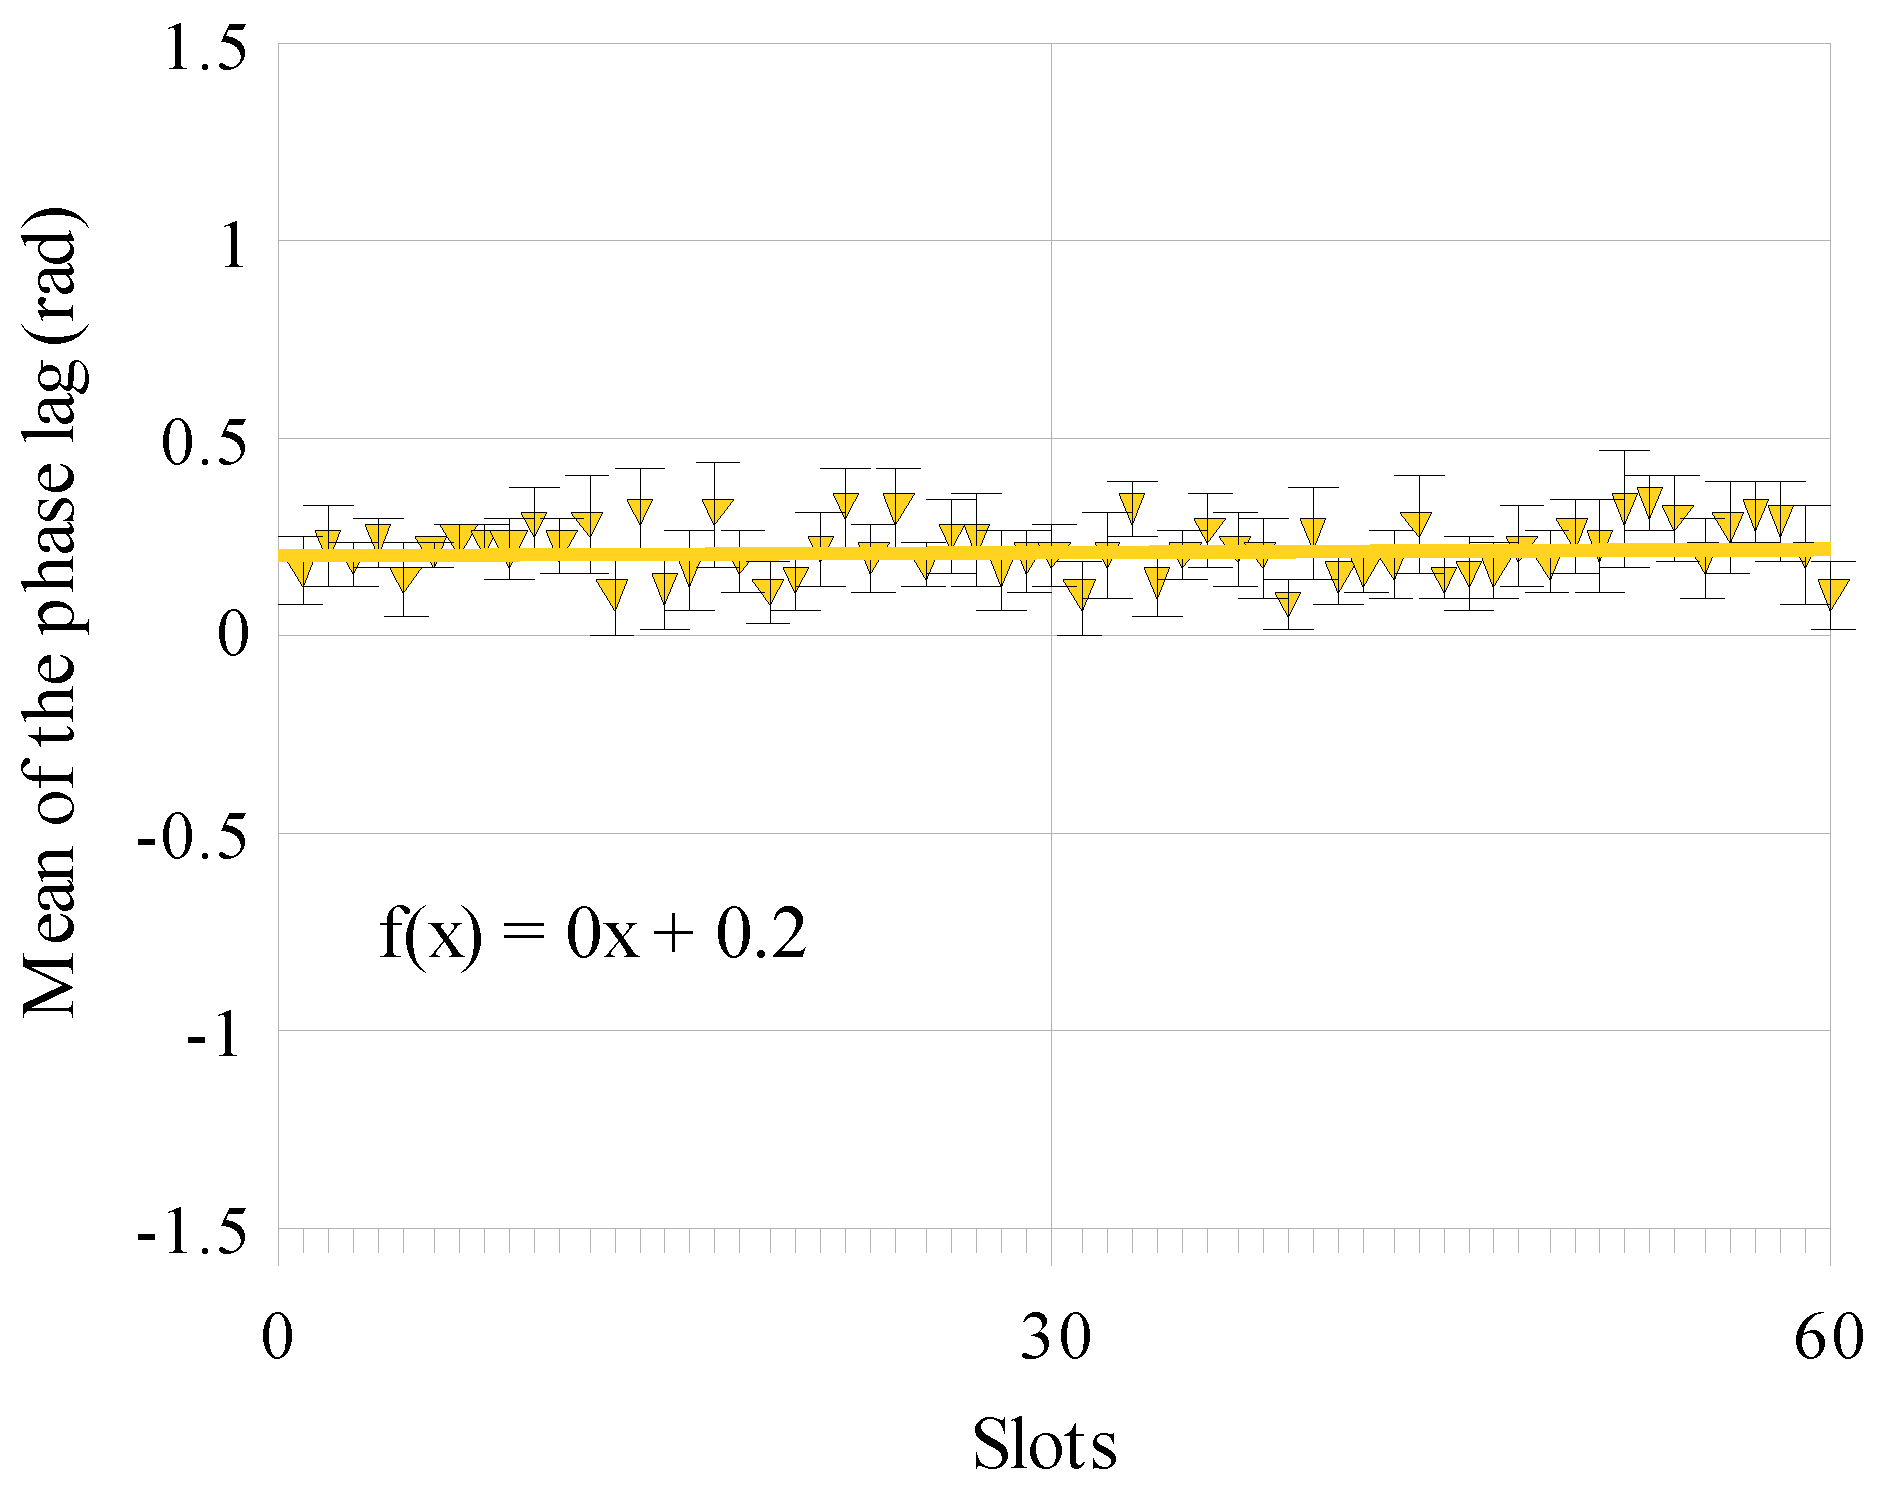
No correlation was found between the mean phase lag of the vergence response and the slot number (ρ = 0.09, p = 0.48) (see Figure 4). The phase data indicate that the ocular response was delayed relative to the stimulus. This indicates that, on average, the participants’ eye movements followed the stimulus and that subjects did not anticipate the target.
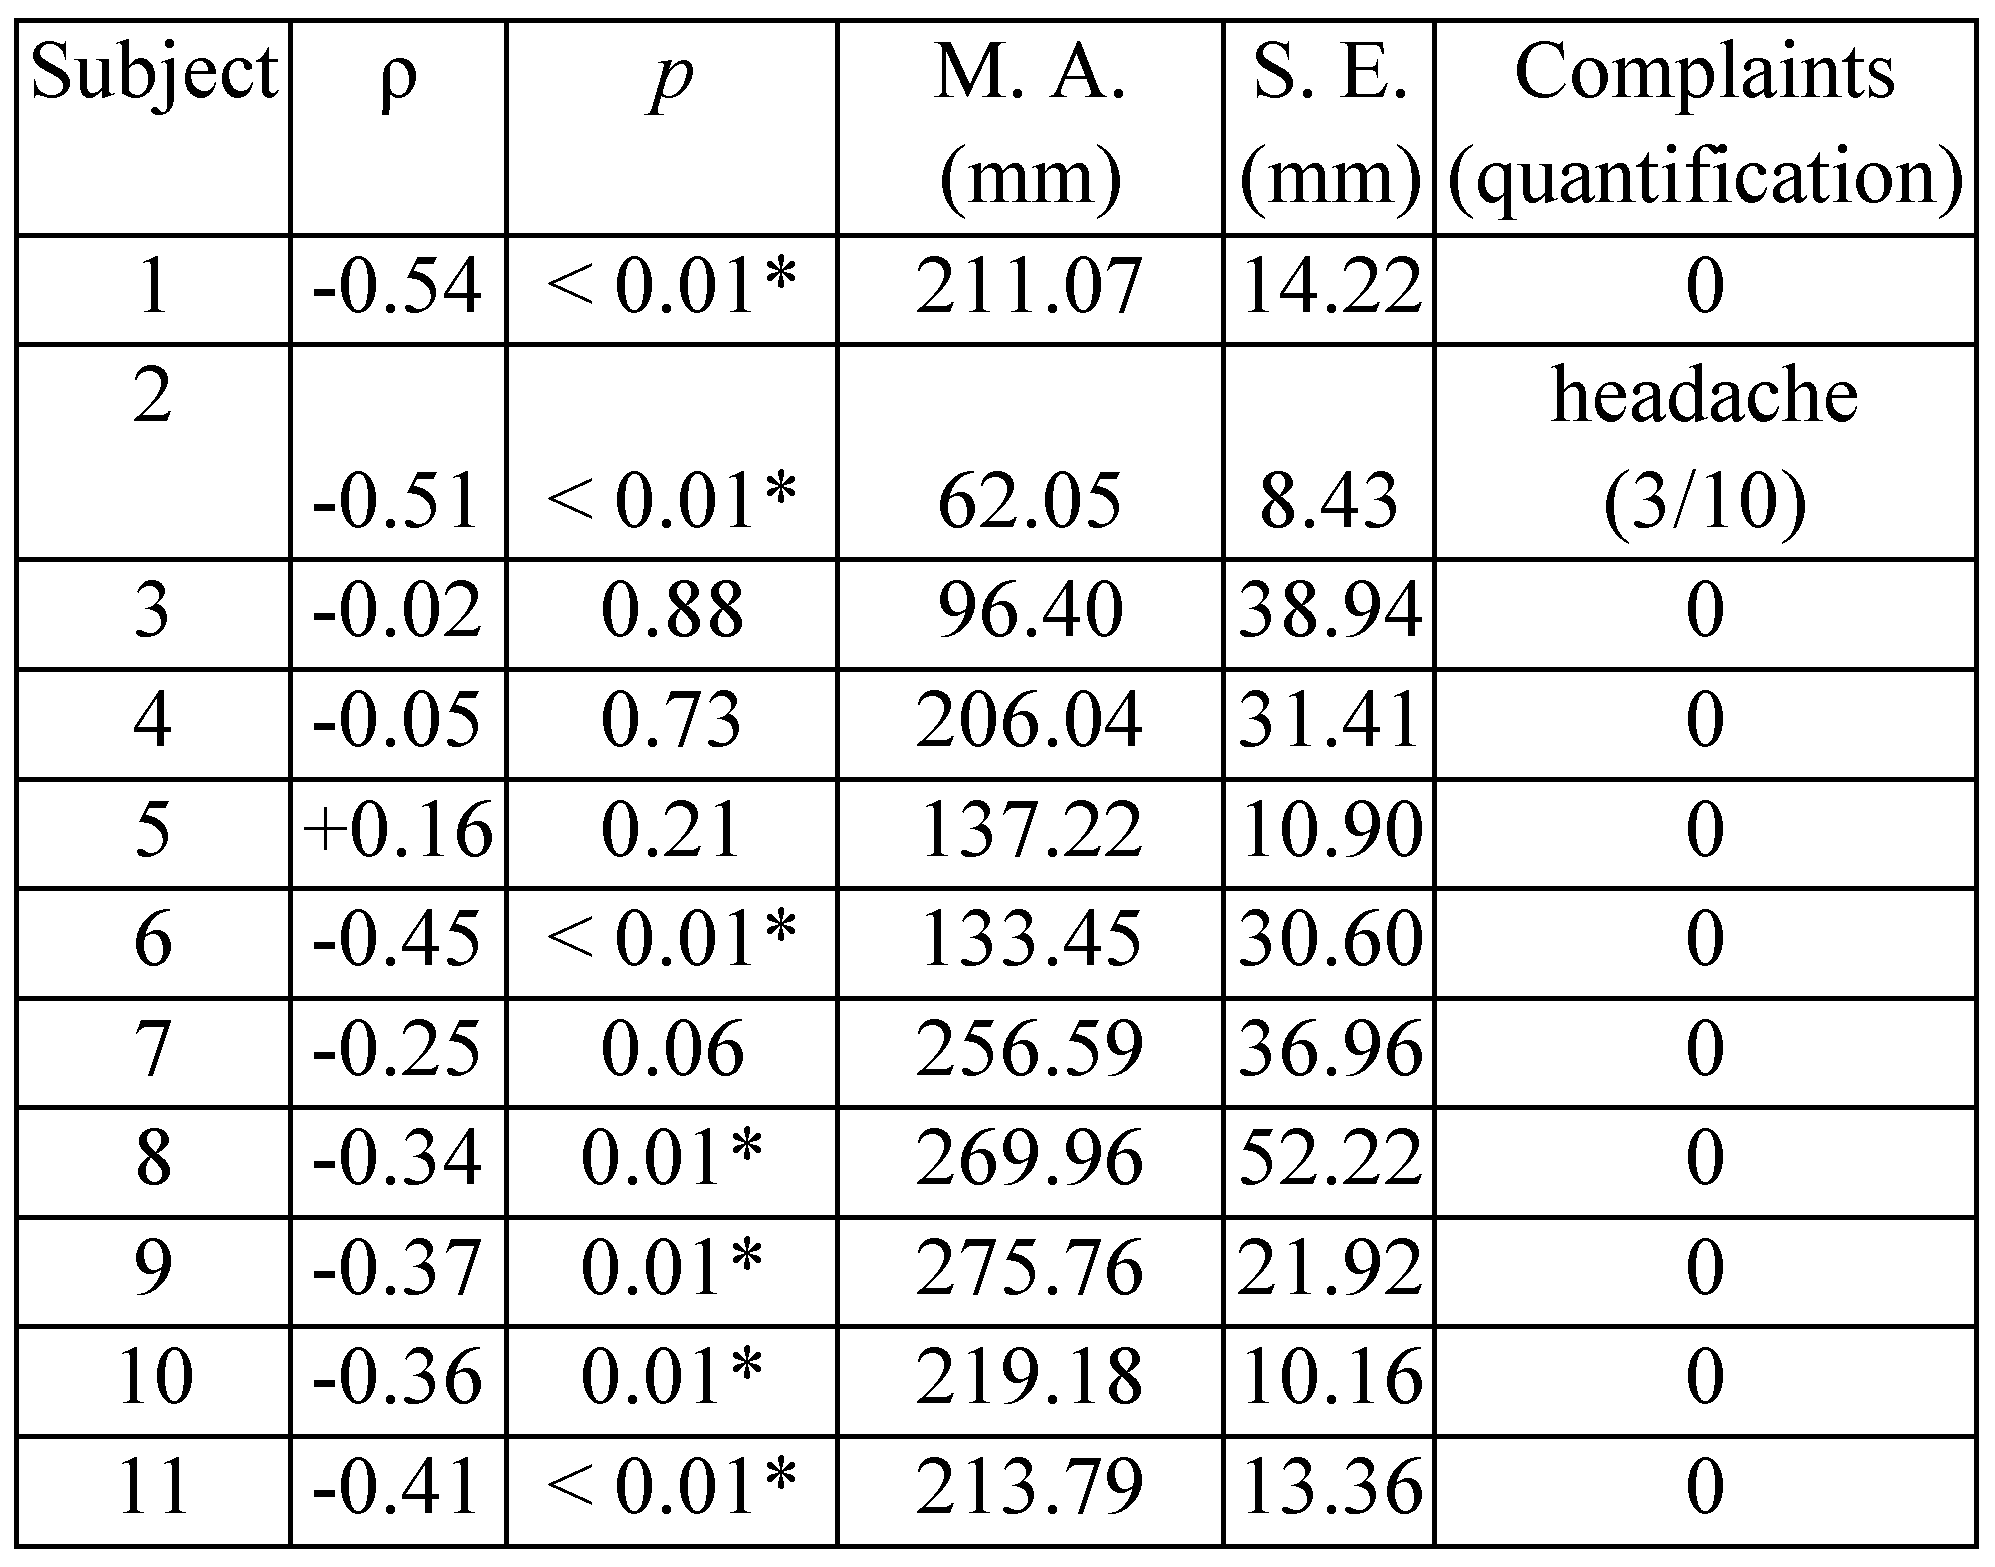
The relationship between the vergence response and the slot number was variable across subjects (see Table 1).
For seven out of the eleven subjects, vergence decreased significantly as a function of the slot number (p < 0.05). The analysis of the questionnaires showed very few complaints: only one subject reported having experiencing a headache. However, all subjects reported diplopia. Depending on the individual, diplopia was experienced for 10% to 80% of the exposure duration.

Discussion

The oculomotor alteration has traditionally been measured, either via comparison of oculomotor parameters measured before and after the optical constraint, or using subjective data from questionnaires. In this study, the time course of oculomotor performance was assessed by measuring the vergence response during exposure to a sinusoidally stimulus. Using this approach, we could directly quantify how far the observer was able to cope with the stereoscopic viewing constraint over time. The results showed a decline of the amplitude of the in-depth oscillatory vergence response during the exposure (Figure 3). This decline provides an objective index of the vergence load due to stereoscopic viewing.
Various explanations may be offered for the decline in oculomotor performance over time:
A first explanation is as follow. Although stimulus was a vergence stimulus aligned on the mid-sagittal plane and required a pure vergence response, saccades sporadically occurred during the task. A set of studies suggest that saccades can influence the vergence response, increasing the velocity of vergence response during the intersaccadic period (Semmlow, Chen, Granger-Donetti, & Alvarez, 2008, 2009; Zee, Fitzgibbon, & Optican, 1992). Thus, the interfering saccades may have changed the peak of velocity and potentially the amplitude of the vergence response during the exposure. However, it is important to note that the studies mentioned above involved vergence step stimuli. To our knowledge, the influence of saccades on vergence responses to sinusoidal oscillations in depth is not established. Thus, while this explanation cannot be excluded, it deserves further investigation, especially because Yuan and Semmlow (2000) showed a major difference in peak velocity of vergence response due to repetitive step vergence eye movements against slow sinusoidal vergence tracking.
Emoto et al. (2005) and Lambooij et al (2009) suggest that visual fatigue can be described as a phenomenon leading to the transient decline of various visual functions.
The decrease in the amplitude of the response during exposure may be a result of visual fatigue. On average, the gain of vergence measured at the beginning of the exposure phase in the present study was similar to that measured in previous studies (Erkelens & Collewijn, 1985; Krishnan, et al., 1973). With one exception, earlier studies did not record the vergence response over as prolonged a time period as the present study. Therefore, a decline in oculomotor performance was not usually observed in these studies. One exception is the study of Yuan and Semmlow (2000), who analyzed vergence responses measured during a protracted, repetitive task involving 100 cycles of sinusoidal vergence stimulation. Their results showed no signs of visual fatigue. However, it is important to note that the stimuli and methods used in this earlier study differ from those of the present study. Consistent with visual fatigue explanation, previous results have found an increase in subjective signs of visual discomfort over time during stereoscopic viewing (Shibata, et al., 2011).
Several studies suggest that high-level functions, notably mental fatigue and inattention, can modify the lower level of the motor control signal (Epelboim et al., 1997; Fuchs & Binder, 1983; Yuan & Semmlow, 2000). During our experiment, subjects were frequently reminded that they had to stay alert, and avoid inattention. Moreover, the results indicate that the phase lag of the vergence response did not change significantly over time. Thus, the time between stimulus and response remained the same (Figure 4). Inattention should have resulted in a longer response delays, i.e., an increase of the phase lag.
While, on average the oculomotor response was found to decline over time, interindividual differences were observed in the amplitude of the vergence response as well as in the discomfort.
Interestingly, very few complaints were reported by the participants. This discrepancy between an objectively measured change in oculomotor performance and subjective complaints is in accordance with Lambooij et al. (2009) and Saito et al. (1992), who suggested a distinction between physiological fatigue and subjective discomfort. Our results suggest that a decrease in visual performance is reflected in (and can be detected using) objective measures of the vergence response, before it is manifested in subjective measures.
Four of the eleven subjects showed no significant correlation between the vergence response and the slot number. Such interindividual differences in the vergence response as a function of time may reflect interindividual differences in the ability to respond to vergence demands. By assessing the vergence response during stereoscopic exposure at the individual level, it may be possible to determine when visual function starts to decline, and when stereoscopic viewing should be stopped to avoid subjective symptoms. This limit on the use of stereoscopic viewing can be defined at the group level (as an average across subjects), or at the individual level. In this context, objective, and individual assessments of oculomotor performance using the eye-tracking appear as a useful tool for characterizing more precisely the conditions under which streoscopic displays can be used effectively by different individuals.

Acknowledgments

The authors thank Alain Bichot, Justin Plantier and Yannick Vincensini for their help with the experimental software, and Véronique Chastres for her help with the statistical analysis. We also thank Christophe Micheyl for helpful comments on the manuscript. This research was supported by grant No 10CO804 from Direction Générale pour l’Armement, the French Procurement Agency.

References

  1. Akeley, K., S. J. Watt, A. R. Girshick, and M. S. Banks. 2004. A stereo display prototype with multiple focal distances. ACM Transactions on Graphics (TOG) 23, 3: 804–813. [Google Scholar]
  2. Ciuffreda, K. J. 2006. Accommodation, the pupil, and presbyopia. In Borish's Clinical Refraction, 2nd ed. Edited by W. J. Benjamin. Birmingham, UK: Elsevier: pp. 93–144. [Google Scholar]
  3. Eadie, A. S., L. S. Gray, P. Carlin, and M. Mon-Williams. 2000. Modelling adaptation effects in vergence and accommodation after exposure to a simulated virtual reality stimulus. Ophthalmic and Physiological Optics 20, 3: 242–251. [Google Scholar]
  4. Emoto, M., T. Niida, and F. Okano. 2005. Repeated vergence adaptation causes the decline of visual functions in watching stereoscopic television. Journal of Display Technology 1, 2: 328–340. [Google Scholar]
  5. Emoto, M., Y. Nojiri, and F. Okano. 2004. Changes in fusional vergence limit and its hysteresis after viewing stereoscopic TV. Displays 25, 2–3: 67–76. [Google Scholar]
  6. Epelboim, J., R. M. Steinman, E. Kowler, Z. Pizlo, C. J. Erkelens, and H. Collewijn. 1997. Gaze-shift dynamics in two kinds of sequential looking tasks. Vision Research 37, 18: 2597–2607. [Google Scholar] [CrossRef] [PubMed]
  7. Erkelens, C., and H. Collewijn. 1985. Eye movements and stereopsis during dichoptic viewing of moving random-dot stereograms. Vision Research 25, 11: 1689–1700. [Google Scholar]
  8. Fincham, E. F., and J. Walton. 1957. The reciprocal actions of accommodation and convergence. The Journal of Physiology 137, 3: 488–508. [Google Scholar]
  9. Fuchs, A. F., and M. D. Binder. 1983. Fatigue resistance of human extraocular muscles. Journal of Neurophysiology 49, 1: 28–34. [Google Scholar] [PubMed]
  10. Hoffman, D. M., A. R. Girshick, K. Akeley, and M. S. Banks. 2008. Vergence-accommodation conflicts hinder visual performance and cause visual fatigue. Journal of Vision 8, 3: 1–30. [Google Scholar]
  11. Hofstetter, H. W. 1945. The zone of clear single binocular vision. Part I. American Journal of Optometry 22: 301–333. [Google Scholar] [CrossRef]
  12. Howard, I. P., X. Fang, R. S. Allison, and J. E. Zacher. 2000. Effects of stimulus size and eccentricity on horizontal and vertical vergence. Experimental Brain Research 130, 2: 124–132. [Google Scholar] [CrossRef] [PubMed]
  13. Howarth, P. A. 2011. Potential hazards of viewing 3 D stereoscopic television, cinema and computer games: A review. Ophthalmic and Physiological Optics 31, 2: 111–122. [Google Scholar] [CrossRef]
  14. Jainta, S., J. Hoormann, and W. Jaschinski. 2007. Objective and subjective measures of vergence step responses. Vision Research 47, 26: 3238–3246. [Google Scholar] [CrossRef] [PubMed]
  15. Jaschinski, W., S. Jainta, and J. Hoormann. 2008. Comparison of shutter glasses and mirror stereoscope for measuring dynamic and static vergence. Journal of Eye Movement Research 1, 5: 1–7. [Google Scholar] [CrossRef]
  16. Kim, J., T. Shibata, D. Hoffman, and M. Banks. 2011. Assessing vergence-accommodation conflict as a source of discomfort in stereo displays. Journal of Vision 11, 11: 324–324. [Google Scholar] [CrossRef]
  17. Krishnan, V., S. Phillips, and L. Stark. 1973. Frequency analysis of accommodation, accommodative vergence and disparity vergence. Vision Research 13, 8: 1545–1554. [Google Scholar] [CrossRef]
  18. Lambooij, M., W. IJsselsteijn, M. Fortuin, and I. Heynderickx. 2009. Visual discomfort and visual fatigue of stereoscopic displays: A review. Journal of Imaging Science and Technology 53, 3: 1–14. [Google Scholar] [CrossRef]
  19. Lambooij, M., W. Ijsselsteijn, and I. Heynderickx. 2007. Visual discomfort in stereoscopic displays: A review. Paper presented at the Stereoscopic Displays and Virtual Reality Systems XIV, San Jose, CA. [Google Scholar]
  20. Le Van Quyen, M., J. Foucher, J. P. Lachaux, E. Rodriguez, A. Lutz, J. Martinerie, and et al. 2001. Comparison of Hilbert transform and wavelet methods for the analysis of neuronal synchrony. Journal of neuroscience methods 111, 2: 83–98. [Google Scholar] [CrossRef]
  21. Mon-Williams, M., and J. P. Wann. 1998. Binocular virtual reality displays: When problems do and don't occur. Human Factors 40, 1: 42–49. [Google Scholar] [CrossRef]
  22. Morgan, M. W. 1944a. Accommodation and its relationship to convergence. American Journal of Optometry & Archives of American Academy of Optometry 21: 183–195. [Google Scholar]
  23. Morgan, M. W. 1944b. Analysis of clinical data. American Journal of Optometry & Archives of American Academy of Optometry 21: 477–491. [Google Scholar]
  24. Peli, E. 1995. Real vision & virtual reality. Optics and Photonics News 6, 7: 28–34. [Google Scholar]
  25. Rashbass, C., and G. Westheimer. 1961. Disjunctive eye movements. The Journal of Physiology 159, 2: 339–360. [Google Scholar] [CrossRef] [PubMed]
  26. Rushton, S. K., and P. M. Riddell. 1999. Developing visual systems and exposure to virtual reality and stereo displays: Some concerns and speculations about the demands on accommodation and vergence. Applied Ergonomics 30, 1: 69–78. [Google Scholar] [CrossRef] [PubMed]
  27. Saito, S. 1992. Does fatigue exist in a quantitative measurement of eye movements? Ergonomics 35, 5–6: 607–615. [Google Scholar] [CrossRef]
  28. Semmlow, J., Y. F. Chen, B. Granger-Donetti, and T. L. Alvarez. 2008. Saccadic behavior during the response to pure disprity vergence stimuli I: general properties. Journal of Eye Movement Research 1, 2: 1–11. [Google Scholar]
  29. Semmlow, J., Y. F. Chen, B. Granger-Donetti, and T. L. Alvarez. 2009. Correction of saccade-induced midline errors in responses to pure disparity vergence stimuli. Journal of Eye Movement Research 2, 5: 1–13. [Google Scholar] [CrossRef]
  30. Sharples, S., S. Cobb, A. Moody, and J. R. Wilson. 2008. Virtual reality induced symptoms and effects (VRISE): Comparison of head mounted display (HMD), desktop and projection display systems. Displays 29, 2: 58–69. [Google Scholar] [CrossRef]
  31. Shibata, T., J. Kim, D. M. Hoffman, and M. S. Banks. 2011. The zone of comfort: Predicting visual discomfort with stereo displays. Journal of Vision 11, 8: 1–29. [Google Scholar] [CrossRef]
  32. Ukai, K., and P. A. Howarth. 2008. Visual fatigue caused by viewing stereoscopic motion images: Background, theories, and observations. Displays 29, 2: 106–116. [Google Scholar] [CrossRef]
  33. Wann, J. P., and M. Mon-Williams. 2002. Measurement of visual aftereffects following virtual environment exposure. In Handbook of Virtual Environments. Edited by K. M. Stanney. Mahwah, NJ: Lawrence Erlbaum Associates: pp. 731–749. [Google Scholar]
  34. Wann, J. P., S. Rushton, and M. Mon-Williams. 1995. Natural problems for stereoscopic depth perception in virtual environments. Vision Research 35, 19: 2731–2736. [Google Scholar] [PubMed]
  35. Yang, S., and J. E. Sheedy. 2011. Effects of vergence and accommodative responses on viewer's comfort in viewing 3D stimuli. Paper presented at the Stereoscopic Displays and Applications XXII, San Francisco, CA. [Google Scholar]
  36. Yuan, W., and J. L. Semmlow. 2000. The influence of repetitive eye movements on vergence performance. Vision Research 40, 22: 3089–3098. [Google Scholar] [PubMed]
  37. Zee, D., E. Fitzgibbon, and L. Optican. 1992. Saccade-vergence interactions in humans. Journal of Neurophysiology 68, 5: 1624–1641. [Google Scholar] [CrossRef] [PubMed]
Figure 1. Schema of the stereoscope. A target was displayed on each of two screens. Owing to binocular fusion, the subject perceived a single virtual target. 
Jemr 05 00006 g001
Figure 2. Example of processed vergence response as a function of time (over one slot) for one subject. Orange line: stimulus. Blue line: response. 
Jemr 05 00006 g002
Figure 3. Mean amplitude of the vergence response (blue squares) as a function of the slot number. Blue line: regression line through the vergence amplitude data. Orange diamond: amplitude of the vergence demand as a function of the slot number. The error bars around the blue squares show the standard error of the mean vergence response. 
Jemr 05 00006 g003
Figure 4. Mean phase lag between the vergence response and the stimulus as a function of the slot number. The error bars around the yellow triangles represent the standard error of the phase lag. Positive phase shifts indicate a delay; whereas negative shifts indicate an anticipation of the vergence response. 
Jemr 05 00006 g004
Table 1. Individual results: Spearman correlation coefficients; p values; mean amplitude of the vergence response (M. A.); standard error of the response (S. E.); complaints. A negative correlation coefficient indicates a decrease of vergence amplitude during the exposure, and conversely for a positive correlation coefficient. Statistically significant correlation coefficients are indicated by an asterisk. 
Jemr 05 00006 i001