A Two-step Approach for Interest Estimation from Gaze Behavior in Digital Catalog Browsing
Abstract
:Introduction
Research objective
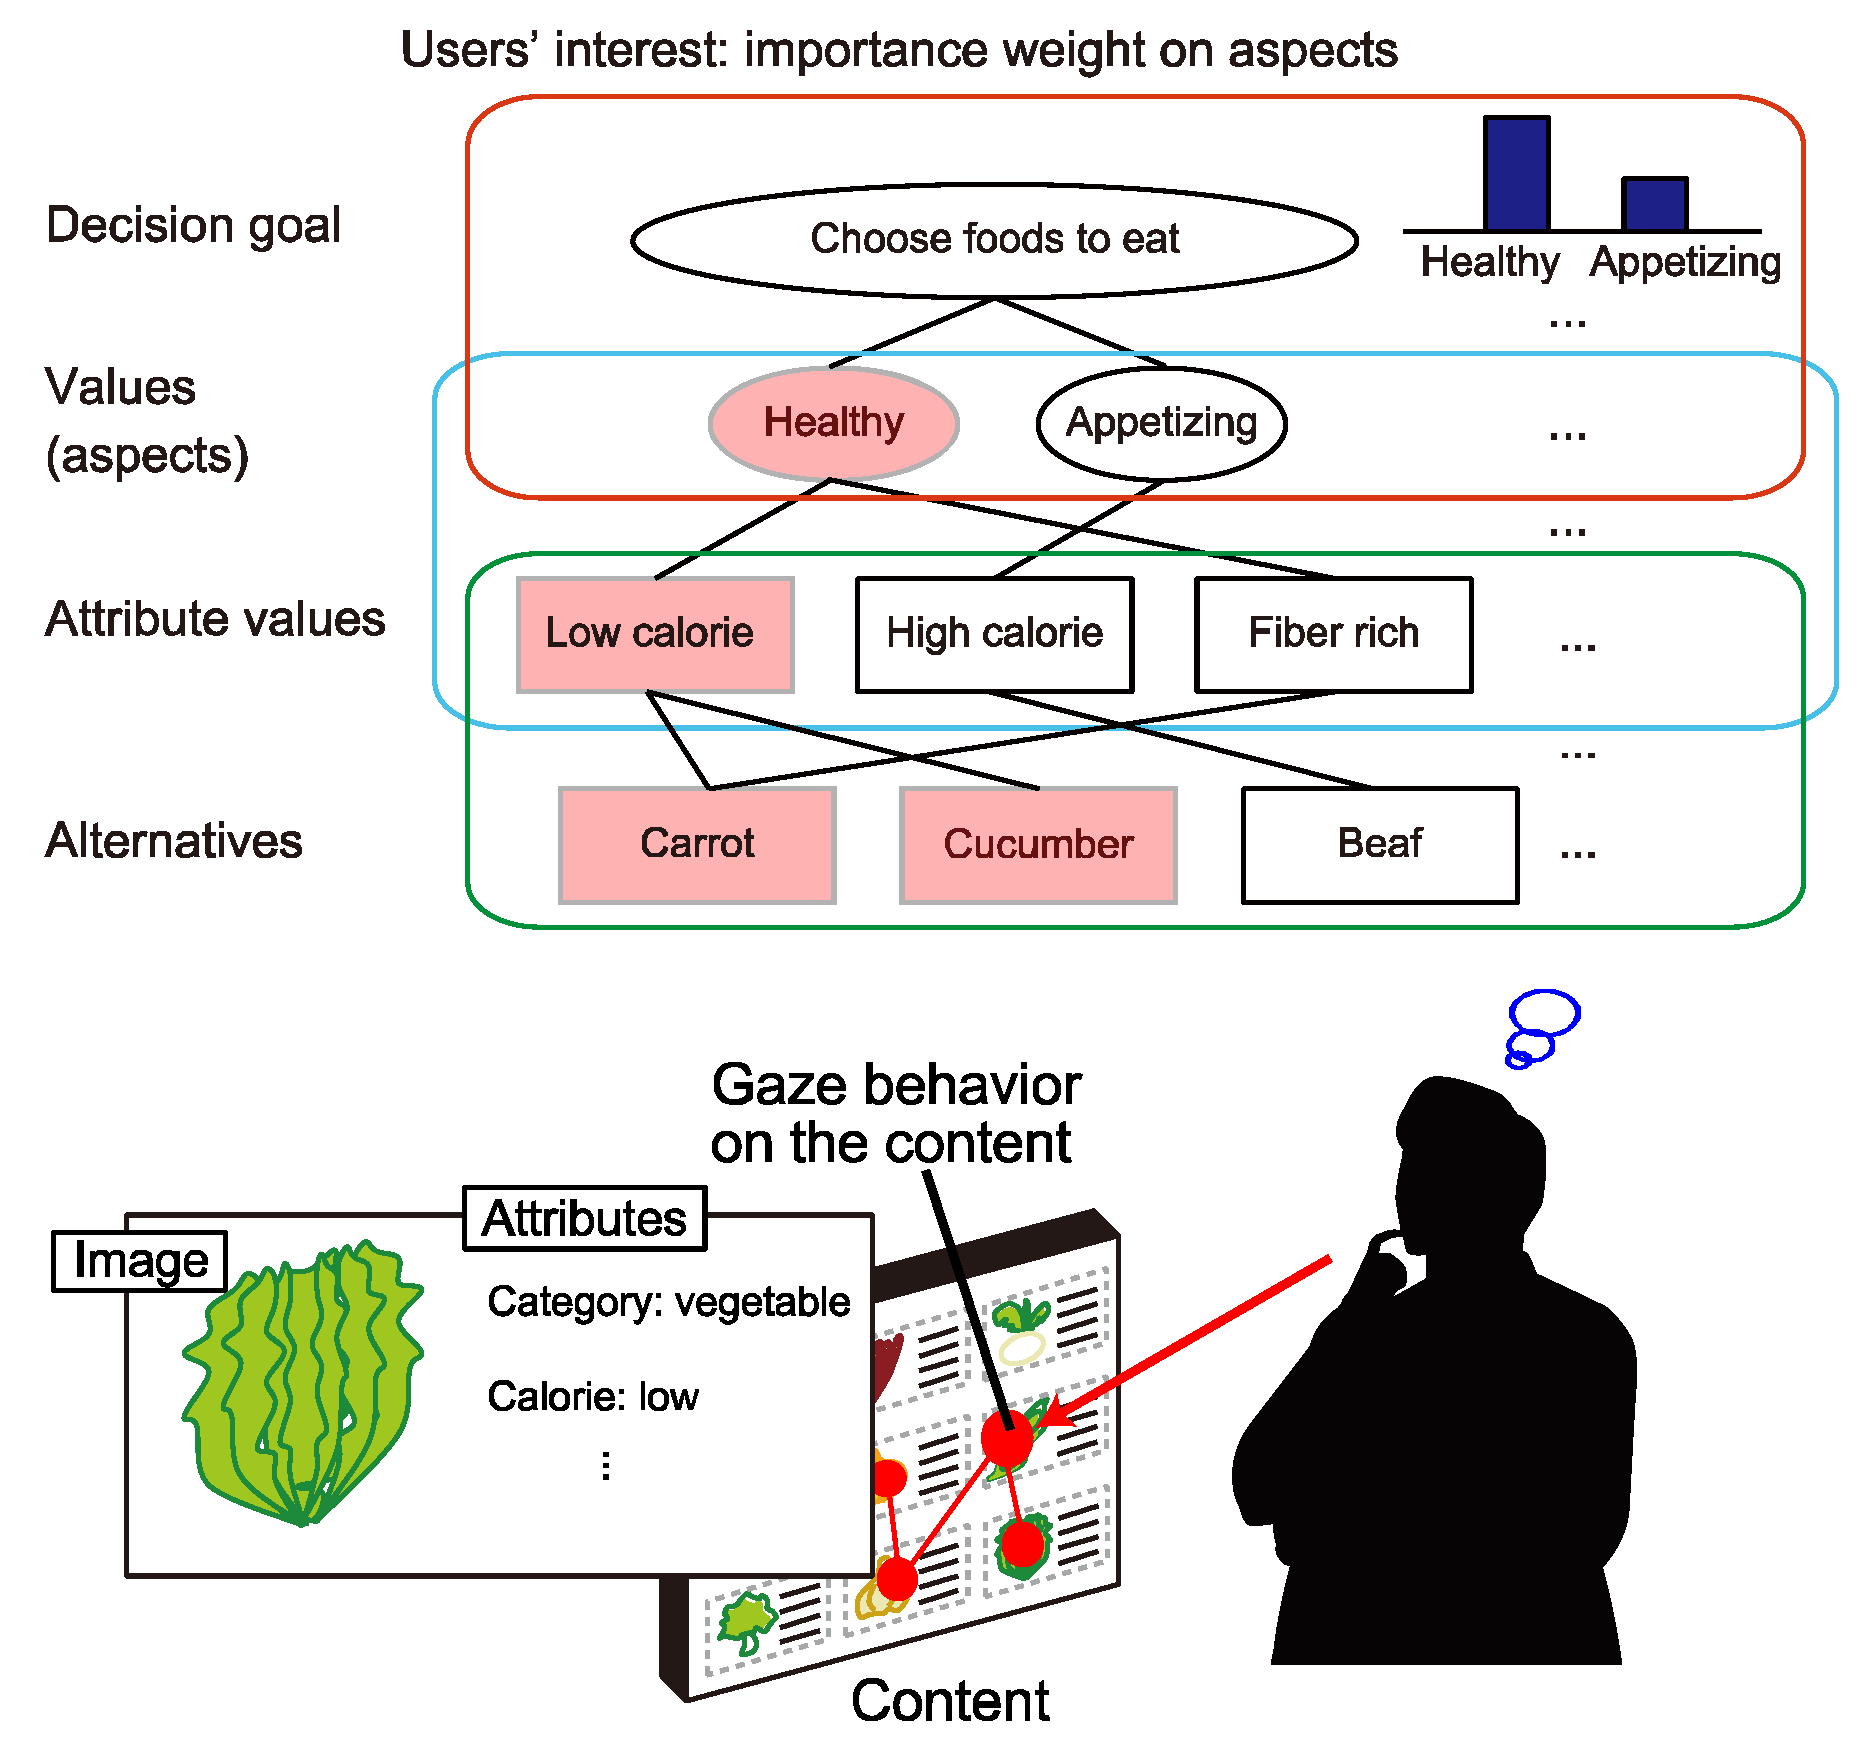
- Observation 1. Users frequently switch their browsing states, e.g., from “simply grasping information about items” to “actively comparing items based on their interest”;
- Observation 2. Users do not always take into account all the attributes of displayed items but rather focus on a subset of them.
Contributions
Organization of this paper
Related Work
Analysis of values behind decision making
Estimation of internal states behind user behavior
Internal and external factors of gaze behavior
Gaze behavior and decision phase
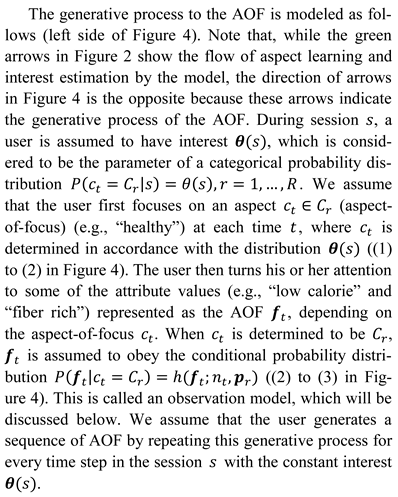
Methods
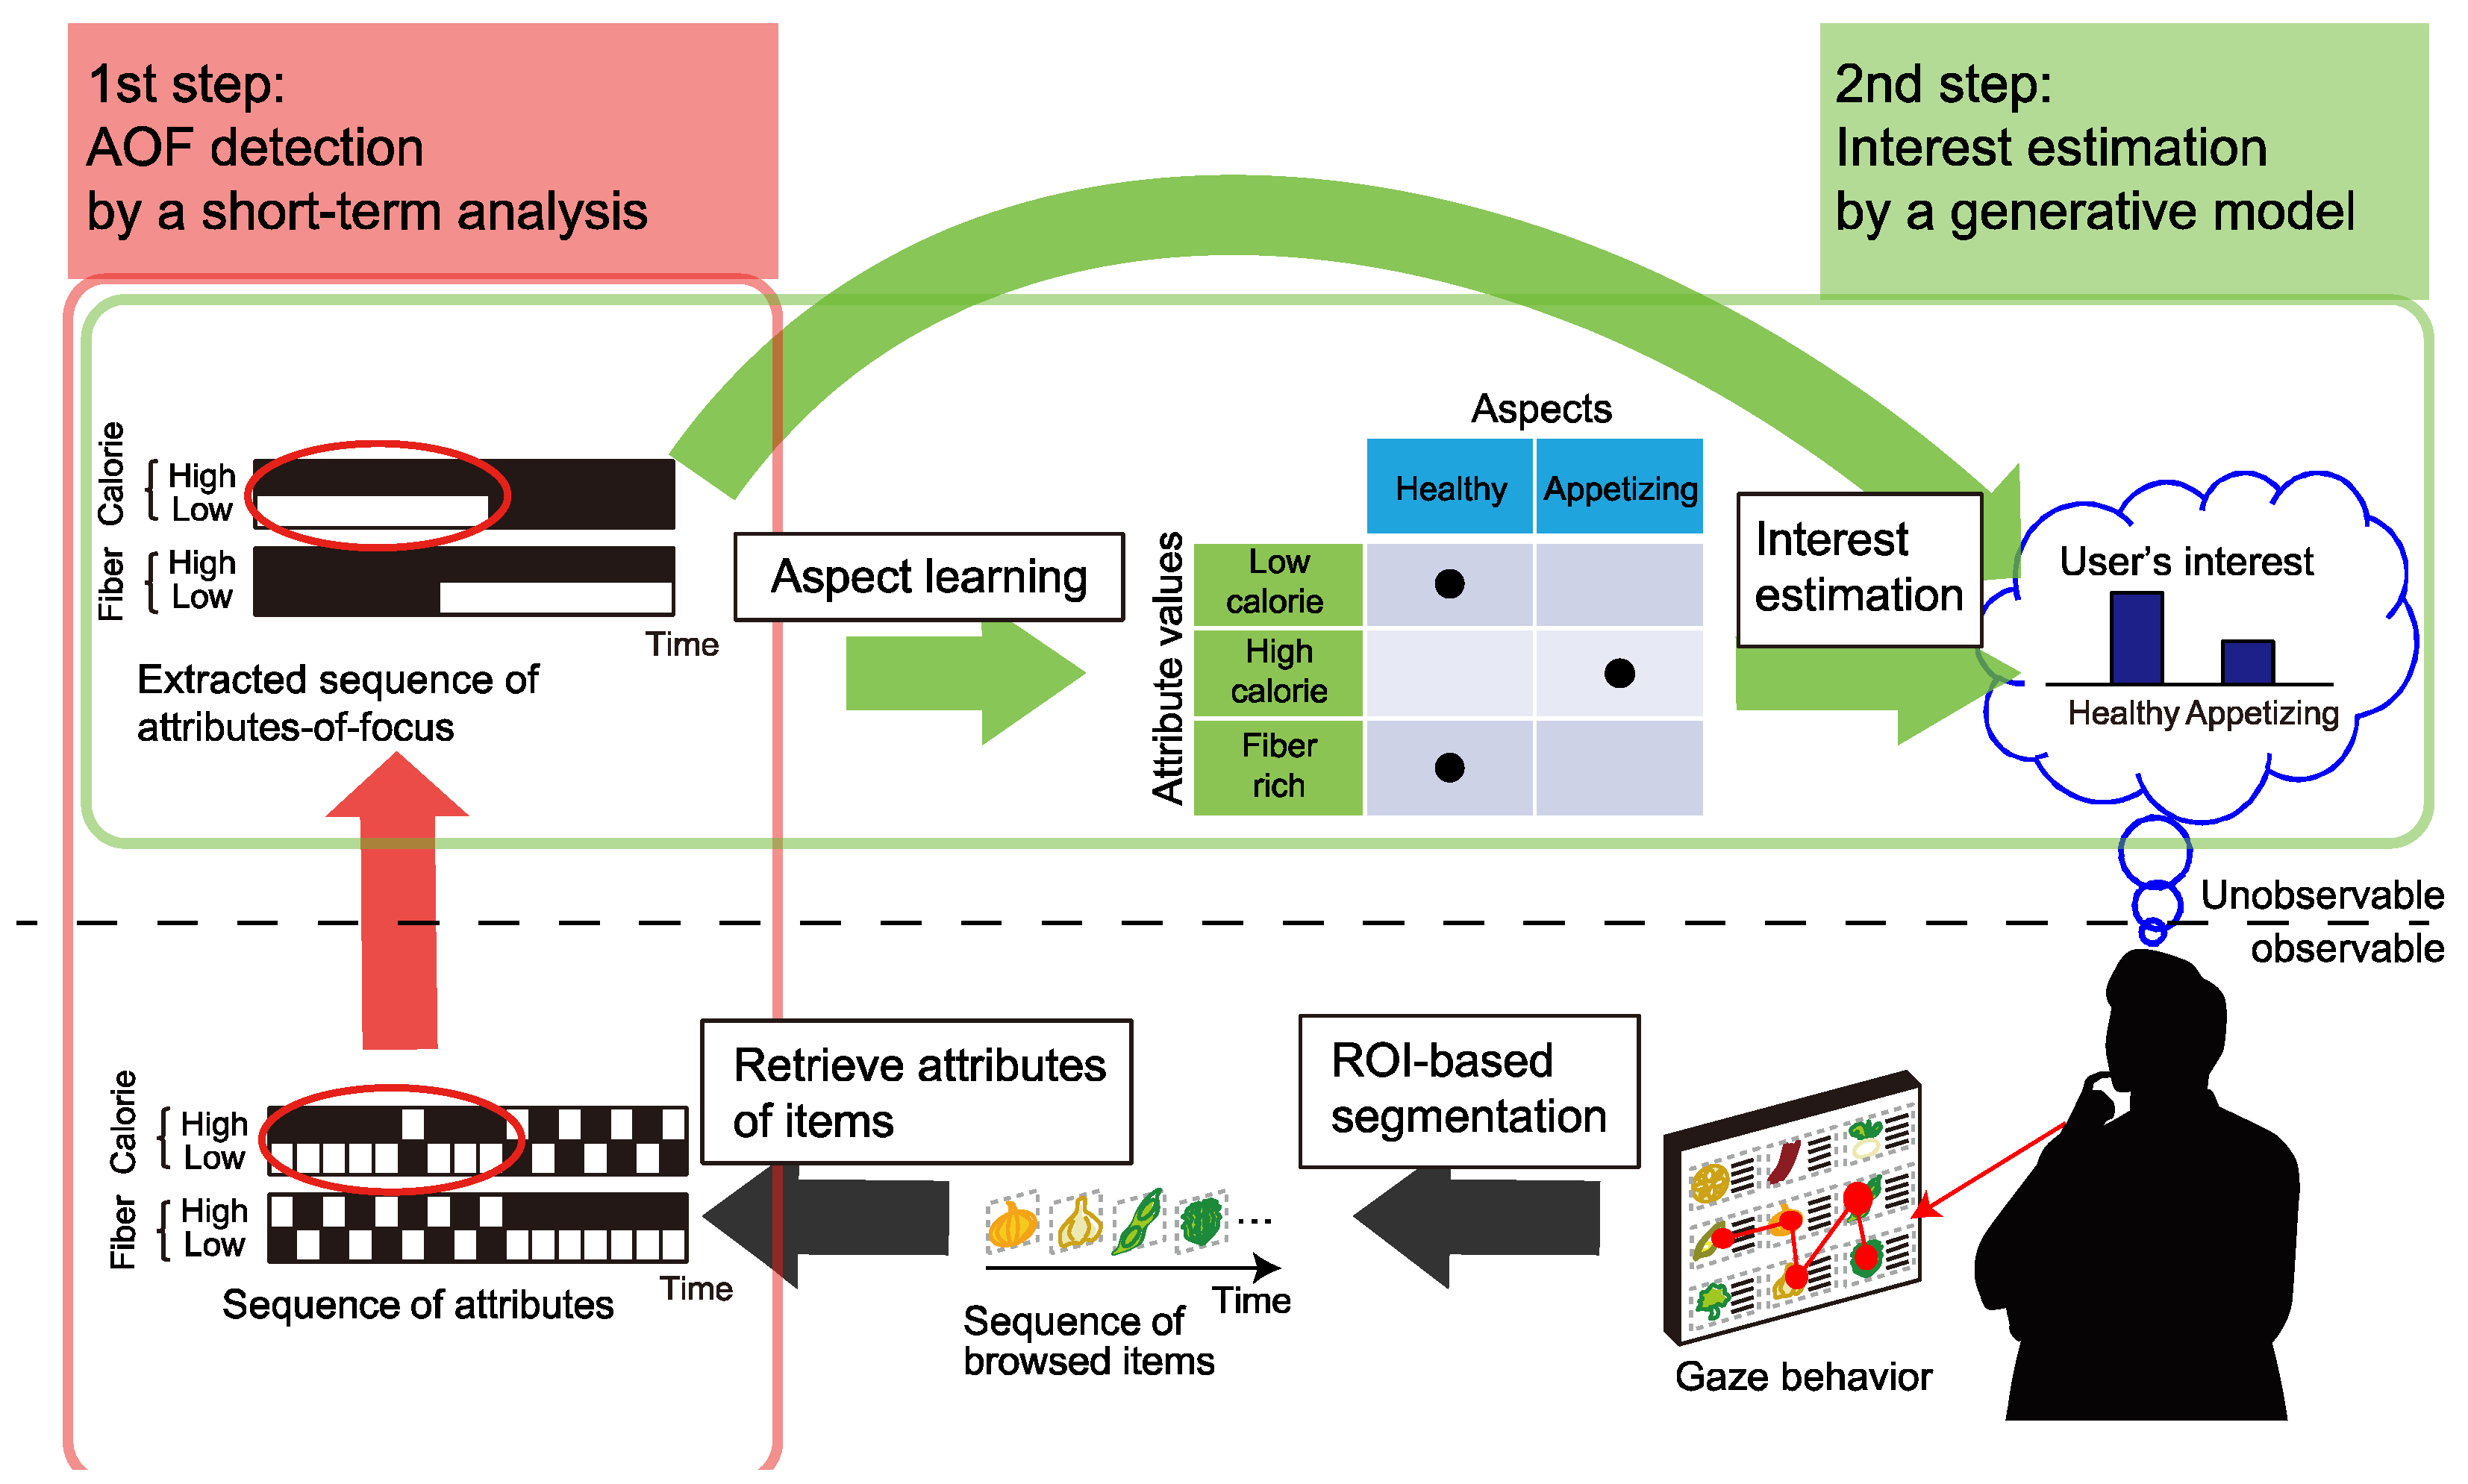
Two-step approach to estimating user interests
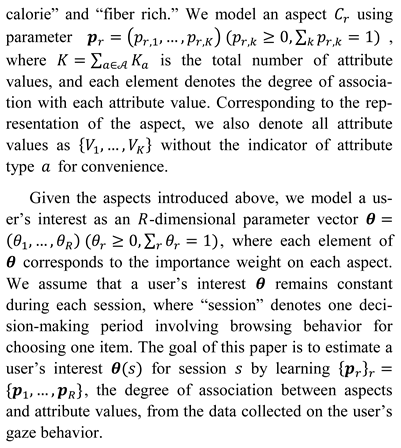
 , only a subset of attributes is taken care of in a decision-making session. We therefore introduce a designated step to extract AOF before applying a probabilistic generative model for interest estimation using unsupervised learning.
 AOF detection by short-term analysis
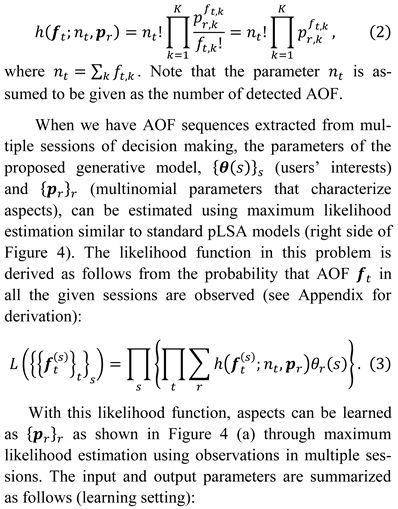
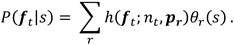
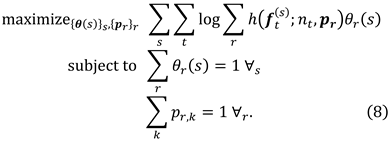
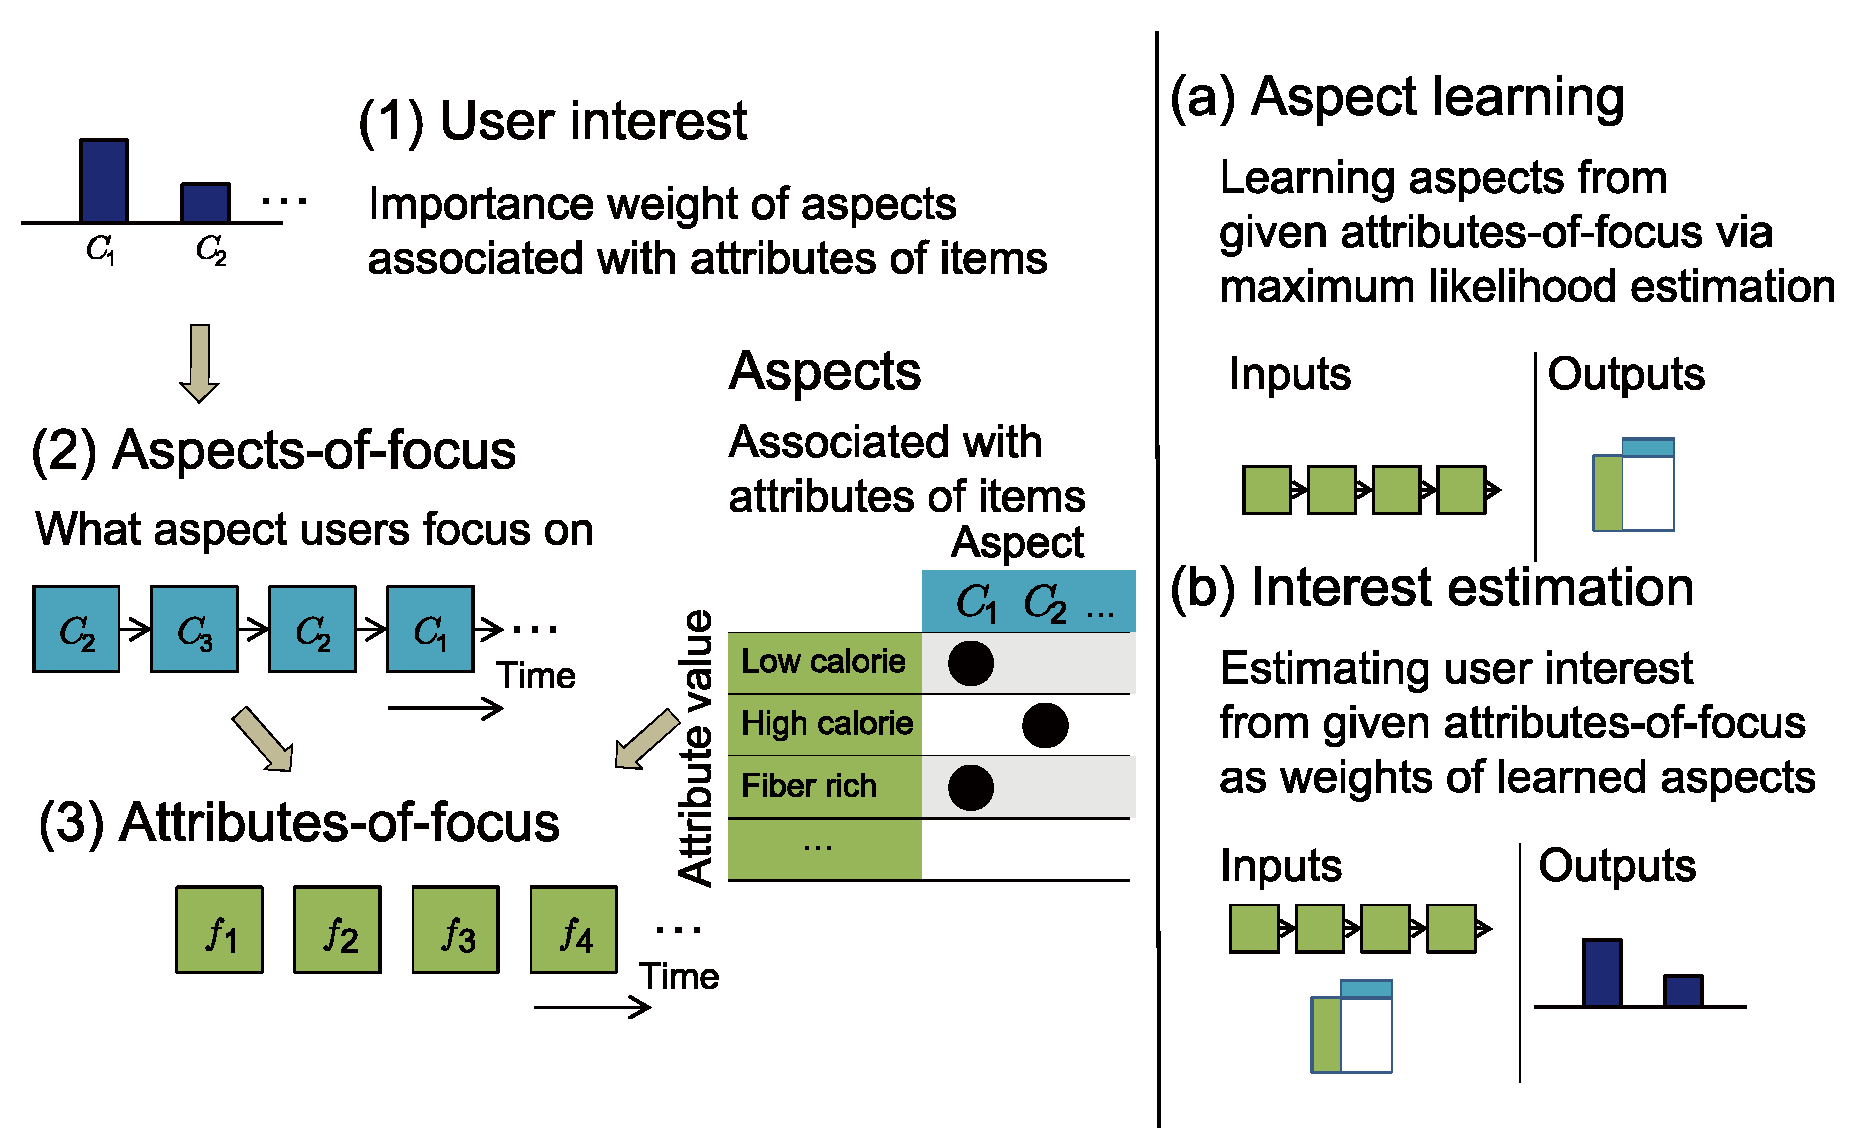
Interest estimation using a generative model
- Input:
![Jemr 13 00004 i012]() (a training set of AOF sequences);
(a training set of AOF sequences); - Output: {pr}r (the degree of association between aspects and attribute values) and {θ(s)}s (the users’ interests in training sessions).

- Input: {pr}r and
![Jemr 13 00004 i013]() (the AOF sequence during a session);
(the AOF sequence during a session); - Output: θ(s) (the user’s interest during the session).
Evaluation
Participants
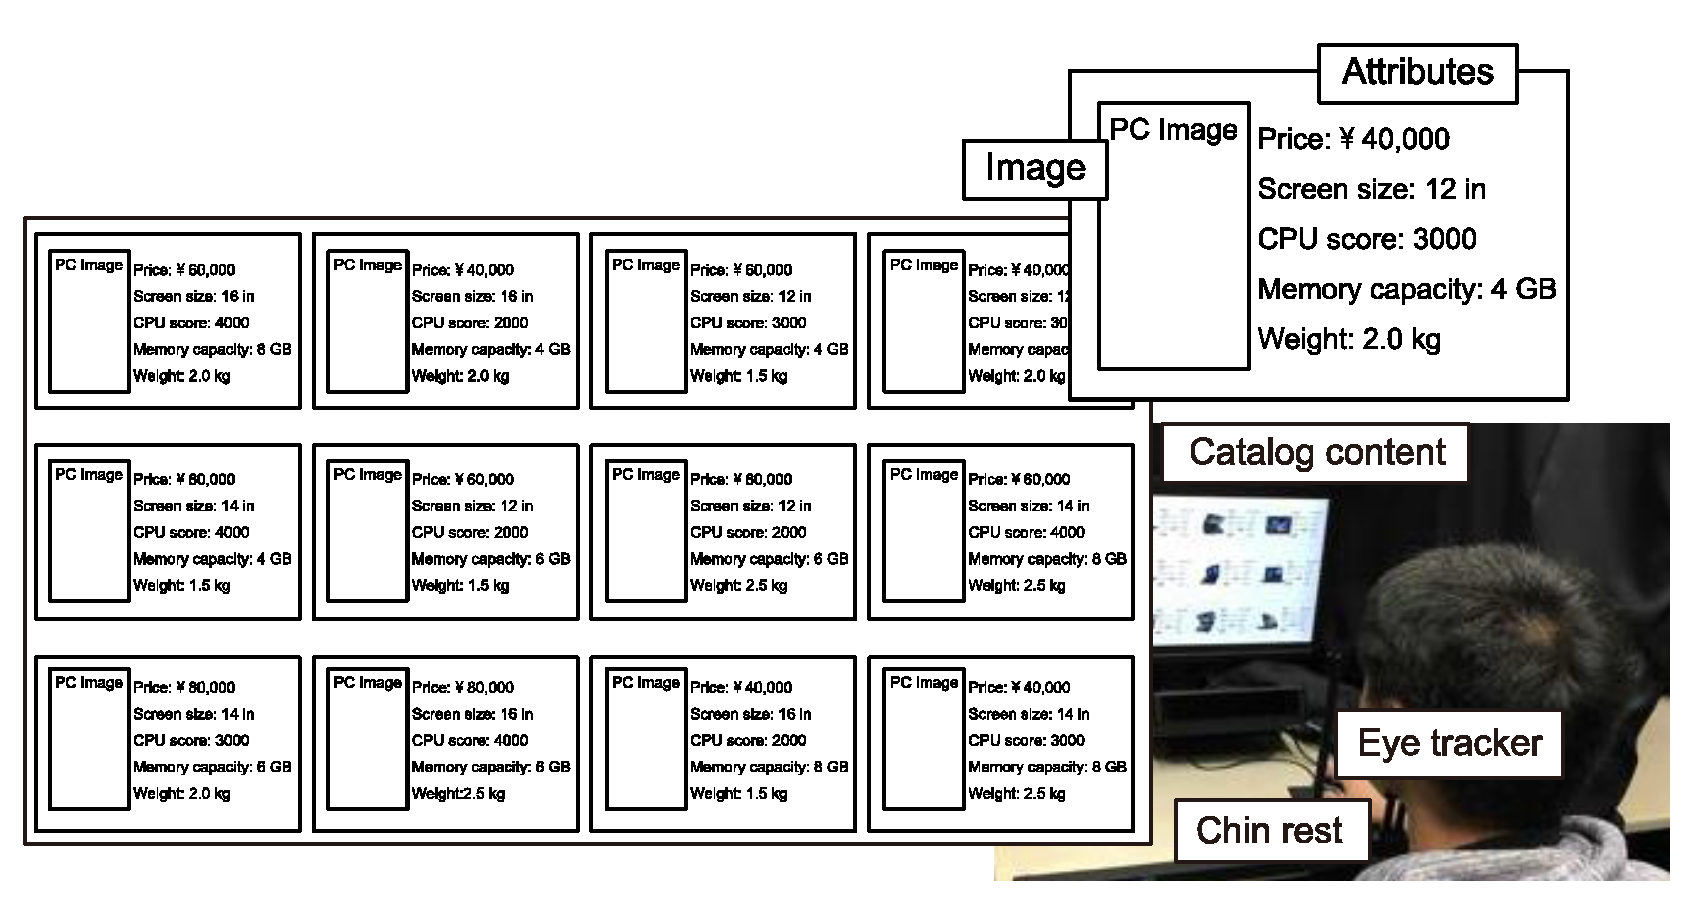
Design
Procedure
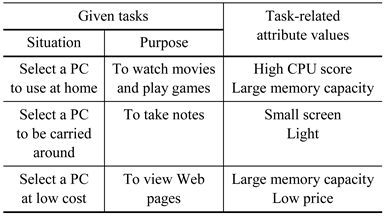
- Step 1. The participant was given a task (first two columns in Table 1).
- Step 2. The accuracy of the eye tracker’s calibrated parameters was confirmed.
- Step 3. The content was displayed, and the participant was asked to select one PC.
- Step 4. After the participant reported having made a selection, we asked which PC the participant had selected.
Results
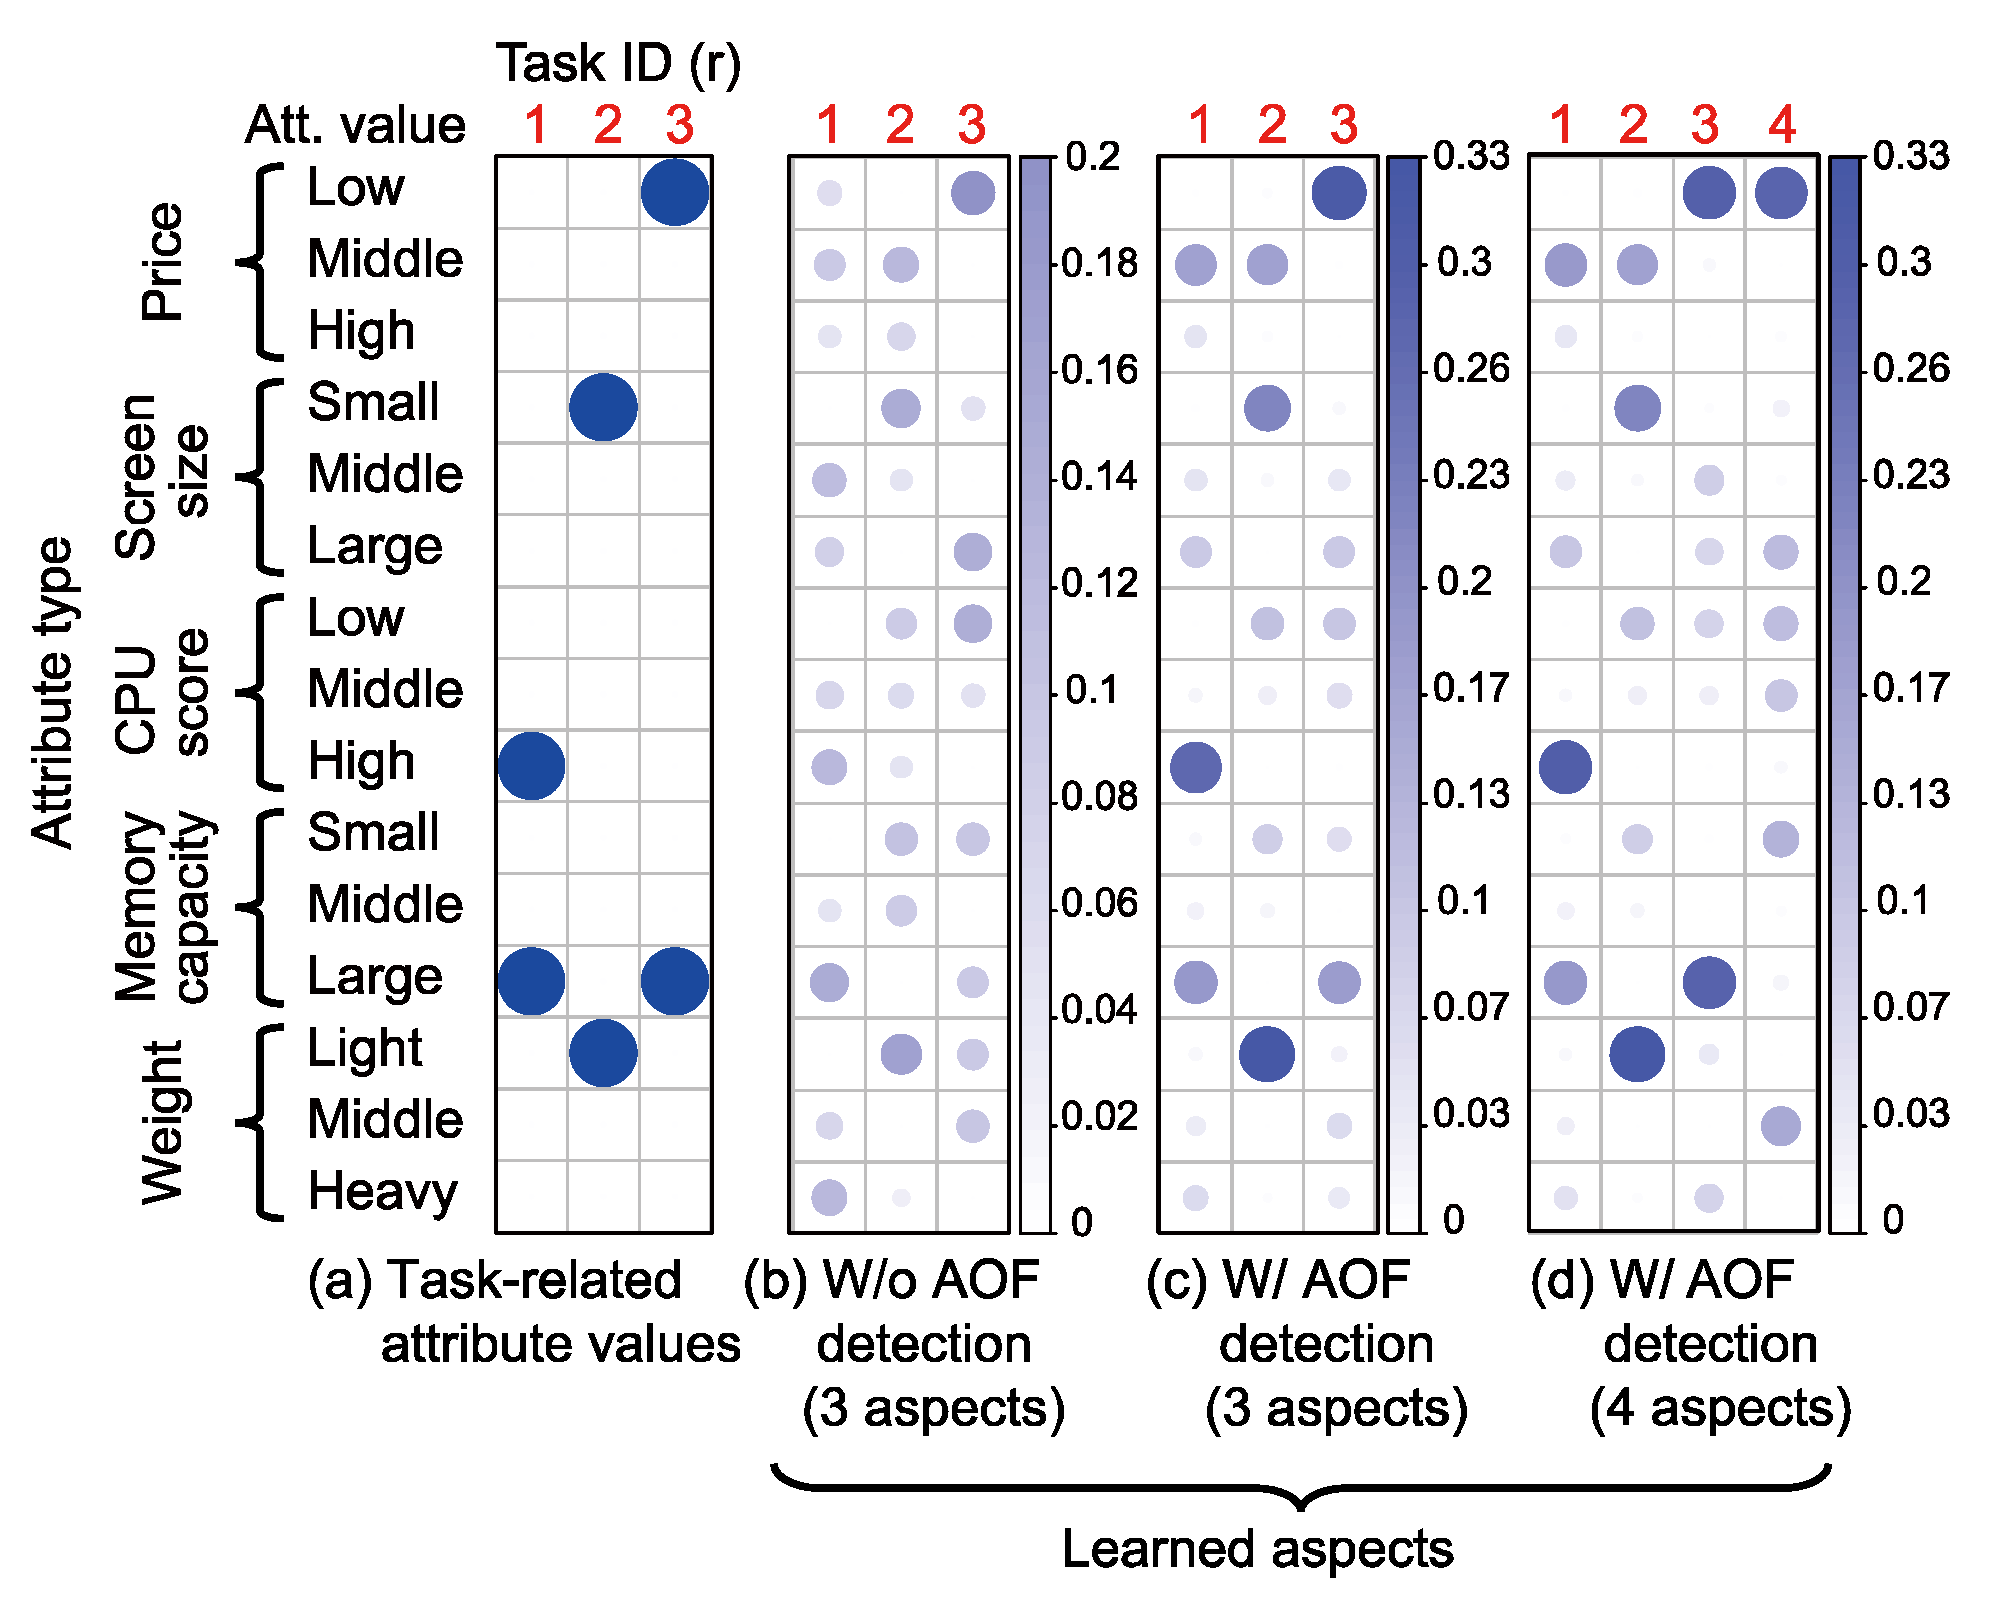
 and
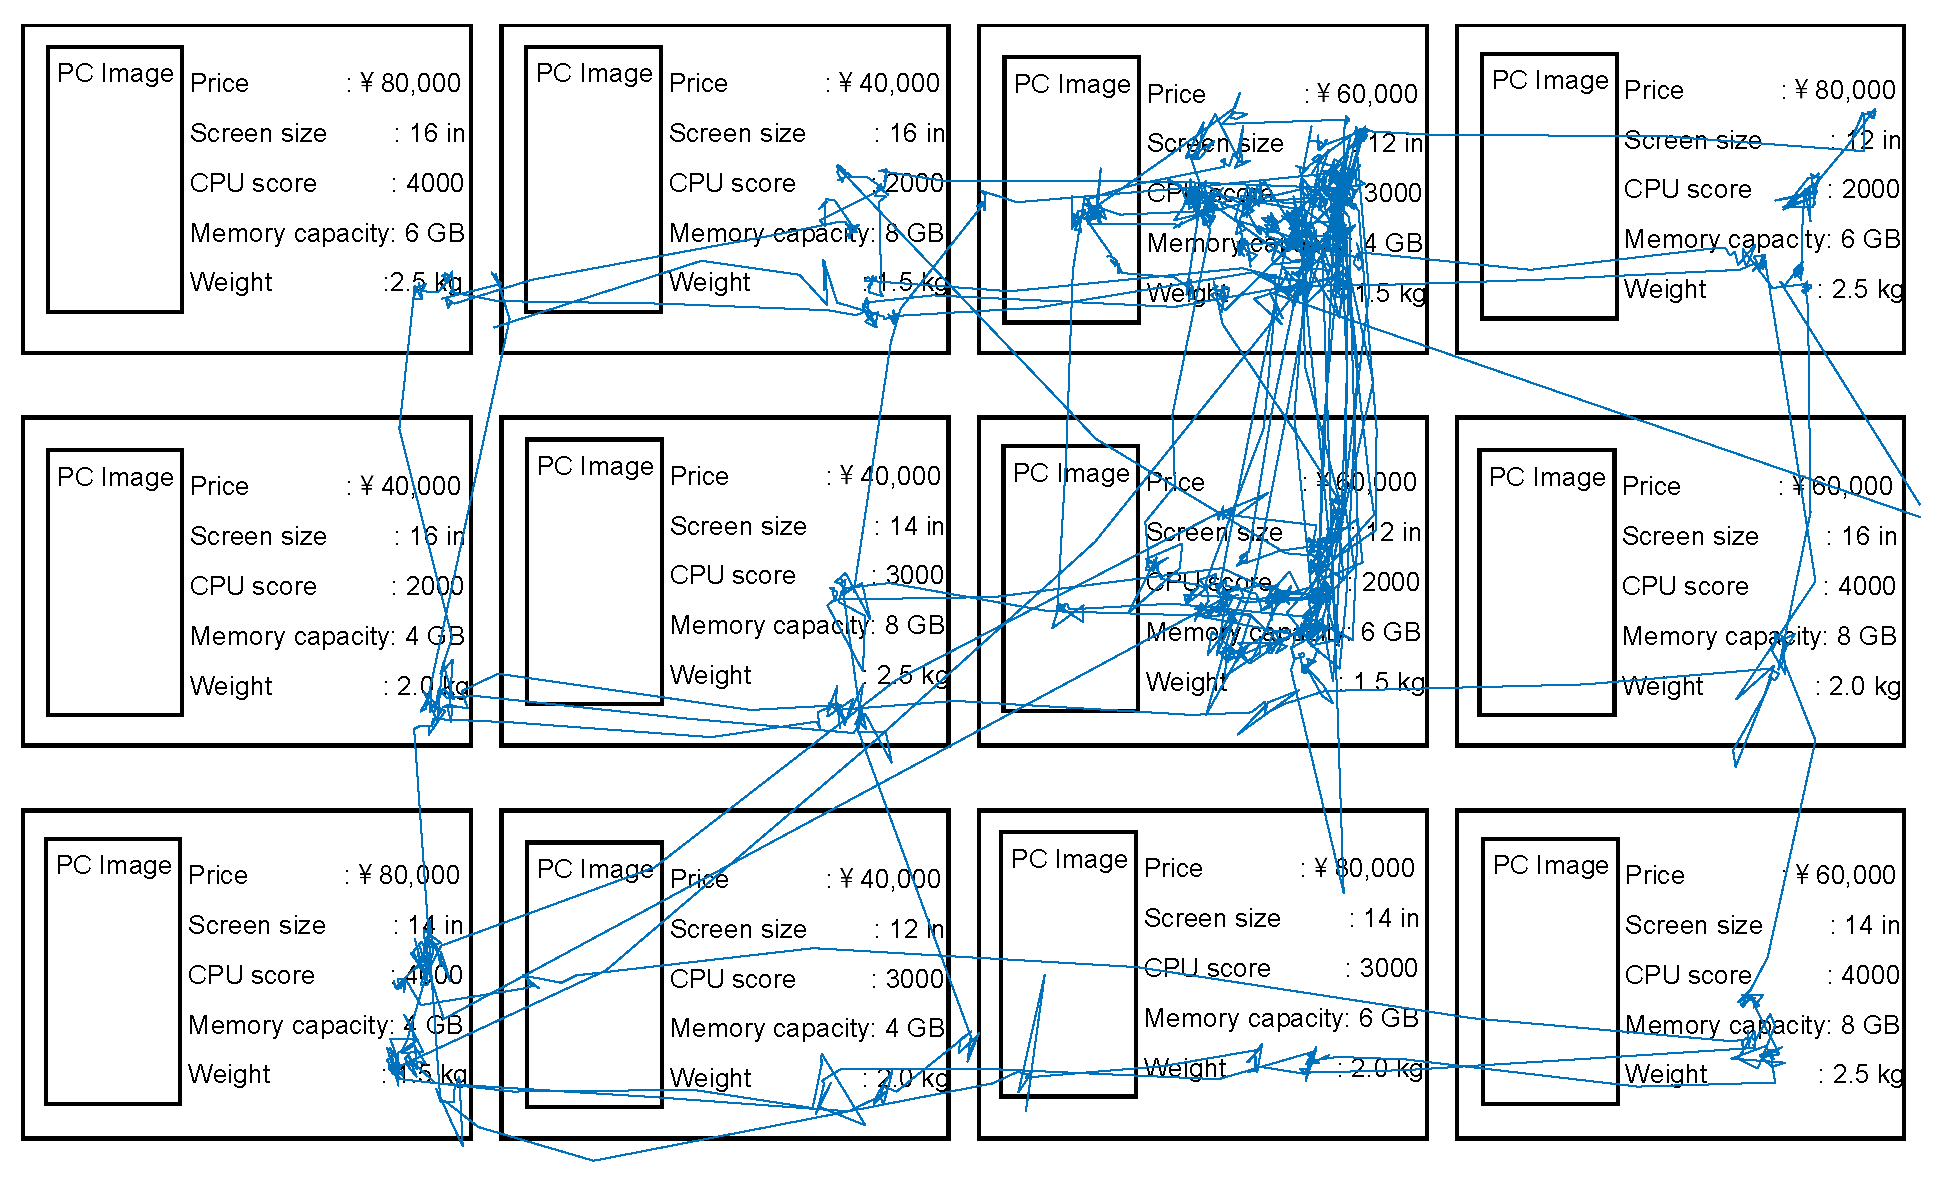
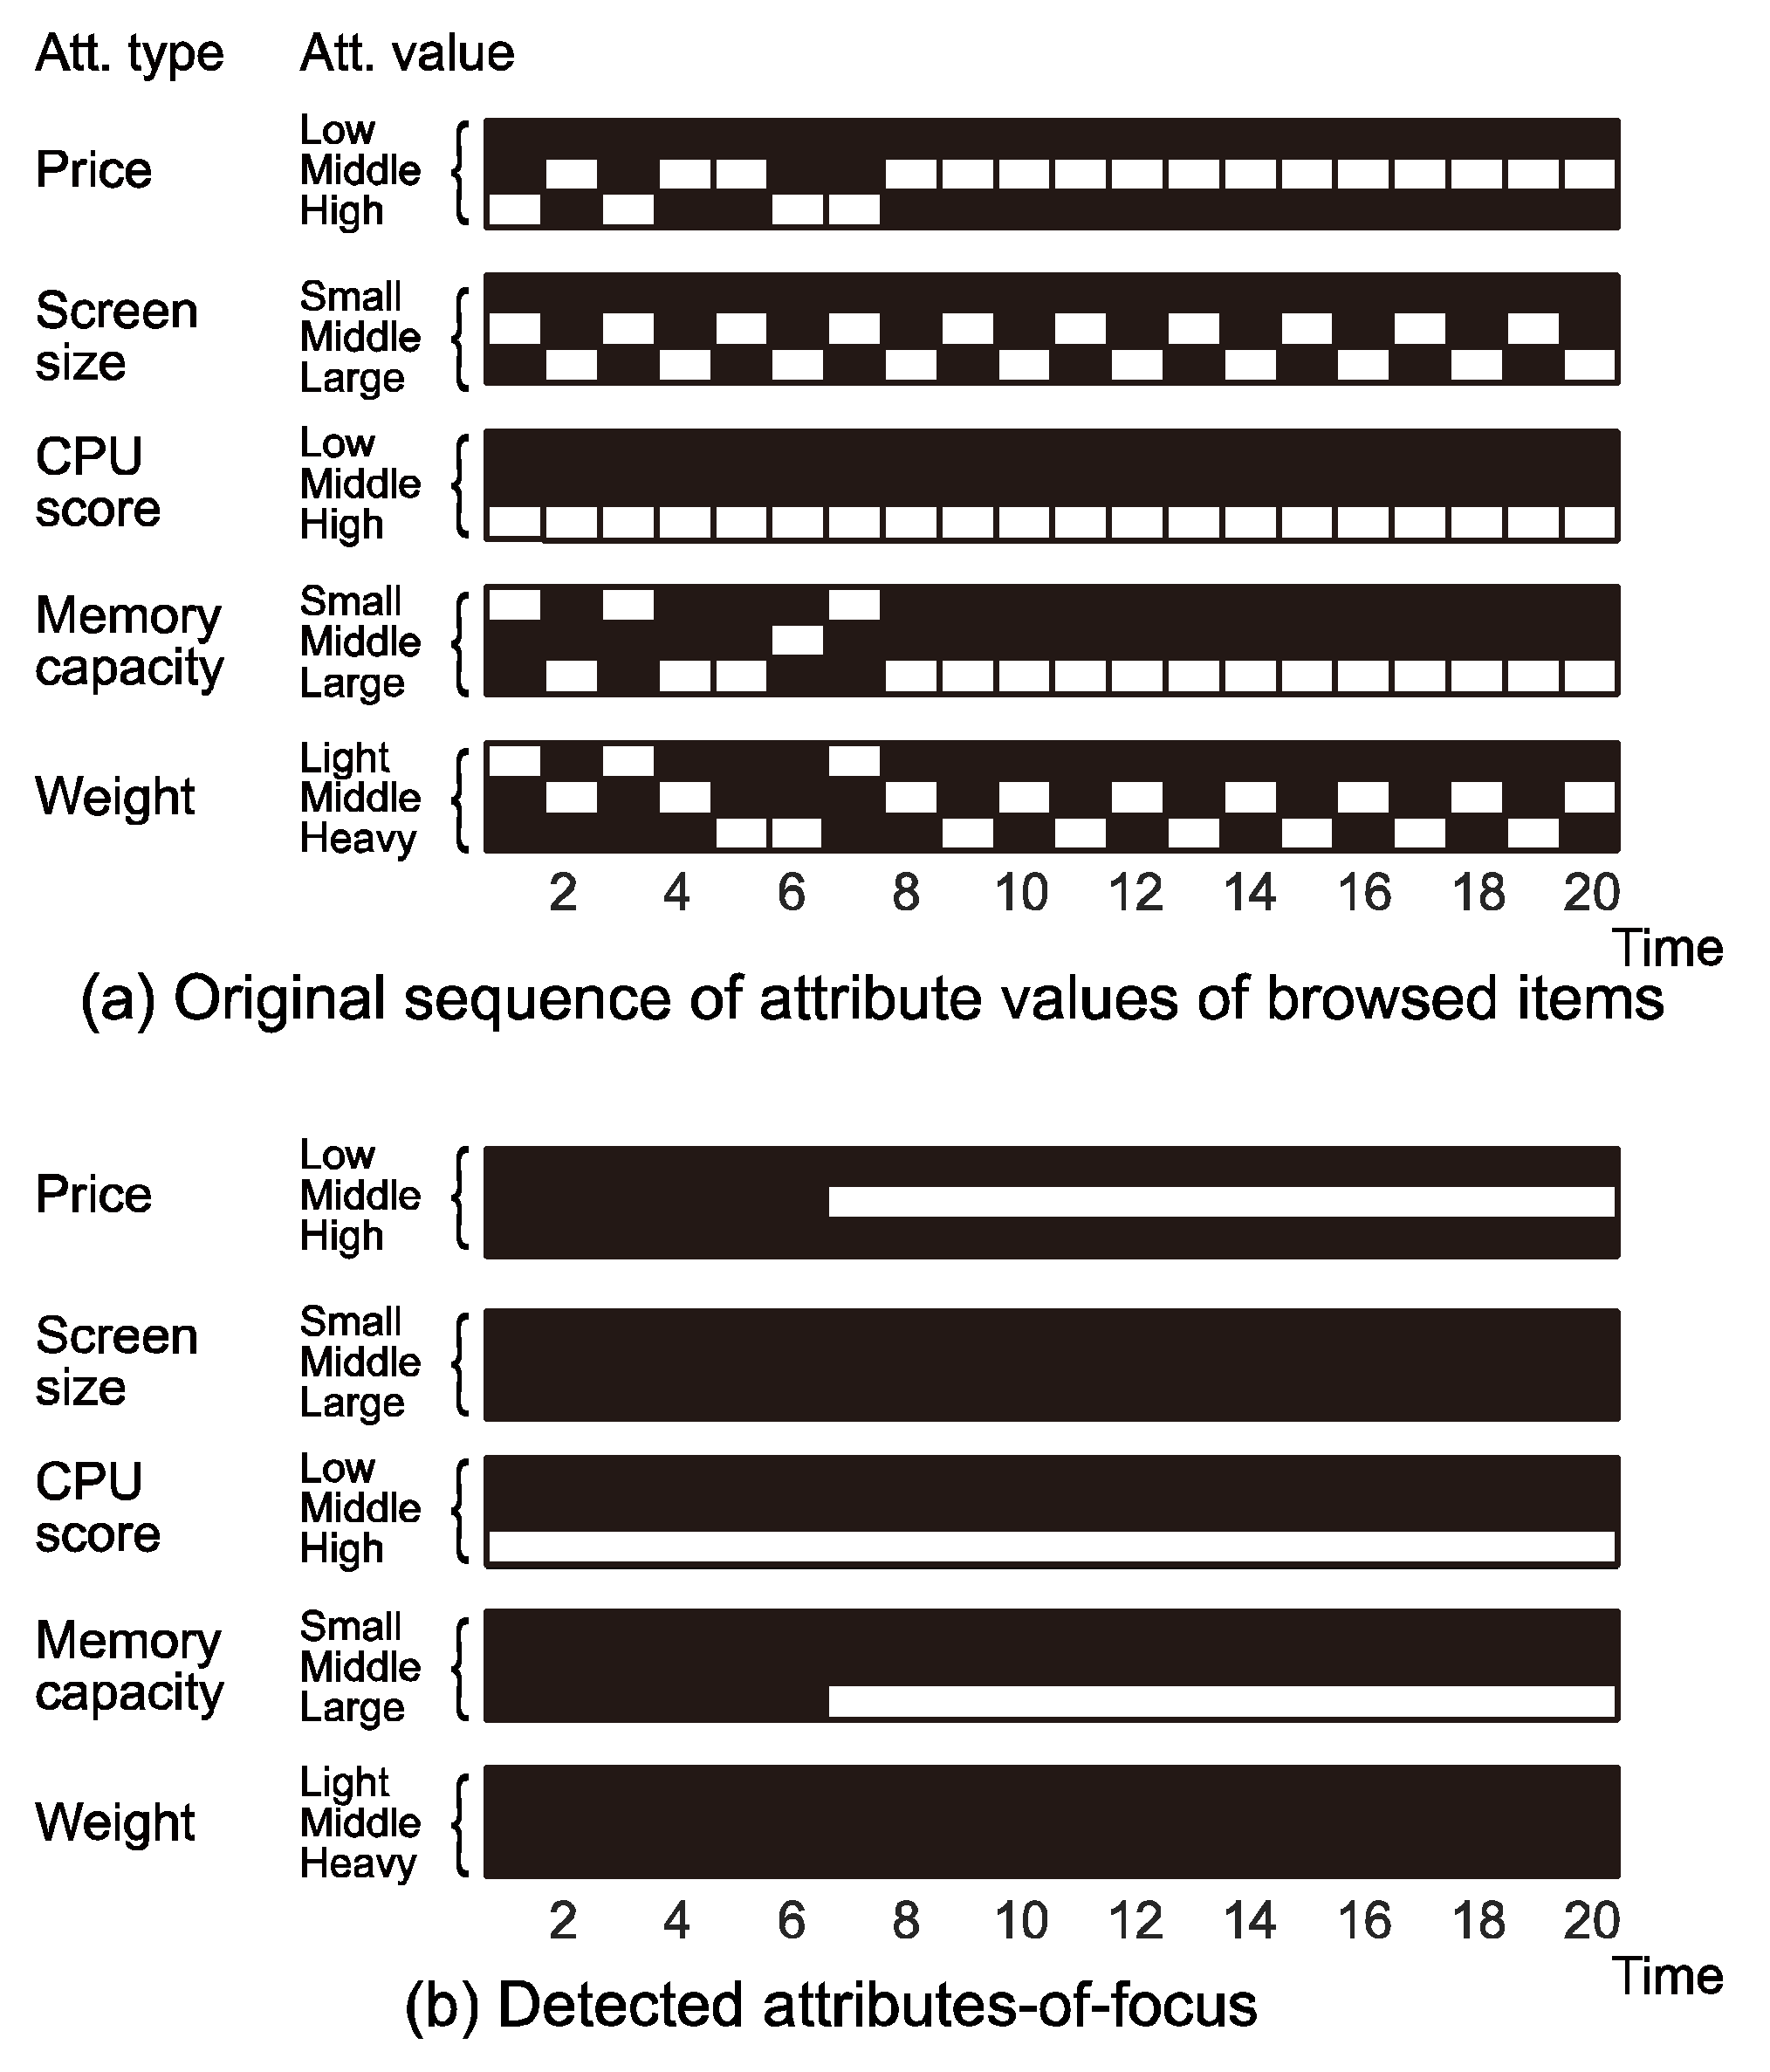
and  ; the notations were introduced in the methods section, and subscript 3 denotes the highest value for that attribute type). Remind that “Time” in the figure is based on the switching of gaze targets (i.e., ROIs). In this example, we can see that the participant first focused on high CPU scores (
 ) and then compared items with not only a high CPU scores but also large memory capac-ity ( and ) and a mid-range price (
 ). ) was also detected be-cause the compared items commonly had the value , although it was not included in the task. Similar choice behavior was seen in many other sessions with other participants. That is, the participants first focused on one task-related attribute value and then narrowed down the options by adding the other task-related attribute values to focus on. However, the participants did not always focus on attribute values related to their interests in the last couple of fixations. The total number of detected AOF in each (normalized) temporal position is depicted in Figure 8. In this plot, each session was divided into ten segments with respect to the temporal position, and the total number of AOF in each segment was calculated. This figure shows that, although the participants com-pared PCs mainly in latter part of the session, the com-parison decreases in the end of the session.
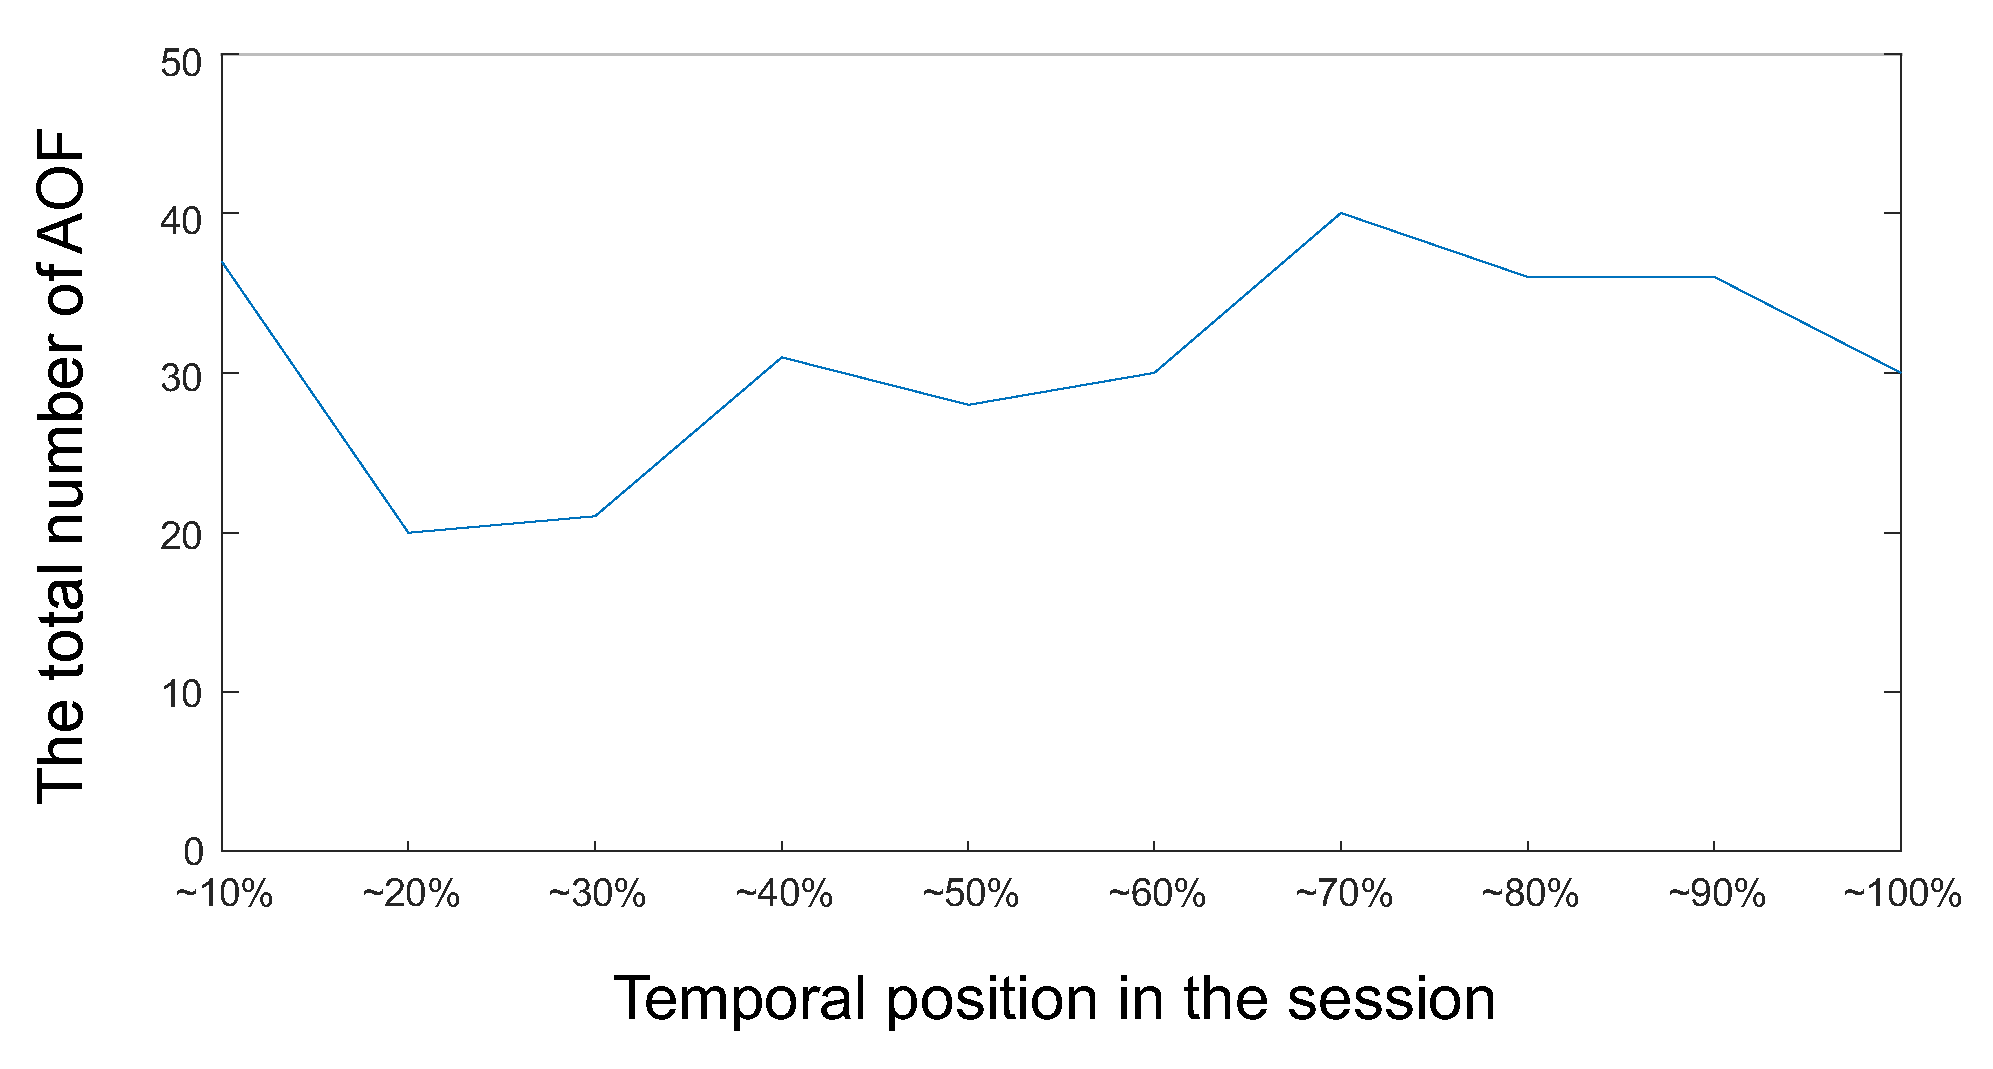
Discussion
Dynamics of user interests
Number of aspects
Temporal patterns of gaze targets
Effect of visual saliency and content design
Conclusion
Ethics and Conflict of Interest
Acknowledgments
Appendix
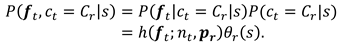
 during session s is computed as
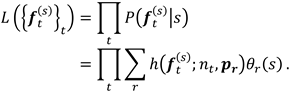
References
- Arsil, P., E. Li, and J. Bruwer. 2016. Using means-end chain analysis to reveal consumers’ motivation for buying local foods: An exploratory study. Gadjah Mada International Journal of Business 18, 3: 285–300. [Google Scholar] [CrossRef]
- Athukorala, K., A. Medlar, A. Oulasvirta, G. Jacucci, and D. Glowacka. 2016. Beyond relevance: Adapting exploration/exploitation in information retrieval. In Proceedings of the 21st international conference on intelligent user interfaces. pp. 359–369. [Google Scholar] [CrossRef]
- Blei, D. M., A. Y. Ng, and M. I. Jordan. 2003. Latent dirichlet allocation. Machine Learning Research 3: 993–1022. [Google Scholar]
- Bobadilla, J., F. Ortega, A. Hernando, and A. GutiéRrez. 2013. Recommender systems survey. Knowledge-Based Systems 46: 109–132. [Google Scholar] [CrossRef]
- Borji, A. 2012. Boosting bottom-up and top-down visual features for saliency estimation. In Proceedings of computer vision and pattern recognition. pp. 438–445. [Google Scholar] [CrossRef]
- Borji, A., and L. Itti. 2014. Defending Yarbus: Eye movements reveal observers’ task. Journal of Vision 14, 29: 1–22. [Google Scholar] [CrossRef]
- Brandherm, B., and H.I. Prendinger. 2008. Dynamic Bayesian network based interest estimation for visual attentive presentation agents. In Proceedings of the 7th international joint conference on autonomous agents and multiagent systems-volume. vol. 1, pp. 191–198. [Google Scholar]
- Bruce, N. D. B., and J. K. Tsotsos. 2009. Saliency, attention, and visual search: An information theoretic approach. Journal of Vision 9, 5: 1–24. [Google Scholar] [CrossRef]
- Chen, L., F. Wang, and W. Wu. 2016. Inferring users’ critiquing feedback on recommendations from eye movements. In Proceedings of 24th international conference on case-based reasoning research and development. pp. 62–76. [Google Scholar] [CrossRef]
- Cole, M. J., J. Gwizdka, C. Liu, N. J. Belkin, and X. Zhang. 2013. Inferring user knowledge level from eye movement patterns. Information Processing & Management 49, 5: 1075–1091. [Google Scholar] [CrossRef]
- Collen, H., and J. Hoekstra. 2001. Values as determinants of preferences for housing attributes. Journal of Housing and the Built Environment 16, 3: 285–306. [Google Scholar] [CrossRef]
- Das, A. S., M. Datar, A. Garg, and S. Rajaram. 2007. Google news personalization: Scalable online collaborative filtering. In Proceedings of the 16th international conference on world wide web. pp. 271–280. [Google Scholar] [CrossRef]
- Goldstein, E. B., D. Vanhorn, G. Francis, and I. Neath. 2011. Cognitive psychology: Connecting mind, research, and everyday experience, 3rd ed. Belmont, CA: Wadsworth/Cengage Learning. [Google Scholar]
- Gutman, J. 1982. A means-end chain model based on consumer categorization processes. Journal of Marketing 46, 2: 60–72. [Google Scholar] [CrossRef]
- He, J., P. Qvarfordt, M. Halvey, and G. Golovchinsky. 2016. Beyond actions: Exploring the discovery of tactics from user logs. Information Processing & Management 52, 6: 1200–1226. [Google Scholar] [CrossRef]
- Hirayama, T., D. Jean-Baptiste, H. Kawashima, and T. Matsuyama. 2010. Estimates of user interest using timing structures between proactive content display updates and eye movements. IEICE Transactions on Information & Systems E-93D, 6: 1470–1478. [Google Scholar] [CrossRef]
- Hofmann, T. 1999. Probabilistic latent semantic analysis. In Proceedings of the fifteenth conference on uncertainty in artificial intelligence. pp. 289–296. [Google Scholar]
- Ishii, R., Y. I. Nakano, and T. Nishida. 2013. Gaze awareness in conversational agents: Estimating a user’s conversational engagement from eye gaze. ACM Transactions on Interactive Intelligent Systems, August, vol. 3(2), pp. 1–11:25. [Google Scholar] [CrossRef]
- Ishikawa, E., H. Kawashima, and T. Matsuyama. 2015. Using designed structure of visual content to understand content-browsing behavior. IEICE Transactions on Information & Systems E-98D, 8: 15261535. [Google Scholar] [CrossRef]
- Itti, L., C. Koch, and E. Niebur. 1998. A model of saliency-based visual attention for rapid scene analysis. IEEE Transactions on Pattern Analysis and Machine Intelligence 20, 11: 1254–1259. [Google Scholar] [CrossRef]
- Iwata, T., S. Watanabe, T. Yamada, and N. Ueda. 2009. Topic tracking model for analyzing consumer purchase behavior. In Proceedings of the 21st international joint conference on artificial intelligence. pp. 1427–1432. [Google Scholar]
- Jin, X., Y. Zhou, and B. Mobasher. 2004. Web usage mining based on probabilistic latent semantic analysis. In Proceedings of the tenth ACM SIGKDD international conference on knowledge discovery and data mining. pp. 197–205. [Google Scholar] [CrossRef]
- Karimi, S., K. N. Papamichail, and C. P. Holland. 2015. The effect of prior knowledge and decision-making style on the online purchase decision-making process: A typology of consumer shopping behaviour. Decision Support Systems 77: 137–147. [Google Scholar] [CrossRef]
- Keeney, R. L. 1992. Value-Focused Thinking. A Path to Creative Decision Making. Cambridge: Harvard University Press. [Google Scholar]
- Kollmorgen, S., N. Nortmann, S. Schröder, and P. König. 2010. Influence of low-level stimulus features, task dependent factors, and spatial biases on overt visual attention. PLoS Computational Biology 6, 5: 1–20. [Google Scholar] [CrossRef] [PubMed]
- Martin-Albo, D., L. A. Leiva, J. Huang, and R. Plamondon. 2016. Strokes of insight: User intent detection and kinematic compression of mouse cursor trails. Information Processing & Management 52, 6: 989–1003. [Google Scholar] [CrossRef]
- Milosavljevic, M., V. Navalpakkam, C. Koch, and A. Rangel. 2012. Relative visual saliency differences induce sizable bias in consumer choice. Journal of Consumer Psychology 22, 1: 67–74. [Google Scholar] [CrossRef]
- Misu, T., K. Sugiura, T. Kawahara, K. Ohtake, C. Hori, H. Kashioka, H. Kawai, and S. Nakamura. 2011. Modeling spoken decision support dialogue and optimization of its dialogue strategy. ACM Transactions on Speech and Language Processing, June, vol. 7(3), pp. 1–10:18. [Google Scholar] [CrossRef]
- Ni, X., Y. Lu, X. Quan, L. Wenyin, and B. Hua. 2012. User interest modeling and its application for question recommendation in user-interactive question answering systems. Information Processing & Management 48, 2: 218–233. [Google Scholar] [CrossRef]
- Orquin, J. L., and S. M. Loose. 2013. Attention and choice: A review on eye movements in decision making. Acta Psychologica 144, 1: 190–206. [Google Scholar] [CrossRef]
- Parnell, G. S., D. W. Hughes, R. C. Burk, P. J. Driscoll, P. D. Kucik, B. L. Morales, and L. R. Nunn. 2013. Invited review-survey of value-focused thinking: Applications, research developments and areas for future research. Journal of Multi-Criteria Decision Analysis 20, 1-2: 49–60. [Google Scholar] [CrossRef]
- Reusens, M., W. Lemahieu, B. Baesens, and L. Sels. 2017. A note on explicit versus implicit information for job recommendation. Decision Support Systems 98: 26–35. [Google Scholar] [CrossRef]
- Reynolds, T. J., and J. Gutman. 1988. Laddering theory, method, analysis, and interpretation. Journal of Advertising Research 28, 1: 11–31. [Google Scholar]
- Russo, J. E., and F. Leclerc. 1994. An eye-fixation analysis of choice processes for consumer nondurables. Journal of Consumer Research 21, 2: 274–290. [Google Scholar] [CrossRef]
- Saaty, T. L. 1980. The analytic hierarchy process: planning, priority setting, resource allocation. London; New York, NY: McGraw-Hill International Book Co. [Google Scholar]
- Schaffer, E., H. Kawashima, and T. Matsuyama. 2016. A probabilistic approach for eye-tracking based process tracing in catalog browsing. Journal of Eye Movement Research 9, 7: 1–14. [Google Scholar] [CrossRef]
- Shi, S. W., M. Wedel, and G. M. R. Pieters. 2013. Information acquisition during online decision making: A model-based exploration using eye-tracking data. Management Science 59, 5: 1009–1026. [Google Scholar] [CrossRef]
- Shi, Y., M. Larson, and A. Hanjalic. 2014. Collaborative filtering beyond the user-item matrix: A survey of the state of the art and future challenges. ACM Computing Surveys, May, vol. 47(1), pp. 1–3:45. [Google Scholar] [CrossRef]
- Shimonishi, K., H. Kawashima, R. Yonetani, E. Ishikawa, and T. Matsuyama. 2013. Learning aspects of interest from gaze. In Proceedings of the 6th workshop on eye gaze in intelligent human machine interaction: Gaze in multimodal interaction. pp. 41–44. [Google Scholar] [CrossRef]
- Steichen, B., C. Conati, and G. Carenini. 2014. Inferring visualization task properties, user performance, and user cognitive abilities from eye gaze data. ACM Transactions on Interactive Intelligent Systems, July, vol. 4(2), pp. 1–11:29. [Google Scholar] [CrossRef]
- Sugano, Y., Y. Ozaki, H. Kasai, K. Ogaki, and Y. Sato. 2014. Image preference estimation with a datadriven approach: A comparative study between gaze and image features. Journal of Eye Movement Research 7, 3: 1–9. [Google Scholar] [CrossRef]
- Tatler, B. W., R. J. Baddeley, and I. D. Gilchrist. 2005. Visual correlates of fixation selection: Effects of scale and time. Vision Research 45, 5: 643–659. [Google Scholar] [CrossRef]
- Uetsuji, K., H. Yanagimoto, and M. Yoshioka. 2015. User intent estimation from access logs with topic model. Procedia Computer Science 60: 141–149. [Google Scholar] [CrossRef]
- Veludo, T. M., A. A. Ikeda, and M. C. Campomar. 2006. Laddering in the practice of marketing research: barriers and solutions. Qualitative Market Research: An International Journal 9, 3: 297–306. [Google Scholar] [CrossRef]
- Walker, M. A., S. J. Whittaker, A. Stent, P. Maloor, J. Moore, M. Johnston, and G. Vasireddy. 2004. Generation and evaluation of user tailored responses in multimodal dialogue. Cognitive Science 28, 5: 811–840. [Google Scholar] [CrossRef]
- Yarbus, A. L. 1967. Eye movements and vision. New York, NY: Plenum. [Google Scholar]
- Zanoli, R., and S. Naspetti. 2002. Consumer motivations in the purchase of organic food: A means-end approach. British Food Journal 104, 8: 643–653. [Google Scholar] [CrossRef]

 |
 |
Copyright © 2020. This article is licensed under a Creative Commons Attribution 4.0 International License.
Share and Cite
Shimonishi, K.; Kawashima, H. A Two-step Approach for Interest Estimation from Gaze Behavior in Digital Catalog Browsing. J. Eye Mov. Res. 2020, 13, 1-17. https://doi.org/10.16910/jemr.13.1.4
Shimonishi K, Kawashima H. A Two-step Approach for Interest Estimation from Gaze Behavior in Digital Catalog Browsing. Journal of Eye Movement Research. 2020; 13(1):1-17. https://doi.org/10.16910/jemr.13.1.4
Chicago/Turabian StyleShimonishi, Kei, and Hiroaki Kawashima. 2020. "A Two-step Approach for Interest Estimation from Gaze Behavior in Digital Catalog Browsing" Journal of Eye Movement Research 13, no. 1: 1-17. https://doi.org/10.16910/jemr.13.1.4
APA StyleShimonishi, K., & Kawashima, H. (2020). A Two-step Approach for Interest Estimation from Gaze Behavior in Digital Catalog Browsing. Journal of Eye Movement Research, 13(1), 1-17. https://doi.org/10.16910/jemr.13.1.4