Abstract
The past few years have witnessed renewed interest in modelling and forecasting asymmetry in financial time series using a variety of approaches. The most intriguing of these strategies is the “asymmetric” or “leverage” volatility model. This study aims to conduct a review of asymmetric GARCH models using bibliometric analysis to identify their key intellectual foundations and evolution, and offers thematic and methodological recommendations for future research to advance the domain. Bibliometric analysis was used to identify patterns in and perform descriptive analysis of articles, including citation, co-authorship, bibliographic coupling, and co-occurrence analysis. The study located 856 research papers from the Scopus database between 1992 and 2021 using key phrase and reference search methods. Publication trends, most influential authors, leading countries, and top journals are described, along with a systematic review of highly cited articles. The study summarises the development, application, and performance evaluation of asymmetric GARCH models, which will help researchers and academicians significantly contribute to this literature by addressing gaps.
JEL Classification:
C01; C58
1. Introduction
Since all participants in the financial market are concerned with the risks associated with the assets in which they invest, modelling and predicting the volatility of financial assets is crucial. It is essential for a number of financial operations, including risk management, derivative pricing and hedging, market making, market timing, portfolio selection, and many others. It is a way to gauge how returns across a time series of asset values have changed over time (Aliyev et al. 2020). Volatility clustering, leptokurtosis, asymmetries in volatility, and the leverage effect are frequently used to describe the returns on financial assets. Large changes are followed by other large changes, and small changes are followed by smaller changes. This is known as volatility clustering. Leptokurtosis denotes a fat-tailed distribution of returns (the kurtosis exceeds that of a standard distribution).
Another well-known characteristic of financial time series is asymmetric dynamics. The asymmetry refers to the fact that volatility is higher when returns are negative. It is introduced by (Black 1976) and (Christie 1982). In the literature, the leverage effect and the volatility feedback effect are used to describe the asymmetric volatility attribute (Campbell and Hentschel 1992), (Bollerslev 1987). It is actually negative and positive shocks that are to blame for this volatility clustering. In comparison to a positive shock of equal magnitude, a negative shock produces more volatility. Autoregressive conditional heteroscedasticity or threshold models are effective ways to model these asymmetric and nonlinear dynamics (Aliyev et al. 2020).
Conditional heteroscedastic models are the fundamental econometric tools for estimating and forecasting asset return volatility (Alberg et al. 2008). To describe conditional variance dynamics, Engle (1982) developed the autoregressive conditional heteroscedasticity (ARCH) model, which calculates the variance of returns as a straightforward quadratic function of the lagged values of the innovations. One of its weaknesses is that the ARCH model frequently needs many parameters and a high order q to capture the volatility process. The GARCH model, which is based on an infinite ARCH specification and allows us to restrict the number of estimated parameters by imposing nonlinear constraints, was introduced by Bollerslev (1986) as a solution to this problem. The ARCH and GARCH models both take into account volatility clustering and leptokurtosis; however, because of the symmetry of their distributions (the conditional variance only depends on the magnitude, not the sign of the underlying asset), they are unable to account for the leverage effect (the effect of positive and negative shock on conditional variance). To address this issue, many nonlinear extensions of GARCH models have been proposed, including Exponential GARCH (EGARCH) by Nelson (1991), Threshold GARCH (TGARCH), and Asymmetric Power ARCH (APARCH) by Ding et al. (1993). Similar to GARCH models, high-frequency financial time series have thick tails that are not always properly incorporated into models. To solve this problem, Bollerslev (1987) and Baillie and Bollerslev (1989) used Student’s t-distribution. The accuracy, usability, forecasting performance, and other characteristics of symmetric and asymmetric GARCH models have been examined in a number of studies, including those by Campbell and Hentschel (1992), Engle (1982), Shahateet (2019), Alberg et al. (2008), Gökbulut and Pekkaya (2014), Maqsood et al. (2013), (French et al. 1987) and (Lee (2017).
This study carries out a twofold analysis of existing literature on asymmetric GARCH models using bibliometric analysis and systematic review. Bibliometric analysis is a crucial technique for statistically analysing a sizable body of prior literature and figuring out how well a particular topic has evolved, while reviewing publications in a field of study is a critical method for locating important research areas. The study used a range of bibliometric tools to map the literature on asymmetric GARCH modelling and to extract insightful conclusions regarding the temporal trends of publishing, prominent authors, key journals, and influential works. This was followed by a thorough literature review of highly cited research papers to determine the forecasting accuracy of different asymmetric GARCH models and to propose the best model to capture the asymmetric effect in the conditional volatility of time series data. Through systematic review, we can obtain insightful knowledge on the most frequently used GARCH models, the major research focus, and the best model proposed by prominent authors in this field of research. In recent years, applying asymmetric GARCH models to model the characteristics of time series data became an interesting field of research, as the financial market witnessed a large number of ups and downs due to positive and negative news/information. On reviewing the literature on asymmetric volatility and GARCH modelling, it was seen that most of the studies focused on modelling asymmetric effects in the conditional volatility of the stock market, and researchers had conflicting opinions on the best GARCH model to capture the same. Since the literature on asymmetric GARCH models has not undergone critical review, a review technique must be used to determine the areas of interest for future research. To the best of our knowledge, no studies have yet thoroughly summarised the asymmetric GARCH literature through bibliometric analysis and review. It will significantly contribute to the literature in this domain by analyzing the evolution and development of, and current trend in, asymmetric GARCH models, along with highlighting the application and forecasting accuracy of these models through review. This will enable both researchers and financial market participants to gain an understanding of this area of study and bridge the knowledge gap.
The primary objectives of this study are:
- To evaluate the current trend in asymmetric GARCH models in the literature using bibliometric analysis;
- To provide thorough analysis of the use and forecasting capabilities of asymmetric GARCH models.
This study’s remaining sections are structured as follows: The methodology used to extract pertinent literature on asymmetric GARCH models is the main topic of Section 2. Section 3 highlights the bibliometric analysis and findings followed by a systematic review of highly cited research papers, and proposes an agenda for future research, and finally, Section 4 outlines the conclusion.
2. Data and Methodology
We follow the analytical framework followed by Phoong et al. (2022) to present the research objectives along with the methodology adopted to address the research objectives. The above study presented the methodology used to address each of the research objectives in a concise manner using a table. The main objectives of this study, along with the methodology we used to address the same, are presented in Table 1. We used co-authorship, co-occurrence, and bibliographic coupling to provide basic information on the yearly publications and citations and the effectiveness of journals, authors, countries, and search terms in this field of study. Furthermore, a systematic literature review was conducted to address the application and accuracy of those models.

Table 1.
Overview of Research Objective and Methodology.
2.1. Locating Study
An appropriate and trustworthy database is required to ensure the validity and reliability of collected data. To address the research objectives, we used the Scopus database as the source for data collection. We elected to acquire data from Scopus because this database offers the widest coverage of peer-reviewed research in finance (Goodell et al. 2021), a rapid update frequency, and the flexibility to debug and process data (Jain et al. 2021).
2.2. Selection of Relevant Research
The use of the Scopus database initiated the selection process. The 1992–2021 time period was chosen to examine the overall trend in asymmetric GARCH models; we excluded the year 2022 as the publications in this field of research were not yet completed. We used keywords to retrieve relevant articles by examining the literature on asymmetric GARCH models. The actual process for extracting pertinent literature on asymmetric GARCH models for bibliometric analysis is shown in Figure 1.
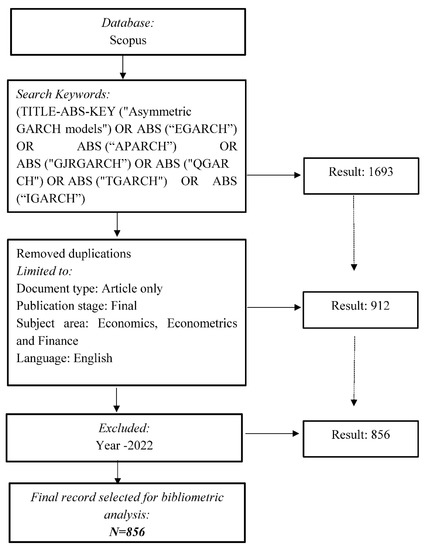
Figure 1.
Dataset extraction and processing mechanism for bibliometric analysis.
The dataset for this study, which was retrieved from the Scopus database on June 8 2022, contained 1693 documents. By applying exclusion criteria, 837 of these were removed. This resulted in the final dataset of 856 documents for bibliometric analysis. We used VOS viewer (Visualisation of Similarities) and Excel software to apply bibliographic methods. VOS viewer software was used to construct network mapping, and Excel was used for further filtering and tabulation.
3. Bibliometric Analysis
Bibliometric analysis used a large number of studies to identify popular trends in the literature on asymmetric GARCH models. This section focuses on the outcomes of bibliometric analytic tools.
3.1. Descriptive Analysis
To identify the current trend in this research theme, we used descriptive analysis, which provides a thorough understanding of performance trends for publications and citations regarding asymmetric GARCH models, followed by influential authors, top countries, and impactful journals.
3.1.1. Annual Publication Trend
The annual scientific production of research articles focusing on asymmetric GARCH models provides a comprehensive analysis of the evolution, growth, and current trend in studies using asymmetric GARCH models to model asymmetric financial time series effects. The number of publications from 1992 to 2021 is depicted in Figure 2. In general, the use of asymmetric GARCH models grew steadily over the years. Three papers on asymmetric GARCH models were published in 1992, and the publication trend was not remarkable until 2002. Publications concerned with asymmetric GARCH models increased exponentially after that. This scenario suggests that asymmetric GARCH models gained popularity among academics in recent decades, particularly after 2008. After the stock market crash of 2008–2009, the application of asymmetric GARCH models to evaluate asymmetric effects in time series data became more important, and this trend continued until 2021. Unsurprisingly, there were 202 publications from 2019 to 2021 (the period of the COVID-19 pandemic). The trend in scientific production of asymmetric GARCH models became visible and clear over the years.
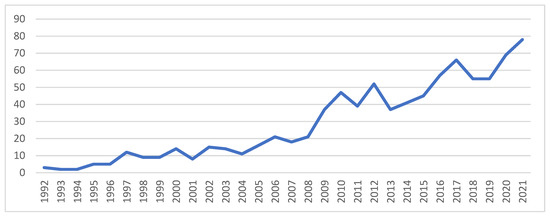
Figure 2.
Annual scientific production (1992–2021). Source: Elaborated by authors using data extracted from Scopus.
3.1.2. Leading Countries
The majority of research on asymmetric GARCH models took place in the United States of America, with 176 publications between 1992 and 2021. With 73 publications, India was the second highest contributor, followed by Australia with 72 scientific publications. Figure 3 shows the top countries that contributed to asymmetric GARCH models. The United States had the most citations (7277), followed by Australia (1437) and the United Kingdom (1072). A total of 506 citations were found for Indian publications. It is clear from this that developed countries have the highest numbers of citations, although emerging countries such as India make significant contributions to this field of study.
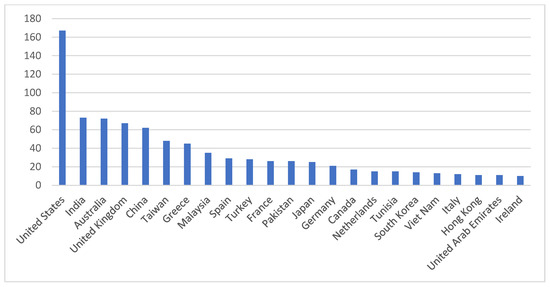
Figure 3.
Leading Countries. Source: Elaborated by authors using data extracted from Scopus.
3.1.3. Influential Authors
The top ten influential authors who contributed research articles in this domain (Table 2) can provide a good idea of who contributed significantly to the literature on asymmetric GARCH models. Engle R.F. is the most cited author, with 2796 citations across two papers on asymmetric GARCH. In 1993, V.K. Ng and R.F. Engle co-authored the paper “Measuring and Testing the Impact of News on Volatility”. The paper “All in the family: Nesting symmetric and asymmetric GARCH models” by Hentschel (1995) received a total of 1369 citations, followed by Campbell J.Y (1003) and Bollerslev T (719).
Table 2.
Influential Authors.
3.1.4. Impactful Journals
Publications in academic journals allow researchers and academicians to share new and useful ideas and knowledge. Researchers can choose the most appropriate and high-quality journals to share their insights by identifying the most impactful journals contributing to a particular field of study. Figure 4 depicts the most productive journals publishing research articles on asymmetric GARCH models. A total of 308 research articles were published in 33 journals during 1992–2021. Applied Financial Economics was the most productive journal, with 31 publications in this field of research. Applied Financial Economics mainly focuses on economics, econometrics, and finance. The second- and third-most productive journals were Energy Economics and Applied Economics with a total of 30 and 29 publications, respectively. In terms of citations, Energy Economics had the highest number of citations (2006), followed by the Journal of Econometrics (1630) and the Journal of Financial Economics (1388). Even though the most productive journal was Applied Financial Economics (31), in terms of total publications as well as total citations, we can conclude that Energy Economics was the most productive and impactful journal in the area of asymmetric GARCH modelling, with 2006 citations for 30 publications during this period.
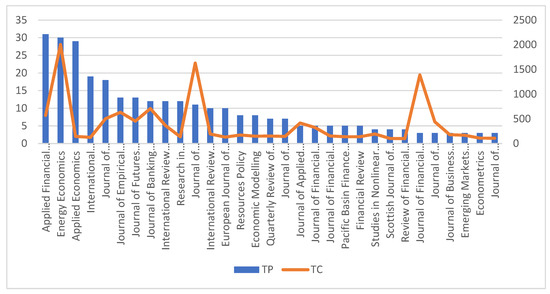
Figure 4.
The most impactful journals. Note: TP = Total Publications, TC = Total Citations. Source: Elaborated by authors using data extracted from Scopus.
This article performed ranking analysis by identifying the total number of publications (TP), total number of citations (TC), citations per publication (C/P), ABDC ranking, and H-index. The top 20 journals by number of citations are presented in Table 3. It is seen that only three journals (Energy Economics, Applied Financial Economics, Applied Economics) contributed more than 10% in terms of total publications on asymmetric GARCH models, and two journals (International Research Journal of Finance and Economics and Applied Economics Letters) contributed more than 5%. The top cited journals (Energy Economics and Journal of Econometrics) had the highest H-index. In terms of total citations per publication, the Journal of Econometrics was placed first (C/P = 148.18) as it had the least number of publications (11) with the highest number of citations for those papers.
Table 3.
Ranking of top 20 influential Journals.
3.1.5. Country Collaborations
An assessment of international collaboration based on co-authorship was carried out to understand how countries jointly contribute to the literature on asymmetric GARCH models. Co-authorship analysis by country looked at the strength of collaboration between different countries and provided researchers with a more in-depth understanding of the structure of countries’ contributions and collaborations in the related field (Phoong et al. 2022; Tandon et al. 2021). We set the minimum number of documents for a country in this study at four, as every one of the chosen countries had at least four publications. The top ten collaborative nations are listed in Table 4 in order of the strength of all links (Phoong et al. 2022). Among the top ten countries, the United States of America is ranked first in terms of total link strength (79) and published 167 research articles on asymmetric GARCH models in collaboration with other countries. The United Kingdom had the second-highest number of publications (46), followed by Australia and China with 37 and 35, respectively. In addition, in terms of citations, the United States, the United Kingdom, and Australia were ranked first, second, and third, respectively, indicating that researchers frequently cited papers co-authored by authors from these countries.
Table 4.
Country Collaborations.
We further provide network visualisation of country co-authorship to identify the main clusters among countries (Figure 5). The number of published documents in a nation is represented by the node size in the network visualisation. The number of documents published by a nation increases with node size. These countries could be divided into six clusters, each of which is represented by a different colour. Of the top 10 collaborating countries, the USA, the UK and Greece belong to cluster 3, and China, Spain, Taiwan, and the Netherlands are included in cluster 1. The extent of collaboration or co-authorship is determined by the thickness of the link between two countries. The network analysis confirmed that the extent of international collaboration between the USA and the UK in asymmetric GARCH model literature was relatively higher compared with other countries. In the case of India, authors from the United States, Pakistan, Spain, Bangladesh, Germany, and Saudi Arabia collaborated to contribute to this field of research.
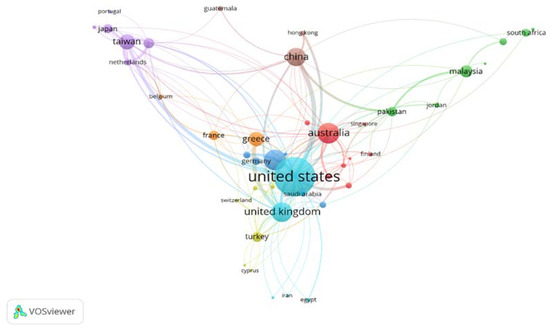
Figure 5.
Network visualisation of country collaborations. Source: Elaborated by authors using data extracted from Scopus.
Overlay visualisation of country collaboration was used to examine year-by-year progress in country collaboration. Figure 6 illustrates an overlay view of country co-authorship, with colour variations indicating the year the country began collaboration with other countries. As demonstrated in the picture, Singaporean authors started collaborating with authors from other nations in the early 2000s. Between 2005 and 2010, authors from the United States, Hong Kong, and Japan (light blue) began to work with other countries. Similarly, in late 2010, countries such as the United Kingdom, Australia, Belgium, the Netherlands, and Finland (sea blue colour) began publishing works on asymmetric GARCH models in conjunction with authors from other countries. Countries depicted in light green and yellow have most recently initiated international collaborations.
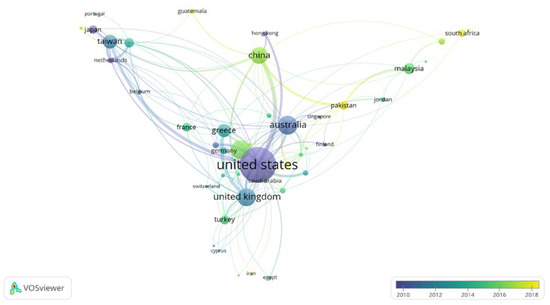
Figure 6.
Overlay visualisation of country collaborations. Source: Elaborated by authors using data extracted from Scopus.
3.1.6. Co-Occurrence of Author Keywords
We further looked at author keyword co-occurrence analysis to uncover the most important research topics in the field. In order to identify essential keyword occurrence in the literature on asymmetric GARCH models, we set the minimum occurrence at four. The top ten author keywords in terms of total link strength are shown in Table 5. Volatility (135) was the most frequently used author keyword, with a total link strength of 270. The keyword EGARCH, which had the second highest link strength of 262, also appeared 135 times. With a link strength of 256, the keyword GARCH was ranked third, appearing 114 times, followed by GARCH models and asymmetry. In addition to these, EGARCH models, the leverage effect, asymmetric GARCH, volatility spillover, and asymmetric volatility occurred more than 15 times. As seen in Figure 7, network mapping can also be used to display the occurrence of author keywords. The colours represent the clusters, and the size of the node reflects the frequency with which each keyword appeared in the asymmetric GARCH model literature.
Table 5.
Co-occurrence of author keyword.
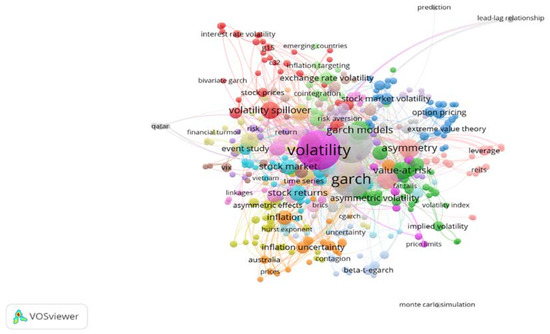
Figure 7.
Co-occurrence of author keywords. Source: Elaborated by authors using data extracted from Scopus.
3.1.7. Factor Analysis Exposing the Thematic Factors of Asymmetric GARCH Models
In accordance with Pattnaik et al.’s (2020) recommendations, we examined thematic variables using SPSS, using 40 starting themes that were published in at least five works on asymmetric GARCH models. The correlation matrix for asymmetric GARCH models was subjected to Principal Component Analysis, which produced significant KMO statistics, and Bartlett’s test of sphericity results, which confirmed the relevance of exploratory factor analysis.
The primary analysis indicated seven theme components, which together accounted for nearly 97% of the thematic variation, using Varimax rotation and Kaizer normalisation. By setting the absolute value below to 40, we could suppress small coefficients and prevent cross-loadings. Forty thematic items were loaded under four components. The communalities and loading of the theme items relative to their respective components are shown in Table 6 and Table 7, respectively. The themes were divided into four thematic components. The first component is the theme of financial modelling. The second component, titled “financial assets”, is the modelling of various financial asset characteristics. The third component is the modelling of financial time series characteristics centred on various financial markets. The fourth and final thematic component is the same in light of the financial crisis, including the recent COVID-19 crisis.
Table 6.
Communalities of asymmetric GARCH models themes.
Table 7.
Rotated Component Matrix and factor loadings of thematic components.
3.1.8. Bibliographic Coupling of Countries
Bibliographic coupling analysis reveals the similarities between two countries (Phoong et al. 2022). It shows how frequently countries share similar bibliographies, allowing us to discover publication similarities. The bibliographic coupling visualisation map could be displayed in a variety of colour and node patterns. The node size represents each country’s contribution, and different colours denote different clusters. Figure 8 depicts network visualisation of country clustering.
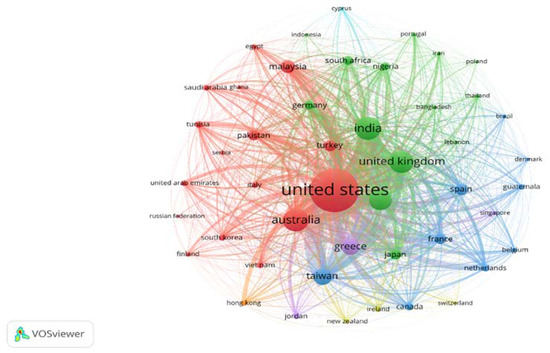
Figure 8.
Bibliographic coupling of countries. Source: Elaborated by authors using data extracted from Scopus.
3.1.9. Factors Influencing Citation: Correlation and Regression
Descriptive statistics, correlation analysis, and regression analysis of variables affecting the total citations (TC) of publications on the asymmetric GARCH model are shown in Table 8, Table 9 and Table 10. The dependent variable is Total Citations (TC), and the independent variables are LA (Length of the article), NA (Number of authors), AC (Authorship classification; single-authored or co-authored), SAA (Single Authored Articles), and M1, M2, M3 and M4, the models used (GARCH, EGARCH, TGARCH/GJR GARCH, or Other GARCH models).
Table 8.
Descriptive Statistics.
Table 9.
Correlation matrix of variables.
Table 10.
Regression analysis of variables.
The descriptive statistics show the mean and standard deviation of each factor. Each of the articles chosen for the regression obtained, on average, roughly 26 citations. The dependent variable, total citations, had a mean value of 22.42 with a variation of 62.54. The mean of independent variables length of the article (LA) and number of authors (NA) were 12 and 2.92, respectively, with variations of 5.43 and 0.97, respectively. The majority of articles shortlisted used the GARCH and EGARCH models for forecasting the characteristics of time series data (mean = 0.82 for GARCH and 0.83 for EGARCH).
The magnitude and direction of the relationship between the dependent and independent variables are presented in the correlation matrix. It is clear from the table that all independent variables had a significant positive relationship with the dependent variable (TC). Furthermore, regression analysis confirmed this relationship.
4. Systematic Review of Highly Cited Articles and Critical Evaluation
In this section, we conducted a systematic review of highly cited articles in this domain. This may give researchers a general idea of the current trend in this field of research and aid them in their investigation so that they can significantly contribute to the literature by filling a gap.
The top research articles in terms of citations are presented in Table 11, along with their major research focus, the GARCH model used, and research contributions. An article’s impact is significantly influenced by its total number of citations because a work with high citations is generally considered to be high-quality work. Among those articles, the most cited article is “Measuring and Testing the Impact of News on Volatility” by Engle and Ng (1993), with a total of 2012 citations. Using daily Japanese stock return data, they compared and estimated a number of new and old ARCH models, including a partially nonparametric model. According to their conclusions, Glosten, Jagannathan, and Runkle’s model was the most effective one. Although there is evidence that the conditional variance implied by EGARCH has too much variability, EGARCH can also capture the majority of asymmetry. Additionally, their study highlighted the asymmetry of the volatility response to news by presenting new diagnostic tests. Concurrently, “No news is good news. An asymmetric model of changing volatility in stock returns”, published in The Journal of Financial Economics by Campbell and Hentschel (1992), also reported a high number of citations (1003). To simulate the volatility feedback effect in U.S. monthly and daily stock returns over the period 1926–1988, they used a QGARCH model.
Table 11.
Systematic review of highly cited papers.
“Modeling and pricing long memory in stock market volatility” by Bollerslev and Mikkelsen (1996), published in the Journal of Econometrics, had 628 citations. In order to characterise long-run dependencies in US stock market volatility, they used a new class of fractionally integrated GARCH (FIGARCH) and Exponential GARCH (EGARCH) models. “Asymmetric volatility transmission in international stock markets” by Koutmos and Booth (1995) ranked the fourth most cited article (404), published in the Journal of International Money and Finance. They modelled the asymmetric effect of good news and bad news on volatility transmission using an extended multivariate EGARCH model. This was followed by Hentschel (1995), “All in the family: Nesting symmetric and asymmetric GARCH models” with 366 citations. Using daily data on U.S. stock returns, they developed a family of the most common symmetric and asymmetric GARCH models.
By evaluating the frequency of GARCH models used to estimate and forecast the characteristics of time series data (Figure 9), we found that most of the highly cited articles used Exponential GARCH (EGARCH) (Nelson 1991), followed by GJR-GARCH (Glosten et al. 1993). Furthermore, many of the studies applied APARCH/AGARCH, NGARCH, and TGARCH models along with the EGARCH model. Many studies compared the forecasting accuracy of GARCH models and recorded divergent opinions on the best fitting model to capture the asymmetric/leverage effect. Some authors (Koutmos and Booth 1995; Hentschel 1995; Braun et al. 1995; Booth et al. 1997; Kanas 2000; Heynen et al. 2016; Alberg et al. 2008; McAleer et al. 2007) proposed that EGARCH was the best fitting model. In contradiction to this, (Lee et al. 2001) suggested that EGARCH did not provide better estimation than the GARCH model.
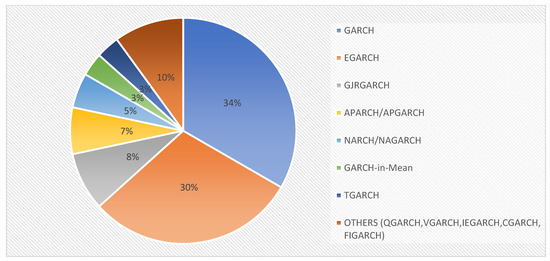
Figure 9.
Frequency of GARCH models used. Source: Authors’ calculation.
A Critical Evaluation of GARCH Models
Critical analysis is required in order to summarise the works in this field of research and to identify research gaps (Virbickaite et al. 2015; Cochrane 1991). In order to determine the superiority of more sophisticated and complicated models, this section critically evaluates the primary forecasting methodologies. Its primary goal is to provide evidence in support of an argument: When evaluating the volatility of returns on groups of stocks with thousands of data points, GARCH is the best suitable model to employ; when the GARCH model is compared to any other alternative model, the model’s suitability is assessed from a single direction based on the accuracy of the volatility forecast it provides. There have been several improvements made to this method for modelling conditional volatility since the introduction of Autoregressive Conditional Heteroscedasticity (ARCH) by Engle (1982) and its generalization by (Bollerslev 1987). Both ARCH and GARCH models fail to capture the asymmetric effect in conditional volatility as their distributions are symmetric. To overcome this, various nonlinear/asymmetric GARCH models were introduced: exponential GARCH by Nelson (1991), threshold GARCH by (Zakoian 1994) GJR GARCH by Glosten et al. (1993), etc.
On critically examining the highly cited papers in this field, most of the studies used EGARCH for modelling the asymmetric volatility effect, while when comparing GARCH models, many of the authors proposed that EGARCH was the best one to capture the asymmetric response of stock returns to negative and positive news/information (Koutmos and Booth 1995; Hentschel 1995; Braun et al. 1995; Booth et al. 1997; McAleer et al. 2007; Alberg et al. 2008). At the same time, there are contradicting arguments (Day and Lewis 1992; Sadorsky 2006; Mohammadi and Su 2010; Engle and Ng 1993) that other models, i.e., GJR GARCH, APARCH, and TGARCH, perform better than the EGARCH model. Some authors (Day and Lewis 1992; Huang and Zhu 2004) propose that no asymmetric GARCH models are better than symmetric GARCH models. Still, the issue regarding a better model is debatable. The transitions from ARIMA to ARCH, ARCH to GARCH, and GARCH to nonlinear GARCH models have highlighted the need for methodological advancements in GARCH modelling to address the shortcomings of earlier models. Understanding of the causes of volatility in financial time series is not considerably improved by the ARCH model. It merely offers a mechanical approach for describing the behaviour of conditional variance. Furthermore, to accurately represent the volatility process of an asset return, the ARCH model requires a large number of parameters. The GARCH model, in contrast to ARCH, only has three parameters and a finite number of squared roots that might affect the current conditional variance. However, the GARCH model cannot capture asymmetric or leverage effects in the conditional variance. Further enhancements can be seen with nonlinear extensions, such as EGARCH, TGARCH, GJR GARCH, QGARCH, CGARCH, etc.
Through critically evaluating these papers, studies revealed the “best” or “worst” volatility forecasting models in different research scenarios. When examining the studies that propose that the EGARCH model is best, it was found that most of these studies focused on modelling the stock market’s volatility. Similarly, studies proposing a best model other than EGARCH focused on other financial markets, i.e., the derivatives market. The contradiction in the “best fitting model” is due to changes in distribution, study period, data type, and even modelling software. In order to quantify the benefits of some models over others, it is necessary to perform more empirical research in this field.
5. Recommendations for Future Research
In this study, we identified the developments and trend in asymmetric GARCH models in the finance literature. Through a systematic review of highly cited research papers, we came to know that the EGARCH model is the most widely used asymmetric GARCH model. Similarly, the accuracy of the EGARCH model to estimate and forecast asymmetric/leverage effects in time series data was confirmed by many authors via comparison with other GARCH models.
In terms of future research opportunities, the extensive literature review using bibliometric analysis pointed to some key future research directions. Firstly, the present study theoretically contributed to the asymmetric GARCH literature by showing the forecasting accuracy of GARCH models. Thus, future research should focus on empirical verification of asymmetric GARCH models to confirm that the EGARCH model is the best to capture asymmetric effects in time series data from the lens of different asset classes as well as with regard to different countries. In addition to this, previous academic literature on asymmetric GARCH modelling utilised low-frequency data, i.e., daily, monthly, and annual data. Researchers’ interest in intraday trading increased as a result of the rise of algorithmic trading in recent years. However, there are not many studies that use high-frequency data to focus on short-term asymmetric volatility. As a result, investigations in this field should concentrate on modelling asymmetric volatility using high-frequency data. Similarly, researchers could also investigate if the contradiction in the best-fitting asymmetric GARCH model is brought on by the software or the properties of the distribution.
The majority of existing studies modelled asymmetric volatility/leverage effects in the stock market, even though investors are concerned with not only the stock market but also other financial markets. In this regard, future studies should focus on modelling the asymmetric volatility effect in different financial markets, which will help investors reduce their risk through portfolio diversification. Most of the existing studies used EGARCH, APARCH, QGARCH, TGARCH, and GJR GARCH in modelling the asymmetric effect in conditional volatility. Various extensions of asymmetric GARCH models, including multivariate GARCH models, are used as a result of methodological developments in econometric modelling, but research studies utilising these extended models are very few. Therefore, a Systematic Literature Review could be conducted to critically evaluate each asymmetric GARCH model and unveil the research gap in this field more specifically. Thus, future works should utilise multivariate GARCH models in modelling time series data and should compare the forecasting accuracy of univariate and multivariate GARCH models. Furthermore, this work is based on bibliometric analysis, which could give a comprehensive summary of literature on asymmetric GARCH modelling.
6. Discussion and Conclusions
Using bibliometric analysis, this study addressed the research trend, applications, and forecasting performance of the asymmetric GARCH model in literature between 1992–2021. Bibliometric analysis using 856 articles extracted from the Scopus database showed the evolution and trend in this field of research. Asymmetric GARCH models gained popularity among academics in recent decades, particularly after 2008. Unsurprisingly, there were 202 publications from 2019 to 2021 (the period of the COVID-19 pandemic). The trend in scientific production of asymmetric GARCH models became visible and clear over the years. Significantly contributing 176 publications with the highest number of citations between 1992 and 2021, the USA was found to be the leading country contributing to asymmetric GARCH model literature. Engle R.F. was the most cited author, with 2796 citations across two papers, and Applied Financial Economics was the most impactful journal having 31 publications recorded with 568 citations, followed by Energy Economics and Applied Economics.
The most cited article was “Measuring and Testing the Impact of News on Volatility” by Engle and Ng (1993), with a total of 2012 citations, published in the Journal of Finance. An assessment of international collaboration based on co-authorship was carried out to understand how countries jointly contribute to the literature on asymmetric GARCH models, and it was found that the United States of America was ranked first in terms of total link strength (79), with 167 research articles on asymmetric GARCH models in collaboration with authors from other countries. In the case of India, authors from the United States, Pakistan, Spain, Bangladesh, Germany, and Saudi Arabia collaborated with Indian authors in this field of research. Volatility and EGARCH were the most popular author keywords. Further analysis using factor-analysis study found four main thematic components: studies focused on forecasting models, financial assets, financial markets, and financial crises. Using correlation and regression, we found factors influencing total citations. Given the number of countries that collaborated with the USA, the USA had the greatest impact on the literature on asymmetric GARCH models. Through a systematic review, we learned that most of the highly cited articles used the EGARCH model to capture the asymmetric effect. Similarly, most authors suggested that the EGRACH model is the best fitting model among the various asymmetric GARCH models. In addition to this, many authors significantly contributed to the literature by modelling the asymmetric characteristics of time series data, comparing GARCH models, and expanding their theoretical background. Theoretical contributions were made by (Teräsvirta 2009; Virbickaite et al. 2015; Hentschel 1995; Lundbergh and Teräsvirta 2002; Bauwens et al. 2006; Charles and Darné 2019a; Alberg et al. 2008; Lee 2017; Charles and Darné 2019b; Naik and Reddy 2021; Srinivasan and Ibrahim 2010; Aliyev et al. 2020) modelled and compared different GARCH models.
Our study has some significant academic and managerial implications. In terms of academic implications, this study provides some important insights regarding gradual progression, prolific authors, impactful journals, and important studies in asymmetric GARCH literature. Apart from this, the study thoroughly reviewed highly cited papers to identify the frequently used GARCH models and the best model proposed by prominent authors in this field. This study significantly advances this field of research by highlighting the development and current structure of asymmetric GARCH models in the estimation and forecasting of asymmetric effects in the conditional volatility of time series data. From a managerial perspective, our study attempts to present a thorough grasp of the idea of asymmetric volatility that can aid managers, investors, and other market participants in comprehending the concept while making investment decisions and diversifying portfolios. Furthermore, it will help econometricians improve their GARCH modelling methodology.
This study is subject to some limitations. Firstly, the sources that were used to extract the datasets have an impact on the accuracy of the results. The datasets for this study were taken from the Scopus database. However, some of the top research on asymmetric GARCH models might not have been included due to the use of a single scientific database. To obtain a significant amount of literature on asymmetric GARCH models, other well-known databases, such as Web of Science, could be added to Scopus. It might improve the generalizability, accuracy, and reliability of the findings. Furthermore, this study covered the literature on asymmetric GARCH models from 1992 to 2021, as this study utilized a single database. There may be studies significantly contributing to this literature before 1992.
Author Contributions
All authors contributed equally to this study. All authors have read and agreed to the published version of the manuscript.
Funding
The authors received no funding for this project.
Data Availability Statement
The datasets used and/or analyzed during the current study are available from the corresponding author on reasonable request.
Conflicts of Interest
The authors declare no conflict of interest.
References
- Alberg, Dima, Haim Shalit, and Rami Yosef. 2008. Estimating stock market volatility using asymmetric GARCH models. Applied Financial Economics 18: 1201–8. [Google Scholar] [CrossRef]
- Aliyev, Fuzuli, Richard Ajayi, and Nijat Gasim. 2020. Modelling asymmetric market volatility with univariate GARCH models: Evidence from Nasdaq-100. The Journal of Economic Asymmetries 22: e00167. [Google Scholar] [CrossRef]
- Baillie, Richard T., and Tim Bollerslev. 1989. Common Stochastic Trends in a System of Exchange Rates. The Journal of Finance 44: 167–81. [Google Scholar] [CrossRef]
- Bauwens, Luc, Sébastien Laurent, and Jeroen VK Rombouts. 2006. Multivariate GARCH models: A survey. Journal of Applied Econometrics 21: 79–109. [Google Scholar] [CrossRef]
- Black, Fischer. 1976. Studies of Stock Market Volatility Changes. In Proceedings of the 1976 Meeting of the Business and Economic Statistics Section. Washington, DC: American Statistical Association. [Google Scholar]
- Bollerslev, Tim, and Hans Ole Mikkelsen. 1996. Modeling and pricing long memory in stock market volatility. Journal of Econometrics 73: 151–84. [Google Scholar] [CrossRef]
- Bollerslev, Tim. 1986. Generalized autoregressive conditional heteroskedasticity. Journal of Econometrics 31: 307–27. [Google Scholar] [CrossRef]
- Bollerslev, Tim. 1987. A Conditionally Heteroskedastic Time Series Model for Speculative Prices and Rates of Return. The Review of Economics and Statistics 69: 542. [Google Scholar] [CrossRef]
- Booth, G. Geoffrey, Teppo Martikainen, and Yiuman Tse. 1997. Price and volatility spillovers in Scandinavian stock markets. Journal of Banking & Finance 21: 811–23. [Google Scholar]
- Braun, Phillip A., Daniel B. Nelson, and Alain M. Sunier. 1995. Good news, bad news, volatility, and betas. The Journal of Finance 50: 1575–603. [Google Scholar] [CrossRef]
- Campbell, John Y., and Ludger Hentschel. 1992. No news is good news. An asymmetric model of changing volatility in stock returns. Journal of Financial Economics 31: 281–318. [Google Scholar] [CrossRef]
- Cao, Charles Q., and Ruey S. Tsay. 1992. Nonlinear time-series analysis of stock volatilities. Journal of Applied Econometrics 7: S165–85. [Google Scholar] [CrossRef]
- Charles, Amélie, and Olivier Darné. 2019a. The accuracy of asymmetric GARCH model estimation. International Economics 157: 179–202. [Google Scholar] [CrossRef]
- Charles, Amélie, and Olivier Darné. 2019b. Volatility estimation for Bitcoin: Replication and robustness. International Economics 157: 23–32. [Google Scholar] [CrossRef]
- Christie, Andrew A. 1982. The stochastic behavior of common stock variances. Value, leverage, and interest rate effects. Journal of Financial Economics 10: 407–32. [Google Scholar] [CrossRef]
- Cochrane, John H. 1991. A critique of the application of unit root tests. Journal of Economic Dynamics and Control 15: 275–84. [Google Scholar] [CrossRef]
- Day, Theodore E., and Craig M. Lewis. 1992. Stock market volatility and the information content of stock index options. Journal of Econometrics 52: 267–87. [Google Scholar] [CrossRef]
- Ding, Zhuanxin, Clive W. J. Granger, and Robert F. Engle. 1993. A long memory property of stock market returns and a new model. Journal of Empirical Finance 1: 83–106. [Google Scholar] [CrossRef]
- Engle, Robert F. 1982. Autoregressive Conditional Heteroscedasticity with Estimates of the Variance of United Kingdom Inflation. Econometrica 50: 987. [Google Scholar] [CrossRef]
- Engle, Robert F., and Victor K. Ng. 1993. Measuring and Testing the Impact of News on Volatility. The Journal of Finance 48: 1749–78. [Google Scholar] [CrossRef]
- French, Kenneth R., G. William Schwert, and Robert F. Stambaugh. 1987. Expected stock returns and volatility. Journal of Financial Economics 19: 3–29. [Google Scholar] [CrossRef]
- Glosten, Lawrence R., Ravi Jagannathan, and David E. Runkle. 1993. On the Relation between the Expected Value and the Volatility of the Nominal Excess Return on Stocks. The Journal of Finance 48: 1779–801. [Google Scholar] [CrossRef]
- Gökbulut, R. İlker, and Mehmet Pekkaya. 2014. Estimating and Forecasting Volatility of Financial Markets Using Asymmetric GARCH Models: An Application on Turkish Financial Markets. International Journal of Economics and Finance 6: 23–35. [Google Scholar] [CrossRef]
- Goodell, John W., Satish Kumar, Weng Marc Lim, and Debidutta Pattnaik. 2021. Artificial intelligence and machine learning in finance: Identifying foundations, themes, and research clusters from bibliometric analysis. Journal of Behavioral and Experimental Finance 32: 100577. [Google Scholar] [CrossRef]
- Hammoudeh, Shawkat, and Yuan Yuan. 2008. Metal volatility in presence of oil and interest rate shocks. Energy Economics 30: 606–20. [Google Scholar] [CrossRef]
- Hentschel, Ludger. 1995. All in the family Nesting symmetric and asymmetric GARCH models. Journal of Financial Economics 39: 71–104. [Google Scholar] [CrossRef]
- Heynen, Ronald, Angelien Kemna, and Ton Vorst. 2016. Analysis of the Term Structure of Implied Volatilities. The Journal of Financial and Quantitative Analysis 29: 31–56. [Google Scholar] [CrossRef]
- Huang, Wei-Chiao, and Yuanlei Zhu. 2004. Are shocks asymmetric to volatility of Chinese stock markets? Review of Pacific Basin Financial Markets and Policies 7: 379–95. [Google Scholar] [CrossRef]
- Jain, Jinesh, Nidhi Walia, Simarjeet Singh, and Esha Jain. 2021. Mapping the field of behavioural biases: A literature review using bibliometric analysis. Management Review Quarterly vol. 1: 1–33. [Google Scholar] [CrossRef]
- Kanas, Angelos. 2000. Volatility Spillovers Between Stock Returns and Exchange Rate Changes: International Evidence. Journal of Business Finance & Accounting 27: 447–67. [Google Scholar]
- Koutmos, Gregory, and G. Geoffrey Booth. 1995a. Asymmetric volatility transmission in international stock markets. Journal of International Money and Finance 14: 747–62. [Google Scholar] [CrossRef]
- Narayan, Paresh Kumar, Seema Narayan, and Arti Prasad. 2008. Understanding the oil price-exchange rate nexus for the Fiji islands. Energy Economics 30: 2686–96. [Google Scholar] [CrossRef]
- Lee, Cheng F., Gong-meng Chen, and Oliver M. Rui. 2001. Stock returns and volatility on China’s stock markets. Journal of Financial Research 24: 523–43. [Google Scholar] [CrossRef]
- Lee, Hojin. 2017. Forecasting Performance of Asymmetric GARCH Stock Market Volatility Models. SSRN Electronic Journal 13: 109–43. [Google Scholar] [CrossRef]
- Lundbergh, Stefan, and Timo Teräsvirta. 2002. Evaluating GARCH models. Journal of Econometrics 110: 417–35. [Google Scholar] [CrossRef]
- Maqsood, Arfa, Suboohi Safdar, Rafia Shafi, and Ntato Jeremiah Lelit. 2013. Modeling Stock Market Volatility Using GARCH Models: A Case Study of Nairobi Securities Exchange (NSE). Open Journal of Statistics 7: 369–81. [Google Scholar] [CrossRef]
- McAleer, Michael, Felix Chan, and Dora Marinova. 2007. An econometric analysis of asymmetric volatility: Theory and application to patents. Journal of Econometrics 139: 259–84. [Google Scholar] [CrossRef]
- Mohammadi, Hassan, and Lixian Su. 2010. International evidence on crude oil price dynamics: Applications of ARIMA-GARCH models. Energy Economics 32: 1001–8. [Google Scholar] [CrossRef]
- Naik, Maithili S., and Y. V. Reddy. 2021. India VIX and forecasting ability of symmetric and asymmetric GARCH models. Asian Economic and Financial Review 11: 252–262. [Google Scholar] [CrossRef]
- Nelson, Daniel B. 1991. Conditional Heteroskedasticity in Asset Returns: A New Approach. Econometrica 59: 347. [Google Scholar] [CrossRef]
- Pattnaik, Debidutta, Mohammad Kabir Hassan, Satish Kumar, and Justin Paul. 2020. Trade credit research before and after the global financial crisis of 2008—A bibliometric overview. Research in International Business and Finance 54: 101287. [Google Scholar] [CrossRef]
- Phoong, Seuk Wai, Seuk Yen Phoong, and Shi Ling Khek. 2022. Systematic Literature Review With Bibliometric Analysis on Markov Switching Model: Methods and Applications. SAGE Open 12: 21582440221093062. [Google Scholar] [CrossRef]
- Sadorsky, Perry. 2006. Modeling and forecasting petroleum futures volatility. Energy Economics 28: 467–88. [Google Scholar] [CrossRef]
- Shahateet, Mohammed. 2019. Testing the linkages of Arab stock markets: A multivariate GARCH approach. Investment Management and Financial Innovations 16: 192–204. [Google Scholar] [CrossRef]
- Srinivasan, P., and P. Ibrahim. 2010. Forecasting Stock Market Volatility of Bse-30 Index Using Garch Models. Asia Pacific Business Review 6: 47–60. [Google Scholar] [CrossRef]
- Tandon, Anushree, Puneet Kaur, Matti Mäntymäki, and Amandeep Dhir. 2021. Blockchain applications in management: A bibliometric analysis and literature review. Technological Forecasting and Social Change 166: 120649. [Google Scholar] [CrossRef]
- Teräsvirta, Timo. 2009. An Introduction to Univariate GARCH Models. In Handbook of Financial Time Series. Edited by Thomas V. Mikosch, Jens-Peter Kreiß, Richard A. Davis and Torben Gustav Andersen. Berlin and Heidelberg: Springer. [Google Scholar] [CrossRef]
- Tse, Yiuman. 1999. Price discovery and volatility spillovers in the DJIA index and futures markets. Journal of Futures Markets 19: 911–30. [Google Scholar] [CrossRef]
- Virbickaite, Audrone, M. Concepción Ausín, and Pedro Galeano. 2015. Bayesian inference methods for univariate and multivariate GARCH models: A survey. Journal of Economic Surveys 29: 76–96. [Google Scholar] [CrossRef]
- Zakoian, Jean-Michel. 1994. Threshold heteroskedastic models. Journal of Economic Dynamics and Control 18: 931–55. [Google Scholar] [CrossRef]
Publisher’s Note: MDPI stays neutral with regard to jurisdictional claims in published maps and institutional affiliations. |
© 2022 by the authors. Licensee MDPI, Basel, Switzerland. This article is an open access article distributed under the terms and conditions of the Creative Commons Attribution (CC BY) license (https://creativecommons.org/licenses/by/4.0/).