
Forecasting the Price of the Cryptocurrency Using Linear and Nonlinear Error Correction Model


Abstract
:1. Introduction
2. Description of Data
3. Econometrical Methods
4. Data Analysis
5. Conclusions
Author Contributions
Funding
Conflicts of Interest
References
- Bansal, Gaurav. 2021. Build Error Correction Models. R Package ‘ecm’. Vienna: Foundation for Statistical Computing. [Google Scholar]
- Chang, Le, and Yanlin Shi. 2020. Does Bitcoin dominate the price discovery of the Cryptocurrencies market? A time-varying information share analysis. Operations Research Letters 48: 641–45. [Google Scholar] [CrossRef]
- Diebold, Francis X., and Kamil Yilmaz. 2012. Better to give than to receive predictive directional measurement of volatility spillovers. International Journal of Forecasting 28: 57–66. [Google Scholar] [CrossRef] [Green Version]
- Georgoula, Ifigeneia, Demitrios Pournarakis, Christos Bilanakos, Dionisios Sotiropoulos, and George M. Giaglis. 2015. Using Time-Series and Sentiment Analysis to Detect the Determinants of Bitcoin Prices. Paper presented at the 2015 Mediterranean Conference on Information Systems, Samos, Greece, October 3–5. [Google Scholar]
- Giudici, Paolo, and Paolo Pagnottoni. 2020. Vector error correction models to measure connectedness of Bitcoin exchange markets. Applied Stochastic Models in Business and Industry 36: 95–109. [Google Scholar] [CrossRef] [Green Version]
- Goczek, Łukasz, and Ivan Skliarov. 2019. What drives the Bitcoin price? A factor augmented error correction mechanism investigation. Applied Economics 51: 6393–410. [Google Scholar] [CrossRef]
- Granger, Clive W. J. 1969. Investigating Causal Relations by Econometric Models and Cross-Spectral Methods. Econometrica 37: 424–38. [Google Scholar] [CrossRef]
- Haffar, Adlane, and Eric Le Fur. 2021. Structural vector error correction modelling of Bitcoin price. The Quarterly Review of Economics and Finance 80: 170–78. [Google Scholar] [CrossRef]
- Hakim das Neves, Rodrigo. 2020. Bitcoin pricing: Impact of attractiveness variables. Financial Innovation 6: 1–18. [Google Scholar] [CrossRef]
- Hyndman, Rob, George Athanasopoulos, Chrisoph Bergmeir, Gabriel Caceres, Leanne Chhay, Mitchell O’Hara-Wild, Fotios Petropoulos, Slava Razbash, Earo Wang, Farah Yasmeen, and et al. 2021. Forecast: Forecasting Functions for Time Series and Linear Models. Vienna: Foundation for Statistical Computing. [Google Scholar]
- Ibrahim, Ahmed, Rasha Kashef, Menglu Li, Esteban Valencia, and Eric Huang. 2020. Bitcoin Network Mechanics: Forecasting the BTC Closing Price Using Vector Auto-Regression Models Based on Endogenous and Exogenous Feature Variables. Journal of Risk and Financial Management 13: 189. [Google Scholar] [CrossRef]
- Kapar, Burcu, and Jose Olmo. 2020. Analysis of Bitcoin prices using market and sentiment variables. The World Economy 44: 45–63. [Google Scholar] [CrossRef]
- Keilbar, Georg, and Yanfen Zhang. 2021. On cointegration and cryptocurrency dynamics. Digital Finance 3: 1–23. [Google Scholar] [CrossRef]
- Kwapień, Jarosław, Marcin Wątorek, and Stanisław Drożdż. 2021. Cryptocurrency Market Consolidation in 2020–2021. Entropy 23: 1674. [Google Scholar] [CrossRef] [PubMed]
- Liang, Huan. 2021. Application of Error Correction model with monetary function factors in the return of bitcoin. Journal of Physics: Conference Series 1941: 012058. [Google Scholar] [CrossRef]
- Miller, Dante, and Jong-Min Kim. 2021. Univariate and Multivariate Machine Learning Forecasting Models on the Price Returns of Cryptocurrencies. Journal of Risk and Financial Management 14: 486. [Google Scholar] [CrossRef]
- Shaub, David, and Peter Ellis. 2020. Convenient Functions for Ensemble Time Series Forecasts. R Package ‘forecastHybrid’. Vienna: Foundation for Statistical Computing. [Google Scholar]
- Szetela, Beata, Grzegorz Mentel, Yuriy Bilan, and Urszula Mentel. 2021. The relationship between trend and volume on the bitcoin market. Eurasian Economic Review 11: 25–42. [Google Scholar] [CrossRef]
- Wang, Junpeng, Yubo Xue, and Minghao Liu. 2016. An Analysis of Bitcoin Price Based on VEC Model. Paper presented at the 2016 International Conference on Economics and Management Innovations, Beijing, China, July 9–10. [Google Scholar]
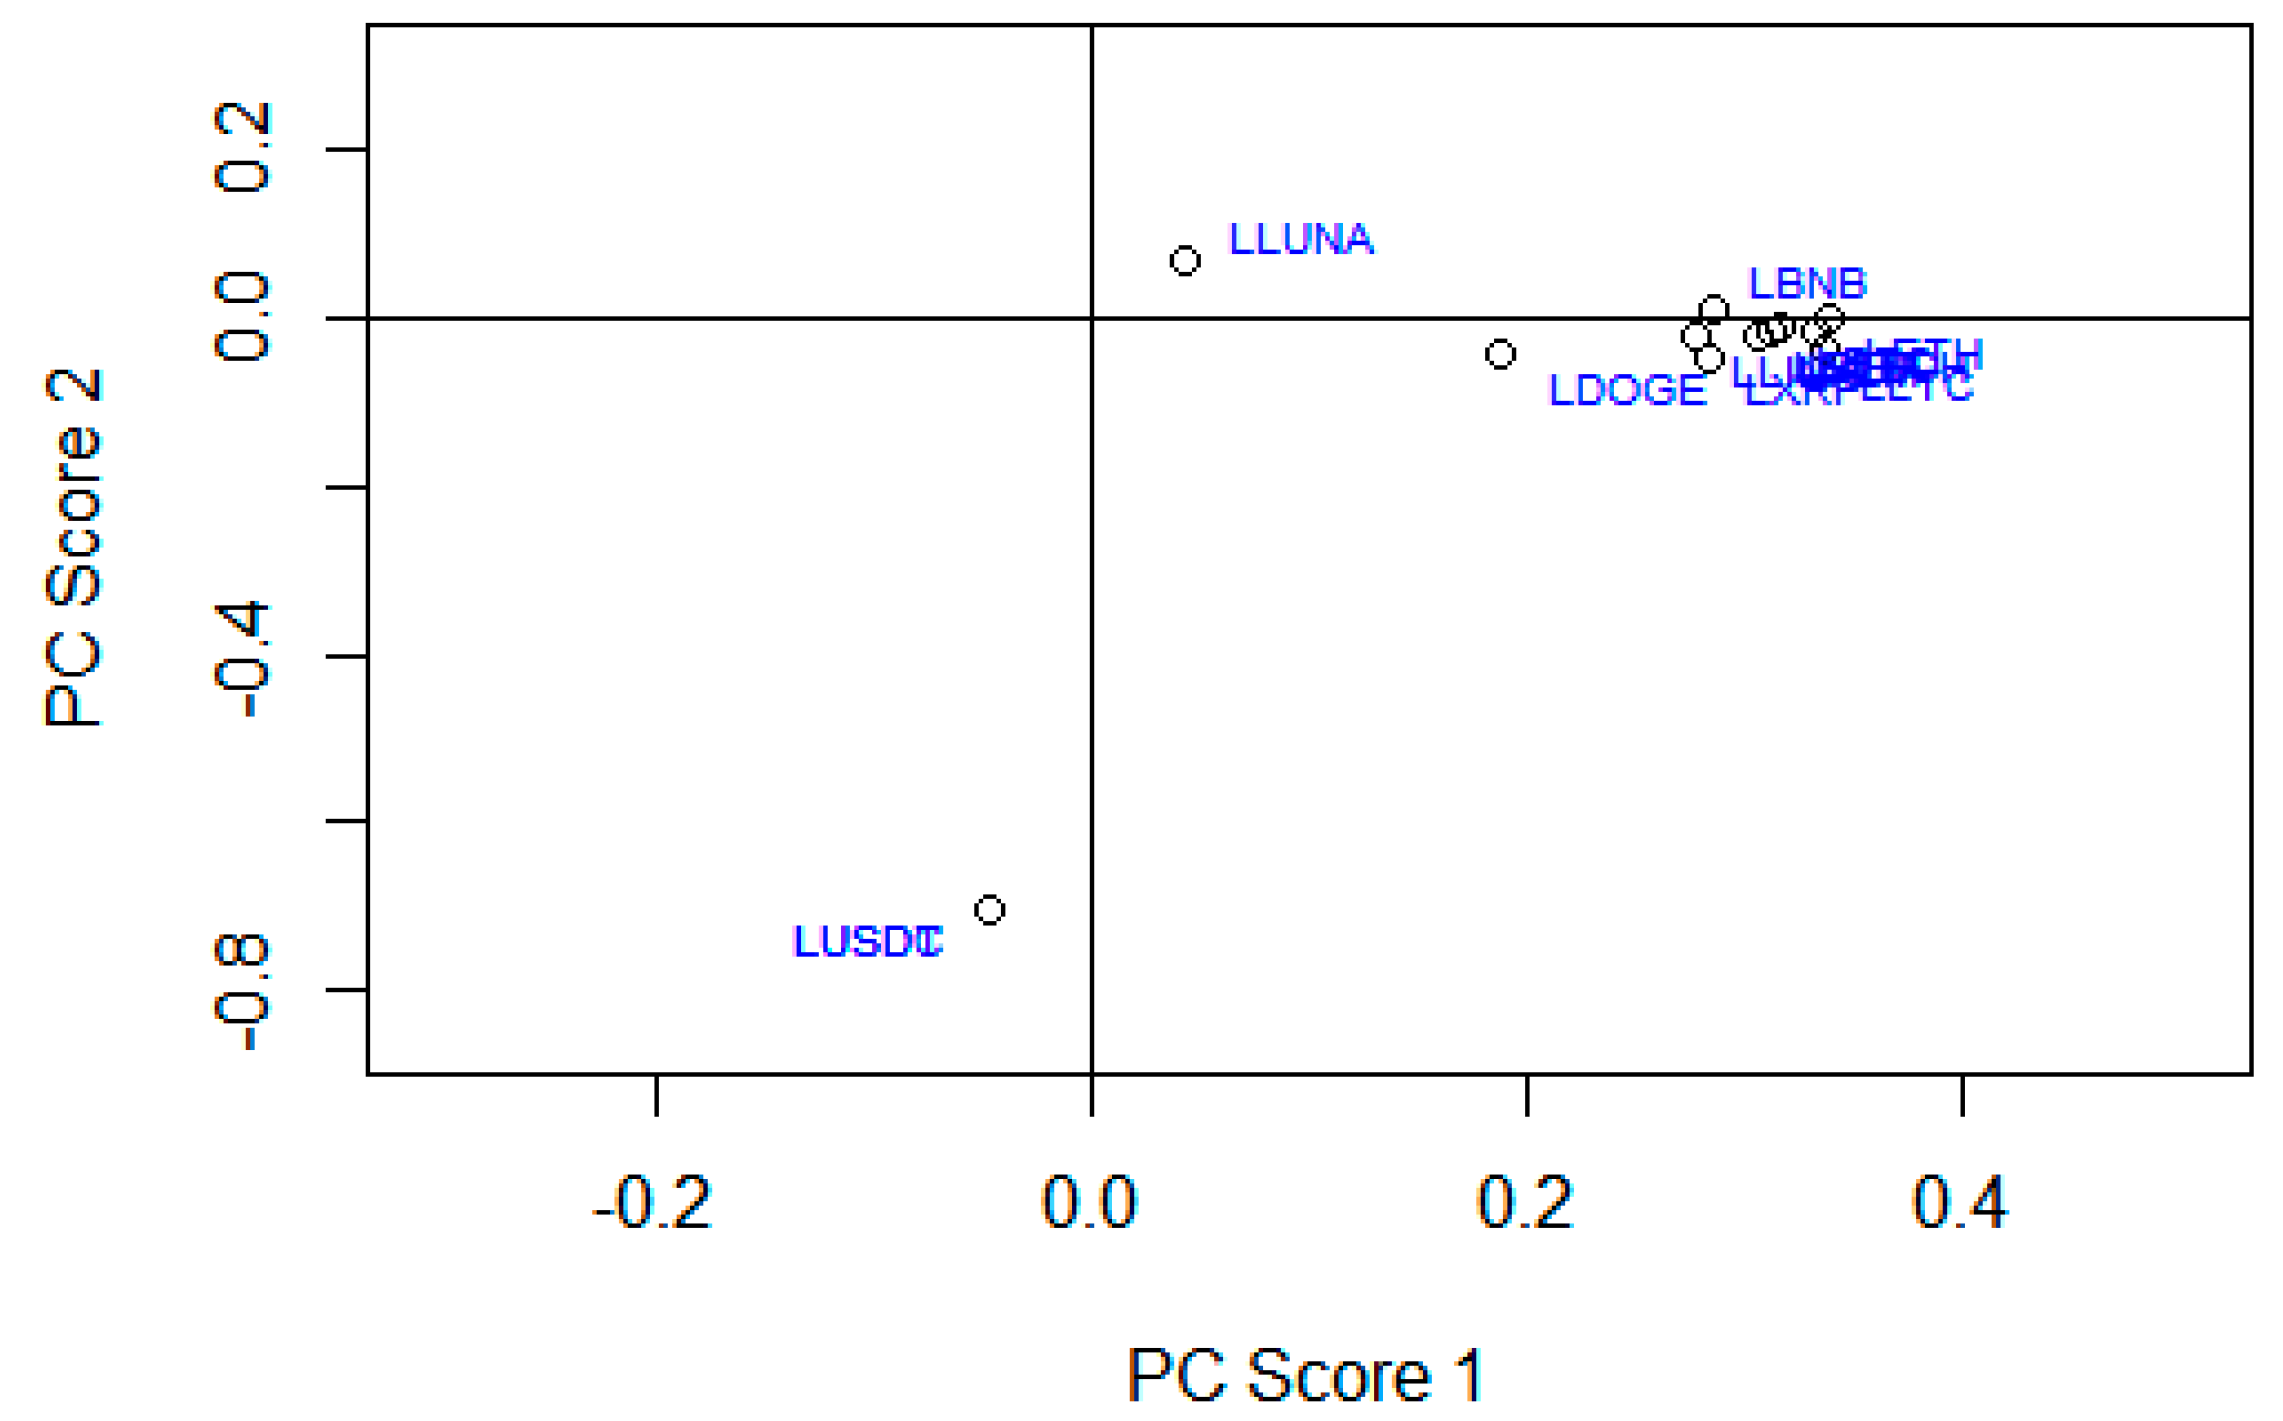
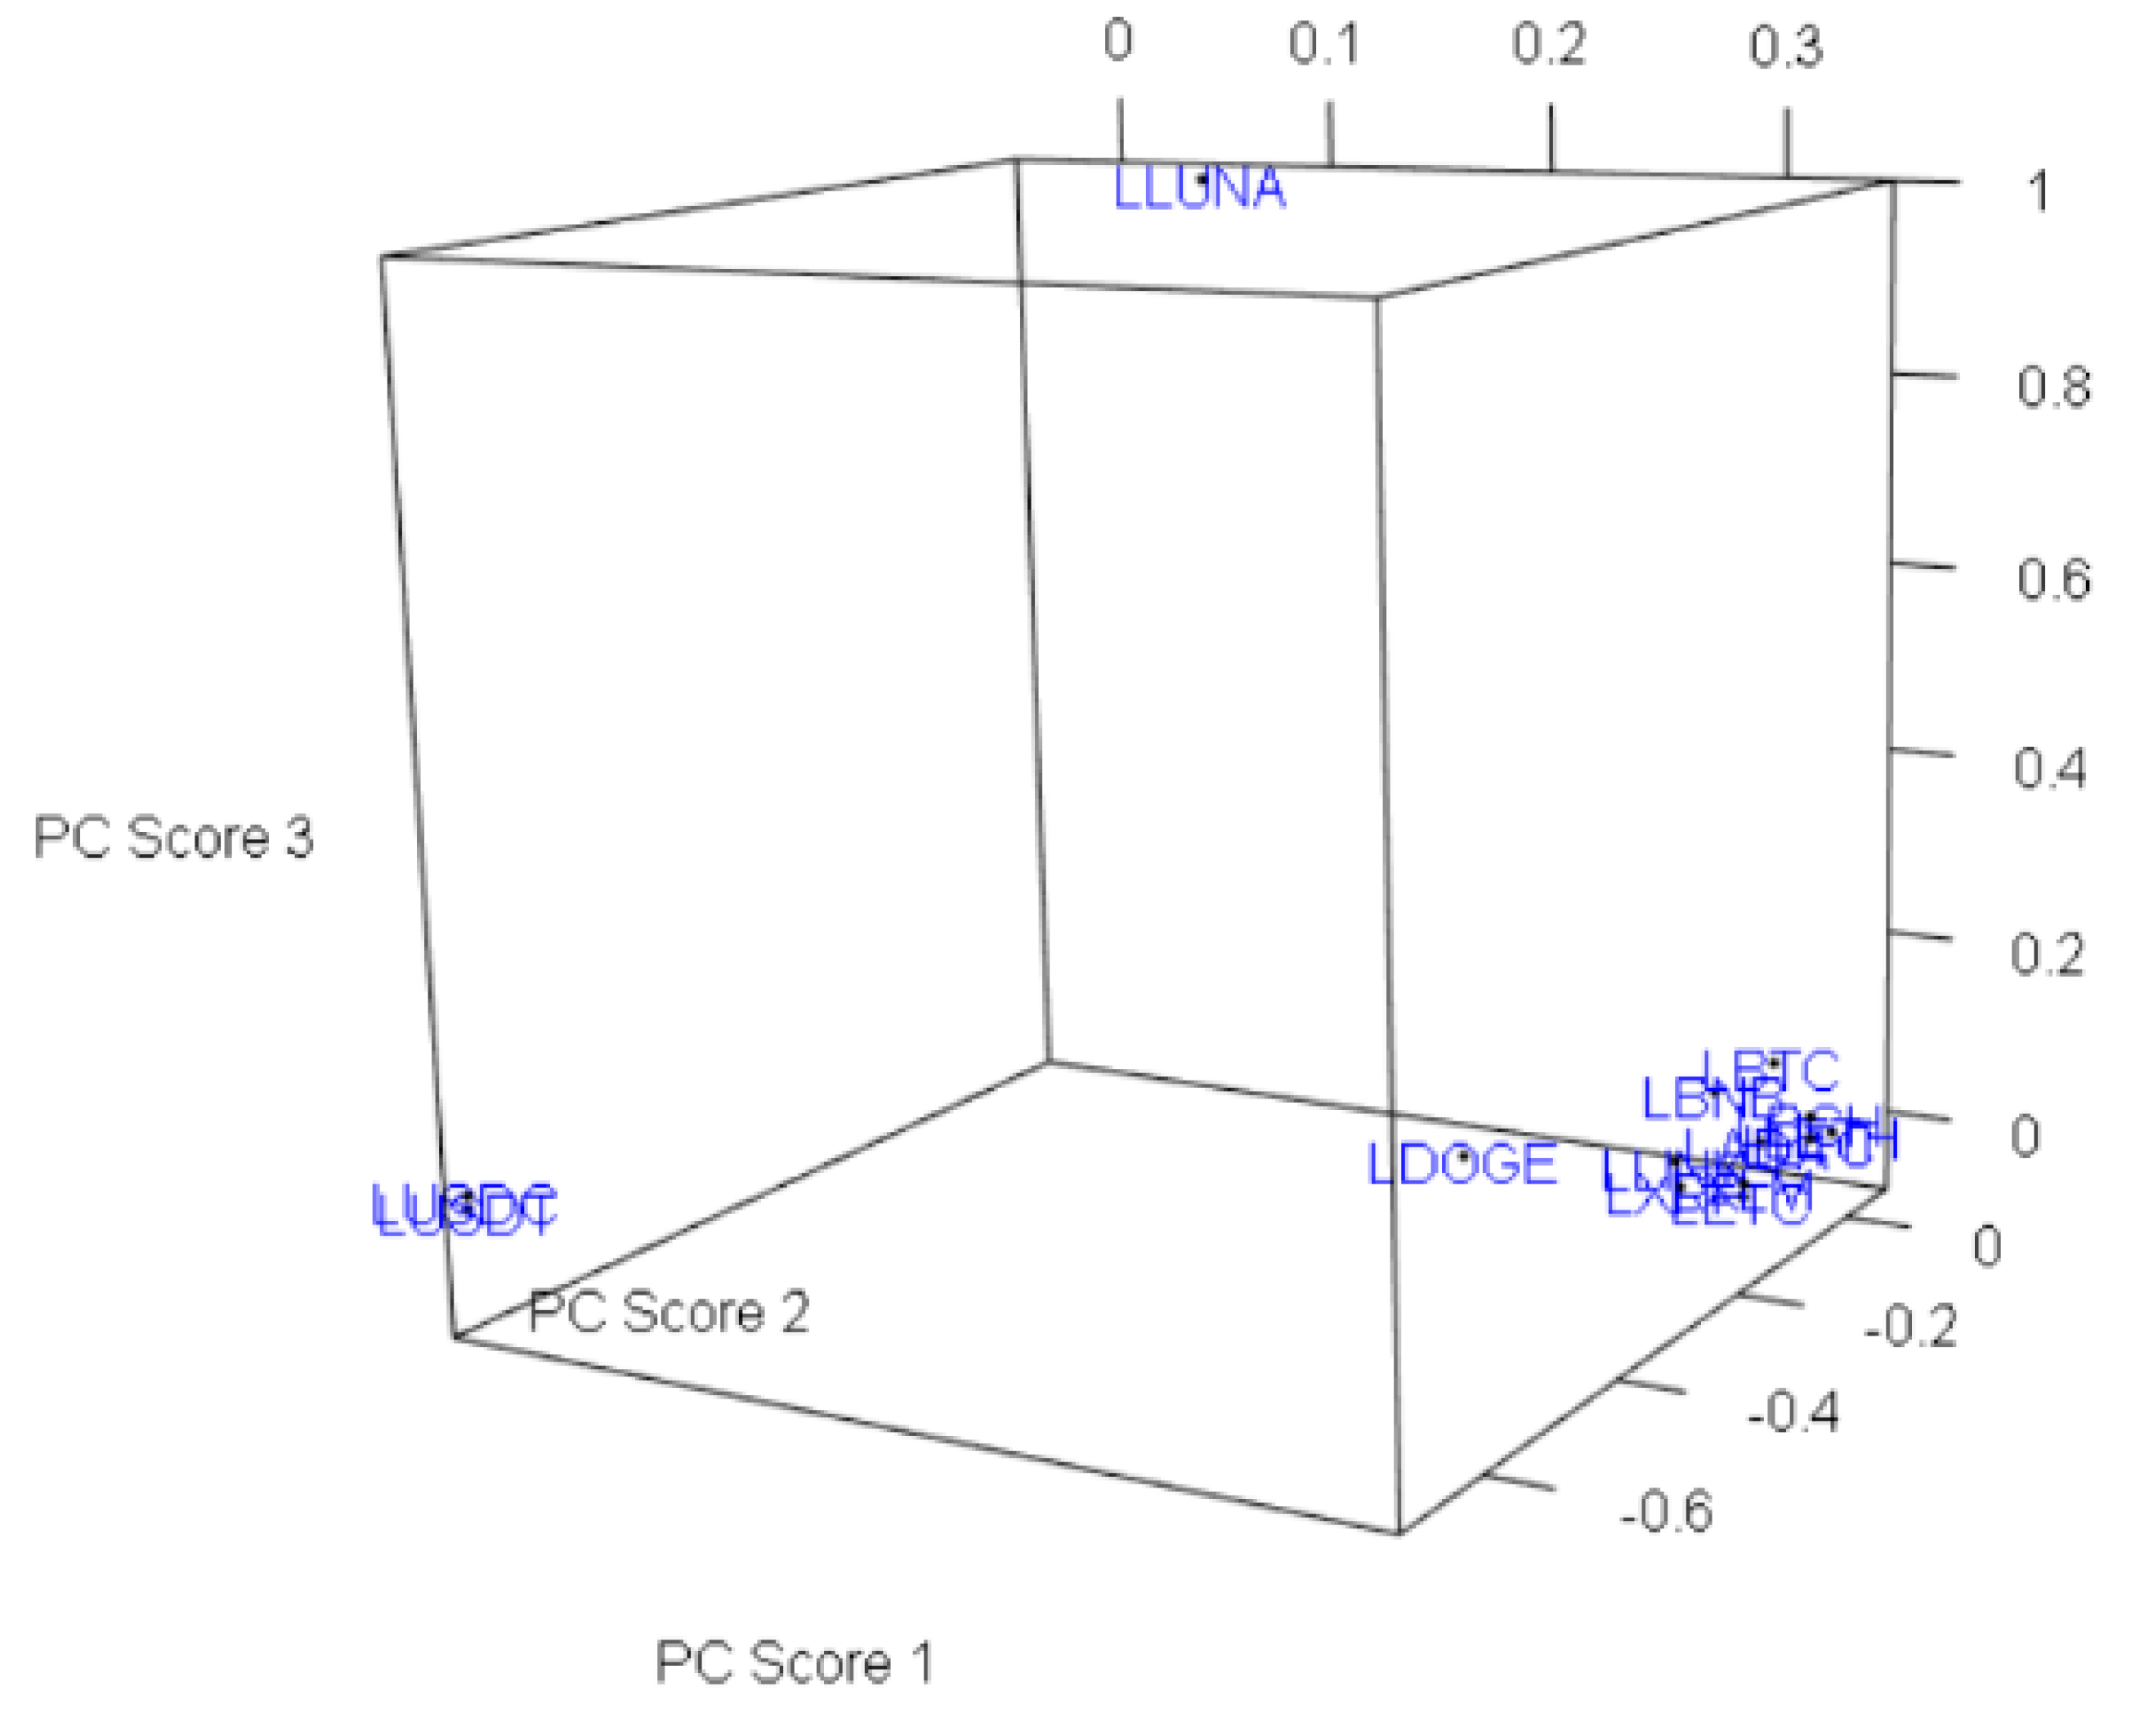

| Variable | Name of Cryptocurrency |
|---|---|
| BTC | Bitcoin |
| ETH | Ethereum |
| ADA | Cardano |
| BNB | Binance Coin |
| USDT | Tether |
| XRP | XRP (Ripple) |
| DOGE | Dogecoin |
| USDC | USD Coin |
| LUNA | Terra |
| BCH | Bitcoin Cash |
| LTC | Litecoin |
| LINK | Chainlink |
| ETC | Ethereum Classic |
| XLM | Stellar |
| This Table Reports Summary Statistics of the Major Variables Used in Our Analysis. | ||||||||
|---|---|---|---|---|---|---|---|---|
| Variables | N | Mean | Q1 | Median | Q3 | Max | Skewness | Kurtosis |
| BTC | 968 | 0.260 | −1.388 | 0.174 | 1.911 | 17.182 | −1.525 | 24.157 |
| ETH | 968 | 0.315 | −1.856 | 0.279 | 2.861 | 23.070 | −1.553 | 19.843 |
| ADA | 968 | 0.431 | −2.531 | 0.333 | 3.074 | 27.944 | −0.350 | 10.430 |
| BNB | 968 | 0.453 | −1.943 | 0.197 | 3.135 | 52.922 | −0.193 | 21.296 |
| USDT | 968 | −0.002 | −0.118 | −0.006 | 0.112 | 5.339 | 0.300 | 57.251 |
| XRP | 968 | 0.119 | −1.912 | 0.019 | 1.984 | 44.476 | −0.099 | 19.238 |
| DOGE | 968 | 0.497 | −1.980 | −0.035 | 1.730 | 151.638 | 6.138 | 101.913 |
| USDC | 968 | −0.002 | −0.094 | 0.001 | 0.098 | 4.244 | 0.876 | 28.523 |
| LUNA | 968 | 0.159 | −5.947 | −0.254 | 5.168 | 236.929 | 0.245 | 18.264 |
| BCH | 968 | 0.135 | −2.261 | 0.026 | 2.787 | 42.081 | −0.557 | 18.252 |
| LTC | 968 | 0.172 | −2.455 | 0.131 | 2.668 | 26.873 | −0.990 | 13.818 |
| LINK | 968 | 0.456 | −3.185 | 0.216 | 3.863 | 48.062 | −0.404 | 13.746 |
| ETC | 968 | 0.255 | −2.003 | 0.211 | 2.337 | 35.247 | −0.075 | 14.694 |
| XLM | 968 | 0.113 | −2.510 | 0.061 | 2.353 | 55.918 | 0.884 | 18.391 |
| Panel A: Pearson Correlation Matrix | |||||||||||||
| BTC | ETH | ADA | BNB | USDT | XRP | DOGE | USDC | LUNA | BCH | LTC | LINK | ETC | |
| ETH | 0.82 | ||||||||||||
| ADA | 0.67 | 0.76 | |||||||||||
| BNB | 0.66 | 0.70 | 0.62 | ||||||||||
| USDT | −0.07 | −0.11 | −0.08 | −0.10 | |||||||||
| XRP | 0.57 | 0.63 | 0.60 | 0.54 | −0.06 | ||||||||
| DOGE | 0.40 | 0.38 | 0.37 | 0.28 | −0.04 | 0.32 | |||||||
| USDC | −0.10 | −0.10 | −0.08 | −0.09 | 0.66 | −0.05 | −0.03 | ||||||
| LUNA | 0.13 | 0.09 | 0.08 | 0.09 | −0.05 | 0.05 | 0.04 | −0.04 | |||||
| BCH | 0.77 | 0.81 | 0.70 | 0.63 | −0.09 | 0.65 | 0.43 | −0.10 | 0.11 | ||||
| LTC | 0.79 | 0.84 | 0.73 | 0.68 | −0.07 | 0.66 | 0.42 | −0.07 | 0.10 | 0.85 | |||
| LINK | 0.57 | 0.68 | 0.60 | 0.56 | −0.06 | 0.53 | 0.34 | −0.08 | 0.05 | 0.60 | 0.63 | ||
| ETC | 0.63 | 0.72 | 0.64 | 0.57 | −0.10 | 0.58 | 0.45 | −0.07 | 0.04 | 0.78 | 0.75 | 0.55 | |
| XLM | 0.62 | 0.69 | 0.74 | 0.57 | −0.08 | 0.73 | 0.39 | −0.09 | 0.06 | 0.68 | 0.68 | 0.58 | 0.64 |
| Panel B: Kendall Correlation Matrix | |||||||||||||
| BTC | ETH | ADA | BNB | USDT | XRP | DOGE | USDC | LUNA | BCH | LTC | LINK | ETC | |
| ETH | 0.61 | ||||||||||||
| ADA | 0.48 | 0.57 | |||||||||||
| BNB | 0.46 | 0.51 | 0.46 | ||||||||||
| USDT | 0.06 | 0.05 | 0.05 | 0.02 | |||||||||
| XRP | 0.50 | 0.57 | 0.54 | 0.44 | 0.05 | ||||||||
| DOGE | 0.47 | 0.46 | 0.42 | 0.38 | 0.07 | 0.45 | |||||||
| USDC | −0.02 | −0.01 | 0.00 | −0.03 | 0.42 | 0.00 | 0.04 | ||||||
| LUNA | 0.22 | 0.17 | 0.12 | 0.17 | −0.04 | 0.15 | 0.10 | −0.03 | |||||
| BCH | 0.58 | 0.62 | 0.53 | 0.47 | 0.05 | 0.55 | 0.46 | −0.01 | 0.17 | ||||
| LTC | 0.58 | 0.63 | 0.55 | 0.49 | 0.05 | 0.56 | 0.46 | 0.00 | 0.17 | 0.66 | |||
| LINK | 0.38 | 0.48 | 0.44 | 0.38 | 0.04 | 0.41 | 0.35 | 0.00 | 0.10 | 0.44 | 0.44 | ||
| ETC | 0.48 | 0.55 | 0.49 | 0.43 | 0.04 | 0.50 | 0.45 | 0.01 | 0.14 | 0.59 | 0.56 | 0.40 | |
| XLM | 0.45 | 0.53 | 0.57 | 0.43 | 0.04 | 0.58 | 0.41 | −0.02 | 0.15 | 0.51 | 0.51 | 0.43 | 0.49 |
| Cryptocurrency | Augmented ADF | p-Value | Alternative Unit Root Testing under Structural Breaks |
|---|---|---|---|
| BTC | −9.5408 | 0.01 | Reject null of unit root at 5%—with constant & trend |
| ETH | −9.2633 | 0.01 | Reject null of unit root at 5%—with constant & trend |
| ADA | −8.8816 | 0.01 | Reject null of unit root at 5%—with constant & trend |
| BNB | −8.0394 | 0.01 | Reject null of unit root at 5%—with constant & trend |
| USDT | −14.345 | 0.01 | Reject null of unit root at 5%—with constant & trend |
| XRP | −9.1692 | 0.01 | Reject null of unit root at 5%—with constant & trend |
| DOGE | −9.4223 | 0.01 | Reject null of unit root at 5%—with constant & trend |
| USDC | −12.381 | 0.01 | Reject null of unit root at 5%—with constant & trend |
| LUNA | −12.579 | 0.01 | Reject null of unit root at 5%—with constant & trend |
| BCH | −9.5168 | 0.01 | Reject null of unit root at 5%—with constant & trend |
| LTC | −9.7936 | 0.01 | Reject null of unit root at 5%—with constant & trend |
| LINK | −9.5374 | 0.01 | Reject null of unit root at 5%—with constant & trend |
| ETC | −9.0545 | 0.01 | Reject null of unit root at 5%—with constant & trend |
| XLM | −9.6799 | 0.01 | Reject null of unit root at 5%—with constant & trend |
| This Table Presents the Correlation Matrix of the Granger Causality. ∗ Indicates Significance at the 5% Levels. Rows Are Granger-Cause with Lag 1 Order and Columns are Granger Effect. | ||||
|---|---|---|---|---|
| BTC | ETH | ADA | XRP | |
| BTC | 0.006 ** | 0.701 | 0.040 * | |
| ETH | 0.768 | 0.755 | 0.121 | |
| ADA | 0.003 ** | 0.006 ** | 0.068 | |
| BNB | 0.370 | 0.351 | 0.792 | 0.378 |
| USDT | 0.407 | 0.475 | 0.520 | 0.871 |
| XRP | 0.085 | 0.052 | 0.627 | |
| DOGE | 0.003 ** | 0.001 ** | 0.069 | 0.278 |
| USDC | 0.229 | 0.482 | 0.455 | 0.827 |
| LUNA | 0.113 | 0.138 | 0.156 | 0.216 |
| BCH | 0.655 | 0.633 | 0.526 | 0.666 |
| LTC | 0.466 | 0.037 * | 0.199 | 0.155 |
| LINK | 0.220 | 0.079 | 0.086 | 0.110 |
| ETC | 0.001 *** | 0.001 ** | 0.116 | 0.128 |
| XLM | 0.000 *** | 0.008 ** | 0.910 | 0.003 ** |
| Estimate | Std. Error | t Value | p-Value | |
|---|---|---|---|---|
| (Intercept) | 0.128 | 0.073 | 1.756 | 0.080 |
| deltaLETH | 0.379 | 0.035 | 10.960 | 0.000 |
| deltaLADA | −0.048 | 0.025 | −1.937 | 0.053 |
| deltaLBNB | 0.081 | 0.022 | 3.585 | 0.000 |
| deltaLUSDT | 0.577 | 0.220 | 2.622 | 0.009 |
| deltaLXRP | −0.016 | 0.019 | −0.811 | 0.418 |
| deltaLDOGE | 0.043 | 0.010 | 4.405 | 0.000 |
| deltaLUSDC | −0.458 | 0.215 | −2.135 | 0.033 |
| deltaLLUNA | 0.005 | 0.002 | 2.316 | 0.021 |
| deltaLBCH | 0.156 | 0.027 | 5.736 | 0.000 |
| deltaLLTC | 0.145 | 0.031 | 4.701 | 0.000 |
| deltaLLINK | −0.013 | 0.014 | −0.932 | 0.352 |
| deltaLETC | −0.024 | 0.025 | −0.975 | 0.330 |
| deltaLXLM | 0.005 | 0.022 | 0.216 | 0.829 |
| LETHLag1 | 0.311 | 0.049 | 6.395 | 0.000 |
| LADALag1 | −0.019 | 0.036 | −0.525 | 0.600 |
| LBNBLag1 | 0.079 | 0.030 | 2.586 | 0.010 |
| LUSDTLag1 | 0.879 | 0.360 | 2.442 | 0.015 |
| LXRPLag1 | −0.034 | 0.026 | −1.285 | 0.199 |
| LDOGELag1 | 0.034 | 0.014 | 2.484 | 0.013 |
| LUSDCLag1 | −0.639 | 0.347 | −1.841 | 0.066 |
| LLUNALag1 | 0.006 | 0.003 | 1.781 | 0.075 |
| LBCHLag1 | 0.157 | 0.038 | 4.124 | 0.000 |
| LLTCLag1 | 0.139 | 0.042 | 3.344 | 0.001 |
| LLINKLag1 | −0.034 | 0.020 | −1.714 | 0.087 |
| LETCLag1 | −0.010 | 0.034 | −0.293 | 0.770 |
| LXLMLag1 | 0.043 | 0.030 | 1.426 | 0.154 |
| LBTCLag1 | −0.964 | 0.037 | −26.056 | 0.000 |
| Estimate of Coefficient | |
|---|---|
| (Intercept) | −1.871 |
| yLag1 | −0.951 |
| h(−15.1888 − deltaLETH) | −0.776 |
| h(deltaLETH − 15.1888) | 0.313 |
| h(−6.33698 − deltaLDOGE) | −0.032 |
| h(deltaLDOGE − 6.33698) | 0.039 |
| h(−4.69091 − deltaLBCH) | −0.159 |
| h(deltaLBCH − 4.69091) | 0.133 |
| h(2.99004 − deltaLLTC) | −0.146 |
| h(deltaLLTC − 2.99004) | 0.221 |
| h(−11.788 − deltaLETC) | 0.131 |
| h(2.75879 − LETHLag1) | −0.211 |
| h(LETHLag1 − 2.75879) | 0.299 |
| h(LADALag1 − 14.5369) | 0.434 |
| h(16.1265 − LDOGELag1) | −0.079 |
| h(12.7908 − LBCHLag1) | −0.150 |
| h(−3.63013 − LLTCLag1) | −0.268 |
| h(LLTCLag1 − 3.63013) | 0.146 |
| Model 1 | Model 2 | ARIMA | ETS | ARFIMA | BATS | NNAR | Hybrid | |
|---|---|---|---|---|---|---|---|---|
| RMSE | 2.531 | 2.728 | 4.295 | 4.294 | 4.296 | 4.372 | 4.292 | 4.316 |
| MAE | 1.845 | 1.926 | 3.220 | 3.220 | 3.222 | 3.309 | 3.218 | 3.245 |
| WMAPE | 0.574 | 0.600 | 1.002 | 1.002 | 1.003 | 1.030 | 1.002 | 1.010 |
Publisher’s Note: MDPI stays neutral with regard to jurisdictional claims in published maps and institutional affiliations. |
© 2022 by the authors. Licensee MDPI, Basel, Switzerland. This article is an open access article distributed under the terms and conditions of the Creative Commons Attribution (CC BY) license (https://creativecommons.org/licenses/by/4.0/).
Share and Cite
Kim, J.-M.; Cho, C.; Jun, C. Forecasting the Price of the Cryptocurrency Using Linear and Nonlinear Error Correction Model. J. Risk Financial Manag. 2022, 15, 74. https://doi.org/10.3390/jrfm15020074
Kim J-M, Cho C, Jun C. Forecasting the Price of the Cryptocurrency Using Linear and Nonlinear Error Correction Model. Journal of Risk and Financial Management. 2022; 15(2):74. https://doi.org/10.3390/jrfm15020074
Chicago/Turabian StyleKim, Jong-Min, Chanho Cho, and Chulhee Jun. 2022. "Forecasting the Price of the Cryptocurrency Using Linear and Nonlinear Error Correction Model" Journal of Risk and Financial Management 15, no. 2: 74. https://doi.org/10.3390/jrfm15020074
APA StyleKim, J.-M., Cho, C., & Jun, C. (2022). Forecasting the Price of the Cryptocurrency Using Linear and Nonlinear Error Correction Model. Journal of Risk and Financial Management, 15(2), 74. https://doi.org/10.3390/jrfm15020074