Abstract
As the threat to human life and health from fine particulate matter (PM2.5) increases globally, the life and health problems caused by environmental pollution are also of increasing concern. Understanding past trends in PM2.5 and exploring the drivers of PM2.5 are important tools for addressing the life-threatening health problems caused by PM2.5. In this study, we calculated the change in annual average global PM2.5 concentrations from 2000 to 2020 using the Theil–Sen median trend analysis method and reveal spatial and temporal trends in PM2.5 concentrations over twenty-one years. The qualitative and quantitative effects of different drivers on PM2.5 concentrations in 2020 were explored from natural and socioeconomic perspectives using a multi-scale geographically weighted regression model. The results show that there is significant spatial heterogeneity in trends in PM2.5 concentration, with significant decreases in PM2.5 concentrations mainly in developed regions, such as the United States, Canada, Japan and the European Union countries, and conversely, significant increases in PM2.5 in developing regions, such as Africa, the Middle East and India. In addition, in regions with more advanced science and technology and urban management, PM2.5 concentrations are more evenly influenced by various factors, with a more negative influence. In contrast, regions at the rapid development stage usually continue their economic development at the cost of the environment, and under a high intensity of human activity. Increased temperature is known as the most important factor for the increase in PM2.5 concentration, while an increase in NDVI can play an important role in the reduction in PM2.5 concentration. This suggests that countries can achieve good air quality goals by setting a reasonable development path.
1. Introduction
In the context of global change issues, air quality has received increasing attention from researchers around the world. Fine particulate matter (PM2.5) is particulate matter with an aerodynamic equivalent diameter less than or equal to 2.5 microns in ambient air, which has the characteristics of a long residence time in the atmosphere and long transmission distance, and has a great impact on human health and atmospheric environmental quality [1,2]. Many epidemiological studies have shown that many human health problems related to respiratory and lung diseases are associated with the concentration of PM [3,4]. In terms of the Global Burden of Disease (GBD), PM2.5 contributes to millions of premature deaths around the world [5,6]. Despite many countries and international organizations making many efforts to solve it, the threat of PM2.5 to the global environment and human health remains [7].
Numerous studies have been conducted regarding near-ground retrieval of PM2.5 concentration, and many achievements have been made. Currently, as the demand for PM2.5 research increases, the requirements for the high resolution and accuracy of near-surface PM2.5 concentration data increase. Currently, there are also many groups producing high-quality PM2.5 remote sensing products with different scopes and resolutions, thus proving highly convenient for application [8,9]. The Centers for Disease Control and Prevention has determined PM2.5 concentration for each year from 2003 to 2011, which is calculated at the country scale (https://wonder.cdc.gov/nasa-pm.html. Accessed on 16 January 2023); the United States Environmental Protection Agency has calculated daily PM2.5 concentration for the United States from 2002 to 2019, which contains spatial resolutions of 12 km2 and 36 km2 (https://www.epa.gov/hesc/rsig-related-downloadable-data-files. Accessed on 16 January 2023); Berkeley Earth provides real-time PM2.5 concentrations for the world at a spatial resolution of 0.1°, but it has only made the last two years of data available for download (https://berkeleyearth.org/archive/air-quality-real-time-map/. Accessed on 16 January 2023); Wei’s team has produced a 1 km PM2.5 concentration product for the whole of China, and has provided it on multiple time scales (https://zenodo.org/record/6398971. Accessed on January 16 January 2023); Van Donkelaar’s team has produced global annual PM2.5 concentrations from 1998 to 2021 and offers them at both 0.01° and 0.1° spatial resolutions; obviously, this is more suitable for conducting long time-series analysis on a global scale [10].
Studies on changes in PM2.5 and their driving forces have also been the focus of researchers’ attention [11,12]. Usually, PM2.5 concentrations are influenced by a combination of natural and anthropogenic factors [13]. Some studies have suggested that precipitation and green coverage rate of built-up areas cause the PM2.5 concentration to change [14,15], whereas others have indicated that the PM2.5 concentration has changed with growth in population and gross domestic product (GDP) [16,17,18]. However, the abovementioned studies focused on small-scale analyses and did not analyze long time-series data, so there are certain limitations in time and space; PM2.5 concentration changes are typically influenced by a variety of factors, therefore, natural factors such as precipitation, temperature, and vegetation, as well as socioeconomic factors such as GDP, population and urbanization rate should always be used for the analysis of the relationship with PM2.5 concentrations [19,20,21]. In addition, different analysis results may be obtained under different spatiotemporal scales. At present, there are relatively few studies on the factors influencing PM2.5 concentrations at the global scale, and these existing studies usually only analyze the impact factors of one aspect of PM2.5 or select a small number of factors for analysis [22]. Therefore, it is meaningful to study the multiple drivers of global PM2.5 concentrations.
The purpose of this study was to analyze the changing spatiotemporal trends in global PM2.5 concentration from 2000 to 2019 and to explore the driving factors, particularly for the years 2000, 2010 and 2019, using a multi-scale geographically weighted regression model (MGWR). Factors included changes in urbanization rate (UR), population density (PD), GDP per capita (GDP_per), total precipitation (TP), temperature at 2 m high (T2M), Normalized Difference Vegetation Index (NDVI), boundary layer height (BLH), wind speed (WS) and wind direction (WD). Using the multi-scale geographically weighted regression (MGWR) model to analyze the contribution of different influencing factors to PM2.5 concentration change, we can confirm the causes of air pollution in different regions. Identifying these influences can help find appropriate solutions.
2. Materials and Methods
2.1. Global Datasets
During this study, we used a variety of global datasets from 2000 to 2019 to analyze the spatial and temporal distribution characteristics and the impact factors of PM2.5. The impact factors were natural and socioeconomic. Datasets used included PM2.5 from the Atmospheric Composition Analysis Group of Washington University in St. Louis; NDVI product from Moderate-resolution Imaging Spectroradiometer (MODIS) on Aqua and Terra; surface pressure, total precipitation, 2 m temperature, boundary layer height and wind products from the fifth generation ECMWF reanalysis for the global climate and weather (ERA5); population density, urban ratio and GDP per capita statistical data from World Bank.
2.1.1. Global Estimates PM2.5 Dataset
The global PM2.5 data generated by Van Donkelaar’s team were acquired from the Atmospheric Composition Analysis Group of Washington University in St. Louis (https://sites.wustl.edu/acag/datasets/surface-pm2-5/. Accessed on 16 January 2023). The dataset was computed using the GEOS-Chem chemical transport model and subsequently calibrated to global ground-based observations using geographically weighted regression (GWR) by combining Aerosol Optical Depth (AOD) retrievals from MODIS, MISR, and SeaWiFS instruments. The dataset, which has a span of 24 years (1998–2021), can provide a 0.01 × 0.01° and 0.1 × 0.1° spatial resolution on both the annual and monthly scale. Global PM2.5 product accuracy has also been verified using ground-based monitoring stations; the coefficient of determination performs well (R2 > 0.8), and the RMSE is also below 8.4 μg/m3 [23,24]. In this study, we used annual PM2.5 products with a 0.1 × 0.1° spatial resolution from 2000 to 2019.
2.1.2. MODIS Vegetation Indices
MODIS on Terra and Aqua can capture information on vegetation, and the resulting global vegetation index product is provided by the 16-Day MODIS-Terra vegetation index from C6 (MOD13A2). The algorithm for this product chooses the best available pixel value from all the acquisitions from the 16 days. MOD13A2 has a spatial resolution of 0.01 × 0.01° and a time horizon of 2000 to the present. MOD13A2 includes two primary vegetation index layers, NDVI and EVI. In this study, we calculated the global annual NDVI using the Google Earth Engine (GEE) (https://developers.google.com/earth-engine/datasets/. Accessed on 16 January 2023). Specifically, the data for 2000 is an incomplete dataset for the year; this dataset starts in February, thus, the global average NDVI in 2000 was calculated from February to December.
2.1.3. Meteorological Datasets
Changes in PM2.5 are sensitive to meteorological conditions, and meteorological data play a significant role in changes in PM2.5 concentrations [25]. The datasets of monthly averaged data on single levels from 1959 to the present produced by ERA5 were used in this study (https://cds.climate.copernicus.eu/. Accessed on 16 January 2023). Reanalysis combines model data with observations from across the world using the related laws of physics to complete a globally consistent dataset. These reanalysis datasets provide more than 260 meteorological variables, where the atmospheric variable spatial resolution is 0.25 × 0.25°, and ocean wave variable spatial resolution is 0.5 × 0.5°. Finally, total precipitation, 10 m u-component of wind, 10 m v-component of wind, boundary layer height and temperature at a height of 2 m were chosen for inclusion in the research.
2.1.4. Nighttime Light Dataset
Nighttime light (NTL) satellite data can visualize the intensity of human activities at night. Because of its strong correlation with urban structure and socioeconomic characteristics, an increasing number of researchers are using NTL remote sensing data to study the economic development of cities [26,27]. The NTL dataset is commonly used by the Defence Meteorological Satellite Program Operational Linescan System (DMSP-OLS) and Suomi National Polar-Orbiting Partnership-Visible Infrared Imaging Radiometer Suite (NPP-VIIRS). The two NTL datasets differ in time span and quality assessment criteria, making it difficult to obtain perfect data for long time-series analysis. There are also some studies that extend NTL data for long time-series by integrating two datasets [28]. In this study, we use the 2000–2020 annual average NTL dataset (https://dataverse.harvard.edu/dataset.xhtml?persistentId=doi:10.7910/DVN/YGIVCD. Accessed on 16 January 2023) integrated by the autoencoder (AE) model using convolutional neural networks. The dataset has a spatial resolution of 0.01 × 0.01° and shows good agreement at both the pixel scale and city scale, with remote production validation with R2 values of 0.87 and 0.95, respectively [29].
2.1.5. Global Statistical Data
Population density, urban ratio and GDP per capita data can reflect socioeconomic attributes and regional development levels. The World Bank provides a crucial tool to support key management decisions and key statistical information regarding the Bank’s operational activities in the context of the increasing demand for high-quality statistics. The World Bank database contains a large number of indicators covering statistics on various aspects of urban development, education, environment, economy, etc. Most of the data are sourced from its member countries, and therefore, the quality of the data is determined by the individual country systems. The population density, urban ratio and GDP per capita data used in this study are obtained from the World Bank database (https://data.worldbank.org.cn/. Accessed on 16 January 2023).
2.2. Methods
2.2.1. Theil–Sen Median Trend Analysis and the Mann–Kendall Test
Theil–Sen median trend analysis is a robust trend calculation method which uses nonparametric statistics. The method is a linear regression through the median of the slopes of all lines at paired points. It is computationally efficient and insensitive to measurement errors and outlier data. In addition, it is often used for trend analysis of long time-series data [30], so it can objectively reflect spatiotemporal changes in PM2.5 concentrations.
where represents the slope of the fitted equation and and represent the value of the PM2.5 concentrations in years and , respectively. When , the PM2.5 concentration shows an increasing trend. In contrast, when , it shows a decreasing trend.
The Mann–Kendall (MK) test is a nonparametric statistical test used to determine the significance of trends in time series data [31,32]. The statistic of the trend test is calculated as follows:
and in equal 2 were calculated as follows:
where is a statistical variable, is the sign function, and is the variance of . Statistical Z is a bilateral trend test that can be combined with the normal distribution table to determine the significance level. In the study, statistic Z and the significance level correspond to Table 1.

Table 1.
Relationship between statistic Z and significance level.
2.2.2. Multi-Scale Geographically Weighted Regression (MGWR)
According to the first law of geography, everything is spatially correlated with each other; specifically, the closer things are to each other, the greater the spatial correlation. Therefore, when regression analysis is performed on spatial data, its spatial location relationship should be considered. In order to explore the spatial nonstationarity of spatial data, the GWR model was proposed [33]. Distinct from global regression, the results calculated by the GWR model can be used to analyze the different relationships between the dependent and explanatory variables of the study object at different spatial scopes. Its essence is to obtain spatially continuous varying regression coefficients by weighting distances. The classical GWR considers spatial heterogeneity, but it uses a constant bandwidth in whole study area which can cause poor fitting results for some variables in local range.
The MGWR relaxes the assumption that all processes to be modeled are on the same spatial scale and overcomes the limitations of GWR very well. It captures the most appropriate bandwidth for each variable, so that the results of the regression obtained are more reliable [34]. The MGWR can be described as follows:
where is a dependent variable representing the PM2.5 concentration value at the spatial location , in and indicates the bandwidth for each variable, represents the intercept distance of the regression model, and represent the coefficient and value of the explanatory variable , respectively, and is the random error.
The core of the MGWR model is the spatial weight function, and the selection of this function is crucial to the correct estimation of the regression parameters. In this paper, a Gaussian function is used as the weight function, which can be described as follows:
where represents the distance between and , and represents the bandwidth used to describe the relationship between distance and weight. According to the MGWR model, the relationship between PM2.5 and explanatory variables can be established to better explain the spatial distribution characteristics of PM2.5.
3. Results
3.1. Global Spatiotemporal Patterns of PM2.5 in 2000–2019
The global spatiotemporal trends in PM2.5 concentration over the past twenty years were calculated, and the significance was tested (Figure 1). In most parts of the world, PM2.5 concentration showed a decreasing trend. The United States, eastern Canada, Japan, western Russia, northeast Argentina, the Tibetan Plateau region of China and a great number of countries in Europe show an extremely significant decreasing trend (p < 0.01), of which most are developed countries. Regions of western and eastern Africa (e.g., Namibia, Zambia, Nigeria, etc.), Turkmenistan, China’s coastal region and the Korean Peninsula are either generally significant or slightly significant (p < 0.05 and p < 0.1). In contrast, some countries or regions show increasing PM2.5 concentrations. Most regions of the Middle East area and India showed extremely significant increases (p < 0.01). Countries or regions such as central Canada, eastern Russia, Australia, Chile, and southern Argentina show different degrees of increase in the concentration of PM2.5 (p < 0.05 and p < 0.1). It could be seen that the PM2.5 concentration in developed countries has been declining more significantly than in other regions over the past two decades.
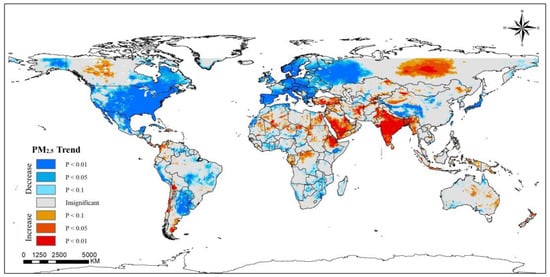
Figure 1.
Spatiotemporal trends of PM2.5 concentrations worldwide (2000–2019).
During the twenty years, overall global PM2.5 concentration showed a nonmonotonic trend (Figure 2). It showed an increased from 2000 to 2003 then highly fluctuated over the next 12 years; during this time, the global economy was in a rapid development phase. However, in the past five years, it has begun to show a remarkable decreasing trend; this decreasing trend may be because the world has come to realize that environmental pollution should also be taken seriously as the economy develops. The decrease in PM2.5 concentration is significantly influenced by stringent policies adopted [35,36,37]. The fitting line of the time series shows that the trend line has decreased slowly, with a drop rate of −0.055 μg/m3/yr over the past 20 years. The highest annual average PM2.5 concentration appeared in 2008, with concentrations above 20.2 μg/m3. The WHO issued air quality guidelines in 2021, which set the annual average PM2.5 concentration at 5 μg/m3, and noted that when the concentration is more than 35 μg/m3, human health will be seriously threatened. At present, it seems that PM2.5 concentrations are moving closer to the WHO standard, but there is still a long way to go.
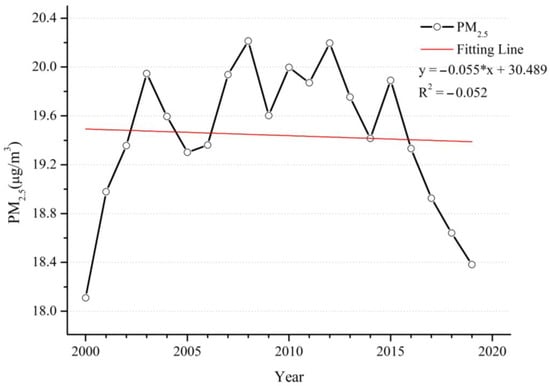
Figure 2.
Time series of annual mean PM2.5 concentrations from 2000 to 2019.
3.2. Spatial-Temporal Patterns of Natural Driving Factors
NDVI is often used to reflect the state of terrestrial vegetation. There are a large number of studies showing that green spaces such as urban forests and parks effectively remove particle pollutants [38,39]. From 2000 to 2019 (Figure 3), the overall global NDVI showed an increasing trend. Before 2008, there was a slow decline, with an annual average decrease in NDVI of 0.01 over the 8 years, after which the trend of NDVI increased. The folding line of the global annual average value of NDVI was similar to a U-type; NDVI and PM2.5 showed opposite trends over the 20 years. Correspondingly, the highest value of PM2.5 and the lowest value of NDVI occurred in the same year. Regarding spatial distribution, most regions showed a trend towards becoming greener (Figure 4). The NDVI shows an extremely significant increase (p < 0.01) in central and eastern China, northwestern India, Turkey, Greece, southern Brazil, and southern Chile. The United States, Mexico and many countries in central Africa are also experiencing significant increases (p < 0.05). In contrast, many regions in the Middle East, South Africa, Nigeria, Canada and Australia observed various significant decreasing trends. It is worth noting that the relationship between NDVI and PM2.5 concentrations in some regions is opposite to that of the overall relationship. However, NDVI does not distinguish between agricultural land and other green spaces; at the same time, deforestation and agricultural expansion are occurring in many regions [40], such as India, where and the increasing trend is mainly contributed to by cropland [41]. For Canada, Guinea, Nigeria and Benin, although the NDVI showed a downwards trend, the PM2.5 concentrations in these regions also showed a downwards trend. This suggests that the variation in PM2.5 concentrations in each region may not be well explained from the perspective of trend changes in NDVI alone, and that such results may be dominated by changes in other factors.
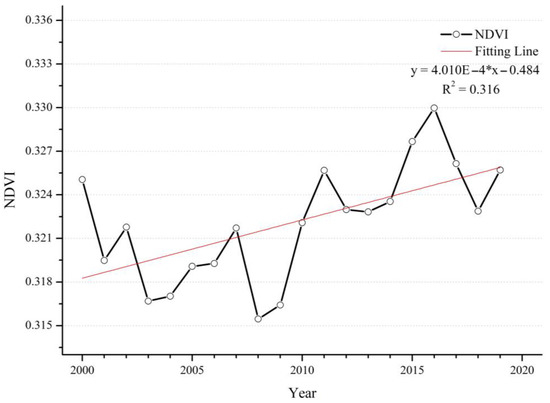
Figure 3.
Time series of the annual mean NDVI from 2000 to 2019.
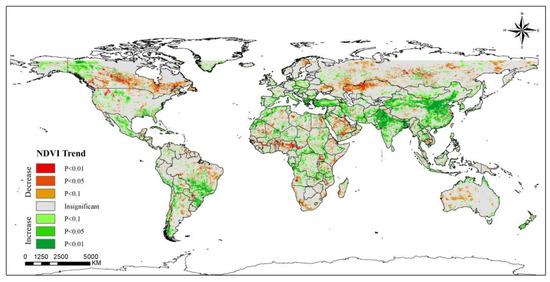
Figure 4.
Spatiotemporal trends of NDVI worldwide (2000–2019).
Wet deposition is one of the most efficient ways to remove pollutants from the atmosphere [42], and precipitation is the most common type of wet deposition method. During this twenty-year period, more than half of the areas did not show a significant increase or decrease in precipitation. However, in other areas, there was a large spatially stratified heterogeneity in the trends of precipitation across the globe (Figure 5). Precipitation in the northern and eastern regions of the U.S. and Alaska showed increasing trends of varying significance, and the corresponding regional PM2.5 concentrations were on the decline, suggesting an important local correlation between precipitation and PM2.5 concentration. A similar situation occurred in Canada, Finland, Vietnam, and parts of western Africa. However, many areas, such as India, Saudi Arabia and Indonesia, showed a trend of increasing precipitation, but also an increasing trend in PM2.5 concentration; the increase in precipitation did not seem to have a visual impact on the decrease in PM2.5 concentration from Figure 1 and Figure 5. The main areas of reduced precipitation were Australia, eastern China, eastern Russia, northwestern Kazakhstan, central Africa, South Africa, and eastern and southern South America. The changes in PM2.5 concentration in these areas with reduced precipitation also show different trends. The time-series line chart shows a slowly fluctuating increase in global annual mean precipitation with a growth rate of 0.0025 mm/yr (Figure 6). There may be an important link between the increase in precipitation and global warming, but the increasing trend in precipitation may allow wet deposition to play a better role.
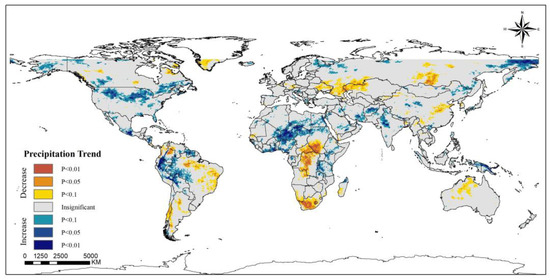
Figure 5.
Global spatiotemporal trends of precipitation (2000–2019).
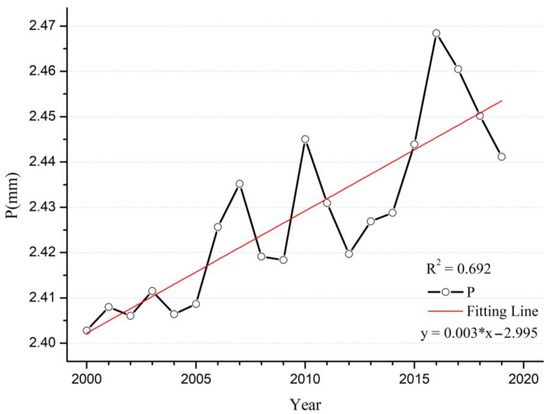
Figure 6.
Time series of annual mean precipitation from 2000 to 2019.
Global warming is becoming an increasingly prominent issue, and has significant implications for the Earth’s natural environment. The generation of the greenhouse effect has led to changes in the characteristics of meteorological factors, resulting in changes in natural conditions such as regional precipitation and temperature, and it also has had an impact on the growth of terrestrial vegetation [43,44]. Near-surface temperature is an important component of climate conditions, and there is an inextricable relationship between PM2.5 concentration and temperature [45]. From 2000 to 2019, almost all regions showed a significant increase in temperature on a global scale, and even if there are very few regions, such as parts of Canada, the United States and Pakistan, with a decreasing trend, the overall temperature increase cannot be reversed (Figure 7 and Figure 8). In the 20 years, the temperature rose 0.88 K. The effect of this on PM2.5 is complicated because an increase in temperature has different effects on the different components of the air [46]. Therefore there is variability in the relationship between the warming effect and the change in PM2.5 concentration in different regions.
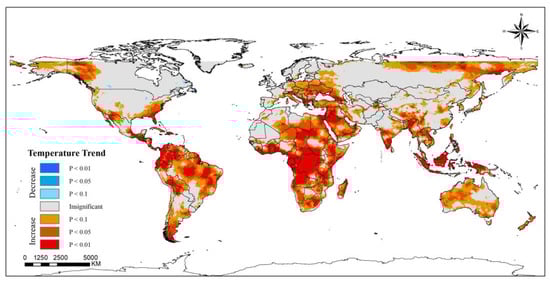
Figure 7.
Spatiotemporal trends of temperature at 2 m high worldwide (2000–2019).
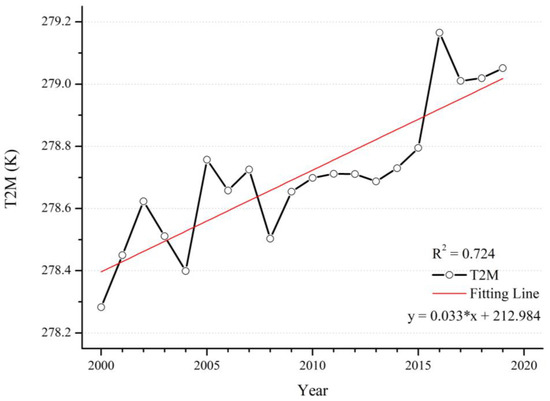
Figure 8.
Time series of the annual mean temperature at 2 m high from 2000 to 2019.
3.3. Spatial-Temporal Patterns of Socioeconomic Driving Factors
Over the past two decades, the world economy has experienced a period of rapid development. Global GDP per capita showed a steady upwards trend, with a decline only in 2001, 2008 and 2015 (Figure 9). In 2001, over-saturated markets due to rapid technological development caused an economic crisis; in 2008, the United States triggered the subprime mortgage crisis, resulting in a hard hit to the world economy; in 2015, world industrial production experienced low growth, trade continued to slump, and financial market turmoil intensified. These three separate years of global events ultimately led to the economic downturn. Economic development and environmental protection are two inseparable topics. If the protection of the environment is neglected during economic development, the unrestricted emission of various pollution sources may lead to the increasing concentration of PM2.5, resulting in significant risks to human health.
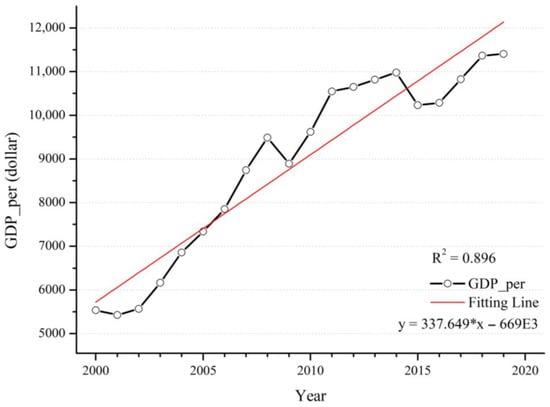
Figure 9.
Time series of GDP per capita from 2000 to 2019.
NTL can be a good measure of the socioeconomic development of a region. Most developed countries, such as the United States, South Korea, and the European Union region, have shown an extremely significant increasing trend of NTL during the past 20 years, but the trend of PM2.5 concentration in these regions has not increased with the increase in human activity intensity. Instead, these areas show a decreasing trend, which is most likely because developed countries have invested more money in environmental management and protection and have achieved certain management results. In addition, different countries and regions have different development routes and priorities, resulting in economic development while failing to consider environmental pollution control. For this reason there is an increasing trend of PM2.5 concentration, mainly occurring in India, the Middle East, Chile, Colombia, and other developing regions. Moreover, in Canada, Japan and other regions, NTL shows a decreasing trend, and the PM2.5 concentration in these regions also shows the same trend; perhaps the reduction in the intensity of human activity has also effectively controlled the reduction in anthropogenic emissions (Figure 10).
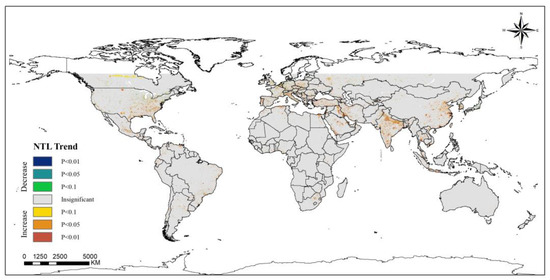
Figure 10.
Spatiotemporal trends of NTL throughout the world (2000–2019).
Changes in NTL and GDP are closely related to population density and urban ratio. The urban ratio is defined as the ratio of the urban population in the region to the total population in the region. As the urban ratio continues to increase, there is a large influx of rural population into urban areas, which eventually leads to a trend of increasing urban population density and decreasing population density in the periphery. The change in population density has an important impact on the intensity of human activities in the region, and it will also have a prominent effect on the PM2.5 concentration. Through Figure 11 and Figure 12, the trends of population density and urban ratio show a high degree of consistency over the 20-year period on the global scale. Within the first decade, the increase in population density and urban ratio may have contributed significantly to the increase in PM2.5 concentration, whereas within the second decade, PM2.5 concentration did not change at the same time. The decline in PM2.5 concentration indicates that the effect of increasing population density and urban expansion on the change in PM2.5 concentration is gradually weakening.
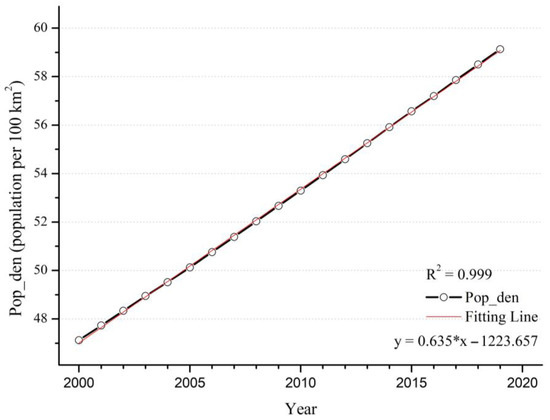
Figure 11.
Time series of global mean population per 100 km2 from 2000 to 2019.
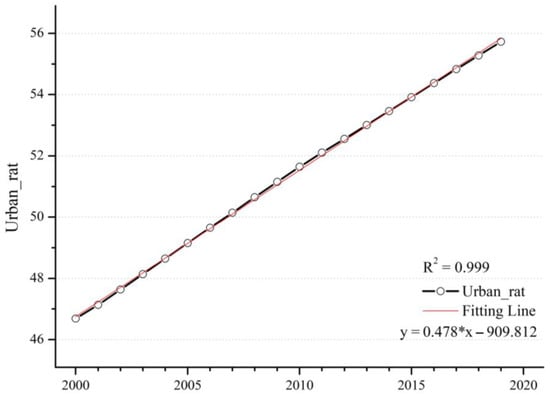
Figure 12.
Time series of the global mean urban ratio from 2000 to 2019.
4. Discussion
4.1. Comparison with Traditional Linear Models
In this study, a MGWR model was applied to better understand the influence of natural and socio-economic factors on the spatial and temporal distribution of PM2.5 at national scales worldwide. Apart from the MGWR model, we compared different traditional linear models, such as ordinary least squares (OLS) and classic GWR. Table 2 shows the results of the three models. The traditional linear regression model ignores the spatial heterogeneity and the accuracy of the calculation was the worst. Variance inflation factor (VIF) was also calculated and it was found that the VIF values of the selected factors were all less than three. It is considered that there was no covariance between each factor, therefore GWR and MGWR can be used for regression. The GWR model takes into account the spatial heterogeneity of the study area, and the accuracy of the regression was also improved, however, because GWR defaults to all explanatory variables having the same spatial scale in the calculation process, this leads to less credible regression results in local areas. So, our study finally adopted the MGWR model, which also significantly improved the accuracy of the regression results, in addition to the interpretability of the model.
Table 2.
Comparison of multiple models.
4.2. PM2.5 Concentrations Driving Factor Analysis
Because of limited space, 2000, 2010 and 2019 are chosen here for in-depth discussion. Figure 13, Figure 14 and Figure 15 illustrate the regression coefficients of the factors we selected, and the figures are calculated based on the average of the selected factors across countries (Appendix A, Table A1, Table A2 and Table A3). As an important indicator of the degree of urbanization in a region, the urbanization rate can reflect the process and degree of population gathering in cities. Our results show that in 2000, the urbanization rate had a negative effect on PM2.5 concentration in most countries. In 2010, urbanization rates showed positive effects on PM2.5 concentrations in all regions except for some countries in South America and southern Africa, and in 2019, all countries maintained a negative effect on PM2.5. It can be assumed that with the increase in urbanization rate, the spatial layout within each country is more rational, which makes the production and living of people and the centralized management of the environment more efficient and orderly [47,48]. According to the urbanization rate statistics provided by the World Bank, countries in North and South America have relatively high urbanization rates globally, and they are already in a relatively mature state of urban development, maintaining a stable level of impact on PM2.5 compared to other factors. For countries in the Asian region, the negative effect of urbanization rate on PM2.5 concentrations mostly diminished over time, probably as a result of the increased influence of other factors on PM2.5 concentrations during the development process. In Europe, the opposite trend to Asia was shown, with urbanization rate playing an increasingly important role in the change of PM2.5 concentrations. Africa is relatively less developed than other regions and has relatively uneven development between countries, leading to greater heterogeneity. Population density, which reflects the density of the population living in a certain area, has a very important impact on PM2.5 concentration [49]. Generally speaking, the higher the population density, the higher the intensity of human activity. Similarly, dense urban and industrial areas are often accompanied by high population densities, which will also lead to increased emission of air pollutants. We calculated that population density had a negative effect on PM2.5 concentrations in most countries in 2000, except for central and southern Africa and the Middle East. However, in 2010, the negative effect of this factor on PM2.5 concentrations weakened, and reversed in 2019. The year-on-year increase in population density is illustrated in Figure 11, and the high population density further leads to more anthropogenic emissions, which can provide a significant influence on the increase in PM2.5 concentration [50]. In 2000, the effect of GDP per capita on PM2.5 concentration had significant geographical differences, with negative effects in all countries in the European and American region and positive effects in countries in the Asian and African regions. Such positive effects were more pronounced in developing countries, while some economically developed countries in the United States, Canada, and Europe showed negative effects. However, in 2010, the effect of GDP per capita on PM2.5 in all countries of the world showed a negative effect, with regression coefficients ranging from −0.025 to 0, which also indicates that its effect is relatively small. Years before 2010, as the global average annual PM2.5 concentration was at a high level, various problems caused by the increase in environmental pollution has made countries around the world also began to pay attention to the monitoring and management of PM2.5, and air pollution prevention and control bills introduced by various countries one after another may be an important reason for this shift [51,52]. In 2019, the negative impact on PM2.5 concentrations increased in most countries around the world as investment in environmental protection increased, but a positive impact has developed again in the Middle East and in eastern Africa, which may also contribute to the 20-year trend of increasing PM2.5 concentrations in these regions.
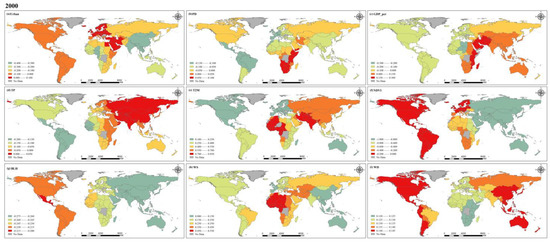
Figure 13.
Spatial distribution of coefficients for factors in 2000.
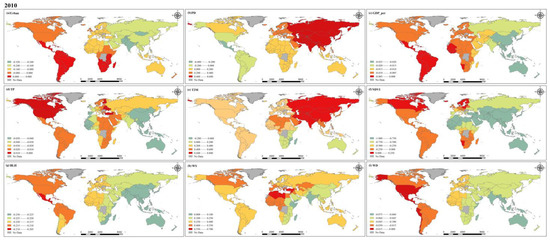
Figure 14.
Spatial distribution of coefficients for factors in 2010.
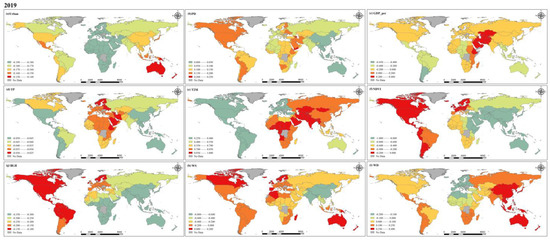
Figure 15.
Spatial distribution of coefficients for factors in 2019.
The influence of natural factors on PM2.5 concentration cannot be ignored. In general, moisture in the air is adsorbed and collected by suspended PM2.5, which eventually falls to the ground in the form of precipitation, while the occurrence of precipitation also leads to an increase in moisture in the air, which has a good effect on the removal of PM2.5 from the atmosphere [53]. In 2000, our results also show spatial distribution characteristics that are consistent with the above conditions. Precipitation has a negative effect on PM2.5 concentrations in regions with abundant mean annual precipitation, and this effect is particularly evident in regions with sufficient annual precipitation such as the Americas, Australia, southern Asia, and western Africa. In contrast, regions with low precipitation, such as southern and eastern Africa and northern Asia, show different results. Although seasonal precipitation is high in some of these regions, this study is based on annual averages at the national scale, weakening its spatial heterogeneity and certain characteristics. In addition, the intensity and frequency of precipitation can affect PM2.5 concentration variability [54]. In 2010 and 2019, the regression coefficients for precipitation were all between −0.05 and 0, indicating that the effect of precipitation on PM2.5 concentration appears to be weakened relative to other factors. The process of temperature influence on PM2.5 concentration is complex and a positive correlation between them is usually considered, which is consistent with our calculations at the global scale and shows a trend towards a stronger positive effect in many countries, which may have some connection with the global warming trend. However, some studies have also shown that higher temperatures enhance air convection, which in turn dilutes and diffuses PM2.5 and reduces local PM2.5 concentrations [55,56]. His diffusion effect may not be significant at larger spatial scales. During the past two decades, the positive effect of temperature on PM2.5 concentration has become increasingly significant due to the effects of global warming. Among the many factors, the regression coefficient of temperature is in the higher range, which means that the effect of temperature on PM2.5 concentration is crucial. Vegetation cover in all countries of the world showed different degrees of negative effects on PM2.5 concentration, which is consistent with the results of most studies, and it can be inferred that good vegetation cover can effectively reduce atmospheric PM2.5 concentration and is a very effective factor in suppressing PM2.5 concentration [57]. At these three time points, the variation in the regression coefficients of NDVI is relatively small worldwide, but shows a clear gradient, with the largest negative effects in Asia and Australia, followed by Africa, while in the Americas and Europe such negative effects are relatively weak. Boundary layer height determines the volume available for diffusion and transport of pollutants in the atmosphere [58]; when the BLH is large, the PM2.5 concentration mixed in it will be relatively low. The results of our study show that BLH has a negative effect on PM2.5 globally, and the spatial distribution is stable over the past 20 years, with the value of the regression coefficient remaining between −0.35 and −0.1. The degree of negative influence also increases gradually from west to east. Wind is an important condition in the process of diffusion and transport of pollutants in the atmosphere [59]. Wind speed and wind direction together affect the diffusion rate and direction of PM2.5 concentration. In 2000 and 2010, the positive effect of wind speed on PM2.5 concentrations was the largest in Africa and smallest in Asia, and by 2019, the effect of wind speed shifted to negative globally, probably due to the acceleration between ocean currents and sea breezes in the context of global warming, which further enhanced the diffusion of PM2.5 in the atmosphere and made PM2.5 concentration decrease.
Both socio-economic factors and natural factors lead to change in global PM2.5 concentration, and due to inconsistent development stages and speed of countries around the world, there is a strong spatial heterogeneity. According to the calculation results for developed countries, Europe and the Americas have more advanced science and technology and more reasonable urban structural layout, so the regression coefficients of these factors are relatively balanced. Conversely, economically underdeveloped countries still have to continue their economic development at the cost of the environment in order to seek better development, and so PM2.5 is more significantly affected with a positive influence. Throughout all three years, the positive effect of temperature on PM2.5 concentration was the largest of all variables. Although temperature is one of the natural factors, combustion and emissions from human activities are decisive causes of the greenhouse effect. The negative effect of NDVI on PM2.5 concentration is the largest in all three years. NDVI is influenced not only by the natural growth of vegetation, but also by human activities. The increase in artificial green areas can effectively reduce PM2.5 concentration. This also proves that the optimization of urban structure layout, the development of high technology, and the increase in vegetation all have positive effects on the reduction in PM2.5 concentration. The decrease in global average annual PM2.5 concentration in the past decade with the joint efforts of countries around the world confirms that the formulation of reasonable air pollution prevention and control acts can effectively monitor and manage PM2.5.
5. Conclusions and Limitation
The Theil–Sen median trend and MGWR approach for analyzing the spatiotemporal distribution of PM2.5 concentrations and the contributions of driving factors have improved our understanding of PM2.5. Currently, PM2.5 concentrations show a decreasing trend in the more economically developed countries, while many relatively backwards developing countries show an increasing trend, especially in India and the Middle East. From the perspective of natural and socioeconomic factors, we can see that developed and developing countries show opposite results under the same driving factors and developed and developing countries are at distinct stages of urban development. Developed countries have largely completed the urbanization process, while developing countries are experiencing rapid urbanization. This has a lot to do with the higher economic, technological and management levels of developed countries, which have experienced the lesson of “pollute first, treat later” and have invested more in environmental protection, and transferred many heavy polluting enterprises to developing countries, resulting in two opposite trends. The trends of global average NDVI and global PM2.5 concentrations show “U-type” and inverse “U-type” distributions, respectively, suggesting that the increase in green areas has the power to explain reduced PM2.5 concentrations. In conclusion, the increase in population density, socioeconomic development and urban expansion in the context of global warming and increasing climate extremes tend to lead to an increase in PM2.5 concentration. However, through effective management and by setting a reasonable development path, for example, in the process of urban planning, reasonably arranging the spatial layout of different functional industries to facilitate centralized management of industries that emit air pollutants, and then increasing investment in high-tech development to accelerate the goal of conversion to clean energy, the goal of synergistic development of economic development and environmental protection can be achieved in the end.
In this study, a limited number of drivers were selected to analyze their relationship with PM2.5 concentration. Emission sources that can have a direct impact on PM2.5 concentrations were not considered, making the discussion of the detailed causes of PM2.5 concentration changes somewhat limited. In addition, although the MGWR model is better than the OLS model and the GWR model in terms of fitting accuracy, there are still some limitations. The MGWR model is also a type of linear model, and a nonlinear expression may yield better results under complex spatial distributions. Moreover, the explanation of a single factor is not completely reliable; the process of PM2.5 concentration change should be a very complex process, and the interaction between these influencing factors is not clear. In future studies, we may consider more comprehensive influencing factors and try more models to explain the relationship between influencing factors and PM2.5 concentrations, and undertake further exploration of the interaction between factors.
Author Contributions
J.S. proposed the methods. X.X. implemented the experiments and drafted the manuscript. K.S. reviewed and edited the manuscript. Z.H. completed the acquisition of data and validation. J.S. provided overall guidance to the project and obtained funding to support this research. All authors have read and agreed to the published version of the manuscript.
Funding
The research was supported by the Natural Science Foundation of Chongqing (No. CSTB2022NSCQ-MSX0336), Chongqing Youth Innovative Talent Training Program (No. CY220234), and High Quality Development Project of Postgraduate Education of Southwest University (No. SWUYJS222005).
Institutional Review Board Statement
Not applicable.
Informed Consent Statement
Not applicable.
Data Availability Statement
Data is contained within the article and Appendix A.
Conflicts of Interest
The authors declare no conflict of interest.
Appendix A
Table A1.
Year-wise mean value of all the parameters in 2000.
Table A1.
Year-wise mean value of all the parameters in 2000.
| County | UR | PD | GDP_per | PM25 | TP | T2M | NDVI | BLH | WS | WD |
|---|---|---|---|---|---|---|---|---|---|---|
| AFG | 22.0780 | 31.8291 | 179.4266 | 33.8495 | 0.0006 | 285.5928 | 0.1100 | 602.1169 | 1.5467 | 241.9826 |
| ALB | 41.7410 | 112.7382 | 1126.6833 | 21.7811 | 0.0029 | 286.1560 | 0.4692 | 393.1855 | 4.2350 | 241.0956 |
| DZA | 59.9190 | 13.0334 | 1765.0271 | 32.1160 | 0.0001 | 296.3192 | 0.1169 | 759.3276 | 2.7035 | 145.9869 |
| AGO | 50.0870 | 13.1511 | 556.8362 | 20.2957 | 0.0029 | 295.0195 | 0.5204 | 629.8076 | 4.7150 | 85.6959 |
| ARG | 89.1420 | 13.4728 | 7708.0991 | 15.1521 | 0.0026 | 286.4868 | 0.3726 | 662.6028 | 4.1936 | 210.3534 |
| ARM | 64.6660 | 107.8187 | 622.7409 | 23.8468 | 0.0020 | 279.2242 | 0.3108 | 411.0739 | 2.5497 | 284.8812 |
| AUS | 84.2350 | 2.4931 | 21,697.7085 | 4.6080 | 0.0018 | 294.3353 | 0.3452 | 760.6279 | 1.6857 | 113.0352 |
| AUT | 60.2130 | 97.0158 | 24,625.6007 | 15.4217 | 0.0035 | 280.4046 | 0.5436 | 434.3101 | 4.4736 | 239.8334 |
| AZE | 51.3860 | 97.4348 | 655.1199 | 26.1463 | 0.0013 | 286.8007 | 0.2662 | 459.8327 | 2.7473 | 307.7411 |
| BGD | 23.5900 | 980.7011 | 418.0689 | 52.7968 | 0.0068 | 297.9745 | 0.4662 | 433.1246 | 4.2884 | 92.8961 |
| BLR | 69.9730 | 49.1994 | 1276.2880 | 16.7132 | 0.0020 | 281.0086 | 0.5070 | 570.2219 | 3.3204 | 232.1806 |
| BEL | 97.1290 | 338.5485 | 23,098.8865 | 13.3689 | 0.0029 | 283.8709 | 0.6302 | 606.3830 | 2.9343 | 251.8785 |
| BLZ | 45.3980 | 10.8422 | 3364.4917 | 18.3197 | 0.0038 | 297.7080 | 0.6944 | 530.6097 | 1.5121 | 240.5799 |
| BEN | 38.3330 | 60.8899 | 512.6739 | 48.8258 | 0.0028 | 300.5466 | 0.5026 | 646.1343 | 6.8092 | 75.5987 |
| BTN | 25.4180 | 14.8496 | 718.1963 | 20.8942 | 0.0085 | 279.4159 | 0.4793 | 281.6225 | 1.9581 | 99.0074 |
| BOL | 61.7870 | 7.7709 | 997.5818 | 25.1072 | 0.0039 | 292.7631 | 0.5652 | 562.5574 | 2.5150 | 158.8676 |
| BIH | 42.3840 | 73.2652 | 1484.1761 | 27.5371 | 0.0026 | 284.2731 | 0.5966 | 473.5262 | 4.7509 | 239.8284 |
| BWA | 53.2190 | 2.8997 | 3522.3108 | 17.8380 | 0.0019 | 294.1540 | 0.3554 | 720.8429 | 3.4470 | 98.1352 |
| BRA | 81.1920 | 20.9126 | 3749.9108 | 14.8498 | 0.0052 | 297.5663 | 0.6446 | 480.5716 | 1.4058 | 146.6187 |
| BRN | 71.1640 | 63.2194 | 18,012.5022 | 5.6315 | 0.0069 | 299.8415 | 0.6924 | 380.4360 | 0.8500 | 74.4657 |
| BGR | 68.8990 | 73.8513 | 1621.2430 | 26.0335 | 0.0013 | 284.9830 | 0.5071 | 506.0910 | 4.1326 | 246.6907 |
| BFA | 17.8440 | 42.4267 | 255.7187 | 40.7396 | 0.0016 | 301.4529 | 0.3537 | 682.2506 | 7.3906 | 75.8445 |
| BDI | 8.2460 | 248.3984 | 136.4640 | 31.9833 | 0.0038 | 293.5932 | 0.4995 | 586.9069 | 6.1900 | 87.9110 |
| KHM | 18.5860 | 68.8604 | 300.6137 | 17.3857 | 0.0056 | 300.1102 | 0.5829 | 495.5282 | 8.7732 | 70.0928 |
| CMR | 45.5420 | 32.8192 | 681.1020 | 46.4291 | 0.0050 | 297.1607 | 0.5602 | 492.6553 | 6.1173 | 88.5900 |
| CAN | 79.4780 | 3.4226 | 24,271.0021 | 3.6574 | 0.0016 | 267.0108 | 0.2358 | 401.5914 | 0.9749 | 217.8069 |
| CAF | 37.6390 | 5.8436 | 251.8328 | 32.3960 | 0.0036 | 298.4704 | 0.6555 | 560.6827 | 5.8547 | 86.8668 |
| TCD | 21.6370 | 6.6357 | 166.1757 | 50.6063 | 0.0007 | 299.4048 | 0.2114 | 681.5718 | 7.3860 | 75.8585 |
| CHL | 86.0730 | 20.6344 | 5100.2541 | 13.7580 | 0.0042 | 281.9560 | 0.3043 | 504.8170 | 6.2987 | 227.9254 |
| CHN | 35.8770 | 133.9719 | 959.3725 | 27.8467 | 0.0022 | 279.4784 | 0.2905 | 542.6256 | 1.5997 | 213.1305 |
| COL | 73.9570 | 35.7188 | 2520.4811 | 16.7692 | 0.0099 | 296.4643 | 0.6055 | 346.5086 | 0.5432 | 181.0906 |
| COM | 28.0800 | 291.4336 | 647.4258 | 10.6556 | 0.0024 | 298.1979 | 0.6449 | 585.0796 | 6.3745 | 91.0849 |
| COG | 58.6950 | 9.1579 | 1032.1376 | 34.2481 | 0.0045 | 297.2450 | 0.5938 | 392.7598 | 6.0708 | 88.7862 |
| COD | 35.1220 | 20.7785 | 405.2162 | 35.1962 | 0.0045 | 296.8253 | 0.6821 | 433.8509 | 5.9154 | 88.6850 |
| CRI | 59.0520 | 77.6022 | 3789.0539 | 14.9833 | 0.0089 | 295.8813 | 0.6398 | 415.7976 | 1.6097 | 238.0919 |
| CIV | 43.1550 | 51.7442 | 1007.4674 | 26.8967 | 0.0032 | 299.0755 | 0.5293 | 566.5360 | 6.2012 | 78.4459 |
| HRV | 53.4280 | 79.9195 | 4887.7137 | 20.0698 | 0.0026 | 285.7910 | 0.5890 | 474.9056 | 4.7876 | 239.8142 |
| CUB | 75.3230 | 103.5980 | 2747.1003 | 11.9491 | 0.0020 | 298.2920 | 0.6334 | 670.7790 | 0.4833 | 175.6806 |
| CYP | 68.6480 | 102.0874 | 14,388.3477 | 20.6622 | 0.0013 | 292.7031 | 0.3167 | 553.2762 | 1.1752 | 254.4217 |
| CZE | 73.9880 | 132.7173 | 6029.0382 | 19.3637 | 0.0022 | 282.3130 | 0.5611 | 547.9158 | 4.0450 | 238.6683 |
| DNK | 85.1000 | 125.8453 | 30,743.5477 | 2.2790 | 0.0010 | 253.7751 | −0.0335 | 199.3058 | 0.8690 | 172.3289 |
| DJI | 76.5320 | 30.9567 | 768.1836 | 35.7283 | 0.0007 | 301.5547 | 0.1125 | 802.4154 | 7.1028 | 64.7858 |
| DMA | 65.2650 | 92.8667 | 4787.8014 | 12.5750 | 0.0020 | 298.7954 | 0.7040 | 787.4301 | 0.7327 | 40.9683 |
| DOM | 61.7530 | 175.3533 | 2869.1781 | 11.5998 | 0.0023 | 296.8789 | 0.6506 | 546.2463 | 1.6014 | 84.6368 |
| ECU | 60.2990 | 51.0594 | 1445.2793 | 13.7362 | 0.0087 | 292.7888 | 0.4890 | 316.9937 | 0.4371 | 249.6579 |
| EGY | 42.7970 | 69.1462 | 1450.4762 | 40.9264 | 0.0000 | 295.3019 | 0.1124 | 611.8229 | 4.5002 | 87.9643 |
| SLV | 58.9120 | 284.1665 | 2001.5400 | 28.1796 | 0.0036 | 297.7833 | 0.6780 | 594.0580 | 1.4049 | 226.3673 |
| GNQ | 49.0920 | 21.6107 | 1725.5576 | 31.2369 | 0.0089 | 296.6764 | 0.4818 | 356.0040 | 6.1448 | 94.8720 |
| ERI | 26.5870 | 22.6972 | 308.1342 | 34.0939 | 0.0008 | 299.9710 | 0.1626 | 690.7507 | 8.1488 | 67.6865 |
| EST | 69.3680 | 32.9555 | 4070.6090 | 9.0725 | 0.0021 | 280.1713 | 0.4808 | 561.5966 | 0.8786 | 88.1589 |
| ETH | 14.7400 | 66.2248 | 124.4608 | 19.0285 | 0.0026 | 296.0029 | 0.3899 | 768.6521 | 5.6664 | 83.9350 |
| FJI | 47.9080 | 44.3903 | 2069.3175 | 6.3497 | 0.0071 | 297.6915 | 0.7419 | 487.4509 | 6.9668 | 126.4357 |
| FIN | 82.1830 | 16.9940 | 24,345.9148 | 5.7739 | 0.0020 | 276.7162 | 0.4203 | 537.4464 | 0.8106 | 96.9632 |
| FRA | 75.8710 | 111.2421 | 22,419.6948 | 12.5566 | 0.0029 | 284.7556 | 0.6148 | 547.0696 | 4.0811 | 255.9357 |
| GAB | 78.8790 | 4.7672 | 4135.9924 | 25.5043 | 0.0057 | 297.2041 | 0.4620 | 398.9363 | 6.0869 | 88.3177 |
| GEO | 52.6380 | 71.3309 | 749.9085 | 19.6521 | 0.0030 | 280.2393 | 0.4869 | 321.5960 | 2.7419 | 268.9658 |
| DEU | 74.9650 | 235.5968 | 23,694.7605 | 14.4042 | 0.0025 | 283.1206 | 0.6122 | 578.5321 | 3.0288 | 235.6645 |
| GHA | 43.9290 | 84.7273 | 258.4710 | 38.9228 | 0.0027 | 300.2450 | 0.4944 | 595.5582 | 6.3969 | 78.3945 |
| GRC | 72.7160 | 83.8309 | 12,072.9294 | 18.9479 | 0.0015 | 287.4909 | 0.4884 | 471.7066 | 3.4461 | 241.5302 |
| GTM | 45.3320 | 108.1538 | 1664.2990 | 29.2672 | 0.0049 | 295.3244 | 0.6869 | 458.7450 | 1.5379 | 222.1088 |
| GIN | 30.8690 | 33.5371 | 363.4823 | 31.1368 | 0.0048 | 298.8392 | 0.5809 | 554.7373 | 6.7179 | 76.1871 |
| GNB | 36.2430 | 42.7207 | 308.9103 | 39.1327 | 0.0033 | 300.8018 | 0.5674 | 510.8033 | 6.6601 | 78.3687 |
| GUY | 28.6940 | 3.7933 | 954.4003 | 13.7076 | 0.0055 | 297.9446 | 0.6759 | 472.8967 | 0.4275 | 149.9103 |
| HTI | 35.6000 | 307.1046 | 805.0256 | 12.3057 | 0.0019 | 298.0041 | 0.5760 | 515.2011 | 2.1137 | 88.6423 |
| HND | 45.4580 | 58.7587 | 1093.1081 | 25.1281 | 0.0040 | 295.9077 | 0.6654 | 511.7707 | 1.5186 | 245.6845 |
| HUN | 64.5750 | 113.9363 | 4624.2817 | 22.0857 | 0.0014 | 285.0736 | 0.4931 | 538.7070 | 4.7223 | 238.8301 |
| ISL | 92.4010 | 2.8050 | 32,096.3723 | 4.5094 | 0.0034 | 274.5433 | 0.1527 | 508.5296 | 0.5950 | 189.5988 |
| IND | 27.6670 | 355.3677 | 443.3142 | 34.9695 | 0.0032 | 296.5155 | 0.3923 | 581.7520 | 1.8893 | 162.2188 |
| IDN | 42.0020 | 116.7572 | 780.1902 | 10.8315 | 0.0092 | 297.9742 | 0.6675 | 325.5052 | 1.3315 | 95.2109 |
| IRN | 64.0420 | 40.2904 | 1670.0097 | 39.8337 | 0.0007 | 291.2217 | 0.1177 | 707.7281 | 4.2147 | 290.1329 |
| IRQ | 68.4960 | 53.7247 | 2058.2644 | 47.3930 | 0.0005 | 295.9818 | 0.1214 | 714.0609 | 1.9945 | 204.3714 |
| IRL | 59.1550 | 55.2355 | 26,334.5672 | 8.8693 | 0.0034 | 282.8344 | 0.6870 | 720.5282 | 1.8207 | 318.4994 |
| ISR | 91.2030 | 290.6192 | 21,061.4823 | 23.1614 | 0.0008 | 292.8159 | 0.2026 | 507.2279 | 1.1623 | 67.9278 |
| ITA | 67.2220 | 193.6082 | 20,137.5912 | 18.0839 | 0.0029 | 285.9755 | 0.5266 | 414.2281 | 4.5311 | 242.0215 |
| JAM | 51.8140 | 245.1245 | 3392.1239 | 16.2660 | 0.0028 | 298.2675 | 0.7028 | 528.4640 | 0.4771 | 124.8375 |
| JPN | 78.6490 | 347.9918 | 39,169.3596 | 12.5862 | 0.0047 | 284.6239 | 0.5852 | 518.8859 | 2.7491 | 230.1247 |
| JOR | 78.2700 | 58.0518 | 1651.6218 | 26.7614 | 0.0002 | 292.2210 | 0.1132 | 660.0089 | 1.2624 | 66.0555 |
| KAZ | 56.0980 | 5.5131 | 1229.0012 | 15.1920 | 0.0010 | 280.1412 | 0.1870 | 564.2142 | 1.0764 | 250.5042 |
| KEN | 19.8920 | 56.1629 | 397.4827 | 16.3608 | 0.0013 | 298.2487 | 0.3205 | 939.0473 | 5.7940 | 101.6190 |
| KWT | 99.0000 | 114.7656 | 18,440.3785 | 52.6699 | 0.0003 | 299.0618 | 0.0839 | 677.1914 | 3.4631 | 26.9840 |
| KGZ | 35.2980 | 25.5391 | 279.6196 | 23.1515 | 0.0027 | 274.2499 | 0.1863 | 292.7439 | 1.6498 | 250.5258 |
| LAO | 21.9770 | 23.0663 | 325.1869 | 22.9004 | 0.0056 | 295.7368 | 0.6422 | 402.0839 | 5.1345 | 74.4398 |
| LVA | 68.0670 | 38.0660 | 3361.6409 | 14.9601 | 0.0019 | 280.6965 | 0.5192 | 580.0885 | 0.8342 | 179.7964 |
| LBN | 86.0000 | 375.6377 | 4491.6419 | 27.0500 | 0.0018 | 290.4683 | 0.3016 | 454.8156 | 0.5243 | 268.4361 |
| LSO | 19.5480 | 66.9567 | 436.4881 | 23.6788 | 0.0034 | 284.1797 | 0.3842 | 529.9560 | 0.9590 | 106.4457 |
| LBR | 44.3310 | 29.5727 | 306.8339 | 19.7021 | 0.0058 | 297.7780 | 0.5444 | 423.0724 | 5.6095 | 80.5398 |
| LBY | 76.3870 | 3.0451 | 7142.7718 | 34.1456 | 0.0001 | 294.7351 | 0.1071 | 613.1045 | 3.7460 | 107.4708 |
| LTU | 66.9860 | 55.8318 | 3293.2300 | 15.8328 | 0.0020 | 281.2286 | 0.5123 | 590.3737 | 1.7673 | 220.0129 |
| LUX | 84.2160 | 179.5473 | 48,659.5989 | 12.5844 | 0.0031 | 282.4963 | 0.6448 | 563.4920 | 3.4993 | 247.1581 |
| MKD | 58.5480 | 79.6834 | 1861.8981 | 30.2412 | 0.0014 | 284.0713 | 0.4836 | 494.2013 | 4.2231 | 243.0377 |
| MDG | 27.1210 | 27.1122 | 293.6072 | 9.9970 | 0.0039 | 295.6260 | 0.4926 | 612.3831 | 4.4417 | 85.8211 |
| MWI | 14.6100 | 118.2515 | 156.3858 | 16.3842 | 0.0040 | 294.5150 | 0.4333 | 576.2796 | 5.3808 | 86.4732 |
| MYS | 61.9770 | 70.5958 | 4043.6629 | 10.6796 | 0.0080 | 298.5966 | 0.7057 | 329.2694 | 1.1416 | 164.3602 |
| MLI | 28.3560 | 8.9711 | 270.5430 | 42.4320 | 0.0006 | 301.5000 | 0.1922 | 740.7580 | 6.2072 | 84.1524 |
| MLT | 92.3680 | 1219.0219 | 10,432.3281 | 13.7500 | 0.0010 | 292.3575 | 0.2484 | 612.6875 | 3.1328 | 228.2837 |
| MRT | 38.0910 | 2.5519 | 676.5690 | 52.1978 | 0.0002 | 300.4292 | 0.1116 | 674.1965 | 4.9332 | 86.6109 |
| MUS | 42.6700 | 584.6665 | 3929.0755 | 14.5286 | 0.0019 | 296.7129 | 0.6466 | 850.4476 | 4.5999 | 89.5251 |
| MEX | 74.7220 | 50.8757 | 7157.8145 | 13.9014 | 0.0020 | 293.8660 | 0.4250 | 641.3558 | 1.1471 | 247.7002 |
| MDA | 44.5890 | 101.8137 | 440.6720 | 18.1592 | 0.0015 | 284.0422 | 0.4543 | 586.3882 | 4.4783 | 245.3239 |
| MNG | 57.1330 | 1.5432 | 474.2171 | 14.7267 | 0.0007 | 273.8502 | 0.1689 | 588.8943 | 1.0681 | 270.4900 |
| MAR | 53.3350 | 64.5164 | 1334.9435 | 21.9904 | 0.0007 | 291.2152 | 0.1744 | 628.4530 | 1.6099 | 227.1025 |
| MOZ | 29.0980 | 22.5234 | 319.3596 | 16.5914 | 0.0033 | 296.3921 | 0.5950 | 632.4653 | 4.5914 | 89.7289 |
| MMR | 27.0250 | 71.4871 | 146.6046 | 24.3684 | 0.0067 | 296.0873 | 0.5785 | 391.8436 | 4.1761 | 74.0680 |
| NAM | 32.3730 | 2.1798 | 2185.6041 | 13.1942 | 0.0009 | 294.0247 | 0.2344 | 731.0292 | 3.3325 | 96.6204 |
| NPL | 13.3970 | 167.0115 | 229.4904 | 32.7714 | 0.0058 | 284.5282 | 0.4414 | 326.2043 | 2.6105 | 129.7383 |
| NLD | 76.7950 | 471.7273 | 26,214.4986 | 14.8299 | 0.0027 | 283.9303 | 0.6037 | 632.3657 | 2.1224 | 245.3230 |
| NZL | 86.0210 | 14.6508 | 13,641.1027 | 6.8349 | 0.0048 | 283.4144 | 0.6530 | 556.9278 | 5.1602 | 283.4279 |
| NIC | 55.1850 | 42.1249 | 1007.4998 | 16.0619 | 0.0039 | 297.8682 | 0.5990 | 649.7882 | 1.5067 | 242.0101 |
| NER | 16.1860 | 8.9457 | 197.8327 | 60.7594 | 0.0002 | 299.8333 | 0.1248 | 692.1315 | 7.1578 | 81.7072 |
| NGA | 34.8400 | 134.2643 | 567.9307 | 68.0144 | 0.0027 | 299.8735 | 0.4332 | 610.3793 | 6.8835 | 76.9425 |
| PRK | 59.4120 | 190.4250 | 462.0000 | 23.1494 | 0.0029 | 279.5835 | 0.4881 | 438.4716 | 3.0490 | 244.1590 |
| NOR | 76.0200 | 12.2958 | 38,131.4606 | 6.6647 | 0.0038 | 276.1095 | 0.3001 | 455.3105 | 2.3991 | 69.1475 |
| OMN | 71.5690 | 7.3279 | 8601.2719 | 63.8336 | 0.0000 | 301.0708 | 0.0980 | 611.3024 | 5.8749 | 39.3910 |
| PAK | 32.9820 | 184.6508 | 576.1956 | 49.0836 | 0.0008 | 293.1199 | 0.1628 | 590.8792 | 2.2058 | 267.5996 |
| PAN | 62.1980 | 40.7632 | 4060.3178 | 13.6348 | 0.0089 | 297.2569 | 0.5840 | 394.5247 | 0.7364 | 244.9138 |
| PNG | 13.2040 | 12.9126 | 602.1865 | 9.0796 | 0.0106 | 296.5839 | 0.6776 | 327.0453 | 5.1675 | 112.5378 |
| PRY | 55.3310 | 13.3984 | 1663.6049 | 17.9527 | 0.0040 | 296.6231 | 0.6604 | 635.5005 | 2.0899 | 119.2261 |
| PER | 73.0420 | 20.6718 | 1955.5880 | 24.1718 | 0.0059 | 291.4839 | 0.5188 | 357.6134 | 2.4140 | 153.8799 |
| PHL | 46.1350 | 261.5681 | 1072.8018 | 18.4934 | 0.0086 | 298.6937 | 0.6469 | 412.0124 | 6.9327 | 75.0888 |
| POL | 61.7160 | 124.9098 | 4501.4541 | 22.6760 | 0.0020 | 282.7454 | 0.5454 | 562.3428 | 3.1817 | 233.2714 |
| PRT | 54.3990 | 112.4579 | 11,526.3721 | 10.2574 | 0.0028 | 288.0355 | 0.4980 | 543.3709 | 3.9791 | 269.3716 |
| PRI | 94.3870 | 429.6060 | 16,192.1270 | 7.6076 | 0.0023 | 298.2824 | 0.6881 | 670.5095 | 3.6219 | 72.3817 |
| QAT | 96.3110 | 51.0307 | 29,976.1676 | 80.0247 | 0.0002 | 300.3638 | 0.0733 | 469.5788 | 4.9598 | 39.7064 |
| ROU | 53.0040 | 97.7013 | 1659.9076 | 19.8515 | 0.0017 | 283.4783 | 0.5147 | 470.6392 | 4.5113 | 243.7243 |
| RUS | 73.3500 | 8.9490 | 1771.5941 | 8.7891 | 0.0015 | 267.7990 | 0.3076 | 416.1997 | 1.8080 | 223.8098 |
| RWA | 14.9260 | 321.5925 | 260.6077 | 34.7283 | 0.0039 | 291.8890 | 0.5219 | 571.9293 | 6.1396 | 89.7848 |
| SAU | 79.8480 | 9.6125 | 9171.3315 | 56.2450 | 0.0001 | 298.8600 | 0.0978 | 757.0784 | 5.4815 | 57.9364 |
| SEN | 40.3200 | 50.8894 | 613.7324 | 49.8031 | 0.0014 | 301.5726 | 0.3611 | 579.2657 | 6.4565 | 81.4271 |
| SCG | 55.6565 | 65.4590 | 1270.9292 | 22.7359 | 0.0016 | 284.7935 | 0.5190 | 522.1836 | 4.5595 | 241.4637 |
| SLE | 35.6260 | 63.5158 | 138.6987 | 26.1347 | 0.0070 | 298.6507 | 0.6086 | 463.2504 | 6.1708 | 75.8043 |
| SGP | 100.0000 | 6011.7716 | 23,852.3270 | 16.5333 | 0.0075 | 299.7349 | 0.3583 | 396.5966 | 0.0295 | 310.9979 |
| SVK | 56.2330 | 112.0316 | 5426.6243 | 22.8983 | 0.0023 | 282.2880 | 0.5555 | 488.4059 | 4.5387 | 238.1577 |
| SVN | 50.7540 | 98.7550 | 10,201.3035 | 19.5636 | 0.0036 | 283.2516 | 0.6602 | 407.7590 | 4.6899 | 240.2064 |
| SLB | 15.8130 | 14.7433 | 1017.3997 | 6.6717 | 0.0099 | 298.9251 | 0.7601 | 427.6718 | 7.3600 | 113.8153 |
| SOM | 33.2470 | 14.1426 | 138.0000 | 24.1472 | 0.0007 | 299.4842 | 0.2422 | 950.0417 | 5.2746 | 93.1439 |
| ZAF | 56.8910 | 37.0687 | 3374.7184 | 15.8417 | 0.0020 | 290.3620 | 0.3521 | 634.4547 | 1.4766 | 122.9264 |
| KOR | 79.6210 | 487.3327 | 12,256.9936 | 21.5060 | 0.0034 | 285.0842 | 0.5530 | 506.4678 | 3.5008 | 235.0233 |
| ESP | 76.2620 | 81.2983 | 14,749.6874 | 11.6369 | 0.0019 | 287.0505 | 0.4220 | 587.5106 | 4.1237 | 261.1680 |
| LKA | 18.3800 | 299.4356 | 869.6963 | 19.0157 | 0.0048 | 299.2747 | 0.6486 | 604.7394 | 1.5733 | 117.1275 |
| SDN | 32.4950 | 10.9920 | 366.1727 | 34.7812 | 0.0011 | 299.9408 | 0.2570 | 705.5234 | 7.3465 | 75.2464 |
| SUR | 66.4440 | 3.0189 | 2012.2817 | 12.6231 | 0.0052 | 298.5469 | 0.7257 | 517.6283 | 0.5135 | 112.1216 |
| SWE | 84.0260 | 21.6214 | 29,624.9127 | 6.2024 | 0.0026 | 277.2268 | 0.4447 | 532.5994 | 1.3699 | 89.5126 |
| CHE | 73.3830 | 181.7693 | 38,952.0342 | 14.2803 | 0.0047 | 279.5672 | 0.4802 | 348.6885 | 4.4889 | 244.4236 |
| SYR | 51.9470 | 89.2962 | 4910.7777 | 35.0439 | 0.0007 | 291.8141 | 0.1419 | 648.5038 | 1.2378 | 276.7992 |
| TJK | 26.5010 | 44.4150 | 138.4291 | 20.6490 | 0.0018 | 272.7145 | 0.1199 | 333.8860 | 0.9743 | 236.1803 |
| TZA | 22.3090 | 37.8180 | 410.9524 | 16.9708 | 0.0027 | 295.6497 | 0.4592 | 712.6197 | 6.0892 | 89.5988 |
| THA | 31.3860 | 123.2215 | 2007.7353 | 21.6337 | 0.0053 | 298.9750 | 0.5636 | 454.1186 | 5.9974 | 98.3362 |
| BHS | 82.0070 | 29.7747 | 27,098.1563 | 8.9429 | 0.0019 | 297.8790 | 0.4217 | 753.1452 | 1.1274 | 177.7540 |
| GMB | 47.8680 | 130.2083 | 594.1494 | 47.3966 | 0.0020 | 300.6097 | 0.4439 | 492.6517 | 6.5275 | 80.7165 |
| TLS | 24.2630 | 59.4732 | 415.0859 | 11.1325 | 0.0052 | 297.6300 | 0.6283 | 418.8668 | 0.5893 | 65.4982 |
| TGO | 32.9070 | 90.5388 | 302.9586 | 45.5305 | 0.0033 | 299.9210 | 0.5112 | 575.6099 | 6.5277 | 76.7960 |
| TTO | 23.0120 | 247.0096 | 6435.1342 | 16.1513 | 0.0037 | 298.9956 | 0.7225 | 656.3816 | 0.9006 | 95.0152 |
| TUN | 63.4320 | 62.4894 | 2211.8350 | 26.7292 | 0.0004 | 293.3065 | 0.1652 | 567.7196 | 2.4768 | 214.9042 |
| TUR | 64.7410 | 82.1696 | 4337.4780 | 27.5412 | 0.0018 | 284.2063 | 0.3164 | 508.6591 | 2.6696 | 262.8761 |
| TKM | 45.9130 | 9.6102 | 643.1754 | 38.3680 | 0.0004 | 289.8442 | 0.1026 | 592.8558 | 1.6951 | 261.2224 |
| UGA | 14.7860 | 118.3632 | 261.8691 | 26.2175 | 0.0037 | 296.1132 | 0.5103 | 571.3354 | 5.8946 | 100.5396 |
| UKR | 67.1450 | 84.8822 | 658.3486 | 18.6947 | 0.0018 | 282.4762 | 0.4637 | 554.5069 | 4.1270 | 244.4423 |
| ARE | 80.2360 | 44.1294 | 33,291.3663 | 63.9781 | 0.0000 | 300.9181 | 0.0994 | 538.2136 | 5.1435 | 33.8981 |
| GBR | 78.6510 | 243.4279 | 28,223.0676 | 10.5769 | 0.0034 | 282.5327 | 0.6028 | 660.2248 | 2.0750 | 228.4969 |
| USA | 79.0570 | 30.7973 | 36,329.9561 | 8.1234 | 0.0021 | 280.6254 | 0.3747 | 549.6992 | 1.0730 | 182.9310 |
| URY | 92.0280 | 18.9677 | 6875.0255 | 10.8090 | 0.0041 | 290.4875 | 0.6370 | 577.5936 | 0.6709 | 158.1804 |
| UZB | 46.1260 | 57.9464 | 558.2268 | 32.6027 | 0.0005 | 286.6472 | 0.1388 | 587.7854 | 0.9237 | 239.2938 |
| VUT | 21.6730 | 15.1734 | 1470.6359 | 7.8214 | 0.0083 | 298.2466 | 0.7490 | 565.9593 | 6.9639 | 109.6799 |
| VEN | 87.5590 | 27.4275 | 4842.0366 | 16.6986 | 0.0059 | 297.9843 | 0.6371 | 492.0027 | 0.6772 | 209.1847 |
| VNM | 24.3740 | 256.8971 | 390.0933 | 21.7131 | 0.0057 | 296.5575 | 0.5708 | 424.6761 | 5.5972 | 88.0971 |
| YEM | 26.2670 | 32.9736 | 554.4487 | 49.7422 | 0.0004 | 298.8508 | 0.1278 | 744.9897 | 7.6840 | 61.2422 |
| ZMB | 34.8020 | 14.0114 | 345.6896 | 19.4540 | 0.0033 | 294.8242 | 0.5256 | 722.4590 | 4.9860 | 87.8069 |
| ZWE | 33.7580 | 30.7134 | 563.0575 | 15.4038 | 0.0030 | 293.8599 | 0.4818 | 663.2904 | 3.9495 | 92.1134 |
Table A2.
Year-wise mean value of all the parameters in 2010.
Table A2.
Year-wise mean value of all the parameters in 2010.
| County | UR | PD | GDP_per | PM25 | TP | T2M | NDVI | BLH | WS | WD |
|---|---|---|---|---|---|---|---|---|---|---|
| AFG | 23.7370 | 44.7041 | 543.3065 | 40.7204 | 0.0009 | 286.4250 | 0.1258 | 582.9946 | 1.5712 | 238.5367 |
| ALB | 59.7830 | 18.7345 | 3497.9745 | 20.5700 | 0.0056 | 286.2711 | 0.4979 | 411.7556 | 4.2603 | 261.3849 |
| DZA | 52.1630 | 106.3146 | 4094.3484 | 37.7796 | 0.0002 | 297.8995 | 0.1255 | 782.0035 | 2.4855 | 135.5287 |
| AGO | 84.0870 | 120.3886 | 33,893.2773 | 27.3842 | 0.0033 | 295.5125 | 0.5584 | 606.2822 | 4.8289 | 86.5153 |
| ARG | 90.8490 | 14.9043 | 10,385.9644 | 16.5901 | 0.0019 | 287.1481 | 0.3549 | 704.5626 | 4.1713 | 196.0700 |
| ARM | 63.4400 | 101.0648 | 3218.3783 | 29.5612 | 0.0026 | 281.4223 | 0.3561 | 382.7114 | 3.7551 | 279.0243 |
| AUS | 85.1820 | 2.8679 | 52,087.9723 | 5.4536 | 0.0017 | 294.7844 | 0.3313 | 773.0299 | 1.6386 | 101.3626 |
| AUT | 57.3990 | 101.2874 | 46,903.7616 | 15.5127 | 0.0036 | 279.2503 | 0.4544 | 423.9552 | 3.7114 | 270.2746 |
| AZE | 53.4060 | 109.5423 | 5843.5338 | 29.3589 | 0.0013 | 288.2518 | 0.2954 | 409.4935 | 3.4296 | 293.1673 |
| BGD | 10.6420 | 337.8351 | 234.2355 | 65.4100 | 0.0063 | 298.9940 | 0.4803 | 452.3087 | 3.5927 | 85.0009 |
| BLR | 97.6510 | 359.8278 | 44,184.9464 | 18.9133 | 0.0022 | 280.0730 | 0.4540 | 504.5311 | 2.7671 | 265.3468 |
| BEL | 43.0930 | 81.5826 | 1036.5345 | 15.9062 | 0.0025 | 282.2197 | 0.5250 | 550.7787 | 2.0266 | 278.5898 |
| BLZ | 24.6330 | 57.0366 | 647.8361 | 16.4686 | 0.0039 | 298.7081 | 0.7285 | 567.6204 | 1.6053 | 230.9991 |
| BEN | 30.4620 | 1133.7131 | 781.1536 | 36.8136 | 0.0030 | 301.2797 | 0.5018 | 622.5555 | 7.4702 | 72.5202 |
| BTN | 72.3020 | 68.1245 | 6853.0029 | 21.1219 | 0.0099 | 280.5868 | 0.5184 | 270.8777 | 1.6595 | 89.9351 |
| BOL | 82.4270 | 35.4581 | 28,443.8885 | 34.8114 | 0.0035 | 293.7833 | 0.5590 | 606.6375 | 3.1015 | 162.1895 |
| BIH | 45.5580 | 72.3726 | 4635.5102 | 30.3548 | 0.0043 | 283.3393 | 0.5302 | 428.5856 | 4.4372 | 266.4097 |
| BWA | 74.6720 | 46.7414 | 6033.6862 | 23.4656 | 0.0015 | 295.2420 | 0.3574 | 725.7447 | 5.1183 | 99.7233 |
| BRA | 45.2280 | 14.1370 | 4304.1111 | 19.1522 | 0.0046 | 298.4231 | 0.6565 | 527.3657 | 1.5089 | 132.6561 |
| BRN | 66.4300 | 9.2759 | 1955.4602 | 8.5111 | 0.0086 | 300.1388 | 0.7268 | 350.6426 | 0.5654 | 87.0220 |
| BGR | 84.3350 | 23.4159 | 11,286.0715 | 23.9984 | 0.0024 | 284.7768 | 0.5340 | 443.5187 | 4.8532 | 260.0481 |
| BFA | 74.9610 | 73.7446 | 35,270.6421 | 37.8638 | 0.0019 | 302.3370 | 0.3541 | 665.5900 | 7.7266 | 73.5709 |
| BDI | 34.7930 | 17.9842 | 2258.1864 | 36.2426 | 0.0048 | 294.1609 | 0.5589 | 529.2802 | 6.5576 | 94.0927 |
| KHM | 62.4120 | 3.5063 | 6434.8125 | 19.4808 | 0.0047 | 301.0983 | 0.5857 | 528.4165 | 6.1715 | 69.9110 |
| CMR | 38.9040 | 7.0416 | 488.4217 | 39.3817 | 0.0045 | 298.2797 | 0.5566 | 514.8801 | 6.4620 | 84.5962 |
| CAN | 80.9370 | 3.7928 | 47,562.0834 | 4.0408 | 0.0016 | 269.5186 | 0.2325 | 418.8888 | 1.0153 | 226.3978 |
| CAF | 73.6070 | 198.0188 | 77,117.1260 | 30.2462 | 0.0037 | 299.2786 | 0.6538 | 569.4739 | 6.2528 | 84.2769 |
| TCD | 87.0740 | 22.9479 | 12,724.1041 | 47.5292 | 0.0009 | 301.2740 | 0.2104 | 711.4191 | 7.3593 | 74.7617 |
| CHL | 49.2260 | 141.9361 | 4550.4531 | 17.1131 | 0.0044 | 282.1471 | 0.3218 | 530.3233 | 6.4737 | 222.0735 |
| CHN | 47.3300 | 64.5690 | 1701.4757 | 33.5316 | 0.0022 | 279.8398 | 0.2917 | 562.5896 | 1.5989 | 224.9424 |
| COL | 51.5590 | 43.0311 | 1352.3023 | 19.6749 | 0.0100 | 297.4497 | 0.6436 | 334.4057 | 0.9222 | 123.3522 |
| COM | 40.0130 | 28.4792 | 334.0216 | 12.2778 | 0.0026 | 298.7503 | 0.6891 | 594.0341 | 6.9941 | 90.0638 |
| COG | 63.2560 | 12.5146 | 3076.5564 | 38.5241 | 0.0039 | 298.2270 | 0.6236 | 411.5523 | 5.6358 | 88.5784 |
| COD | 77.9640 | 40.7595 | 6336.7095 | 40.1152 | 0.0044 | 297.6502 | 0.7110 | 448.2185 | 5.8985 | 89.9481 |
| CRI | 27.9730 | 370.6051 | 1316.4912 | 17.5967 | 0.0130 | 296.7344 | 0.6700 | 357.9722 | 0.7398 | 225.9937 |
| CIV | 71.7360 | 89.6469 | 8227.1275 | 22.6921 | 0.0037 | 299.9743 | 0.5623 | 559.6354 | 6.9273 | 74.5711 |
| HRV | 76.5970 | 105.4663 | 5305.8836 | 20.5528 | 0.0039 | 284.4250 | 0.5424 | 440.8613 | 4.2722 | 267.6474 |
| CUB | 67.5510 | 120.4131 | 31,023.6387 | 9.7600 | 0.0028 | 298.1095 | 0.6683 | 664.9447 | 0.5620 | 194.1925 |
| CYP | 73.2550 | 135.6086 | 19,960.0685 | 22.8102 | 0.0010 | 293.8294 | 0.3730 | 511.1199 | 1.8997 | 273.7738 |
| CZE | 76.9660 | 234.6069 | 41,572.4560 | 20.1978 | 0.0026 | 280.3871 | 0.4437 | 504.3881 | 3.2755 | 275.2004 |
| DNK | 76.9990 | 36.2465 | 1343.2751 | 1.8124 | 0.0009 | 256.2492 | −0.0304 | 209.7019 | 0.9164 | 148.4681 |
| DJI | 68.0940 | 94.5027 | 6967.3650 | 34.4946 | 0.0007 | 301.5621 | 0.1089 | 806.9927 | 7.5302 | 60.3222 |
| DMA | 86.7950 | 130.7491 | 58,041.3984 | 13.8750 | 0.0033 | 299.8107 | 0.7526 | 728.0241 | 1.3721 | 38.2577 |
| DOM | 73.7530 | 200.6855 | 5555.3920 | 12.5096 | 0.0035 | 297.4771 | 0.6906 | 484.9965 | 1.8477 | 112.2349 |
| ECU | 67.5400 | 15.1055 | 4480.7863 | 18.8808 | 0.0083 | 294.1817 | 0.5549 | 341.0703 | 0.5654 | 263.1343 |
| EGY | 62.6900 | 60.4409 | 4633.5913 | 48.1878 | 0.0000 | 297.6498 | 0.1154 | 601.6020 | 3.4849 | 79.6426 |
| SLV | 43.0190 | 83.1395 | 2645.9688 | 27.8099 | 0.0060 | 298.2016 | 0.6729 | 531.1998 | 1.1308 | 210.9113 |
| GNQ | 35.1750 | 31.3905 | 501.3553 | 34.2131 | 0.0072 | 297.5292 | 0.4614 | 374.2530 | 5.8789 | 89.9145 |
| ERI | 78.4420 | 93.1519 | 30,532.4805 | 34.7674 | 0.0009 | 300.5296 | 0.1592 | 710.7175 | 8.2645 | 66.4203 |
| EST | 68.0940 | 31.4101 | 14,663.0446 | 10.4435 | 0.0022 | 278.0834 | 0.4123 | 486.3156 | 0.8620 | 99.9942 |
| ETH | 17.3190 | 77.6088 | 341.5541 | 22.4263 | 0.0029 | 296.6997 | 0.3831 | 750.3512 | 5.8186 | 82.3852 |
| FJI | 83.7700 | 17.6484 | 46,505.3032 | 6.3517 | 0.0055 | 298.0352 | 0.7669 | 543.7714 | 6.7525 | 127.0238 |
| FIN | 52.1710 | 47.0616 | 3652.5359 | 6.6236 | 0.0018 | 274.2084 | 0.4011 | 485.6330 | 0.7865 | 92.5167 |
| FRA | 78.3690 | 118.7593 | 40,677.9851 | 14.5677 | 0.0026 | 283.5292 | 0.5657 | 550.2120 | 3.0208 | 266.7231 |
| GAB | 85.5330 | 6.3032 | 8849.3226 | 28.6259 | 0.0050 | 298.1025 | 0.4853 | 418.5210 | 5.4973 | 84.8032 |
| GEO | 81.3020 | 259.4402 | 39,688.6150 | 23.0475 | 0.0037 | 282.8617 | 0.4921 | 322.5517 | 4.1843 | 270.0103 |
| DEU | 55.5350 | 66.2496 | 3233.2959 | 15.0321 | 0.0026 | 281.2116 | 0.4723 | 552.1991 | 2.5113 | 287.3649 |
| GHA | 50.7130 | 108.9022 | 1299.3452 | 28.2610 | 0.0032 | 301.0210 | 0.5140 | 574.2501 | 7.0283 | 73.9627 |
| GRC | 33.6780 | 41.4788 | 672.4249 | 17.8012 | 0.0027 | 288.3139 | 0.5350 | 487.4592 | 3.8180 | 257.7429 |
| GTM | 55.6620 | 177.1936 | 860.6364 | 23.6332 | 0.0060 | 296.2301 | 0.6984 | 460.7317 | 1.6965 | 211.6805 |
| GIN | 40.1110 | 54.1466 | 558.1747 | 29.9936 | 0.0047 | 299.5000 | 0.5690 | 554.3768 | 7.3328 | 73.9678 |
| GNB | 65.9400 | 33.6414 | 17,288.8413 | 34.3831 | 0.0034 | 301.2685 | 0.5760 | 506.7190 | 7.2528 | 75.1912 |
| GUY | 76.2920 | 86.2788 | 26,716.6488 | 19.2081 | 0.0063 | 298.5927 | 0.6857 | 436.3221 | 1.3986 | 83.1539 |
| HTI | 48.4030 | 133.0691 | 2852.5473 | 13.6283 | 0.0035 | 298.5115 | 0.6289 | 482.3432 | 2.5021 | 108.7013 |
| HND | 26.6340 | 3.8071 | 4580.6988 | 23.7494 | 0.0054 | 296.6075 | 0.7097 | 459.8782 | 1.3912 | 242.3355 |
| HUN | 51.8850 | 74.3361 | 1904.3472 | 19.8155 | 0.0029 | 283.6719 | 0.4845 | 461.2708 | 4.2378 | 269.3359 |
| ISL | 55.1550 | 76.7589 | 14,067.5231 | 5.1105 | 0.0029 | 275.2911 | 0.1557 | 474.0290 | 0.4757 | 176.7534 |
| IND | 47.5090 | 361.0057 | 1191.9727 | 45.5661 | 0.0039 | 297.2297 | 0.4219 | 558.1978 | 1.6909 | 171.6800 |
| IDN | 68.9110 | 110.4609 | 13,223.0830 | 13.8318 | 0.0104 | 298.5568 | 0.7013 | 303.7251 | 1.4201 | 96.7373 |
| IRN | 49.9140 | 133.4943 | 3122.3627 | 41.0969 | 0.0006 | 292.3816 | 0.1351 | 714.8023 | 4.3480 | 308.9607 |
| IRQ | 30.9300 | 415.1370 | 1357.5637 | 56.5689 | 0.0004 | 297.6370 | 0.1351 | 697.2399 | 2.0903 | 268.1486 |
| IRL | 61.5420 | 66.1947 | 48,655.3662 | 9.2998 | 0.0025 | 281.7896 | 0.6377 | 605.3116 | 0.7395 | 278.0849 |
| ISR | 70.6260 | 45.2875 | 6599.6609 | 27.3870 | 0.0006 | 294.8444 | 0.2070 | 490.9759 | 0.8147 | 126.4837 |
| ITA | 69.1030 | 68.4794 | 4657.2803 | 16.5809 | 0.0037 | 285.2070 | 0.5284 | 421.8136 | 3.7691 | 264.5229 |
| JAM | 93.5740 | 3.1725 | 43,237.0730 | 16.8277 | 0.0042 | 298.7094 | 0.7376 | 518.1663 | 0.5266 | 123.4435 |
| JPN | 91.8260 | 352.2921 | 30,780.0238 | 10.3896 | 0.0052 | 285.1543 | 0.5632 | 537.7658 | 2.9139 | 242.7836 |
| JOR | 68.3270 | 201.5279 | 36,035.6450 | 33.6382 | 0.0002 | 294.4903 | 0.1226 | 655.6845 | 0.9674 | 164.3673 |
| KAZ | 53.7430 | 259.5073 | 4704.0478 | 17.1464 | 0.0008 | 280.3791 | 0.1589 | 574.3142 | 1.0340 | 234.9184 |
| KEN | 86.0880 | 81.7925 | 3736.6455 | 18.7693 | 0.0020 | 298.6075 | 0.3634 | 887.2977 | 6.0978 | 108.3308 |
| KWT | 90.8120 | 351.3580 | 44,968.1562 | 55.6635 | 0.0001 | 300.5263 | 0.0848 | 676.3921 | 2.7809 | 16.7101 |
| KGZ | 56.8270 | 6.0458 | 9070.4883 | 23.1768 | 0.0029 | 274.8617 | 0.1842 | 273.0803 | 1.6108 | 242.2357 |
| LAO | 23.5710 | 73.8495 | 1080.2962 | 31.7077 | 0.0052 | 296.6715 | 0.6831 | 428.5346 | 4.3811 | 73.6964 |
| LVA | 35.3060 | 28.4041 | 880.0378 | 16.8554 | 0.0024 | 278.7494 | 0.4569 | 504.1107 | 1.3196 | 292.6289 |
| LBN | 20.2940 | 81.0798 | 785.5027 | 29.4808 | 0.0013 | 292.1864 | 0.3321 | 454.8625 | 1.4076 | 292.7077 |
| LSO | 81.9360 | 509.8160 | 23,087.2256 | 30.9382 | 0.0029 | 285.4497 | 0.3767 | 618.2869 | 2.3187 | 101.5551 |
| LBR | 100.0000 | 167.8947 | 38,577.4983 | 20.8104 | 0.0069 | 298.3473 | 0.5726 | 405.1455 | 6.4145 | 76.4804 |
| LBY | 30.0640 | 27.0761 | 1141.2357 | 44.9146 | 0.0000 | 297.0999 | 0.1089 | 639.5184 | 2.9280 | 99.6819 |
| LTU | 87.3340 | 484.1705 | 7761.6415 | 18.8983 | 0.0024 | 279.3566 | 0.4402 | 519.3005 | 2.1780 | 299.6535 |
| LUX | 47.8130 | 40.4003 | 513.4456 | 14.5062 | 0.0026 | 280.9109 | 0.5379 | 537.4608 | 2.4119 | 274.8031 |
| MKD | 78.0520 | 3.5223 | 12,162.6687 | 28.5769 | 0.0027 | 284.4014 | 0.5094 | 489.8313 | 4.4800 | 261.3908 |
| MDG | 18.2260 | 323.1022 | 2799.6487 | 14.2395 | 0.0037 | 296.2955 | 0.4989 | 612.5914 | 5.9437 | 87.6547 |
| MWI | 24.7980 | 65.7304 | 1119.8436 | 23.1781 | 0.0035 | 295.1841 | 0.4354 | 583.2161 | 5.9511 | 86.2580 |
| MYS | 66.7570 | 49.4181 | 11,987.5084 | 11.8684 | 0.0085 | 299.0985 | 0.7260 | 322.4270 | 1.0603 | 164.5732 |
| MLI | 88.5470 | 208.6226 | 110,885.9914 | 43.6481 | 0.0008 | 302.9405 | 0.1930 | 734.4775 | 6.4881 | 78.4974 |
| MLT | 67.8410 | 33.7011 | 11,420.9940 | 14.7000 | 0.0010 | 292.4508 | 0.2650 | 644.2999 | 2.3978 | 252.1285 |
| MRT | 58.0180 | 72.4701 | 2839.9260 | 49.4271 | 0.0002 | 301.7911 | 0.1163 | 667.7209 | 5.5606 | 80.9139 |
| MUS | 42.6200 | 99.7486 | 2437.5377 | 14.9643 | 0.0018 | 297.6239 | 0.6674 | 832.2022 | 6.3819 | 91.2177 |
| MEX | 31.9380 | 36.3718 | 471.9592 | 10.7505 | 0.0025 | 293.5143 | 0.4538 | 622.6082 | 1.0130 | 242.3290 |
| MDA | 77.8150 | 58.6913 | 9271.3984 | 17.1430 | 0.0021 | 283.4861 | 0.4243 | 511.0675 | 4.9533 | 261.5537 |
| MNG | 57.0890 | 81.4831 | 4577.6888 | 20.3286 | 0.0007 | 273.3294 | 0.1509 | 605.1658 | 1.1409 | 292.6526 |
| MAR | 35.9990 | 12.3336 | 710.2743 | 23.8466 | 0.0013 | 291.8975 | 0.2227 | 635.2521 | 1.2974 | 212.5027 |
| MOZ | 94.0720 | 1295.3375 | 21,799.1743 | 21.1780 | 0.0024 | 297.3460 | 0.5703 | 681.6963 | 5.5648 | 90.3917 |
| MMR | 28.8850 | 77.4589 | 746.9454 | 32.3807 | 0.0063 | 297.0950 | 0.5897 | 425.0941 | 3.4974 | 70.7156 |
| NAM | 67.5670 | 1.7508 | 2643.2871 | 17.8317 | 0.0011 | 294.6526 | 0.2440 | 706.3795 | 4.9635 | 100.6480 |
| NPL | 31.8300 | 29.9239 | 471.9044 | 33.6434 | 0.0058 | 285.5679 | 0.4564 | 352.1509 | 2.0649 | 125.1047 |
| NLD | 46.5880 | 3.3901 | 1610.9206 | 15.4084 | 0.0024 | 282.1098 | 0.5103 | 561.5207 | 1.7501 | 294.1775 |
| NZL | 41.5550 | 615.9606 | 8000.3764 | 7.6132 | 0.0050 | 283.7062 | 0.6549 | 537.2214 | 5.1672 | 278.0932 |
| NIC | 15.5440 | 154.2173 | 478.6687 | 17.8166 | 0.0056 | 298.5502 | 0.6385 | 554.3769 | 1.0923 | 236.3933 |
| NER | 70.9120 | 85.8561 | 9040.5685 | 61.9910 | 0.0003 | 301.7717 | 0.1266 | 706.7643 | 6.9274 | 78.2103 |
| NGA | 41.6160 | 2.5737 | 5394.9967 | 54.4786 | 0.0030 | 300.9623 | 0.4178 | 611.8713 | 7.4695 | 74.0082 |
| PRK | 16.2210 | 12.9976 | 476.8695 | 22.1498 | 0.0039 | 279.6718 | 0.4537 | 457.9945 | 3.6046 | 257.7851 |
| NOR | 43.4800 | 174.0321 | 2280.4373 | 6.2609 | 0.0030 | 273.7207 | 0.2744 | 397.2826 | 2.4269 | 39.2756 |
| OMN | 56.9170 | 48.3967 | 1503.8722 | 54.1434 | 0.0001 | 301.6586 | 0.1020 | 634.2790 | 5.6934 | 35.3926 |
| PAK | 87.1340 | 492.5999 | 50,999.7451 | 50.6556 | 0.0013 | 293.5166 | 0.1867 | 552.6995 | 2.3629 | 265.0578 |
| PAN | 79.1020 | 13.3863 | 87,693.7901 | 14.9683 | 0.0112 | 298.2721 | 0.6080 | 377.9468 | 0.7914 | 191.1319 |
| PNG | 16.7680 | 188.4423 | 592.4012 | 14.3755 | 0.0110 | 297.0078 | 0.7099 | 320.3813 | 5.4797 | 117.6067 |
| PRY | 86.1600 | 16.5231 | 33,676.7741 | 17.6271 | 0.0034 | 296.7699 | 0.6201 | 662.0198 | 2.1740 | 124.1355 |
| PER | 75.1610 | 9.8269 | 21,369.3530 | 29.1773 | 0.0053 | 292.2713 | 0.5492 | 380.9177 | 2.8653 | 173.1772 |
| PHL | 34.9970 | 232.7530 | 987.4097 | 19.1501 | 0.0070 | 299.4058 | 0.6799 | 428.2899 | 5.6060 | 81.2701 |
| POL | 65.1400 | 49.0004 | 8082.0162 | 25.3577 | 0.0026 | 280.6870 | 0.4420 | 514.8395 | 3.0274 | 283.8089 |
| PRT | 76.4300 | 22.6779 | 5082.3537 | 8.3592 | 0.0030 | 288.2484 | 0.5331 | 555.1662 | 2.6697 | 268.5799 |
| PRI | 45.3320 | 315.1450 | 2217.4722 | 6.3975 | 0.0040 | 299.0158 | 0.7279 | 582.3037 | 3.2937 | 91.3208 |
| QAT | 13.0190 | 16.1430 | 1949.3512 | 77.0309 | 0.0001 | 301.2879 | 0.0789 | 432.1830 | 4.5870 | 35.5800 |
| ROU | 60.8920 | 124.2092 | 12,613.0110 | 18.2238 | 0.0027 | 282.9693 | 0.5020 | 410.9185 | 4.9553 | 263.3766 |
| RUS | 93.8250 | 419.5631 | 26,435.7488 | 8.9189 | 0.0015 | 267.9939 | 0.2840 | 439.2652 | 1.5646 | 181.0101 |
| RWA | 60.3770 | 203.8771 | 571.0000 | 37.3556 | 0.0047 | 292.6306 | 0.5793 | 527.0604 | 6.2825 | 94.5689 |
| SAU | 59.2610 | 15.7262 | 4342.0658 | 62.9081 | 0.0001 | 300.0993 | 0.0997 | 788.9404 | 4.8292 | 59.2396 |
| SEN | 98.5010 | 159.8905 | 67,403.0877 | 42.2514 | 0.0015 | 302.3778 | 0.3715 | 584.6552 | 7.0620 | 77.3037 |
| SCG | 53.8290 | 88.0107 | 8214.0769 | 23.0210 | 0.0031 | 284.1093 | 0.5089 | 461.0485 | 4.6190 | 264.2004 |
| SLE | 73.6870 | 8.7226 | 10,674.9961 | 25.4695 | 0.0068 | 299.0767 | 0.6069 | 454.3014 | 6.9283 | 73.9357 |
| SGP | 16.9340 | 406.9452 | 609.7543 | 12.7667 | 0.0077 | 300.3449 | 0.3782 | 382.4692 | 0.0733 | 266.9524 |
| SVK | 82.0840 | 12.7560 | 19,262.5476 | 22.4561 | 0.0032 | 281.0620 | 0.5077 | 448.5882 | 3.8797 | 272.7194 |
| SVN | 59.5665 | 64.7115 | 6211.9526 | 18.5665 | 0.0041 | 282.1086 | 0.5702 | 409.4799 | 4.0335 | 268.6721 |
| SLB | 33.0890 | 13.9218 | 1683.2119 | 9.4798 | 0.0101 | 299.4975 | 0.7754 | 473.4059 | 7.5332 | 116.0296 |
| SOM | 43.7730 | 65.8502 | 1271.5833 | 20.5293 | 0.0006 | 300.1017 | 0.2314 | 962.1868 | 5.2201 | 95.2566 |
| ZAF | 100.0000 | 7231.8120 | 47,236.9602 | 20.4826 | 0.0015 | 291.3567 | 0.3396 | 687.0730 | 2.5442 | 97.3376 |
| KOR | 20.0480 | 18.8589 | 1604.1489 | 21.4609 | 0.0033 | 285.1610 | 0.5397 | 509.4174 | 4.2969 | 251.6809 |
| ESP | 38.8560 | 88.8838 | 401.8349 | 9.9437 | 0.0023 | 286.5493 | 0.4453 | 592.2915 | 2.7447 | 263.7488 |
| LKA | 65.4520 | 298.4497 | 2983.2288 | 25.3155 | 0.0060 | 299.8506 | 0.6618 | 586.3166 | 1.3345 | 166.5525 |
| SDN | 39.3100 | 19.1983 | 340.0000 | 38.9988 | 0.0011 | 301.3470 | 0.2519 | 738.0433 | 7.3270 | 74.6513 |
| SUR | 64.9520 | 187.8875 | 1090.2608 | 16.9544 | 0.0063 | 299.2193 | 0.7294 | 472.5307 | 2.1512 | 82.3240 |
| SWE | 66.3440 | 3.3918 | 8255.8749 | 5.7732 | 0.0021 | 274.3062 | 0.3890 | 469.8716 | 1.5591 | 71.7317 |
| CHE | 54.6850 | 112.1089 | 16,841.7677 | 14.9906 | 0.0045 | 278.4398 | 0.3945 | 363.3662 | 3.4651 | 266.6112 |
| SYR | 52.6580 | 101.6858 | 23,532.4809 | 40.9309 | 0.0005 | 293.6260 | 0.1708 | 645.8788 | 2.0639 | 292.5738 |
| TJK | 85.0560 | 22.8545 | 52,869.0443 | 21.2128 | 0.0022 | 273.5668 | 0.1295 | 293.0872 | 0.9914 | 233.3864 |
| TZA | 55.6000 | 116.3347 | 1182.6078 | 23.7108 | 0.0027 | 296.2039 | 0.4929 | 700.7487 | 6.6704 | 92.9072 |
| THA | 21.9850 | 9.4918 | 892.5689 | 27.1362 | 0.0046 | 299.9986 | 0.5820 | 490.1417 | 4.6816 | 99.8046 |
| BHS | 37.5330 | 118.0672 | 534.0448 | 7.7060 | 0.0028 | 297.7795 | 0.4434 | 807.5737 | 1.2382 | 185.8730 |
| GMB | 43.8560 | 131.5254 | 5076.3399 | 40.4773 | 0.0023 | 301.3224 | 0.4435 | 489.6556 | 7.1401 | 76.6141 |
| TLS | 26.5200 | 53.7825 | 749.5524 | 11.6718 | 0.0056 | 298.3395 | 0.6927 | 383.0494 | 0.8008 | 89.9006 |
| TGO | 48.4910 | 10.8255 | 4439.2021 | 32.3445 | 0.0035 | 300.6441 | 0.5188 | 549.1817 | 7.1811 | 72.9087 |
| TTO | 27.7320 | 73.5385 | 806.4143 | 18.2077 | 0.0043 | 300.0594 | 0.7054 | 621.9412 | 2.2701 | 65.9014 |
| TUN | 54.0250 | 258.8975 | 16,683.3931 | 26.6958 | 0.0006 | 293.7851 | 0.1735 | 608.7419 | 1.5471 | 233.4501 |
| TUR | 66.6570 | 68.4555 | 4344.6194 | 30.0736 | 0.0022 | 286.3770 | 0.3624 | 541.6698 | 3.8240 | 268.8586 |
| TKM | 70.8250 | 93.9763 | 10,742.7750 | 35.6079 | 0.0004 | 290.5273 | 0.1137 | 568.9996 | 1.6084 | 258.3359 |
| TCA | 28.1140 | 50.0638 | 743.4037 | 6.5000 | 0.0047 | 296.4078 | 0.2566 | 522.6992 | 6.0258 | 105.3096 |
| UGA | 19.3830 | 161.7203 | 822.5394 | 28.7182 | 0.0019 | 282.6911 | 0.5464 | 534.6531 | 4.3630 | 258.9520 |
| ARE | 68.5960 | 79.1803 | 3078.4299 | 60.7467 | 0.0001 | 301.9237 | 0.1055 | 529.0540 | 4.9619 | 29.6262 |
| GBR | 94.4140 | 19.1937 | 11,992.0238 | 10.6468 | 0.0024 | 281.3542 | 0.5298 | 587.7255 | 1.1419 | 220.0884 |
| USA | 80.7720 | 33.8158 | 48,650.6431 | 6.5162 | 0.0021 | 280.7282 | 0.3657 | 546.2695 | 1.1354 | 181.6406 |
| URY | 50.9560 | 67.1425 | 1742.3493 | 10.1519 | 0.0035 | 290.6031 | 0.6071 | 551.7682 | 1.3857 | 120.9040 |
| UZB | 88.0830 | 32.2430 | 13,825.3571 | 32.7840 | 0.0006 | 287.1962 | 0.1537 | 568.6717 | 0.9337 | 230.7533 |
| VUT | 30.4170 | 283.7026 | 1673.3293 | 8.6629 | 0.0057 | 298.5864 | 0.7746 | 605.4128 | 6.8839 | 109.8597 |
| VEN | 24.4620 | 19.3779 | 2839.4063 | 20.2724 | 0.0073 | 299.1591 | 0.6504 | 449.7746 | 1.4295 | 85.8965 |
| VNM | 31.7760 | 43.8564 | 1334.7849 | 28.2711 | 0.0059 | 297.3987 | 0.5967 | 448.5403 | 4.5158 | 89.2613 |
| YEM | 62.2180 | 42.2203 | 8148.9612 | 44.7159 | 0.0005 | 299.2449 | 0.1327 | 764.0328 | 7.6672 | 57.8002 |
| ZMB | 39.3550 | 18.3026 | 1489.4591 | 26.0485 | 0.0033 | 295.2124 | 0.5530 | 695.4833 | 5.4526 | 87.0685 |
| ZWE | 33.1960 | 32.8234 | 948.3315 | 20.7320 | 0.0022 | 295.0207 | 0.4670 | 698.6781 | 5.3556 | 94.2311 |
Table A3.
Year-wise mean value of all the parameters in 2019.
Table A3.
Year-wise mean value of all the parameters in 2019.
| Country | UR | PD | GDP_per | PM25 | T2M | TP | NDVI | BLH | WS | WD |
|---|---|---|---|---|---|---|---|---|---|---|
| AFG | 25.7540 | 58.2694 | 494.1793 | 38.0847 | 285.9910 | 0.0012 | 0.1220 | 576.7270 | 1.1174 | 192.4120 |
| ALB | 61.2290 | 104.1676 | 5396.2159 | 18.4450 | 287.0500 | 0.0037 | 0.5194 | 420.1060 | 0.5200 | 86.7770 |
| DZA | 73.1890 | 18.0763 | 3989.6683 | 30.8674 | 296.9940 | 0.0002 | 0.1241 | 804.5470 | 1.3350 | 112.8540 |
| AGO | 66.1770 | 25.5276 | 2177.7990 | 22.8370 | 296.4210 | 0.0029 | 0.5436 | 643.1190 | 0.9093 | 149.4730 |
| ARG | 91.9910 | 16.4208 | 10,076.3552 | 15.2006 | 287.6710 | 0.0019 | 0.3775 | 695.4480 | 1.7135 | 183.4740 |
| ARM | 63.2190 | 103.8893 | 4604.6463 | 25.2962 | 280.2240 | 0.0021 | 0.3240 | 401.6270 | 0.3271 | 152.5670 |
| AUS | 86.1240 | 3.2977 | 54,875.2860 | 6.7456 | 296.1620 | 0.0007 | 0.2789 | 888.7900 | 1.7871 | 140.7900 |
| AUT | 58.5150 | 107.6093 | 50,114.4011 | 10.2758 | 281.2490 | 0.0035 | 0.5170 | 441.2720 | 0.5876 | 262.1070 |
| AZE | 56.0310 | 121.2801 | 4805.7537 | 24.6990 | 287.5710 | 0.0012 | 0.2915 | 445.8150 | 1.1048 | 114.1380 |
| BGD | 37.4050 | 1252.5634 | 2154.2268 | 66.1645 | 298.7430 | 0.0057 | 0.5475 | 429.5680 | 0.6691 | 142.3130 |
| BLR | 79.0440 | 46.4073 | 6837.7178 | 12.7372 | 281.9500 | 0.0018 | 0.5131 | 597.0160 | 0.9863 | 236.0810 |
| BEL | 98.0410 | 379.4247 | 46,599.1113 | 9.6846 | 284.1720 | 0.0025 | 0.6249 | 595.0370 | 1.5952 | 222.0780 |
| BLZ | 45.8660 | 17.1132 | 4983.3361 | 16.5686 | 299.5650 | 0.0028 | 0.7292 | 630.8900 | 1.9661 | 82.6295 |
| BEN | 47.8610 | 104.6572 | 1219.5155 | 38.4915 | 301.1550 | 0.0033 | 0.4941 | 601.6600 | 0.8456 | 188.9890 |
| BTN | 41.6120 | 20.0077 | 3322.8633 | 22.2679 | 280.0860 | 0.0085 | 0.5505 | 268.1330 | 0.3853 | 180.7190 |
| BOL | 69.7730 | 10.6278 | 3552.0681 | 28.5346 | 293.8780 | 0.0041 | 0.5769 | 558.7200 | 0.7500 | 223.5320 |
| BIH | 48.6260 | 64.4726 | 6119.7624 | 24.1778 | 284.5840 | 0.0035 | 0.5902 | 433.3170 | 0.3310 | 146.7670 |
| BWA | 70.1720 | 4.0649 | 7247.4295 | 17.6292 | 296.5670 | 0.0009 | 0.2981 | 841.4250 | 1.9023 | 67.4814 |
| BRA | 86.8240 | 25.2508 | 8876.0598 | 17.7093 | 298.6320 | 0.0046 | 0.6579 | 527.5280 | 1.1408 | 82.4332 |
| BRN | 77.9420 | 82.2194 | 31,085.9619 | 11.1185 | 300.5500 | 0.0064 | 0.7576 | 366.5130 | 0.2535 | 184.3600 |
| BGR | 75.3470 | 64.2572 | 9879.2685 | 20.2587 | 285.7290 | 0.0018 | 0.5366 | 473.0070 | 0.4082 | 163.8010 |
| BFA | 29.9800 | 74.2741 | 796.1152 | 33.3853 | 302.1930 | 0.0017 | 0.3440 | 651.9520 | 0.3447 | 165.9440 |
| BDI | 13.3660 | 449.0100 | 223.8629 | 33.3833 | 294.2130 | 0.0054 | 0.5516 | 491.9110 | 0.7624 | 155.1150 |
| KHM | 23.8050 | 93.3976 | 1643.1214 | 19.0451 | 301.2210 | 0.0043 | 0.5770 | 579.4180 | 0.6272 | 203.3360 |
| CMR | 56.9680 | 54.7405 | 1533.0957 | 39.5674 | 298.1940 | 0.0053 | 0.5745 | 496.3120 | 0.7571 | 231.8490 |
| CAN | 81.4820 | 4.1939 | 46,328.6718 | 3.7887 | 267.7350 | 0.0017 | 0.2210 | 415.1060 | 1.0458 | 232.4510 |
| CAF | 41.7700 | 7.6169 | 468.1175 | 29.9804 | 299.7250 | 0.0032 | 0.6687 | 607.9740 | 0.5128 | 190.3200 |
| TCD | 23.2790 | 12.6643 | 709.5400 | 45.7528 | 300.7440 | 0.0009 | 0.2158 | 694.0220 | 1.8188 | 99.1951 |
| CHL | 87.6430 | 25.4892 | 14,699.4628 | 15.6574 | 282.9200 | 0.0042 | 0.3270 | 513.9030 | 1.6353 | 261.0210 |
| CHN | 60.3080 | 149.3676 | 10,143.8382 | 25.5362 | 280.2820 | 0.0020 | 0.3143 | 548.3210 | 1.0782 | 193.2240 |
| COL | 81.1040 | 45.3713 | 6418.6158 | 20.0078 | 297.5740 | 0.0085 | 0.6356 | 355.1230 | 0.5836 | 125.3620 |
| COM | 29.1640 | 457.2225 | 1404.4332 | 11.4444 | 298.9590 | 0.0037 | 0.6562 | 563.6050 | 1.2153 | 152.7340 |
| COG | 67.3730 | 15.7555 | 2369.7294 | 35.3891 | 298.4350 | 0.0045 | 0.6474 | 402.2990 | 0.9475 | 238.3690 |
| COD | 45.0460 | 38.2835 | 596.5606 | 37.0104 | 297.9160 | 0.0043 | 0.7050 | 450.7590 | 0.5152 | 189.8170 |
| CRI | 80.0760 | 98.8555 | 12,762.1380 | 16.5802 | 296.9290 | 0.0077 | 0.6854 | 402.6680 | 1.6485 | 95.5486 |
| CIV | 51.2390 | 80.8697 | 2276.3324 | 22.0734 | 299.8870 | 0.0039 | 0.5649 | 557.8230 | 1.1970 | 205.1350 |
| HRV | 57.2420 | 71.8369 | 15,311.7669 | 15.6601 | 286.0370 | 0.0034 | 0.5945 | 442.2140 | 0.5484 | 139.2350 |
| CUB | 77.1090 | 109.1858 | 9125.8787 | 10.1175 | 299.2330 | 0.0026 | 0.6975 | 619.1490 | 2.1725 | 73.5690 |
| CYP | 66.8050 | 129.7158 | 29,206.0762 | 17.3184 | 293.4220 | 0.0020 | 0.4344 | 514.9480 | 1.1033 | 280.8170 |
| CZE | 73.9210 | 138.2367 | 23,660.1488 | 12.3749 | 282.9200 | 0.0021 | 0.5658 | 558.9770 | 0.8069 | 252.8090 |
| DNK | 87.9940 | 145.3606 | 59,775.7351 | 1.8211 | 255.3890 | 0.0008 | −0.0289 | 199.5540 | 4.5992 | 196.7030 |
| DJI | 77.9150 | 41.9999 | 3172.7507 | 36.1669 | 302.1320 | 0.0005 | 0.1061 | 833.7160 | 1.7137 | 109.2990 |
| DMA | 70.7860 | 95.7440 | 8516.2800 | 10.8750 | 299.3400 | 0.0023 | 0.7133 | 760.6850 | 7.0991 | 82.9319 |
| DOM | 81.8280 | 222.2926 | 8282.1171 | 12.3714 | 297.8290 | 0.0023 | 0.6724 | 540.1800 | 1.7639 | 99.3554 |
| ECU | 63.9860 | 69.9535 | 6222.5247 | 16.5185 | 294.3210 | 0.0097 | 0.5203 | 327.1850 | 0.8564 | 177.1230 |
| EGY | 42.7300 | 100.8469 | 3019.0923 | 45.6146 | 296.3580 | 0.0000 | 0.1163 | 647.5970 | 2.2996 | 237.8120 |
| SLV | 72.7460 | 311.4648 | 4167.7309 | 28.4136 | 299.2960 | 0.0039 | 0.6899 | 609.6880 | 0.6856 | 99.3884 |
| GNQ | 72.6270 | 48.3416 | 8380.7411 | 32.5806 | 297.8800 | 0.0091 | 0.5520 | 368.3300 | 1.1905 | 245.0380 |
| ERI | 88.7850 | 34.6249 | 879.7500 | 35.2604 | 300.4940 | 0.0011 | 0.1773 | 683.8020 | 0.7730 | 127.0570 |
| EST | 69.0510 | 30.5235 | 23,397.8783 | 6.6522 | 280.5120 | 0.0022 | 0.4676 | 577.9460 | 1.4355 | 232.5920 |
| ETH | 21.2250 | 99.2462 | 855.7609 | 21.4045 | 297.0090 | 0.0031 | 0.3999 | 738.1400 | 0.9869 | 146.1410 |
| FJI | 56.7500 | 48.7113 | 6175.8907 | 6.4917 | 298.0460 | 0.0075 | 0.7729 | 528.3190 | 2.4432 | 117.4620 |
| FIN | 85.4460 | 18.1680 | 48,628.6418 | 4.1757 | 275.9150 | 0.0021 | 0.3976 | 514.1460 | 0.5794 | 248.4900 |
| FRA | 80.7090 | 122.8163 | 40,578.6443 | 8.6285 | 285.2670 | 0.0027 | 0.6039 | 574.8230 | 0.9587 | 244.9160 |
| GAB | 89.7410 | 8.4316 | 7766.9966 | 27.3496 | 298.3740 | 0.0063 | 0.5362 | 401.3820 | 1.0735 | 237.0970 |
| GEO | 59.0390 | 65.0856 | 4696.1506 | 20.5521 | 281.8770 | 0.0030 | 0.4900 | 329.1450 | 0.3831 | 166.2410 |
| DEU | 77.3760 | 237.8298 | 46,794.8993 | 9.6144 | 283.6320 | 0.0023 | 0.6098 | 589.4600 | 1.2873 | 238.8680 |
| GHA | 56.7070 | 133.6814 | 2246.6256 | 28.3200 | 301.1960 | 0.0036 | 0.5091 | 568.7270 | 1.2022 | 203.5150 |
| GRC | 79.3880 | 83.1775 | 19,133.7578 | 15.4170 | 288.4520 | 0.0025 | 0.5523 | 504.4960 | 0.6131 | 177.9470 |
| GTM | 51.4390 | 154.9461 | 4638.6349 | 24.2976 | 296.9800 | 0.0042 | 0.7107 | 520.3380 | 0.8342 | 94.0165 |
| GIN | 36.5000 | 51.9748 | 1052.5881 | 26.8087 | 299.7110 | 0.0047 | 0.5822 | 566.5580 | 0.6415 | 228.1720 |
| GNB | 43.7770 | 68.3114 | 749.4537 | 30.4515 | 301.1960 | 0.0031 | 0.5734 | 518.2760 | 0.8025 | 271.5200 |
| GUY | 26.6890 | 3.9765 | 6609.5113 | 16.6437 | 298.7880 | 0.0056 | 0.6699 | 503.5820 | 1.7712 | 51.5988 |
| HTI | 56.1920 | 408.6749 | 1312.7706 | 13.0648 | 298.9520 | 0.0026 | 0.6046 | 486.0390 | 1.3718 | 71.3106 |
| HND | 57.7300 | 87.1044 | 2574.3568 | 25.1231 | 297.5060 | 0.0037 | 0.6992 | 543.1380 | 1.2021 | 63.4658 |
| HUN | 71.6440 | 107.0693 | 16,735.6598 | 14.7373 | 285.6490 | 0.0020 | 0.5244 | 508.8610 | 0.3774 | 281.7820 |
| ISL | 93.8550 | 3.5759 | 68,941.4622 | 4.6877 | 275.1510 | 0.0035 | 0.1591 | 499.5160 | 1.3305 | 95.8075 |
| IND | 34.4720 | 459.5797 | 2072.2449 | 47.7395 | 297.0040 | 0.0039 | 0.4375 | 570.4330 | 0.6883 | 227.2730 |
| IDN | 55.9850 | 144.1400 | 4135.2333 | 19.3366 | 298.7120 | 0.0080 | 0.6920 | 366.1870 | 0.4894 | 157.6720 |
| IRN | 75.3910 | 50.9061 | 3514.0422 | 39.2695 | 291.6150 | 0.0011 | 0.1417 | 706.7170 | 0.9124 | 184.8040 |
| IRQ | 70.6780 | 90.5488 | 5943.4585 | 41.0859 | 296.4490 | 0.0009 | 0.1950 | 653.7620 | 1.4538 | 277.4360 |
| IRL | 63.4050 | 71.6264 | 80,886.6157 | 8.3900 | 283.1850 | 0.0033 | 0.7052 | 683.9150 | 1.5995 | 229.9180 |
| ISR | 92.5010 | 418.3919 | 43,951.2477 | 24.7428 | 293.7420 | 0.0009 | 0.2257 | 531.0790 | 1.2911 | 294.0130 |
| ITA | 70.7360 | 200.6149 | 33,673.4755 | 12.8533 | 286.4040 | 0.0033 | 0.5514 | 422.3290 | 0.5586 | 193.7010 |
| JAM | 55.9850 | 272.2324 | 5369.4984 | 16.7798 | 299.6320 | 0.0031 | 0.7483 | 556.2090 | 2.2790 | 86.7641 |
| JPN | 91.6980 | 347.4156 | 40,458.0019 | 10.0334 | 285.4470 | 0.0046 | 0.5885 | 536.0390 | 0.8988 | 263.3480 |
| JOR | 91.2030 | 113.7835 | 4405.4871 | 29.7442 | 293.1010 | 0.0003 | 0.1269 | 691.4660 | 1.5888 | 284.3500 |
| KAZ | 57.5400 | 6.8577 | 9812.5958 | 15.8898 | 280.8730 | 0.0008 | 0.1711 | 578.5250 | 0.9060 | 150.6460 |
| KEN | 27.5070 | 92.3744 | 1909.3045 | 17.3898 | 299.0080 | 0.0024 | 0.3672 | 880.3930 | 2.5551 | 128.7880 |
| KWT | 100.0000 | 236.0874 | 32,373.2511 | 49.3006 | 299.8690 | 0.0004 | 0.0944 | 705.1380 | 2.0729 | 315.0530 |
| KGZ | 36.5910 | 33.6611 | 1374.0321 | 20.9686 | 275.0740 | 0.0024 | 0.1847 | 318.9340 | 0.6110 | 174.5800 |
| LAO | 35.6450 | 31.0635 | 2613.9444 | 28.1527 | 297.2150 | 0.0043 | 0.6666 | 478.0500 | 0.5116 | 155.9140 |
| LVA | 68.2220 | 30.8234 | 17,926.8416 | 11.4510 | 281.2190 | 0.0021 | 0.5086 | 601.8390 | 1.3511 | 229.9350 |
| LBN | 88.7580 | 670.1573 | 7527.4431 | 28.1058 | 291.2930 | 0.0023 | 0.3510 | 472.8410 | 1.2080 | 228.9240 |
| LSO | 28.5850 | 70.0022 | 1153.3881 | 25.2854 | 286.5400 | 0.0021 | 0.3611 | 713.2940 | 1.1283 | 296.3580 |
| LBR | 51.6150 | 51.2601 | 672.3405 | 20.7036 | 298.8470 | 0.0076 | 0.5940 | 426.6500 | 1.1926 | 228.4800 |
| LBY | 80.3930 | 3.8518 | 10,218.0430 | 38.7454 | 295.7350 | 0.0001 | 0.1101 | 676.7930 | 1.6116 | 113.0800 |
| LTU | 67.8550 | 44.6134 | 19,575.7685 | 12.6261 | 281.9140 | 0.0018 | 0.4940 | 625.8760 | 1.1782 | 227.3760 |
| LUX | 91.2230 | 255.1444 | 113,218.7133 | 8.3344 | 282.8150 | 0.0028 | 0.6410 | 563.4620 | 1.1463 | 227.9150 |
| MKD | 58.2080 | 82.3431 | 6070.3881 | 24.0747 | 285.1600 | 0.0019 | 0.4955 | 531.3080 | 0.4045 | 238.2810 |
| MDG | 37.8610 | 46.3549 | 526.2246 | 12.1826 | 296.4980 | 0.0040 | 0.5163 | 583.1610 | 1.2896 | 127.2640 |
| MWI | 17.1740 | 197.5896 | 591.8471 | 21.9481 | 295.3550 | 0.0043 | 0.4373 | 573.6070 | 1.7421 | 124.7420 |
| MYS | 76.6070 | 97.2448 | 11,432.8260 | 16.0935 | 299.4560 | 0.0068 | 0.7413 | 355.8280 | 0.2674 | 119.3260 |
| MLI | 43.1360 | 16.1106 | 879.0432 | 37.2800 | 301.9070 | 0.0007 | 0.1943 | 737.5190 | 1.2539 | 59.9142 |
| MLT | 94.6780 | 1575.1938 | 31,185.6496 | 12.5500 | 292.6660 | 0.0015 | 0.2972 | 636.0850 | 2.0472 | 296.7260 |
| MRT | 54.5070 | 4.3909 | 1743.3013 | 47.0931 | 300.3140 | 0.0002 | 0.1110 | 675.0430 | 2.4489 | 53.1952 |
| MUS | 40.7660 | 623.5030 | 11,097.1690 | 14.9857 | 297.9390 | 0.0022 | 0.6978 | 798.3020 | 4.4339 | 107.4560 |
| MEX | 80.4440 | 65.6270 | 9950.2176 | 11.4090 | 294.4040 | 0.0020 | 0.4537 | 641.2160 | 1.0560 | 176.7620 |
| MDA | 42.7260 | 92.7841 | 4492.1057 | 14.4353 | 284.9030 | 0.0013 | 0.4343 | 560.0100 | 0.3871 | 302.3710 |
| MNG | 68.5430 | 2.0711 | 4404.8458 | 16.9930 | 274.8340 | 0.0007 | 0.1783 | 592.7250 | 1.2935 | 270.1860 |
| MAR | 62.9940 | 81.7203 | 3235.0007 | 19.8356 | 291.6200 | 0.0006 | 0.2021 | 628.2860 | 1.1931 | 248.2390 |
| MOZ | 36.5280 | 38.6150 | 506.8171 | 19.1836 | 297.5160 | 0.0028 | 0.5734 | 677.4150 | 1.4815 | 129.0600 |
| MMR | 30.8520 | 82.7914 | 1271.1115 | 31.3504 | 297.0020 | 0.0056 | 0.6225 | 428.0970 | 0.5503 | 203.3390 |
| NAM | 51.0420 | 3.0299 | 5028.2953 | 13.7310 | 296.2790 | 0.0005 | 0.1939 | 792.7700 | 1.2406 | 135.3750 |
| NPL | 20.1530 | 199.5725 | 1194.9572 | 35.3453 | 284.8090 | 0.0060 | 0.4904 | 317.6700 | 0.2982 | 199.8580 |
| NLD | 91.8760 | 515.1433 | 52,476.2733 | 10.3351 | 284.2960 | 0.0024 | 0.6263 | 614.1070 | 1.6971 | 229.9490 |
| NZL | 86.6150 | 18.9100 | 42,865.2336 | 8.2814 | 284.0760 | 0.0049 | 0.6630 | 564.6350 | 1.4978 | 291.8250 |
| NIC | 58.7600 | 54.3917 | 1924.4718 | 17.4163 | 299.0100 | 0.0043 | 0.6269 | 614.1830 | 2.3357 | 56.4603 |
| NER | 16.5170 | 18.4027 | 554.0994 | 52.5541 | 301.0240 | 0.0003 | 0.1285 | 716.1880 | 1.5739 | 73.4185 |
| NGA | 51.1570 | 220.6524 | 2229.8587 | 56.4806 | 300.4600 | 0.0033 | 0.4262 | 572.1060 | 0.8015 | 194.9070 |
| PRK | 62.1340 | 213.1564 | 31,902.2435 | 19.0533 | 281.0850 | 0.0023 | 0.5019 | 484.3070 | 0.9032 | 278.8070 |
| NOR | 82.6160 | 14.6474 | 75,719.7529 | 5.2319 | 275.7580 | 0.0037 | 0.2848 | 428.8400 | 0.6042 | 215.2790 |
| OMN | 85.4430 | 16.0743 | 17,700.7035 | 57.6261 | 301.5860 | 0.0001 | 0.1000 | 662.1160 | 1.2113 | 169.2910 |
| PAK | 36.9070 | 280.9326 | 1481.8139 | 48.5352 | 292.9330 | 0.0014 | 0.2009 | 571.4580 | 0.8369 | 193.6570 |
| PAN | 68.0590 | 57.2474 | 15,774.2550 | 14.8707 | 298.4130 | 0.0073 | 0.6259 | 389.2420 | 1.3280 | 189.5370 |
| PNG | 13.2500 | 19.3793 | 2820.3064 | 12.4012 | 296.7420 | 0.0118 | 0.6730 | 345.0370 | 0.5988 | 187.4480 |
| PRY | 61.8790 | 17.7313 | 5383.5744 | 17.8334 | 297.7010 | 0.0035 | 0.6478 | 645.6430 | 0.9680 | 79.5810 |
| PER | 78.0990 | 25.3988 | 7023.0775 | 26.7666 | 292.1290 | 0.0065 | 0.5226 | 361.7310 | 0.6057 | 164.2370 |
| PHL | 47.1490 | 362.6006 | 3485.3408 | 19.4999 | 299.4700 | 0.0064 | 0.7016 | 476.7210 | 0.6597 | 106.2000 |
| POL | 60.0370 | 124.0013 | 15,732.2031 | 16.3124 | 283.4590 | 0.0018 | 0.5542 | 603.7460 | 1.1526 | 242.8570 |
| PRT | 65.7640 | 112.2886 | 23,330.8173 | 6.9603 | 288.3190 | 0.0021 | 0.5310 | 552.3540 | 1.4215 | 305.3360 |
| PRI | 93.5760 | 360.0557 | 32,850.5486 | 6.5975 | 299.0080 | 0.0024 | 0.7144 | 608.7930 | 2.9053 | 88.8691 |
| QAT | 99.1880 | 246.4814 | 62,087.9741 | 84.4423 | 301.1310 | 0.0003 | 0.0796 | 487.5470 | 1.9445 | 349.3780 |
| ROU | 54.0840 | 84.1953 | 12,899.3461 | 15.8196 | 284.3510 | 0.0020 | 0.5149 | 440.4420 | 0.5124 | 169.2870 |
| RUS | 74.5870 | 8.8177 | 11,536.2510 | 9.5408 | 269.5330 | 0.0016 | 0.2893 | 446.3880 | 1.0627 | 212.2090 |
| RWA | 17.3130 | 511.8337 | 820.1772 | 35.1657 | 292.7650 | 0.0049 | 0.5440 | 494.8830 | 0.5002 | 147.2600 |
| STP | 73.5980 | 224.0083 | 1987.5797 | 15.5200 | 299.1360 | 0.0040 | 0.5494 | 482.4470 | 3.9310 | 201.5850 |
| SAU | 84.0650 | 15.9411 | 23,450.5620 | 61.9292 | 299.7860 | 0.0002 | 0.1054 | 804.9950 | 1.0991 | 169.7930 |
| SEN | 47.6530 | 84.6432 | 1435.8304 | 41.3382 | 302.0240 | 0.0011 | 0.3343 | 608.2480 | 1.3218 | 323.5690 |
| SLE | 42.4840 | 108.2461 | 521.7548 | 25.2171 | 299.5970 | 0.0081 | 0.6111 | 477.3480 | 1.1576 | 227.5600 |
| SGP | 100.0000 | 8044.5261 | 65,831.1894 | 18.9333 | 300.6100 | 0.0064 | 0.4149 | 441.5890 | 0.7305 | 77.1261 |
| SVK | 53.7290 | 113.4390 | 19,303.5457 | 15.3297 | 282.9830 | 0.0024 | 0.5620 | 496.2970 | 0.3968 | 191.0500 |
| SVN | 54.8220 | 103.7119 | 25,942.9548 | 12.9523 | 283.9230 | 0.0040 | 0.6477 | 394.5650 | 0.3443 | 196.2730 |
| SLB | 24.2100 | 23.9307 | 2344.0490 | 10.1254 | 299.5710 | 0.0117 | 0.7169 | 475.2730 | 1.2920 | 133.6140 |
| SOM | 45.5540 | 24.6165 | 419.3948 | 22.1128 | 300.1780 | 0.0011 | 0.2472 | 898.5060 | 2.0717 | 170.4720 |
| ZAF | 66.8560 | 48.2720 | 6624.7619 | 16.9129 | 292.2730 | 0.0011 | 0.3138 | 722.0870 | 0.9336 | 202.9530 |
| KOR | 81.4300 | 530.8124 | 31,902.4169 | 20.0633 | 286.0840 | 0.0031 | 0.5821 | 488.9350 | 0.8403 | 290.4310 |
| ESP | 80.5650 | 94.3445 | 29,554.4905 | 8.5732 | 287.5050 | 0.0018 | 0.4497 | 623.3620 | 0.8944 | 269.4560 |
| LKA | 18.5850 | 352.4344 | 3848.2124 | 22.6617 | 300.0680 | 0.0046 | 0.6573 | 607.7990 | 1.1082 | 224.2200 |
| SDN | 34.9360 | 23.1519 | 755.3290 | 35.9188 | 300.8210 | 0.0012 | 0.2713 | 730.9470 | 1.6993 | 112.8630 |
| SUR | 66.0950 | 3.7267 | 6853.6934 | 15.5669 | 299.4120 | 0.0052 | 0.7282 | 561.0120 | 2.0139 | 53.1437 |
| SWE | 87.7080 | 25.2360 | 51,939.4297 | 4.7841 | 276.6110 | 0.0024 | 0.4247 | 517.3740 | 0.7624 | 262.2180 |
| CHE | 73.8490 | 217.0076 | 85,334.5195 | 9.4789 | 280.1400 | 0.0046 | 0.4526 | 353.3350 | 0.3907 | 212.1300 |
| SYR | 54.8210 | 92.9594 | 1116.0000 | 33.6416 | 292.6530 | 0.0010 | 0.2275 | 625.9540 | 1.6093 | 264.8740 |
| TJK | 27.3090 | 67.1592 | 890.5444 | 20.0940 | 273.9880 | 0.0019 | 0.1264 | 366.9720 | 0.6048 | 166.8300 |
| TZA | 34.5000 | 65.4837 | 1085.8849 | 21.9575 | 296.3970 | 0.0034 | 0.5043 | 654.8030 | 1.4502 | 115.6950 |
| THA | 50.6920 | 136.2829 | 7814.3844 | 25.3366 | 300.1650 | 0.0039 | 0.5937 | 536.7530 | 0.5997 | 191.6000 |
| BHS | 83.1320 | 38.9097 | 33,872.3343 | 8.0357 | 298.9800 | 0.0031 | 0.4323 | 711.3870 | 3.0489 | 97.5827 |
| GMB | 61.9310 | 231.9858 | 772.5056 | 39.1057 | 300.8000 | 0.0017 | 0.4342 | 489.6130 | 1.3197 | 312.5200 |
| TLS | 30.9470 | 86.9617 | 1583.7136 | 11.8034 | 298.0910 | 0.0036 | 0.6329 | 470.7030 | 0.7706 | 133.0200 |
| TGO | 42.2480 | 148.6001 | 893.3525 | 33.1021 | 300.7360 | 0.0039 | 0.5133 | 539.2930 | 0.9114 | 194.8140 |
| TTO | 53.1870 | 271.9238 | 17,123.1163 | 14.6974 | 299.7350 | 0.0030 | 0.7140 | 695.1390 | 4.4938 | 84.0839 |
| TUN | 69.2540 | 75.2750 | 3571.9450 | 23.0214 | 293.4340 | 0.0007 | 0.1920 | 627.1390 | 1.0385 | 176.1760 |
| TUR | 75.6300 | 108.4022 | 9121.5152 | 28.3322 | 285.6730 | 0.0020 | 0.3548 | 543.2650 | 0.5421 | 159.6310 |
| TKM | 52.0480 | 12.6446 | 7612.0352 | 29.2526 | 290.4090 | 0.0006 | 0.1424 | 575.1930 | 1.4389 | 64.5967 |
| UGA | 24.3610 | 220.7739 | 798.5857 | 26.8675 | 296.7500 | 0.0048 | 0.5295 | 549.3080 | 0.6165 | 137.2290 |
| UKR | 69.4730 | 76.6072 | 3661.4563 | 15.8626 | 283.7390 | 0.0015 | 0.4390 | 569.6410 | 0.5252 | 198.9210 |
| ARE | 86.7890 | 137.5743 | 42,701.4431 | 60.7550 | 301.6990 | 0.0001 | 0.1018 | 575.1930 | 1.1469 | 216.7460 |
| GBR | 83.6520 | 276.2631 | 43,070.4984 | 9.3161 | 282.8030 | 0.0032 | 0.6187 | 618.2250 | 1.5383 | 231.0650 |
| USA | 82.4590 | 35.8932 | 65,094.7994 | 5.5864 | 281.2720 | 0.0025 | 0.3772 | 543.0490 | 0.9203 | 200.5650 |
| URY | 95.4260 | 19.7791 | 17,688.0150 | 9.6553 | 290.9350 | 0.0044 | 0.6432 | 511.6710 | 0.9447 | 97.6735 |
| UZB | 50.4330 | 76.2228 | 1784.0098 | 29.1380 | 287.4520 | 0.0007 | 0.1688 | 594.1620 | 1.1283 | 64.2448 |
| VUT | 25.3940 | 24.6007 | 3122.9826 | 7.8357 | 298.3150 | 0.0057 | 0.7847 | 685.0010 | 4.1995 | 119.4330 |
| VEN | 88.2400 | 32.3290 | 4400.0000 | 18.3805 | 298.9910 | 0.0055 | 0.6473 | 523.0590 | 1.4287 | 87.0029 |
| VNM | 36.6280 | 311.0978 | 3425.0893 | 24.7097 | 297.8150 | 0.0050 | 0.6229 | 473.6980 | 0.5059 | 157.3470 |
| YEM | 37.2730 | 55.2341 | 750.5546 | 52.8095 | 299.5080 | 0.0004 | 0.1360 | 772.2610 | 1.3657 | 128.3160 |
| ZMB | 44.0720 | 24.0265 | 1305.0010 | 22.5334 | 295.7210 | 0.0028 | 0.5334 | 718.8830 | 1.7153 | 102.2290 |
| ZWE | 32.2100 | 37.8583 | 1316.7407 | 16.2415 | 295.6630 | 0.0017 | 0.4246 | 784.6430 | 2.0616 | 94.4050 |
References
- Kaufman, Y.J.; Tanré, D.; Boucher, O. A satellite view of aerosols in the climate system. Nature 2002, 419, 215–223. [Google Scholar] [CrossRef] [PubMed]
- Zhang, Q.; Jiang, X.; Tong, D.; Davis, S.J.; Zhao, H.; Geng, G.; Feng, T.; Zheng, B.; Lu, Z.; Streets, D.G.; et al. Transboundary health impacts of transported global air pollution and international trade. Nature 2017, 543, 705–709. [Google Scholar] [CrossRef] [PubMed]
- Kelly, F.J.; Fussell, J.C. Air pollution and public health: Emerging hazards and improved understanding of risk. Environ. Geochem. Health 2015, 37, 631–649. [Google Scholar] [CrossRef] [PubMed]
- Wang, W.; Yu, T.; Ciren, P.; Jiang, P. Assessment of human health impact from PM10 exposure in China based on satellite observations. J. Appl. Remote Sens. 2015, 9, 096027. [Google Scholar] [CrossRef]
- Wang, J.; Xing, J.; Mathur, R.; Pleim, J.E.; Wang, S.; Hogrefe, C.; Gan, C.M.; Wong, D.C.; Hao, J. Historical Trends in PM2.5-Related Premature Mortality during 1990–2010 across the Northern Hemisphere. Environ. Health Perspect. 2017, 125, 400–408. [Google Scholar] [CrossRef]
- Li, J.; Liu, H.; Lv, Z.; Zhao, R.; Deng, F.; Wang, C.; Qin, A.; Yang, X. Estimation of PM2.5 mortality burden in China with new exposure estimation and local concentration-response function. Environ. Pollut. 2018, 243, 1710–1718. [Google Scholar] [CrossRef]
- Le, T.H.; Chang, Y.; Park, D. Governance, environmental vulnerability, and PM2.5 concentrations: International evidence. Energy J. 2021, 42, 1–24. [Google Scholar] [CrossRef]
- Diao, M.; Holloway, T.; Choi, S.; O’Neill, S.M.; Hamdan, M.Z.; Van, D.A.; Martin, R.V.; Jin, X.; Fiore, A.M.; Henze, D.K.; et al. Methods, availability, and applications of PM2.5 exposure estimates derived from ground measurements, satellite, and atmospheric models. J. Air Waste Manag. Assoc. 2019, 69, 1391–1414. [Google Scholar] [CrossRef]
- Wei, J.; Li, Z.; Lyapustin, A.; Sun, L.; Peng, Y.; Xue, W.; Su, T.; Cribb, M. Reconstructing 1-km-resolution high-quality PM2.5 data records from 2000 to 2018 in China: Spatiotemporal variations and policy implications. Remote Sens. Environ. 2021, 252, 112136. [Google Scholar] [CrossRef]
- Hammer, M.S.; Van Donkelaar, A.; Li, C.; Lyapustin, A.; Sayer, A.M.; Hsu, N.C.; Levy, R.C.; Garay, M.J.; Kalashnikova, O.V.; Kahn, R.A.; et al. Global estimates and long-term trends of fine particulate matter concentrations (1998–2018). Environ. Sci. Technol. 2020, 54, 7879–7890. [Google Scholar] [CrossRef]
- Yuan, M.; Song, Y.; Huang, Y.; Shen, H.; Li, T. Exploring the association between the built environment and remotely sensed PM2.5 concentrations in urban areas. J. Clean. Prod. 2019, 220, 1014–1023. [Google Scholar] [CrossRef]
- Zhang, X.; Geng, Y.; Shao, S.; Song, X.; Fan, M.; Yang, L.; Song, J. Decoupling PM2.5 emissions and economic growth in China over 1998–2016: A regional investment perspective. Sci. Total Environ. 2020, 714, 136841. [Google Scholar] [CrossRef] [PubMed]
- Wang, S.; Liu, X.; Yang, X.; Zou, B.; Wang, J. Spatial variations of PM2.5 in Chinese cities for the joint impacts of human activities and natural conditions: A global and local regression perspective. J. Clean. Prod. 2018, 203, 143–152. [Google Scholar] [CrossRef]
- Zhou, B.; Liu, D.; Yan, W. A simple new method for calculating precipitation scavenging effect on particulate matter: Based on five-year data in eastern China. Atmosphere 2021, 12, 759. [Google Scholar] [CrossRef]
- Zheng, Z.; Xu, G.; Li, Q.; Chen, C.; Li, J. Effect of precipitation on reducing atmospheric pollutant over Beijing. Atmos. Pollut. Res. 2019, 10, 1443–1453. [Google Scholar] [CrossRef]
- Wu, D.; Zhang, F.; Ge, X.; Yang, M.; Xia, J.; Liu, G.; Li, F. Chemical and light extinction characteristics of atmospheric aerosols in suburban Nanjing, China. Atmosphere 2017, 8, 149. [Google Scholar] [CrossRef]
- Han, L.; Zhou, W.; Li, W.; Qian, Y. Urbanization Strategy and Environmental Changes: An insight with relationship between population change and fine particulate pollution. Sci. Total Environ. 2018, 642, 789–799. [Google Scholar] [CrossRef]
- Wang, S.; Xu, L.; Ge, S.; Jiao, J.; Pan, B.; Shu, Y. Driving force heterogeneity of urban PM2.5 pollution: Evidence from the Yangtze River Delta, China. Ecol. Indic. 2020, 113, 106210. [Google Scholar] [CrossRef]
- Zhang, L.; Wilson, J.P.; MacDonald, B.; Zhang, W.; Yu, T. The changing PM2.5 dynamics of global megacities based on long-term remotely sensed observations. Environ. Int. 2020, 142, 105862. [Google Scholar] [CrossRef]
- Yang, D.; Ye, C.; Wang, X.; Lu, D.; Xu, J.; Yang, H. Global distribution and evolvement of urbanization and PM2.5 (1998–2015). Atmos. Environ. 2018, 182, 171–178. [Google Scholar] [CrossRef]
- Westervelt, D.M.; Horowitz, L.W.; Naik, V.; Tai, A.P.K.; Fiore, A.M.; Mauzerall, D.L. Quantifying PM2.5-meteorology sensitivities in a global climate model. Atmos. Environ. 2016, 142, 43–56. [Google Scholar] [CrossRef]
- Lim, C.H.; Ryu, J.; Choi, Y.; Jeon, S.W.; Lee, W. Understanding global PM2.5 concentrations and their drivers in recent decades (1998–2016). Environ. Int. 2020, 144, 106011. [Google Scholar] [CrossRef] [PubMed]
- van Donkelaar, A.; Hammer, M.S.; Bindle, L.; Brauer, M.; Brook, J.R.; Garay, M.J.; Hsu, N.C.; Kalashnikova, O.V.; Kahn, R.A.; Lee, C.; et al. Monthly global estimates of fine particulate matter and their uncertainty. Environ. Sci. Technol. 2021, 55, 15287–15300. [Google Scholar] [CrossRef] [PubMed]
- van Donkelaar, A.; Martin, R.V.; Brauer, M.; Hsu, N.C.; Kahn, R.A.; Levy, R.C.; Lyapustin, A.; Sayer, A.M.; Winker, D.M. Global estimates of fine particulate matter using a combined geophysical-statistical method with information from satellites, models, and monitors. Environ. Sci. Technol. 2016, 50, 3762–3772. [Google Scholar] [CrossRef]
- Wang, Z.; Chen, L.; Tao, J.; Zhang, Y.; Su, L. Satellite-based estimation of regional particulate matter (PM) in Beijing using vertical-and-RH correcting method. Remote Sens. Environ. 2010, 114, 50–63. [Google Scholar] [CrossRef]
- Zhao, N.; Liu, Y.; Cao, G.; Samson, E.L.; Zhang, J. Forecasting China’s GDP at the pixel level using nighttime lights time series and population images. GIScience Remote Sens. 2017, 54, 407–425. [Google Scholar] [CrossRef]
- Yu, B.; Shi, K.; Hu, Y.; Huang, C.; Chen, Z.; Wu, J. Poverty evaluation using NPP-VIIRS nighttime light composite data at the county level in China. IEEE J. Sel. Top. Appl. Earth Obs. Remote Sens. 2015, 8, 1217–1229. [Google Scholar] [CrossRef]
- Jeswani, R.; Kulshrestha, A.; Gupta, P.K.; Srivastav, S. Evaluation of the consistency of DMSP-OLS and SNPP-VIIRS Night-time Light Datasets. J. Geomat 2019, 13, 98–105. [Google Scholar]
- Chen, Z.; Yu, B.; Yang, C.; Zhou, Y.; Yao, S.; Qian, X.; Wang, C.; Wu, B.; Wu, J. An extended time series (2000–2018) of global NPP-VIIRS-like nighttime light data from a cross-sensor calibration. Earth Syst. Sci. Data 2021, 13, 889–906. [Google Scholar] [CrossRef]
- Sen, P.K. Estimates of the regressions coefficient based on Kendall’s tau. J. Am. Stat. Assoc. 1968, 63, 1379–1389. [Google Scholar] [CrossRef]
- Mann, H.B. Nonparametric test against trend. Econometrica 1945, 13, 245–259. [Google Scholar] [CrossRef]
- Kendall, M.G. Rank correlation methods. Br. J. Psychol. 1955, 25, 86–91. [Google Scholar] [CrossRef]
- Brunsdon, C.E.; Fotheringham, A.S.; Charlton, M.E. Some notes on parametric significance test for geographically weighted regression. J. Reg. Sci. 1999, 39, 497–524. [Google Scholar] [CrossRef]
- Oshan, T.M.; Smith, J.P.; Fotheringham, A.S. Targeting the spatial context of obesity determinants via multiscale geographically weighted regression. Int. J. Health Geogr. 2020, 19, 11. [Google Scholar] [CrossRef] [PubMed]
- Xiao, Q.; Geng, G.; Liang, F.; Wang, X.; Lv, Z.; Lei, Y.; Huang, X.; Zhang, Q.; Liu, Y.; He, K. Changes in spatial patterns of PM2.5 pollution in China 2000–2018: Impact of clean air policies. Environ. Int. 2020, 141, 105776. [Google Scholar] [CrossRef]
- Chen, T.F.; Chang, K.H.; Tsai, C.Y. A modelling study of assessment of the effectiveness of combining foreign and local emission control strategies. Atmos. Res. 2019, 224, 114–126. [Google Scholar] [CrossRef]
- Lurmann, F.; Avol, E.; Gilliland, F. Emissions reduction policies and recent trends in Southern California’s ambient air quality. J. Air Waste Manag. Assoc. 2015, 65, 324–335. [Google Scholar] [CrossRef]
- Nowak, D.J.; Crane, D.E.; Stevens, J.C. Air pollution removal by urban trees and shrubs in the United States. Urban For. Urban Green. 2006, 4, 115–123. [Google Scholar] [CrossRef]
- Wróblewska, K.; Jeong, B.R. Effectiveness of plants and green infrastructure utilization in ambient particulate matter removal. Environ. Sci. Eur. 2021, 33, 110. [Google Scholar] [CrossRef]
- McDonald, J.D.; Reed, M.D.; Campen, M.J.; Barrett, E.G.; Seagrave, J.C.; Mauderly, J.L. Health effects of inhaled gasoline engine emissions. Inhal. Toxicol. 2007, 19 (Suppl. 1), 107–116. [Google Scholar] [CrossRef]
- Song, X.P.; Hansen, M.C.; Stehman, S.V.; Potapov, P.V.; Tyukavina, A.; Vermote, E.F.; Townshend, J. Global land change from 1982 to 2016. Nature 2018, 560, 639–643. [Google Scholar] [CrossRef]
- Pande, C.B.; Moharir, K.N.; Khadri, S.F.R. Assessment of land-use and land-cover changes in Pangari watershed area (MS), India, based on the remote sensing and GIS techniques. Appl. Water Sci. 2021, 11, 96. [Google Scholar] [CrossRef]
- Zhao, X.; Sun, Y.; Zhao, C.; Jiang, H. Impact of precipitation with different intensity on PM2.5 over typical regions of China. Atmosphere 2020, 11, 906. [Google Scholar] [CrossRef]
- Piao, S.; Mohammat, A.; Fang, J.; Cai, Q.; Feng, J. NDVI-based increase in growth of temperate grasslands and its responses to climate changes in China. Glob. Environ. Chang. 2006, 16, 340–348. [Google Scholar] [CrossRef]
- Guan, Y.; Lu, H.; Jiang, Y.; Tian, P.; Qiu, L.; Pellikka, P.; Heiskanen, J. Changes in global climate heterogeneity under the 21st century global warming. Ecol. Indic. 2021, 130, 108075. [Google Scholar] [CrossRef]
- Tai, A.P.K.; Mickley, L.J.; Jacob, D.J. Correlations between fine particulate matter (PM2.5) and meteorological variables in the United States: Implications for the sensitivity of PM2.5 to climate change. Atmos. Environ. 2010, 44, 3976–3984. [Google Scholar] [CrossRef]
- Jiang, N.; Jiang, W.; Zhang, J.; Chen, H. Can national urban agglomeration construction reduce PM2.5 pollution? Evidence from a quasi-natural experiment in China. Urban Clim. 2022, 46, 101302. [Google Scholar] [CrossRef]
- Su, F.; Fu, D.; Yan, F.; Xiao, H.; Pan, T.; Xiao, Y.; Kang, L.; Zhou, C.; Meadows, M.; Lyne, V.; et al. Rapid greening response of China’s 2020 spring vegetation to COVID-19 restrictions: Implications for climate change. Sci. Adv. 2021, 7, eabe8044. [Google Scholar] [CrossRef]
- Yan, D.; Ren, X.; Zhang, W.; Li, Y.; Miao, Y. Exploring the real contribution of socioeconomic variation to urban PM2.5 pollution: New evidence from spatial heteroscedasticity. Sci. Total Environ. 2022, 806, 150929. [Google Scholar] [CrossRef]
- Salim, R.A.; Shafiei, S. Urbanization and renewable and non-renewable energy consumption in OECD countries: An empirical analysis. Econ. Model. 2014, 38, 581–591. [Google Scholar] [CrossRef]
- Jin, Y.; Andersson, H.; Zhang, S. Air pollution control policies in China: A retrospective and prospects. Int. J. Environ. Res. Public Health 2016, 13, 1219. [Google Scholar] [CrossRef]
- Jonidi, J.A.; Charkhloo, E.; Pasalari, H. Urban air pollution control policies and strategies: A systematic review. J. Environ. Health Sci. Eng. 2021, 19, 1911–1940. [Google Scholar] [CrossRef] [PubMed]
- Luo, J.; Du, P.; Samat, A.; Xia, J.; Che, M.; Xue, Z. Spatiotemporal Pattern of PM2.5 Concentrations in Mainland China and Analysis of Its Influencing Factors using Geographically Weighted Regression. Sci. Rep. 2017, 7, 40607. [Google Scholar] [CrossRef]
- Hajiloo, F.; Hamzeh, S.; Gheysari, M. Impact assessment of meteorological and environmental parameters on PM2.5 concentrations using remote sensing data and GWR analysis (case study of Tehran). Environ. Sci. Pollut. Res. 2019, 26, 24331–24345. [Google Scholar] [CrossRef] [PubMed]
- Liu, Q.; Wu, R.; Zhang, W.; Li, W.; Wang, S. The varying driving forces of PM2.5 concentrations in Chinese cities: Insights from a geographically and temporally weighted regression model. Environ. Int. 2020, 145, 106168. [Google Scholar] [CrossRef] [PubMed]
- Zhan, D.; Kwan, M.; Zhang, W.; Yu, X.; Meng, B.; Liu, Q. The driving factors of air quality index in China. J. Clean. Prod. 2018, 197, 1342–1351. [Google Scholar] [CrossRef]
- Zhou, N.; Dai, H.; Zha, W.; Lv, Y. The impact of meteorological factors and PM2.5 on COVID-19 transmission. Epidemiol. Infect. 2022, 150, e164. [Google Scholar] [CrossRef]
- Yang, Q.; Wang, B.; Wang, Y.; Yuan, Q.; Jin, C.; Wang, J.; Li, S.; Li, M.; Li, T.; Liu, S.; et al. Global air quality change during COVID-19: A synthetic analysis of satellite, reanalysis and ground station data. Environ. Res. Lett. 2021, 16, 074052. [Google Scholar] [CrossRef]
- Zhang, B.; Jiao, L.; Xu, G.; Zhao, S.; Tang, X.; Zhou, Y.; Gong, C. Influences of wind and precipitation on different-sized particulate matter concentrations (PM2.5, PM10, PM2.5–10). Meteorol. Atmos. Phys. 2018, 130, 383–392. [Google Scholar] [CrossRef]
Disclaimer/Publisher’s Note: The statements, opinions and data contained in all publications are solely those of the individual author(s) and contributor(s) and not of MDPI and/or the editor(s). MDPI and/or the editor(s) disclaim responsibility for any injury to people or property resulting from any ideas, methods, instructions or products referred to in the content. |
© 2023 by the authors. Licensee MDPI, Basel, Switzerland. This article is an open access article distributed under the terms and conditions of the Creative Commons Attribution (CC BY) license (https://creativecommons.org/licenses/by/4.0/).