
Semantic Segmentation Dataset for AI-Based Quantification of Clean Mucosa in Capsule Endoscopy


Abstract
:1. Introduction
2. Materials and Methods
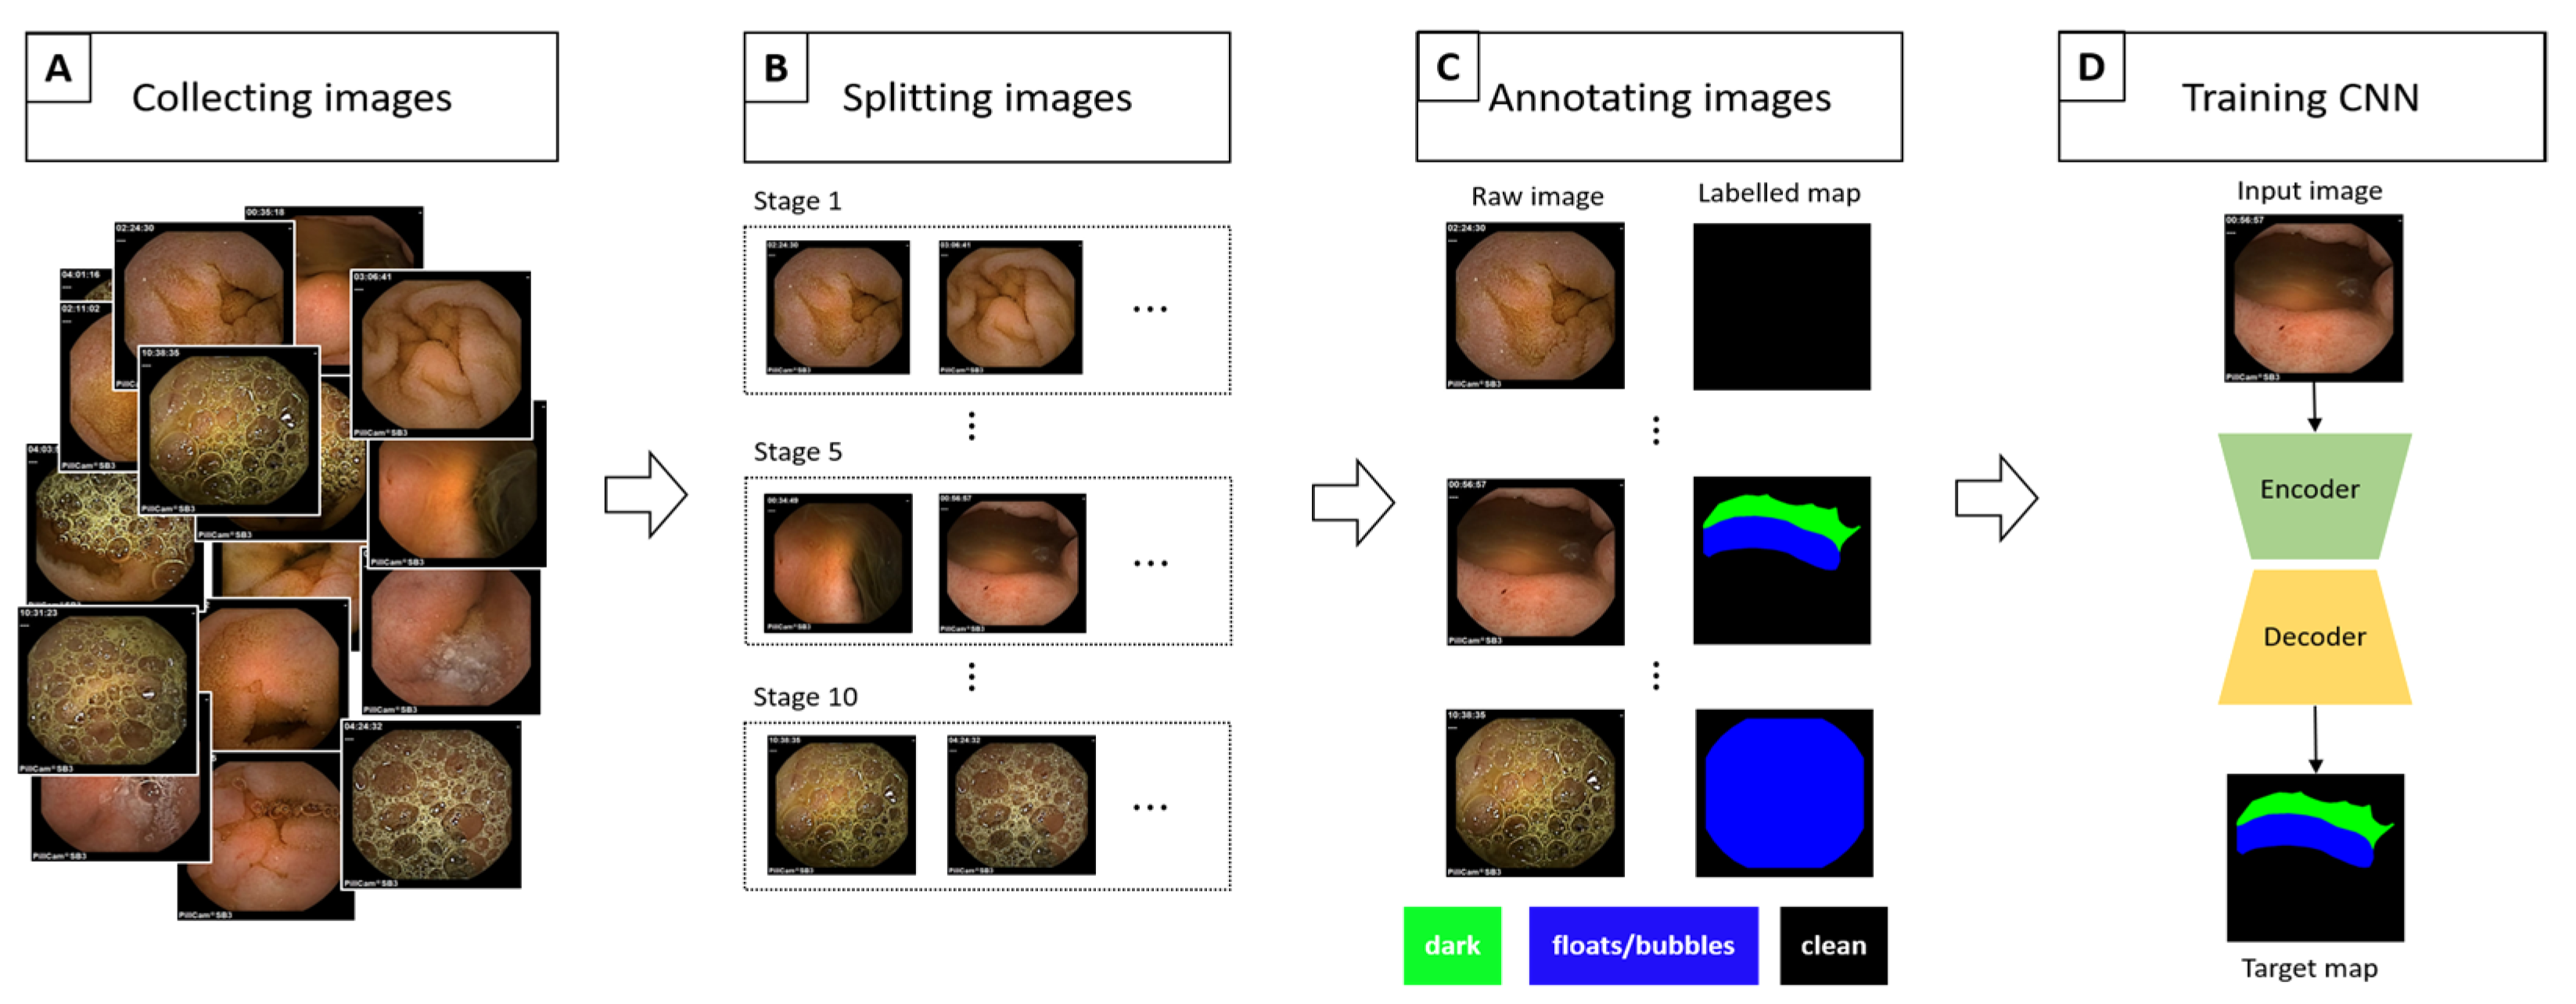
2.1. Data Collection
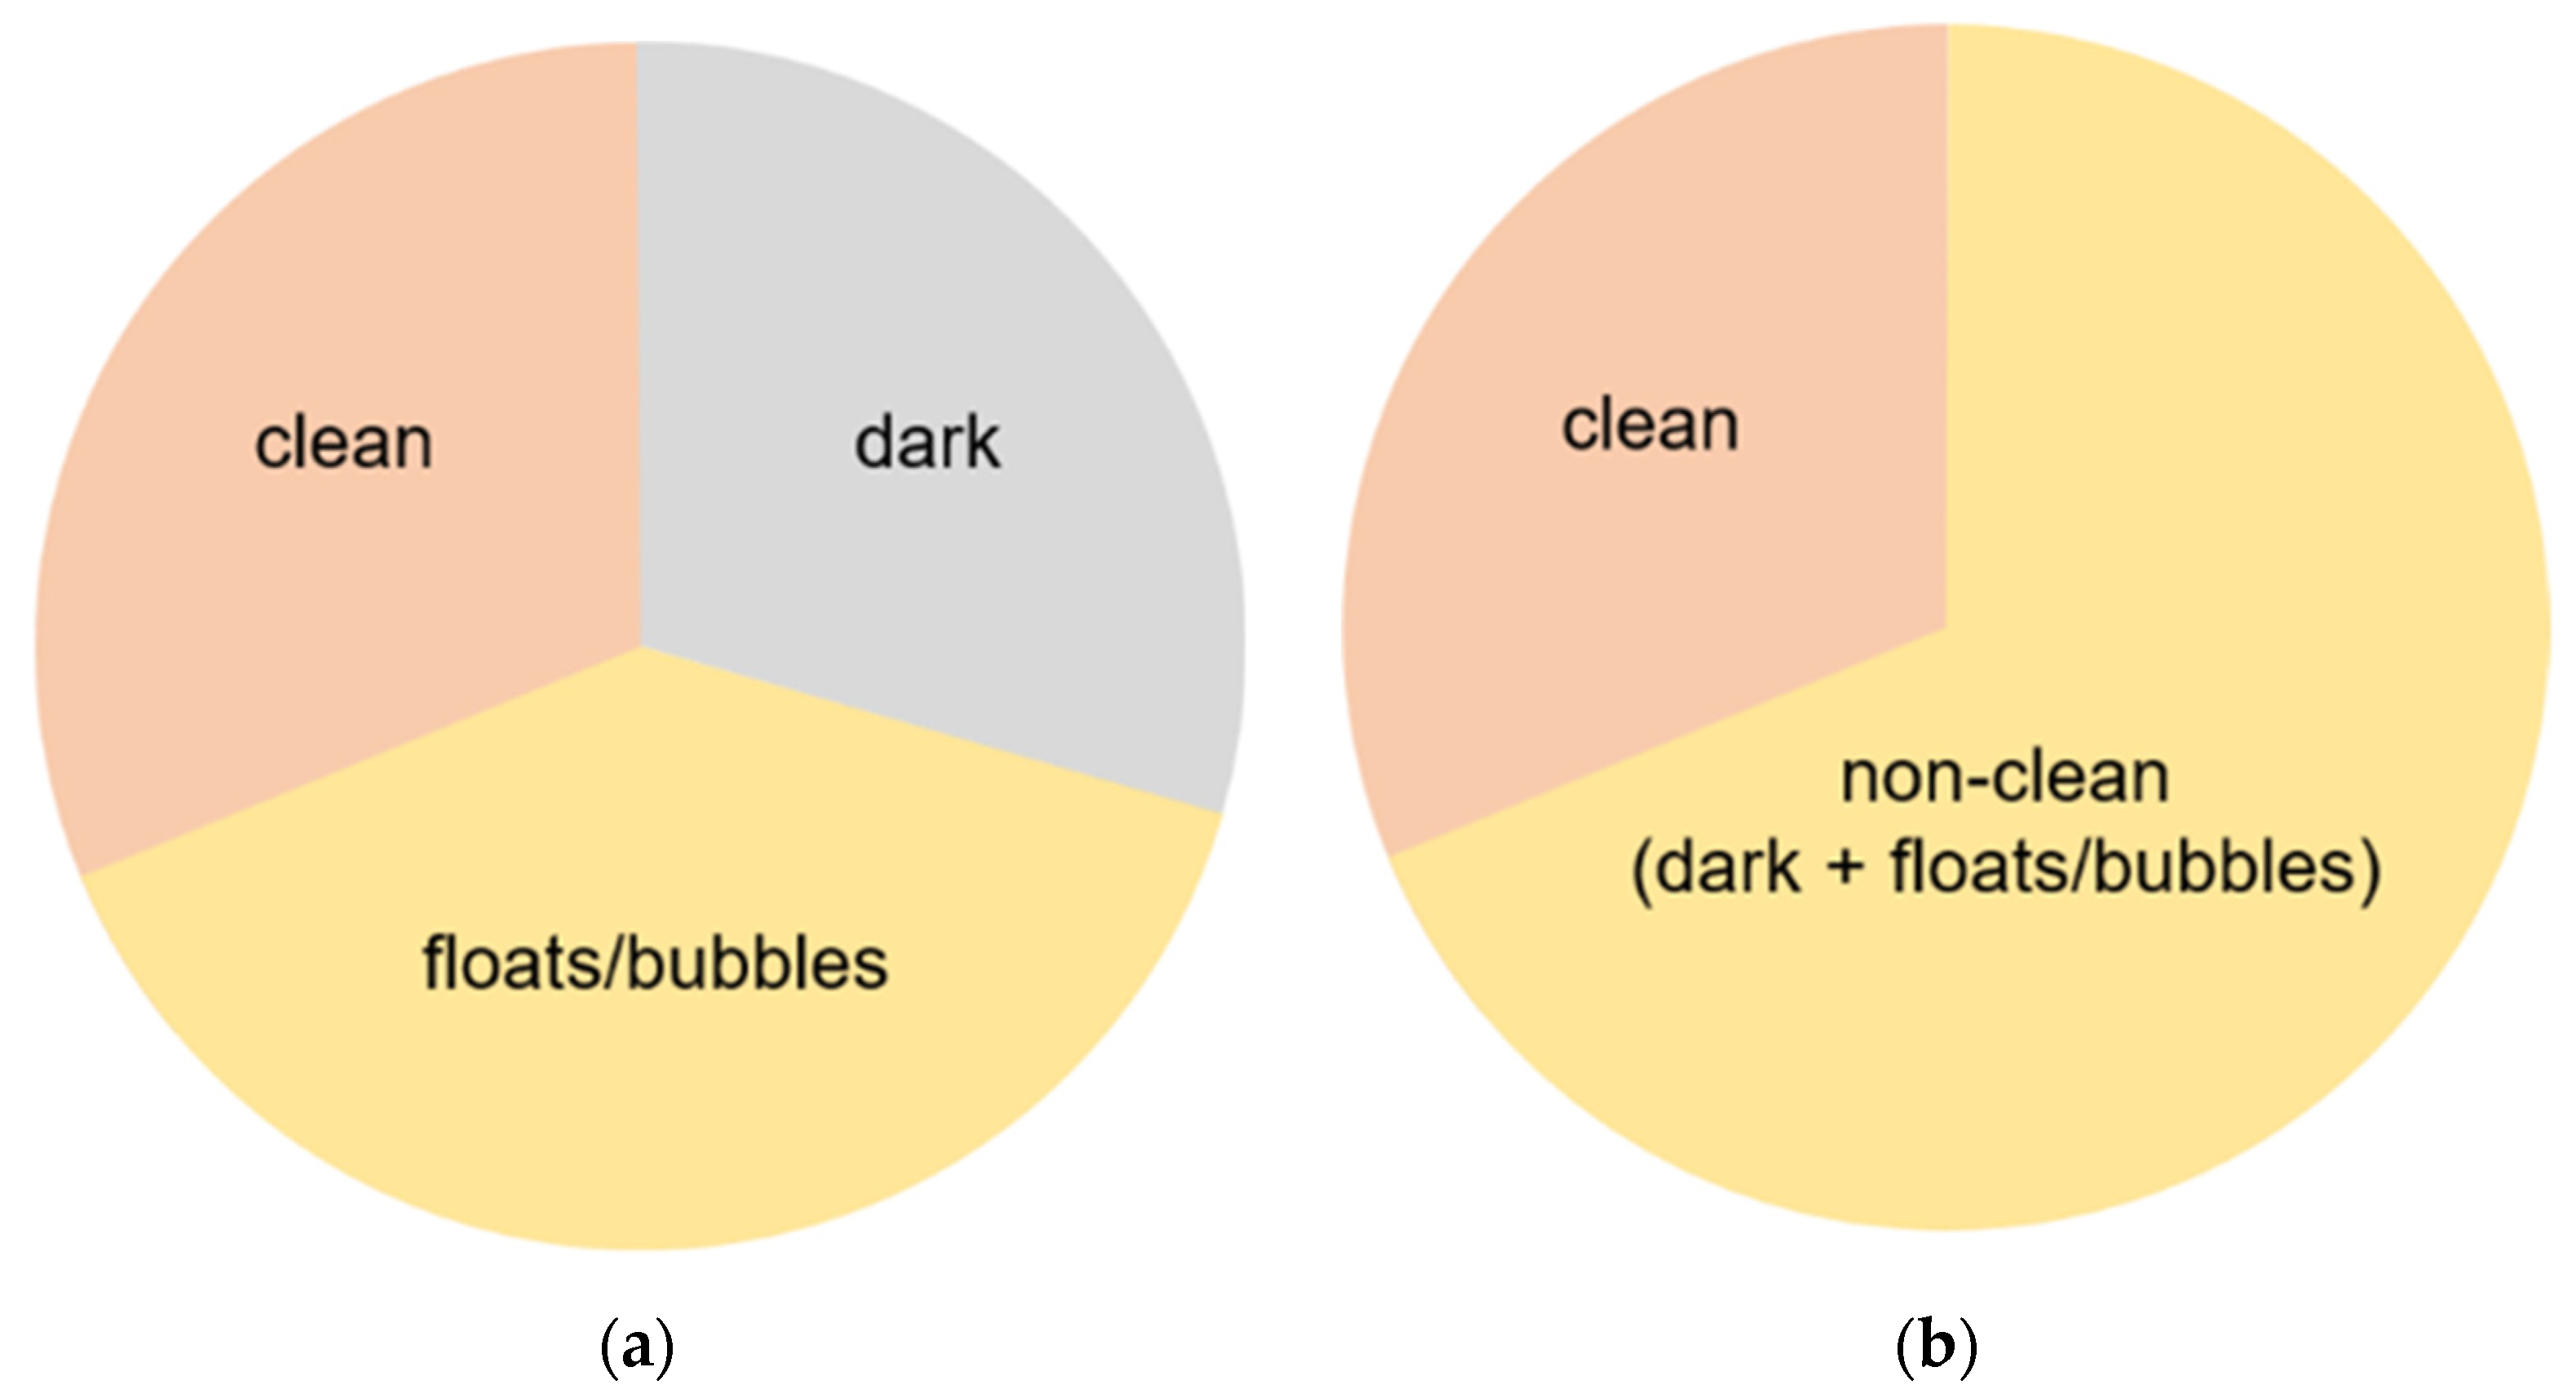
2.2. Data Processing/Refinement
2.3. Implementation Details
2.4. Evaulation Metrics
2.5. Visualization Scale
3. Results
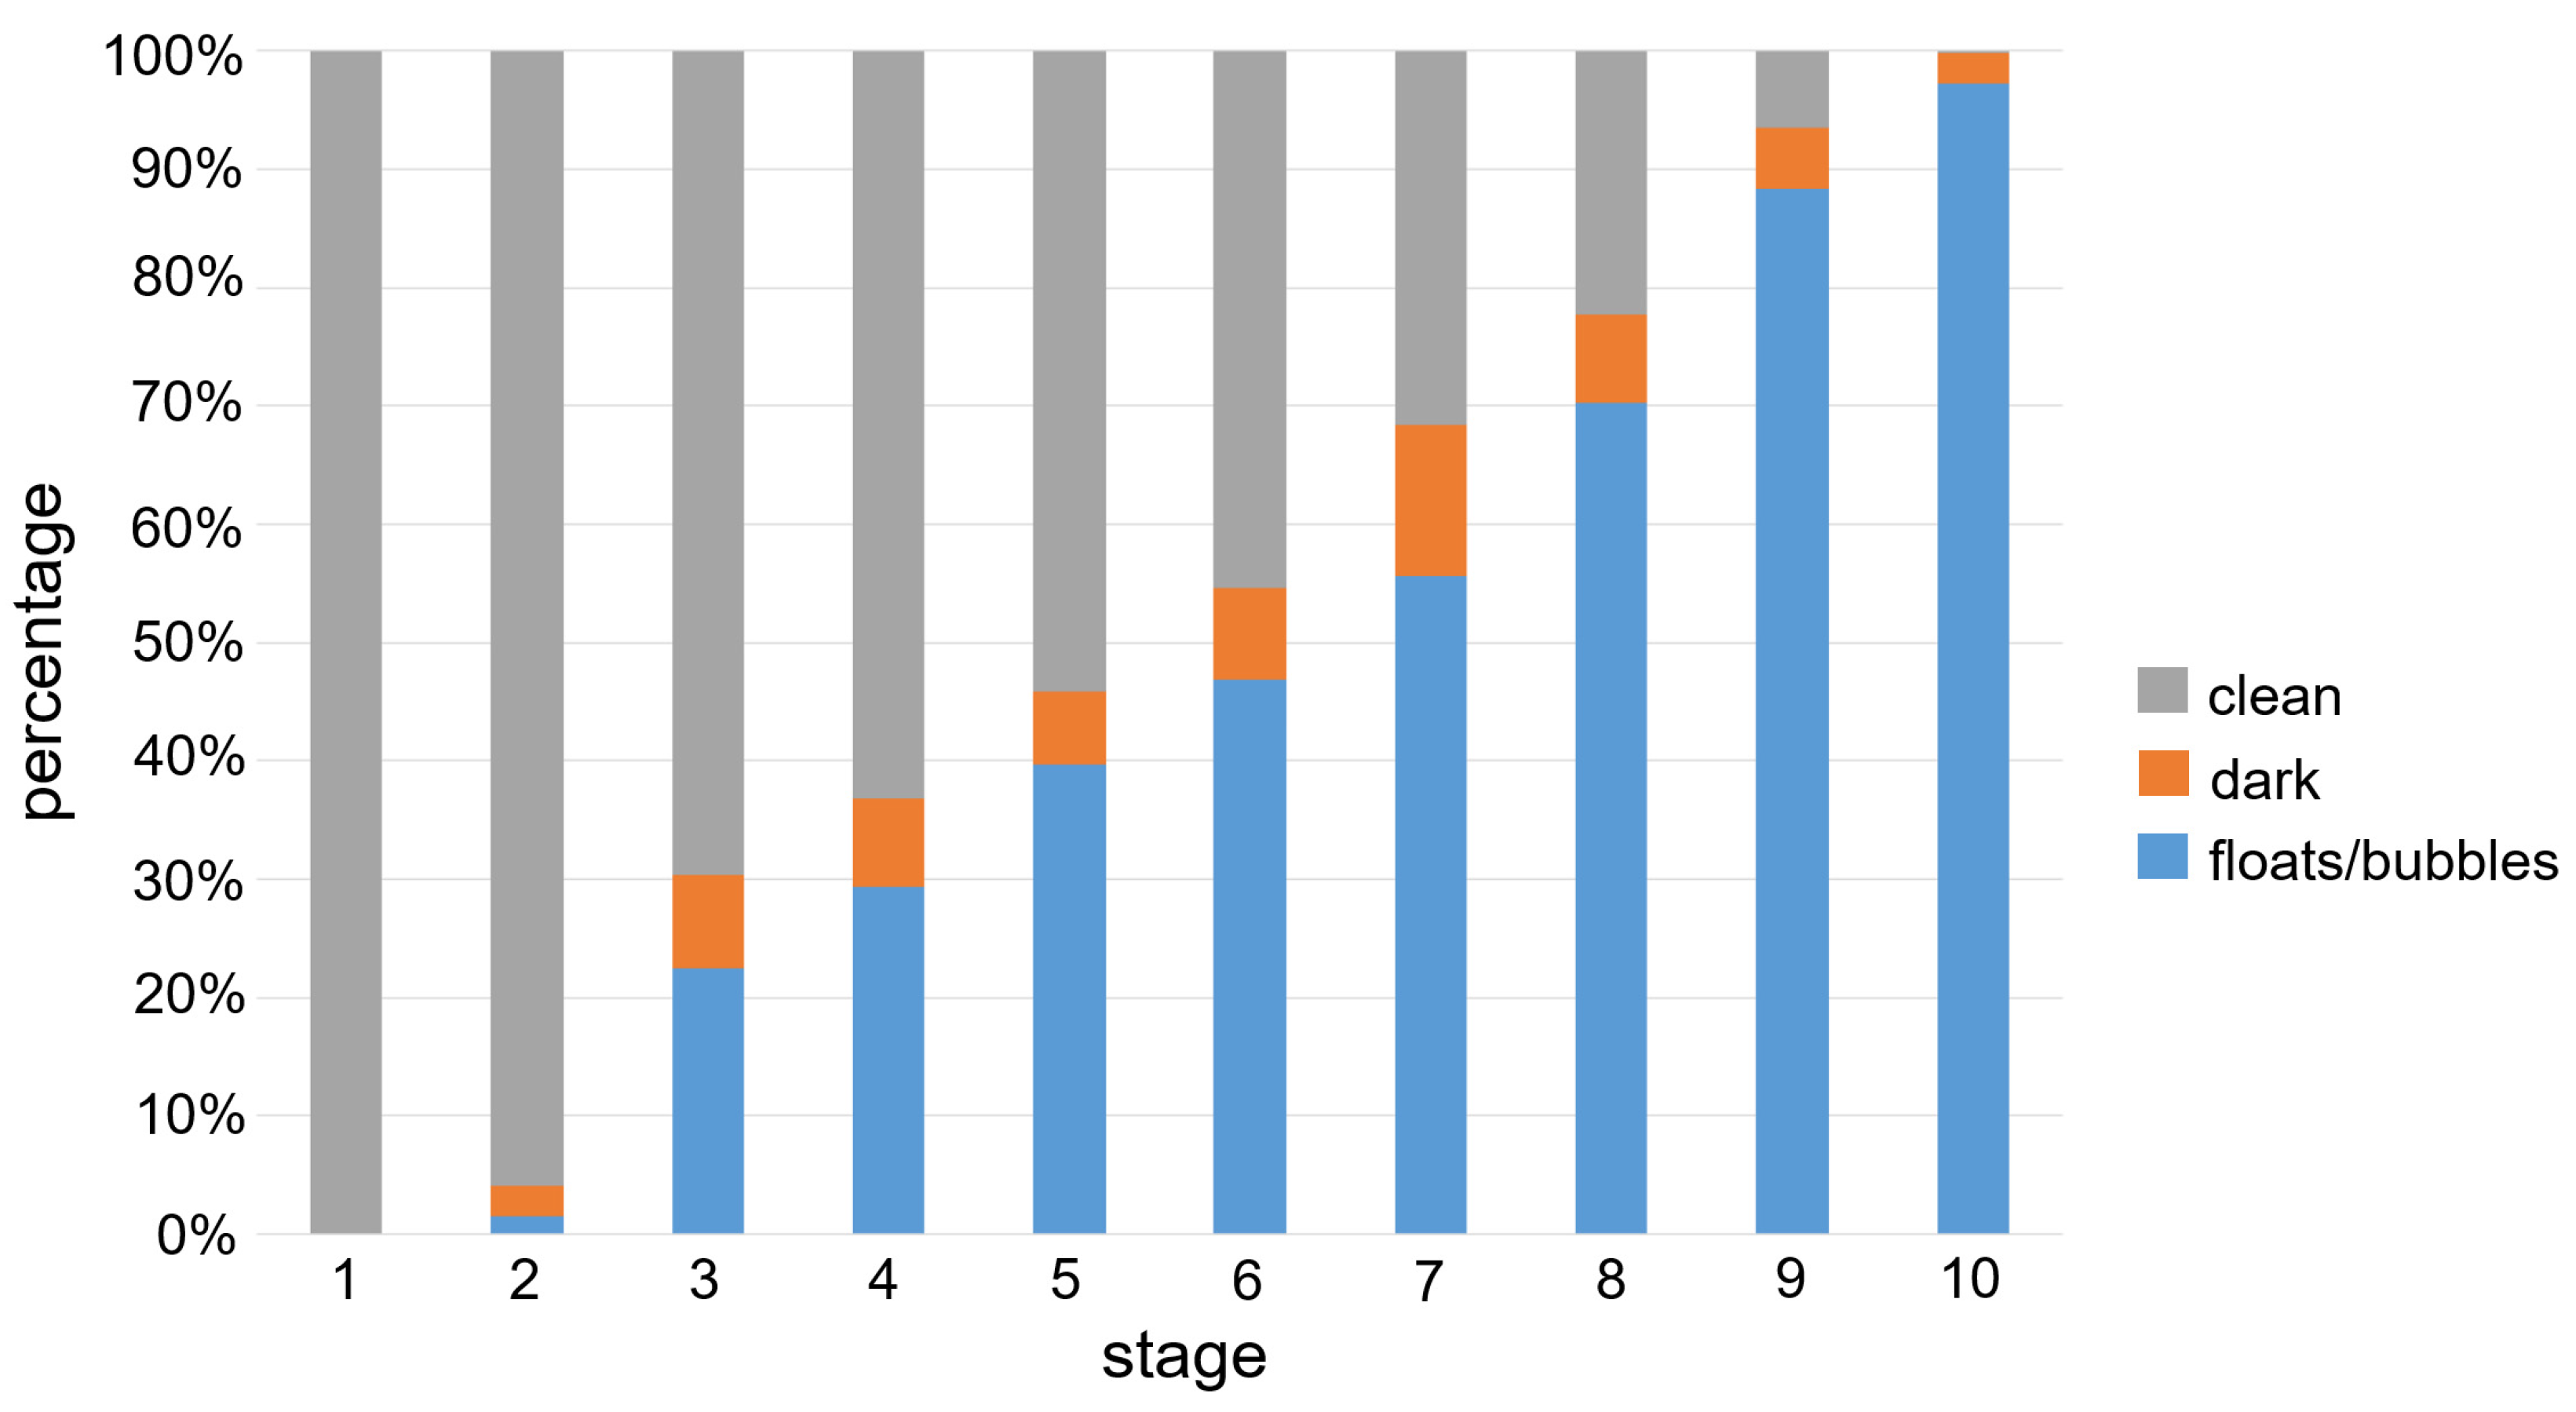
3.1. Data Details
3.2. Experimental Results
3.2.1. Overall Performance
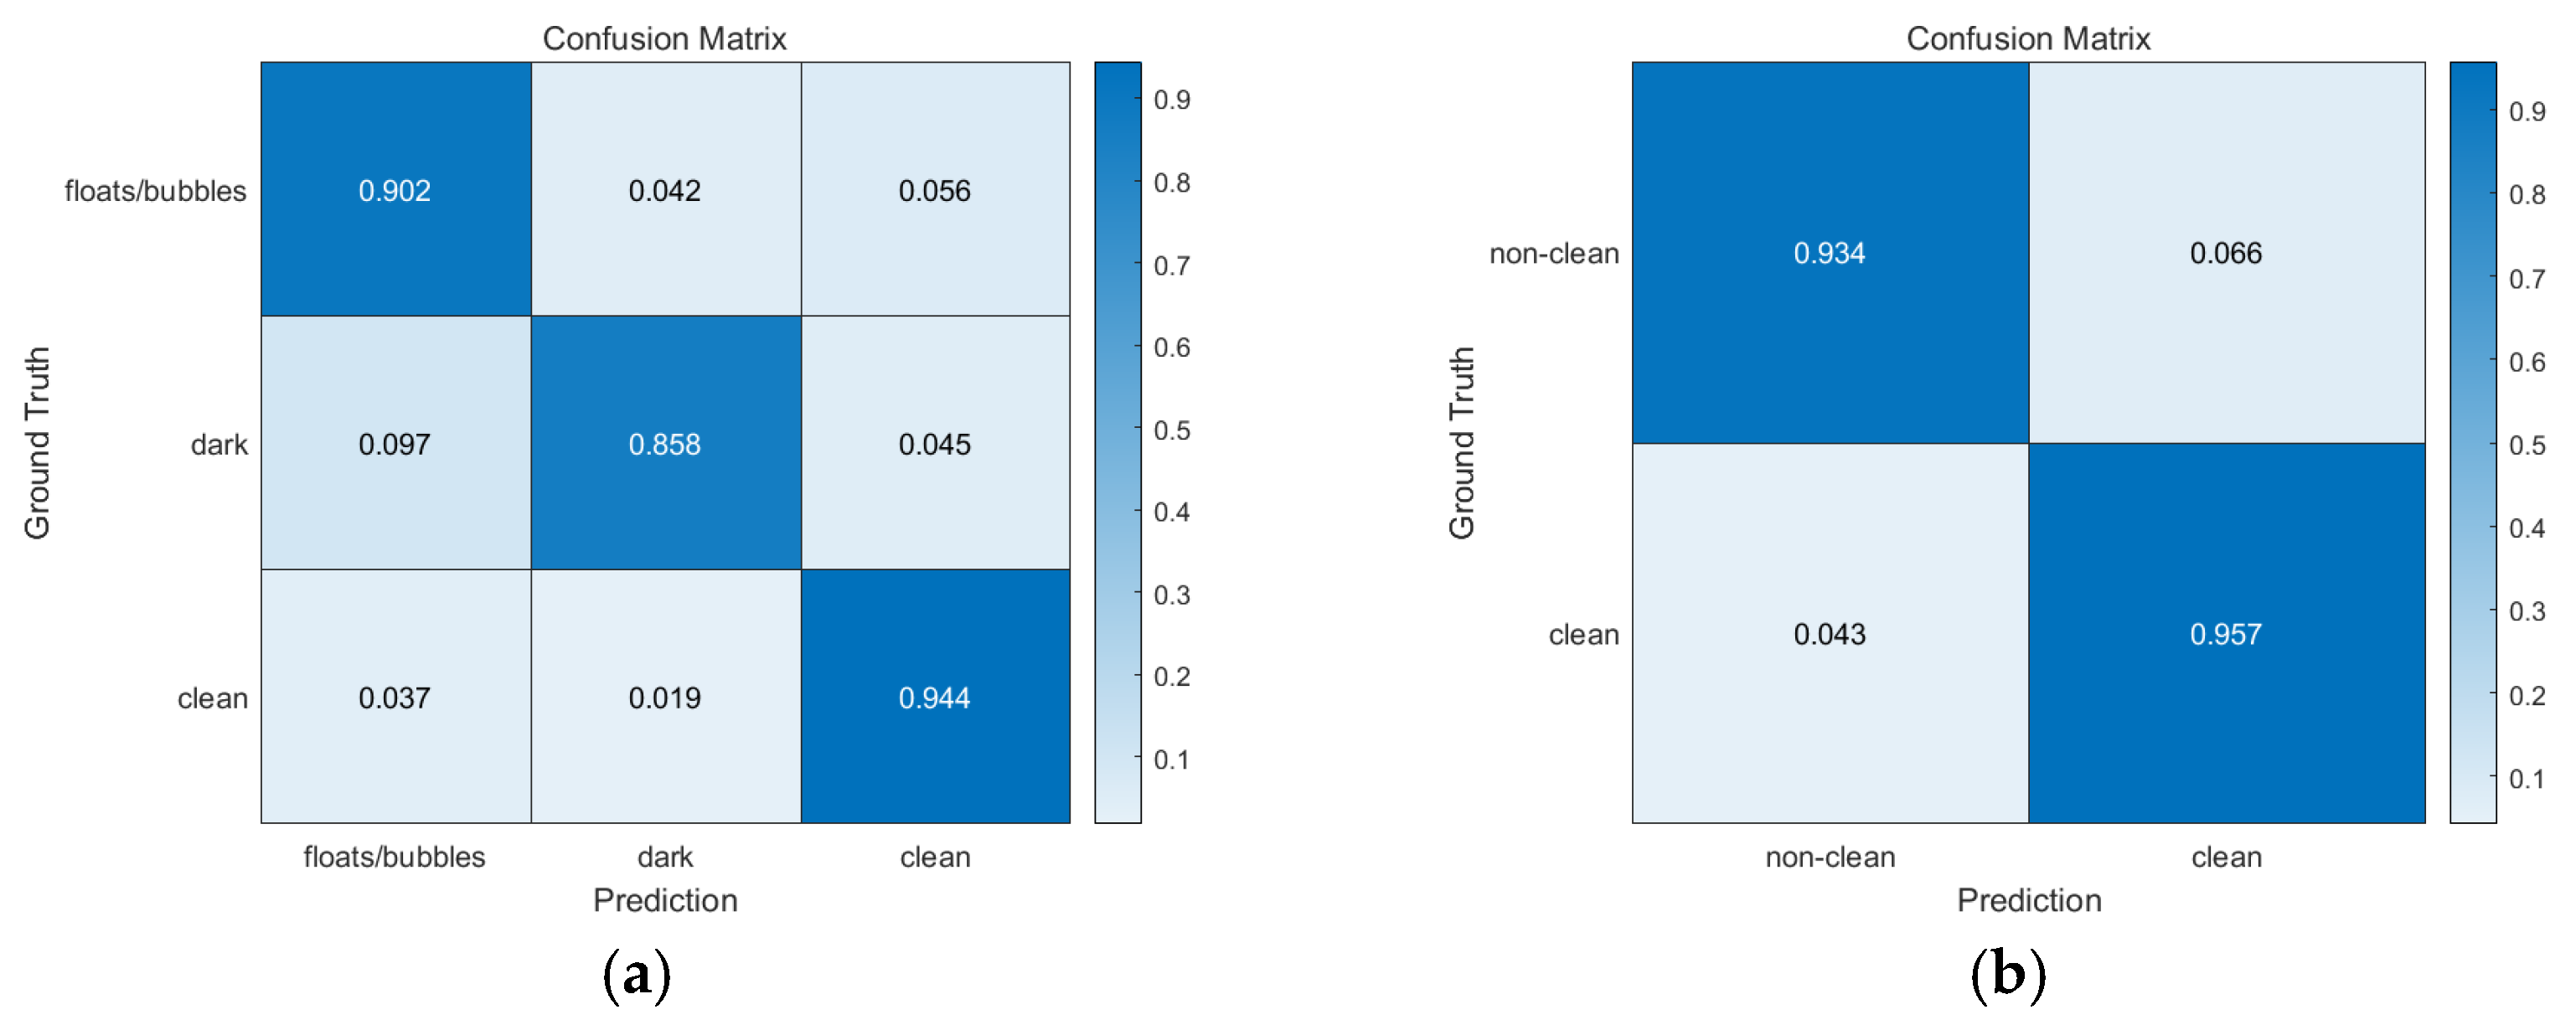
3.2.2. Detailed Results
3.2.3. Classification of Visible (Clean) Region
4. Discussion
4.1. Building a Semantic Segmentation CE Dataset
4.2. Semantic Segmentation and VS Evaluation
4.3. Clean Region Prediction Performance
4.4. Limitations of Our Study
5. Conclusions
Author Contributions
Funding
Institutional Review Board Statement
Informed Consent Statement
Data Availability Statement
Acknowledgments
Conflicts of Interest
References
- Iddan, G.; Meron, G.; Glukhovsky, A.; Swain, P. Wireless capsule endoscopy. Nature 2000, 405, 417. [Google Scholar] [CrossRef] [PubMed]
- Jones, B.H.; Fleischer, D.E.; Sharma, V.K.; Heigh, R.I.; Shiff, A.D.; Hernandez, J.L.; Leighton, J.A. Yield of Repeat Wireless Video Capsule Endoscopy in Patients with Obscure Gastrointestinal Bleeding. Am. J. Gastroenterol. 2005, 100, 1058–1064. [Google Scholar] [CrossRef] [PubMed]
- Brotz, C.; Nandi, N.; Conn, M.; Daskalakis, C.; DiMarino, M.; Infantolino, A.; Katz, L.C.; Schroeder, T.; Kastenberg, D. A validation study of 3 grading systems to evaluate small-bowel cleansing for wireless capsule endoscopy: A quantitative index, a qualitative evaluation, and an overall adequacy assessment. Gastrointest. Endosc. 2009, 69, 262–270.e1. [Google Scholar] [CrossRef] [PubMed]
- Viazis, N.; Sgouros, S.; Papaxoinis, K.; Vlachogiannakos, J.; Bergele, C.; Sklavos, P.; Panani, A.; Avgerinos, A. Bowel preparation increases the diagnostic yield of capsule endoscopy: A prospective, randomized, controlled study. Gastrointest. Endosc. 2004, 60, 534–538. [Google Scholar] [CrossRef]
- Villa, F.; Signorelli, C.; Rondonotti, E.; de Franchis, R. Preparations and Prokinetics. Gastrointest. Endosc. Clin. N. Am. 2006, 16, 211–220. [Google Scholar] [CrossRef] [PubMed]
- Rex, D.K.; Schoenfeld, P.S.; Cohen, J.; Pike, I.M.; Adler, D.G.; Fennerty, M.B.; Lieb, J.G.; Park, W.G.; Rizk, M.K.; Sawhney, M.S.; et al. Quality indicators for colonoscopy. Gastrointest. Endosc. 2014, 81, 31–53. [Google Scholar] [CrossRef] [PubMed]
- Goyal, J.; Goel, A.; McGwin, G.; Weber, F. Analysis of a grading system to assess the quality of small-bowel preparation for capsule endoscopy: In search of the Holy Grail. Endosc. Int. Open 2014, 2, E183–E186. [Google Scholar] [CrossRef] [PubMed] [Green Version]
- Park, S.C.; Keum, B.; Hyun, J.J.; Seo, Y.S.; Kim, Y.S.; Jeen, Y.T.; Chun, H.J.; Um, S.H.; Kim, C.D.; Ryu, H.S. A novel cleansing score system for capsule endoscopy. World J. Gastroenterol. 2010, 16, 875–880. [Google Scholar] [CrossRef] [PubMed]
- Van Weyenberg, S.J.B.; De Leest, H.T.J.I.; Mulder, C.J.J. Description of a novel grading system to assess the quality of bowel preparation in video capsule endoscopy. Endoscopy 2011, 43, 406–411. [Google Scholar] [CrossRef] [PubMed] [Green Version]
- Ali, E.A.; Histace, A.; Camus, M.; Gerometta, R.; Becq, A.; Pietri, O.; Nion-Larmurier, I.; Li, C.; Chaput, U.; Marteau, P.; et al. Development and validation of a computed assessment of cleansing score for evaluation of quality of small-bowel visualization in capsule endoscopy. Endosc. Int. Open 2018, 6, E646–E651. [Google Scholar] [CrossRef] [PubMed] [Green Version]
- Nam, J.H.; Hwang, Y.; Oh, D.J.; Park, J.; Kim, K.B.; Jung, M.K.; Lim, Y.J. Development of a deep learning-based software for calculating cleansing score in small bowel capsule endoscopy. Sci. Rep. 2021, 11, 4417. [Google Scholar] [CrossRef] [PubMed]
- Chen, L.-C.; Papandreou, G.; Schroff, F.; Adam, H. Rethinking atrous convolution for semantic image segmentation. arXiv 2017, arXiv:1706.05587. [Google Scholar]
- Long, J.; Shelhamer, E.; Darrell, T. Fully convolutional networks for semantic segmentation. In Proceedings of the IEEE Conference on Computer Vision and Pattern Recognition, Boston, MA, USA, 7–12 June 2015; pp. 3431–3440. [Google Scholar]
- Ronneberger, O.; Fischer, P.; Brox, T. U-net: Convolutional networks for biomedical image segmentation. In Proceedings of the International Conference on Medical Image Computing and Computer-Assisted Intervention, Strasbourg, France, 27 September–1 October 2015; pp. 234–241. [Google Scholar]
- He, K.; Zhang, X.; Ren, S.; Sun, J. Deep Residual Learning for Image Recognition. In Proceedings of the 2016 IEEE Conference on Computer Vision and Pattern Recognition (CVPR), Las Vegas, NV, USA, 27–30 June 2016; pp. 770–778. [Google Scholar]
- Simonyan, K.; Zisserman, A. Very deep convolutional networks for large-scale image recognition. arXiv 2014, arXiv:1409.1556. [Google Scholar]
- Guo, Y.; Liu, Y.; Georgiou, T.; Lew, M.S. A review of semantic segmentation using deep neural networks. Int. J. Multimed. Inf. Retr. 2017, 7, 87–93. [Google Scholar] [CrossRef] [Green Version]
- Ahmed, I.; Ahmad, M.; Alam Khan, F.; Asif, M. Comparison of Deep-Learning-Based Segmentation Models: Using Top View Person Images. IEEE Access 2020, 8, 136361–136373. [Google Scholar] [CrossRef]

| Architecture | Encoder | Decoder | |
|---|---|---|---|
| Backbone | ASPP (Atrous Spatial Pyramid Pooling) | ||
| DeepLab v3 | ResNet 50 | ||
| FCN | VGG16 | ||
| U-Net | . | ||
| Stage 1 | Stage 2 | Stage 3 | Stage 4 | Stage 5 | Stage 6 | Stage 7 | Stage 8 | Stage 9 | Stage 10 | ||
|---|---|---|---|---|---|---|---|---|---|---|---|
| Input Image |  |  |  |  |  |  |  |  |  |  | |
| 3-class | GT Image |  |  |  |  |  |  |  |  |  |  |
| 2-class |  |  |  |  |  |  |  |  |  |  | |
| Training Examples Count | 744 | 775 | 845 | 832 | 695 | 660 | 820 | 855 | 846 | 916 | |
| Testing Examples Count | 256 | 234 | 173 | 179 | 286 | 327 | 186 | 147 | 154 | 103 | |
| Total Examples Count | 1000 | 1009 | 1018 | 1011 | 981 | 987 | 1006 | 1002 | 1000 | 1019 | |
| mIoU (Jaccard Index) | Dice Index | |
|---|---|---|
| DeepLab v3 | 0.7716 | 0.8627 |
| FCN | 0.7667 | 0.8602 |
| U-Net | 0.7594 | 0.8567 |
| Patient Number | 3-Class | 2-Class | Example Image | ||||||
|---|---|---|---|---|---|---|---|---|---|
| mIoU (Jaccard Index) | Dice Index | GT VS | Predicted VS | mIoU (Jaccard Index) | Dice Index | GT VS | Predicted VS | ||
| 1 | 0.7743 | 0.8615 | 0.6355 | 0.6442 | 0.9070 | 0.9511 | 0.6355 | 0.6547 |  |
| 2 | 0.7964 | 0.8807 | 0.3598 | 0.3482 | 0.8988 | 0.9465 | 0.3598 | 0.3549 |  |
| 3 | 0.7097 | 0.8251 | 0.4471 | 0.4141 | 0.8562 | 0.9225 | 0.4471 | 0.4386 |  |
| 4 | 0.7031 | 0.7846 | 0.7498 | 0.7395 | 0.9260 | 0.9613 | 0.7498 | 0.7450 |  |
| 5 | 0.7303 | 0.8305 | 0.6069 | 0.5759 | 0.8718 | 0.9313 | 0.6069 | 0.5860 |  |
| 6 | 0.7655 | 0.8584 | 0.6743 | 0.6824 | 0.8783 | 0.9347 | 0.6743 | 0.6950 |  |
| 7 | 0.7608 | 0.8559 | 0.7374 | 0.7273 | 0.8826 | 0.9368 | 0.7374 | 0.7423 |  |
| 8 | 0.8054 | 0.8828 | 0.5007 | 0.4869 | 0.9330 | 0.9654 | 0.5007 | 0.4940 |  |
| 9 | 0.8071 | 0.8891 | 0.5190 | 0.5181 | 0.8928 | 0.9434 | 0.5190 | 0.5237 |  |
| 10 | 0.7990 | 0.8838 | 0.7179 | 0.7089 | 0.8924 | 0.9425 | 0.7179 | 0.7258 |  |
| Overall | 0.7716 | 0.8627 | N/A | N/A | 0.8972 | 0.9457 | N/A | N/A | N/A |
| Patient 3 | Patient 4 | |
|---|---|---|
| Confusion Type | dark → floats/bubbles | floats/bubbles → dark |
| Example Image | 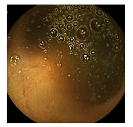 | 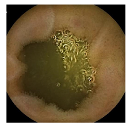 |
| GT Image | 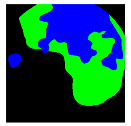 |  |
| Prediction Image | 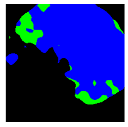 |  |
| . | Stage 1 | Stage 2 | Stage 3 | Stage 4 | Stage 5 | Stage 6 | Stage 7 | Stage 8 | Stage 9 | Stage 10 | |
|---|---|---|---|---|---|---|---|---|---|---|---|
| Input Image |  |  |  |  |  |  |  |  |  |  | |
| 3-class | GT Image |  |  |  |  |  |  |  |  |  |  |
| Prediction Image |  |  |  |  |  |  |  |  |  |  | |
| 2-class | GT Image |  |  |  |  |  |  |  |  |  |  |
| Prediction Image |  |  |  |  |  |  |  |  |  |  | |
Publisher’s Note: MDPI stays neutral with regard to jurisdictional claims in published maps and institutional affiliations. |
© 2022 by the authors. Licensee MDPI, Basel, Switzerland. This article is an open access article distributed under the terms and conditions of the Creative Commons Attribution (CC BY) license (https://creativecommons.org/licenses/by/4.0/).
Share and Cite
Ju, J.-W.; Jung, H.; Lee, Y.J.; Mun, S.-W.; Lee, J.-H. Semantic Segmentation Dataset for AI-Based Quantification of Clean Mucosa in Capsule Endoscopy. Medicina 2022, 58, 397. https://doi.org/10.3390/medicina58030397
Ju J-W, Jung H, Lee YJ, Mun S-W, Lee J-H. Semantic Segmentation Dataset for AI-Based Quantification of Clean Mucosa in Capsule Endoscopy. Medicina. 2022; 58(3):397. https://doi.org/10.3390/medicina58030397
Chicago/Turabian StyleJu, Jeong-Woo, Heechul Jung, Yeoun Joo Lee, Sang-Wook Mun, and Jong-Hyuck Lee. 2022. "Semantic Segmentation Dataset for AI-Based Quantification of Clean Mucosa in Capsule Endoscopy" Medicina 58, no. 3: 397. https://doi.org/10.3390/medicina58030397
APA StyleJu, J.-W., Jung, H., Lee, Y. J., Mun, S.-W., & Lee, J.-H. (2022). Semantic Segmentation Dataset for AI-Based Quantification of Clean Mucosa in Capsule Endoscopy. Medicina, 58(3), 397. https://doi.org/10.3390/medicina58030397