Article

A Non-invasive and Real-time Monitoring of the Regulation of Photosynthetic Metabolism Biosensor Based on Measurement of Delayed Fluorescence in Vivo

MOE Key Laboratory of Laser Life Science & Institute of Laser Life Science, South China NormalUniversity, Guangzhou 510631, China
*
Author to whom correspondence should be addressed.
Sensors 2007, 7(1), 52-66; https://doi.org/10.3390/s7010052
Submission received: 12 November 2006 / Accepted: 17 January 2007 / Published: 24 January 2007
(This article belongs to the Special Issue Physiological Sensing)

Abstract

:
In this paper, a new principle biosensor for non-invasive monitoring of the regulation of photosynthetic metabolism based on quantitative measurement of delayed fluorescence (DF) is developed. The biosensor, which uses light-emitting diode lattice as excitation light source and a compact Single Photon Counting Module to collect DF signal, is portable and can evaluate plant photosynthesis capacity in vivo. Compared with its primary version in our previous report, the biosensor can better control environmental factors. Moreover, the improved biosensor can automatically complete the measurements of light and CO2 response curves of DF intensity. In the experimental study, the testing of the improved biosensor has been made in soybean (Glycine max Zaoshu No. 18) seedlings treated with NaHSO3 to induce changes in seedlings growth and photosynthetic metabolism. Contrast evaluations of seedlings photosynthesis were made from measurements of net photosynthesis rate (Pn) based on consumption of CO2 in tested plants. Current testing results have demonstrated that the improved biosensor can accurately determine the regulatory effects of NaHSO3 on photosynthetic metabolism. Therefore, the biosensor presented here could be potential useful for real-time monitoring the regulatory effects of plant growth regulators (PGRs) and other exogenous chemical factors on plant growth and photosynthetic metabolism.

1. Introduction

Plant growth regulators (PGRs) and other exogenous chemical factors play important roles in regulating a wide range of physiological processes of plant growth and development such as photosynthetic metabolism, cellular differentiation, stomatal movements etc. [1]. Among these physiological processes, photosynthetic metabolism is the primary limiting factor for crop production [2]. However, most of PGRs and other exogenous chemical factors always enhance photosynthetic metabolism at low concentrations but inhibit at high concentrations. For example, sodium bisulfite (NaHSO3) at low concentrations increases photosynthetic rate to a high level and thereby crop production in some crop species [3, 4], but it can destroy the integrity of photosynthetic apparatus and inhibit photosynthesis with the increasing of concentrations [5, 6]. Therefore, in many areas of plant biology and agrochemical research, there is an increasing requirement for non-invasive and in vivo monitoring the effects of PGRs and other exogenous chemical factors on plant growth and photosynthetic metabolism [7].
A simple, non-invasive, and real-time method basing on light-induced delayed fluorescence (DF) technique for detecting changes of plant growth and photosynthetic metabolism caused by PGRs and other exogenous chemical factors in seedlings is described in this study. DF is a phenomenon of photon emission by the photosynthetic apparatus shortly after its stimulation by visible radiation [8, 9]. For plants, DF mainly comes from the inverse photochemistry reactions in the plant photosystem [9]. The mechanism about DF generation has been described in greater detail elsewhere [6, 8, 10, 11]. DF is more intrinsically related to photosynthetic process than chlorophyll fluorescence, and thus can provide more valuable information about photosynthetic processes [12, 13]. Because there exists a linear correlation between the DF intensity and chlorophyll content within a limited rang, the energy conversion in photosynthesis can be evaluated by quantifying DF [14]. Loss of chlorophyll is the external manifestation of the onset for leaf senescence. Recently, the interrelationships between DF characteristics and leaf senescence have also been reported [15]. Investigation of DF invokes particular interest because its intensity depends directly on the rate of backward electron transport reactions in the reaction center of photosystem II (PSII). In its turn backward electron transport reactions are determined by quantum efficiency of primary processes of photosynthesis [16]. Increasing evidences have suggested that, when photorespiration was suppressed, there is a good correlation between the efficiency of photosystem and the quantum yield of CO2 fixation [17, 18]. In previous reports we have demonstrated that there is a linear correlation between the DF intensity and net photosynthesis rate (Pn) in leaves of spinach (Spinacia oleracea) under its biological status [8] and soybean (Glycine max Zaoshu No. 18) even under salt stress conditions [19]. Therefore, DF is a sensitive fluorescence label of the photochemical efficiency of charge separation at P680 and an excellent marker for evaluating in vivo plant photosynthesis ability with less interferences of environment [8].
So far, there are three types of methods for quantifying Pn by measuring the rates of CO2 consumption, O2 evolution, and increment for leaves' dry matter [8]. Most commercially available instruments for measuring Pn, such as the prevalent LI-6400 series of portable photosynthesis system (LI-COR, USA), are based on gas exchange technology, and, as a result, are more readily affected by environmental factors. Variations in environmental factors would cause substantial differences in the measurement results. Generally, recording a steady-state Pn needs at least 10 min after the leaf being irradiated in the leaf chamber [20].
In this paper, a new principle biosensor for non-invasive and real-time monitoring of the regulation of photosynthetic metabolism based on quantitative measurement of DF is developed. According to maximum and stable intensity of DF, excitation parameters of DF have been optimized experimentally. Compared with common methods for measuring Pn based on gas exchange, the developed biosensor is an all-weather measuring instrument, and it utilizes intrinsic DF as the measurement marker and can quickly quantify the plant photosynthesis performance [19]. To the best of our knowledge, a drawback in the past to using the light-induced DF has been no portability of commercially available fluorimeters and home-made system such as FL-2006, LS 50B or 55 Luminescence Spectrophotometer, intensified CCD, and phosphoroscope that only can be used in the manicured segment of the detached leaves or the samples in liquid [8, 21, 22]. Nevertheless, it is necessary to investigate the regulatory effects of PGRs on plant growth and photosynthetic metabolism under its normally physiological conditions. The aim of the paper is to develop and improve a portable DF biosensor system for in vivo, non-invasive, and real-time monitoring of changes in plant growth and photosynthetic metabolism using the light-induced DF. The current investigation has demonstrated that DF measured by the biosensor well correlates with Pn from commercially available photosynthesis system in soybean seedlings under NaHSO3 regulation conditions.

2. Materials and Methods

2.1. Plant Material and NaHSO3 Treatments

Seedlings of soybean of Glycine max Zaoshu No. 18 were used in this experiment. The seeds were germinated on moistened filter paper at 25°C in dark. After germination, seedlings were transplanted into 20 cm diameter pot containing a mixture of peat moss: perilite: and sand (6:3:1, v/v). The seedlings were grown in plant growth chamber (Conviron, model E7/2, Winnipeg, Canada) under a relative humidity (RH) of 70/80% (day/night), a temperature of 26/20°C (day/night), and a photoperiod of 14-h with an irradiation intensity of 400 μmol photons m−2 s−1 on the plants top. After a week, the seedlings were selected for uniform size. Two to three plants were maintained per pot. Plants were watered every day and fertilized with a nutrition solution (1:500 Hyponex 5–10−5, Hyponex, Oosaka, Japan) once a week. The plants used for the experiments were seedlings of 30-day-old. A microsprayer was used to spray water (as control) or NaHSO3 on the leaves to induce changes in seedlings growth and photosynthetic metabolism at 8 A.M. Experiments were performed on the fully expanded second compound leaf. All Pn and DF signal measurements were carried out at a leaf surface temperature of 24 ± 0.5°C and leaf chamber RH of 85 ± 1% in plant growth chamber, where the same RH, temperature and CO2 concentration within between 380–420 ppm were controlled throughout experiments. Each experiment was repeated at least 9 times.

2.2. Measurement of Photosynthesis Rate (Pn)

Pn was measured directly using a commercially available system (LI-6400; LI-COR, Inc., USA) equipped with the standard leaf chamber (2×3 cm) and the artificial illumination (irradiated from a modulated tungsten lamp). Pn of leaves treated with different concentrations NaHSO3 for 72 h and 1 mM NaHSO3 for different times were determined at a leaf chamber CO2 concentration of 400 ppm after the leaves in the leaf cuvette being irradiated about 15-min by an irradiation of 1000 μmol photons m−2 s−1. Measurements of Pn in response to irradiance intensity were made at CO2 concentration of 400 ppm in the leaf chamber. For measuring the response of Pn to CO2 concentration, a saturating irradiance of 1000 μmol photons m−2 s−1 was turned on to irradiate the leaf surface.

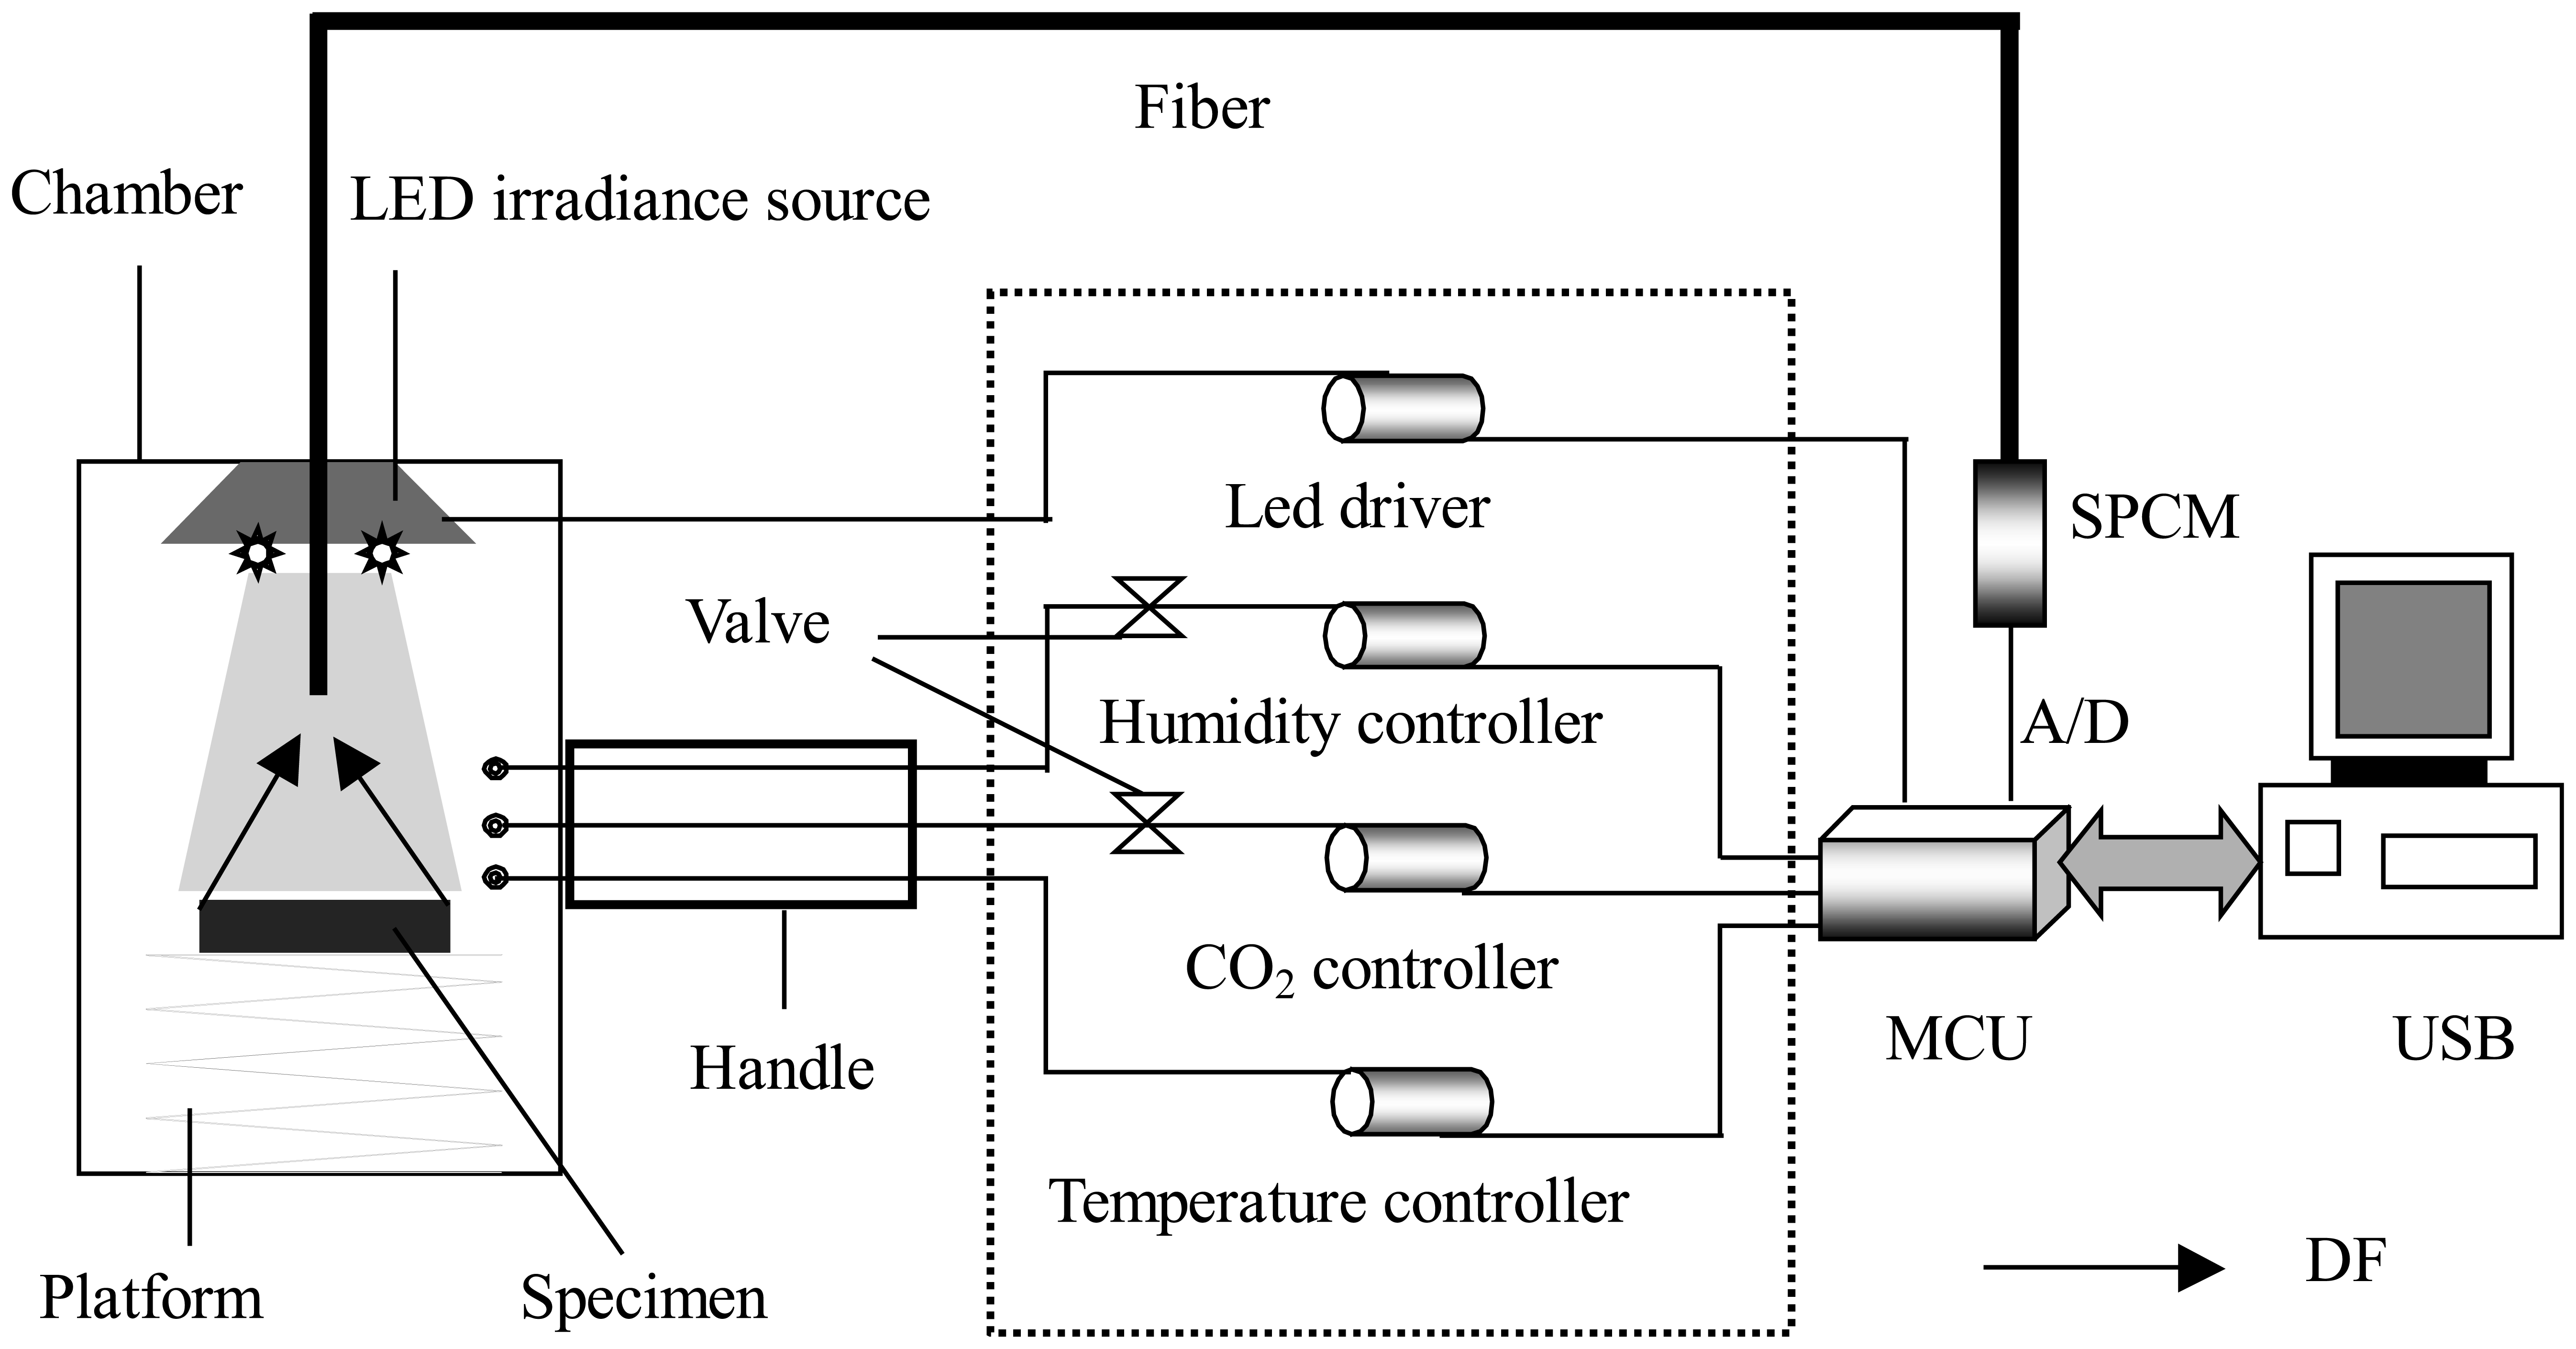
2.3. In Vivo DF Biosensor System and in Vivo DF Measurement

DF emission in the time window from 0.26 to 5.26 s after being irradiated was recorded with a custom-built DF biosensor system. The diagram of the system is shown in Figure 1. In previous report we have briefly introduced the system in detecting the effects of salt stress on soybean physiology [19]. Here the technical details of the improved biosensor will be presented in greater detail.

2.3.1. Process of Operation

Two different operation modes, remote and local control, were optional. The operation of the main instrument was carried out through a personal computer (PC) in the remote control mode, while it was accomplished on the front panel of the instrument in the local mode. The measurement of DF signal was divided into two steps: background survey and meterage of mix signal including DF and background. DF was obtained by subtracting background from mix signal and directly displayed on a display (Local control mode) or PC screen (Remote control mode). Concrete operation process was given below.
Samples were irradiated by a set of light-emitting diode (LED) (λ = 628 nm, half wave width = 20 nm, single duct output luminous flux = 20 lm). All LEDs were uniformly arrayed along a circumference for homogeneous perpendicular superficial irradiation of the leaves. The irradiance intensity was adjusted by changing the current and controlled within the range between 0 and 3000 μmol photons m−2 s−1. DF was monitored at an angle of 0° with respect to the incident LEDs light. Each sample, after Pn measurement, was immediately placed inside the sample chamber of the system to dark-adapt for 5-min before the irradiation source turned on. The sample chamber could reach into the plant growth chamber to in vivo measure DF from plants. Using custom-built humidity, temperature, and CO2 controller, respectively, controlled the RH, temperature and CO2 concentration of the sample chamber. DF from the sample, immediately after the illumination period, was collected by an optical fiber bundle and transmitted to an ultra-high-sensitive Single Photon Counting Module (SPCM (MP963, Perkin-Elmer, Wiesbaden, Germany)) with a wavelength detection range of 185–850 nm. A 660 nm long-pass filter was placed in front of the optical fiber to protect SPCM from scattered irradiation light. The output signal, which had been amplified and discriminated by the SPCM, was collected and processed by a micro control unit (MCU (AT89c55)) in the local control mode. The collected and processed signal could be storied in a memorizer (AT29c020) before further data analysis using a PC. The samples were irradiated by LEDs light for 0.2 s. The data collection started at 0.26 s upon the completion of the light irradiation and lasted for 5 s because the DF signal was stable at 0.26 s and decreased to nearly zero at 5.26 s. DF intensity was obtained by the integration between 0.26 and 5.26 s in the DF decay dynamics curve and registered as count per second (cps).
DF measurements of seedlings treated with different concentrations NaHSO3 for 72 h and 1 mM NaHSO3 for different times were made in a way similar with that in Pn measurements. For measuring the responses of DF to irradiance intensity and CO2 concentration in an automatic program mode, the CO2 concentration and irradiance intensity were the same as that in Pn measurements, respectively.

2.3.2. LED Driver

To stabilize the light intensity of LED, a low-noise constant current source at the output level was adopted, which can stabilize the current with little ripple coefficient. LED as the load is in series with high-power Field Effect Transistor, which was used to drive LED. Auto current control feedback technique was used to stabilize positive drive current and realize continuing regulation in the range of 0–100 mA and the control precision is 0.1 mA. Compared with its primary version in Reference 19, the biosensor presented here has developed a new function of continuing light intensity control. So, the measurements of light response of DF intensity can be automatically completed by setting excitation parameters.

2.3.3. CO2 and Humidity Controller

Non-Dispersive Infra-Red detector and HS series capacitor sensor were used as the inductor for CO2 concentration and humidity, respectively. CO2 steel bottle and water box were connected separately with the sample chamber by two plastic and hermetic pipes, on which two valves were installed. The valves were controlled by AT89c55 to open when the actual value was less than the set value and close when the actual value was equivalent to the set value. The CO2 concentration can be adjusted in the range from 0 to 2000 ppm and the precision was ± 40 ppm and the humidity was controlled in the range from 5 to 95%. The improved biosensor, which is newly equipped with humidity controller, can better control environmental factors than its primary version in Reference 19. Moreover, the biosensor presented here has developed a new function of continuing CO2 control. Therefore, the measurements of CO2 response of DF intensity can be automatically completed by setting excitation parameters.

2.3.4. Temperature Controller

The difference between the chamber temperature and the set drove the executant (thermal energy converter (TEC)) to work to stabilize the chamber temperature at the set temperature. TEC can stabilize the temperature through refrigerating one side and heating the other side by changing current direction. Proportion integral control was used to reduce static state error and improve control precision. In the system the temperature control range is 15–40°C and precision can reach 0.01°C.

3. Results

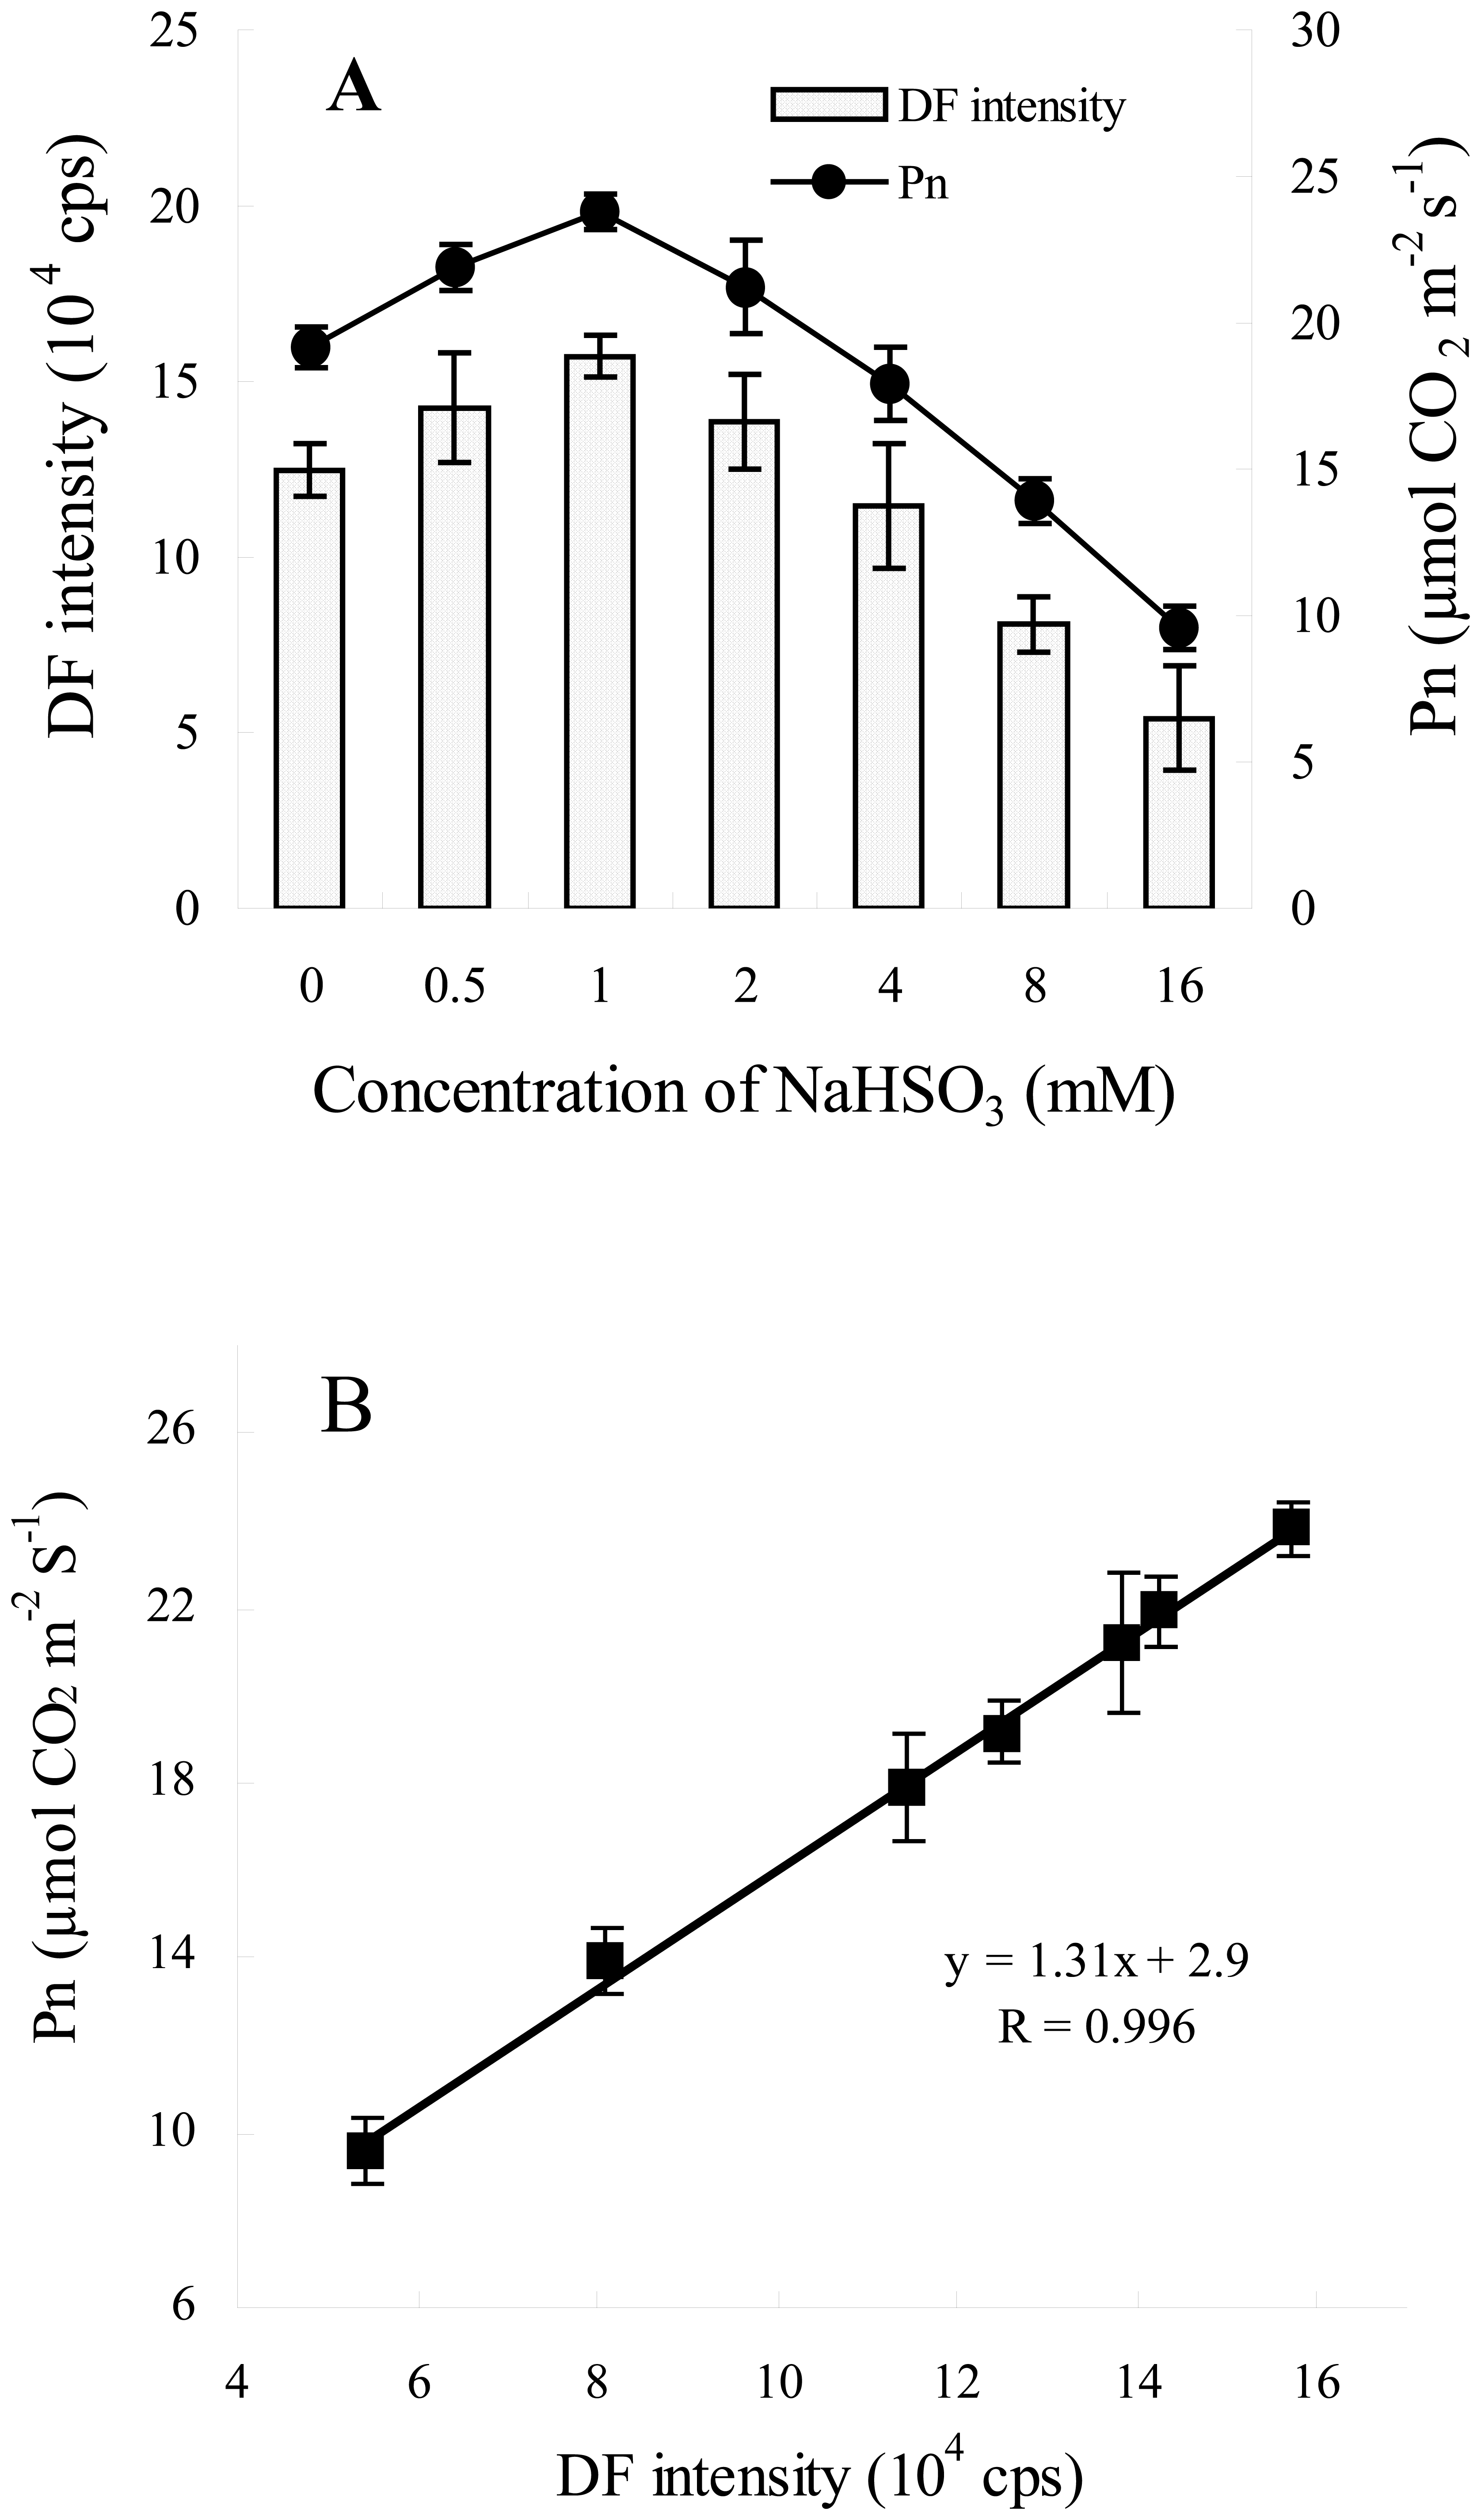
3.1. Correlation between DF Intensity and Pn after Different NaHSO3 Concentrations Treatment

To test the accuracy of the developed biosensor, we first investigated the relationship between Pn from LI-6400 and DF intensity from the biosensor after different NaHSO3 concentrations treatment. Figure 2A shows the changes in DF intensity and Pn of leaves of soybean seedlings exposed to various NaHSO3 concentrations (0, 0.5, 1, 2, 4, 8, 16 mM) for 72 h. As shown in Figure 2, the changes in DF intensity were highly consistent with that in Pn. DF and Pn increased as one man with the increasing of NaHSO3 concentrations upto 2 mM and decreased quickly at higher NaHSO3 concentrations. Moreover, DF and Pn at higher NaHSO3 concentration (> 4 mM) were less than that of control leaves (Figure 2A). This indicated that the photosynthetic efficiency of leaves of soybean was enhanced by the concentrations of NaHSO3 ranging between 0.5 and 2 mM. Only higher NaHSO3 concentrations (> 4 mM) could impair photosynthetic efficiency of leaf indicated by the changes in DF intensity and Pn (Figure 2A). The results are similar to that observed in wheat [3].
Further statistical analysis showed that, there was an excellent linear correlation between DF intensity and Pn of soybean seedlings under different concentrations NaHSO3 regulatory conditions (R = 0.996, Figure 2B).

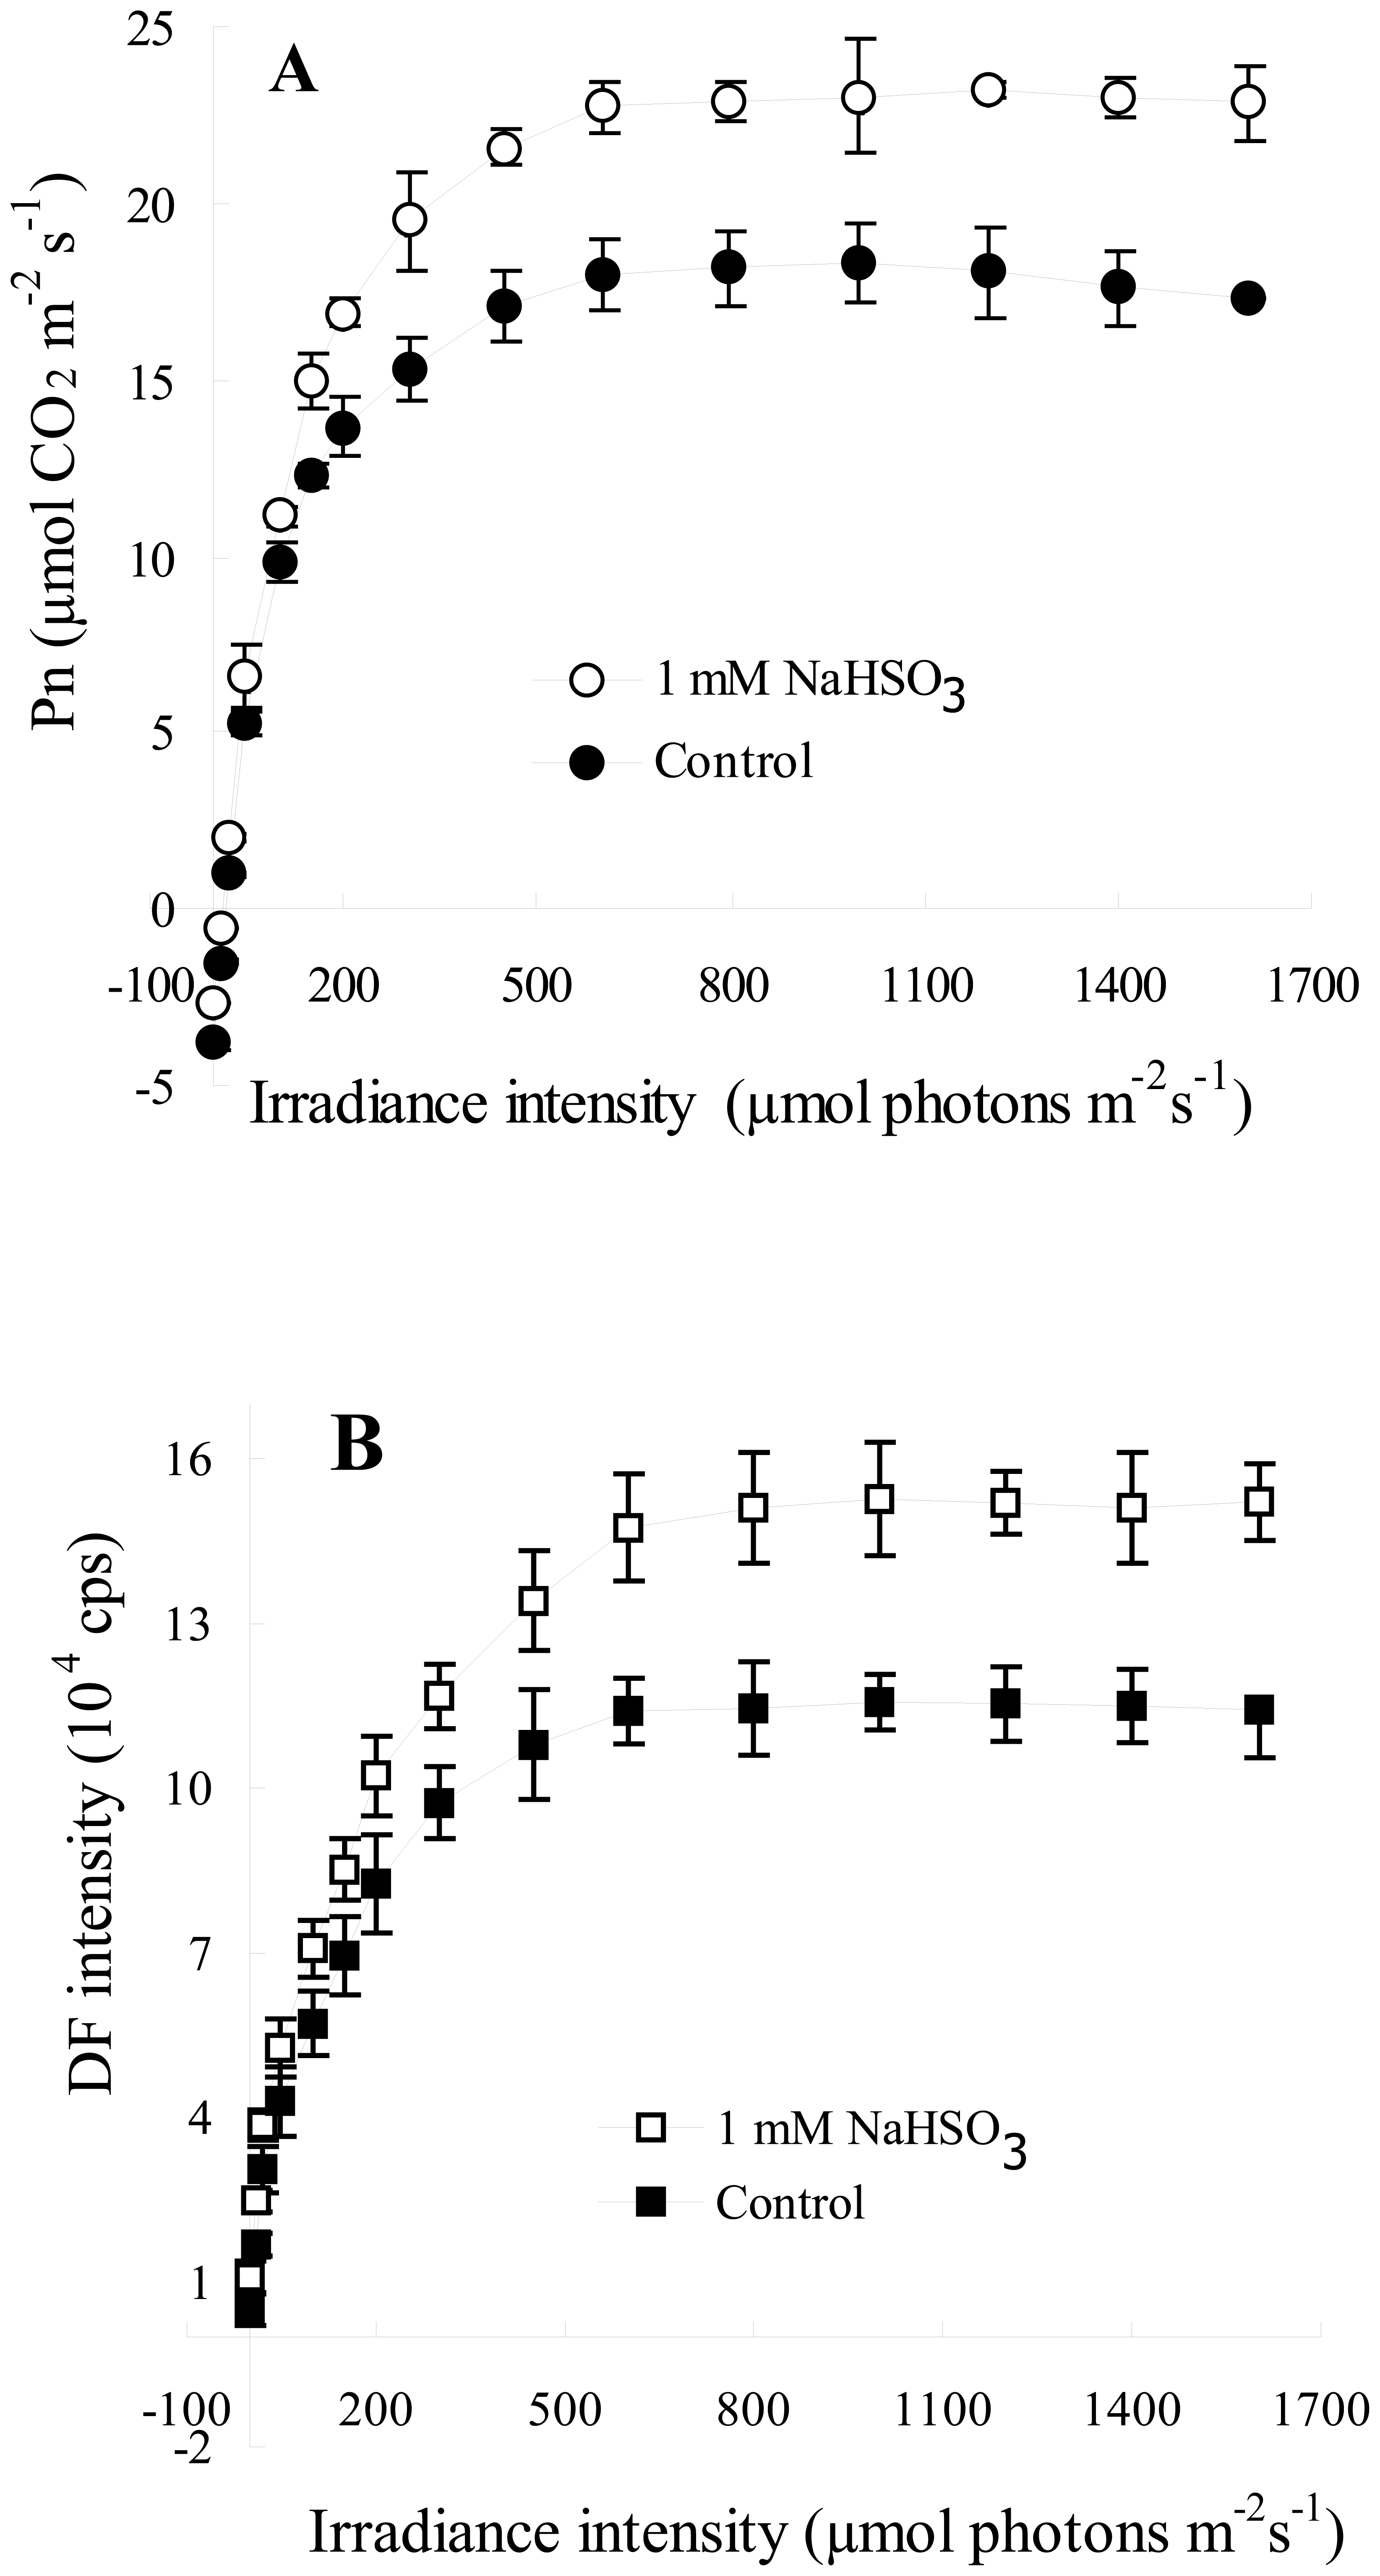
3.2. The Responses of DF Intensity and Pn to Irradiance Intensity after 1mM NaHSO3 Treatment

To verify the new function of the biosensor for measuring the response of DF intensity to irradiance intensity, we contrastively analyzed the responses of Pn from LI-6400 and DF intensity from the biosensor to irradiance intensity after 1mM NaHSO3 treatment. Figure 3 shows the characteristics of the responsiveness of DF intensity and Pn of leaves of soybean seedlings exposed to 1 mM NaHSO3 for 72 h to irradiation intensity. It was clear that, at any given irradiance intensity, DF intensity and Pn, respectively, were higher in leaves with NaHSO3 treatment than in control at the nearly same extent (Figure 3). As irradiation intensity increased, both Pn and DF intensity increased linearly first, then reached a plateau at the same irradiation intensity of 700 μmol photons m−2 s−1 and leveled off with a further rise in irradiation intensity in both leaves with or without 1 mM NaHSO3 treatment (Figure 3). The results revealed that the changes in the light response curves of DF intensity from the biosensor were quite similar with that in the light response curves of Pn from LI-6400 even under NaHSO3 regulatory conditions.

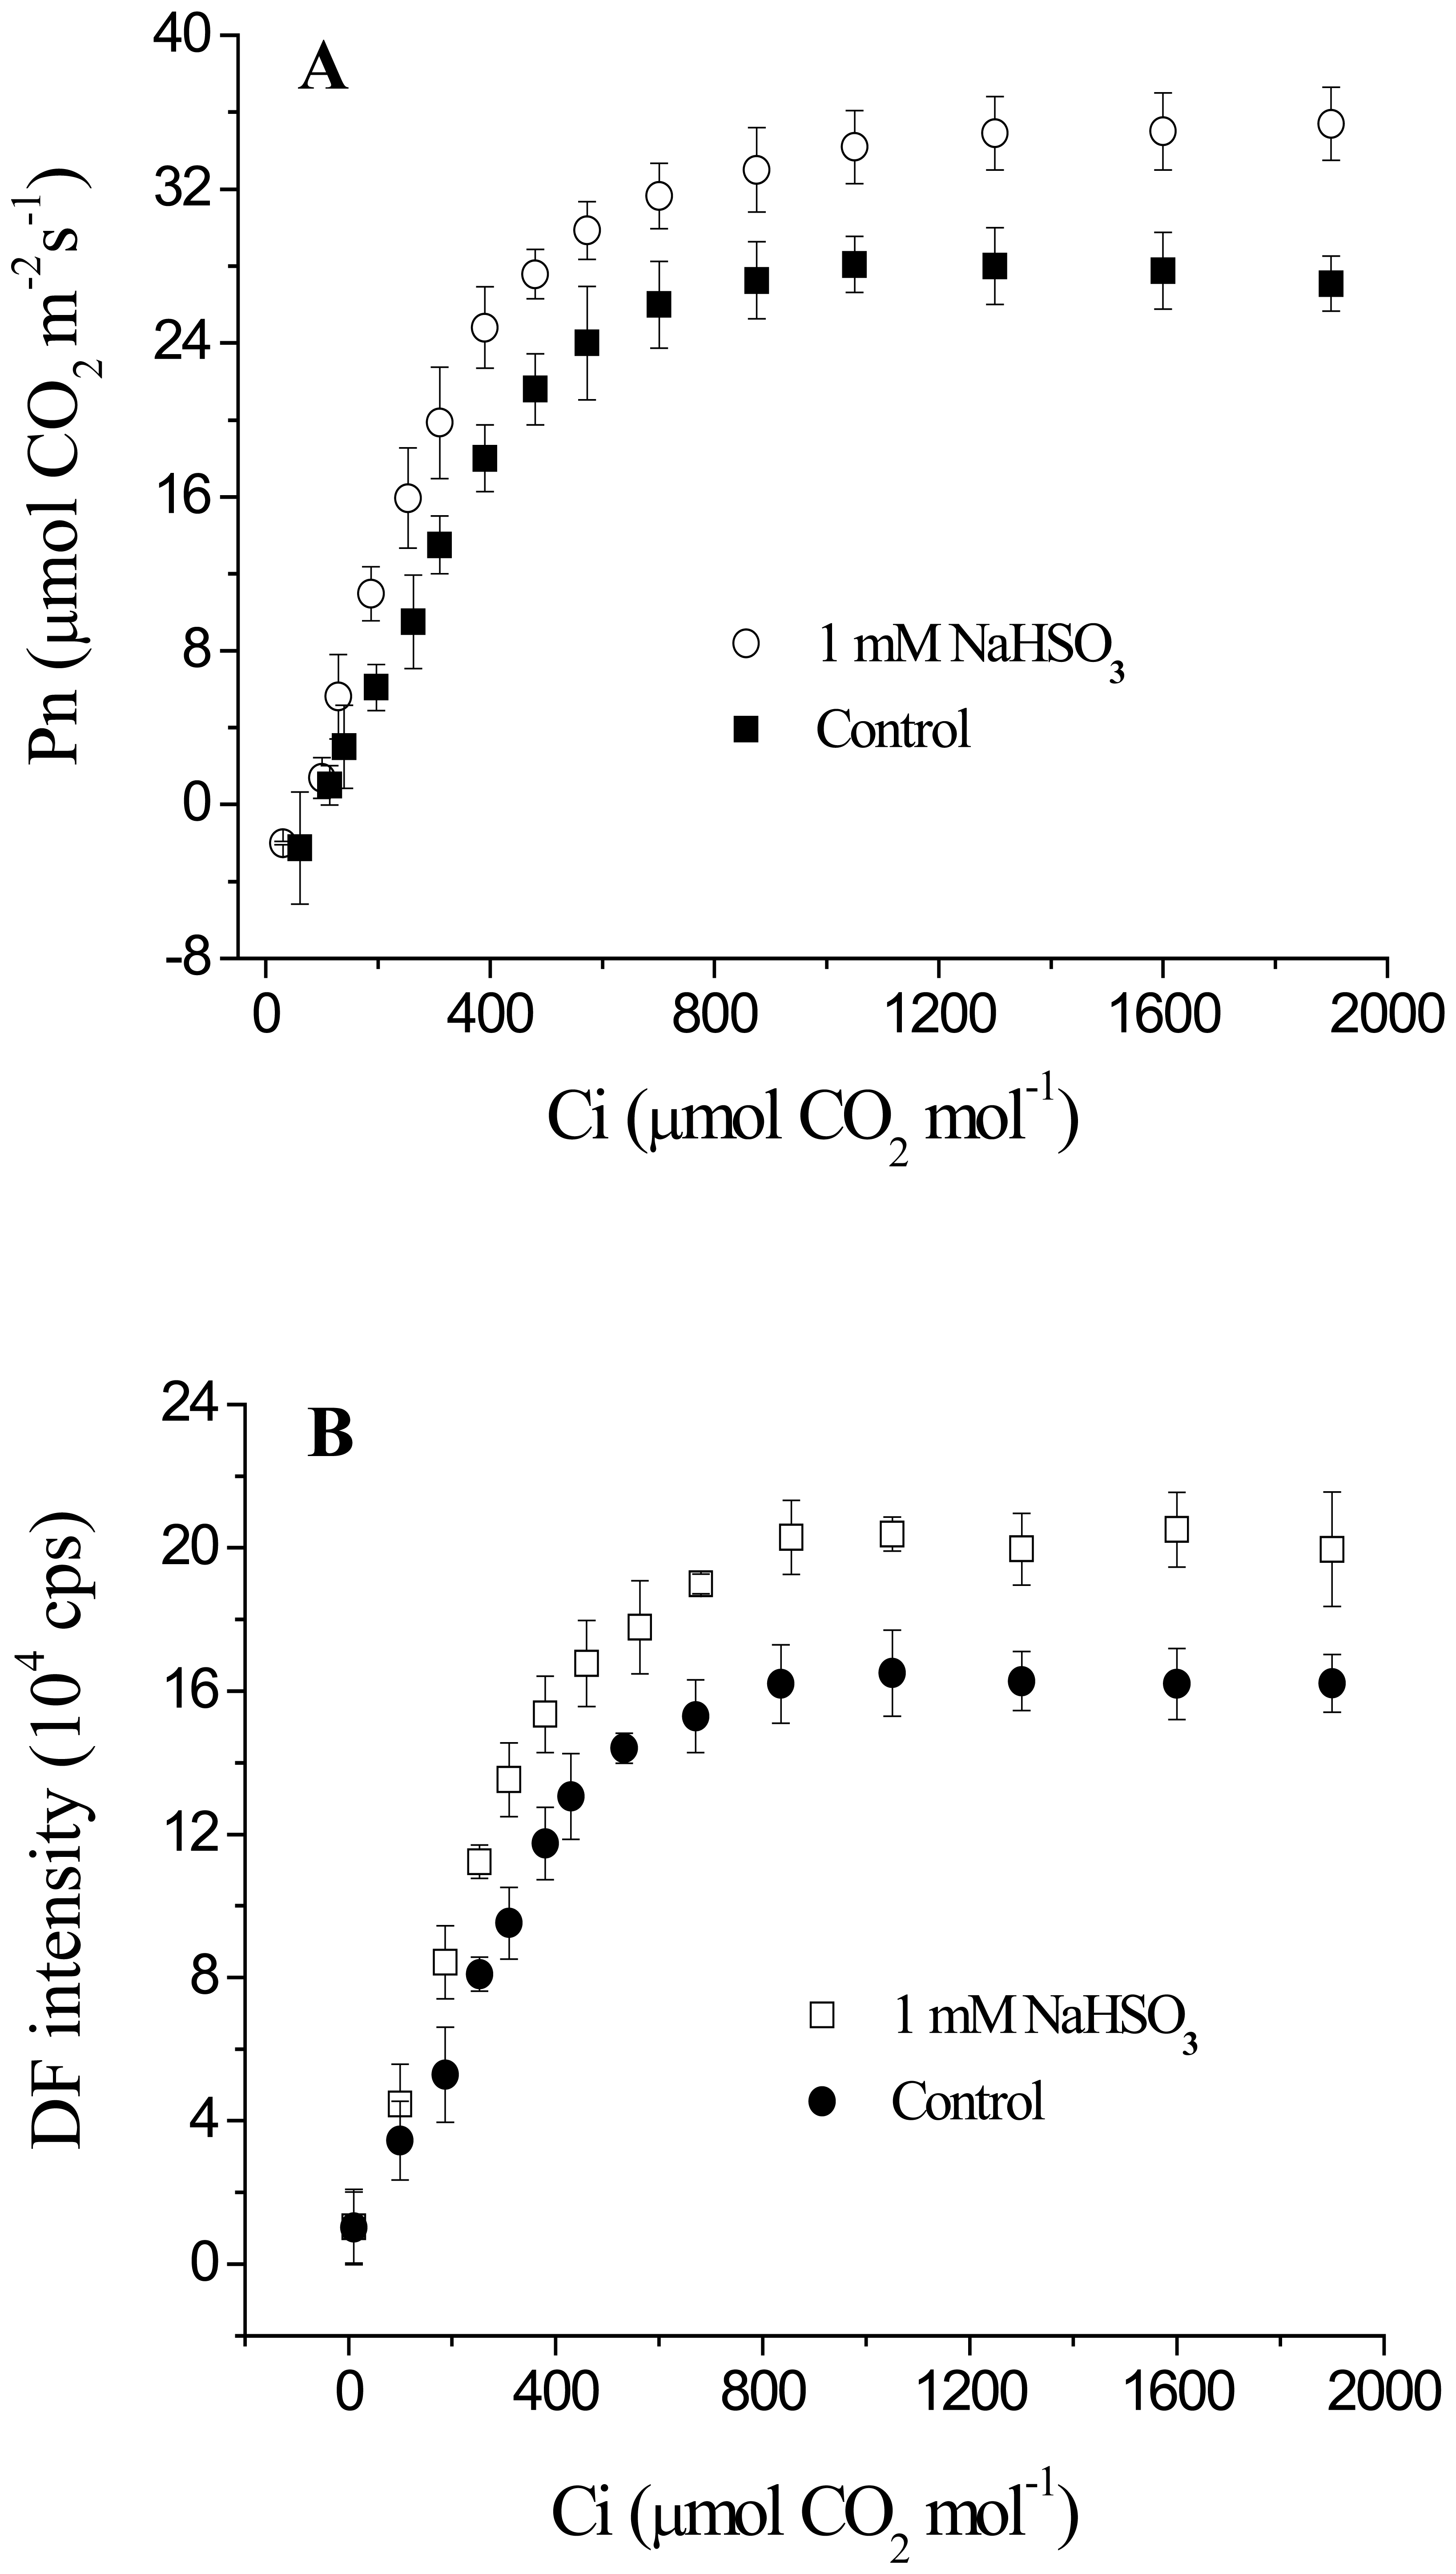
3.3. The Responses of DF Intensity and Pn to Intercellular CO2 Concentration (Ci) after 1mM NaHSO3 Treatment

To verify the new function of the biosensor for measuring the response of DF to CO2 concentration, the characteristics of CO2 responsiveness of DF intensity and Pn of leaves of soybean seedlings exposed to 1 mM NaHSO3 for 72 h were also further investigated. Typical examples were shown in Figure 4. As Ci increased, both Pn and DF intensity increased linearly first, then reached a plateau at the same Ci of 800 μmol CO2 mol-1 and leveled off with a further rise in Ci in both leaves with and without 1 mM NaHSO3 treatment (Figure 4). Moreover, at any given Ci, DF intensity and Pn, respectively, were higher in leaves with NaHSO3 treatment than in leaves without NaHSO3 treatment at the nearly same extent, although the difference was smaller at lower than higher Ci. This result revealed that the changes in the CO2 response curves of DF intensity from the biosensor were also quite similar with that in the CO2 response curves of Pn from LI-6400 even under NaHSO3 regulatory conditions.

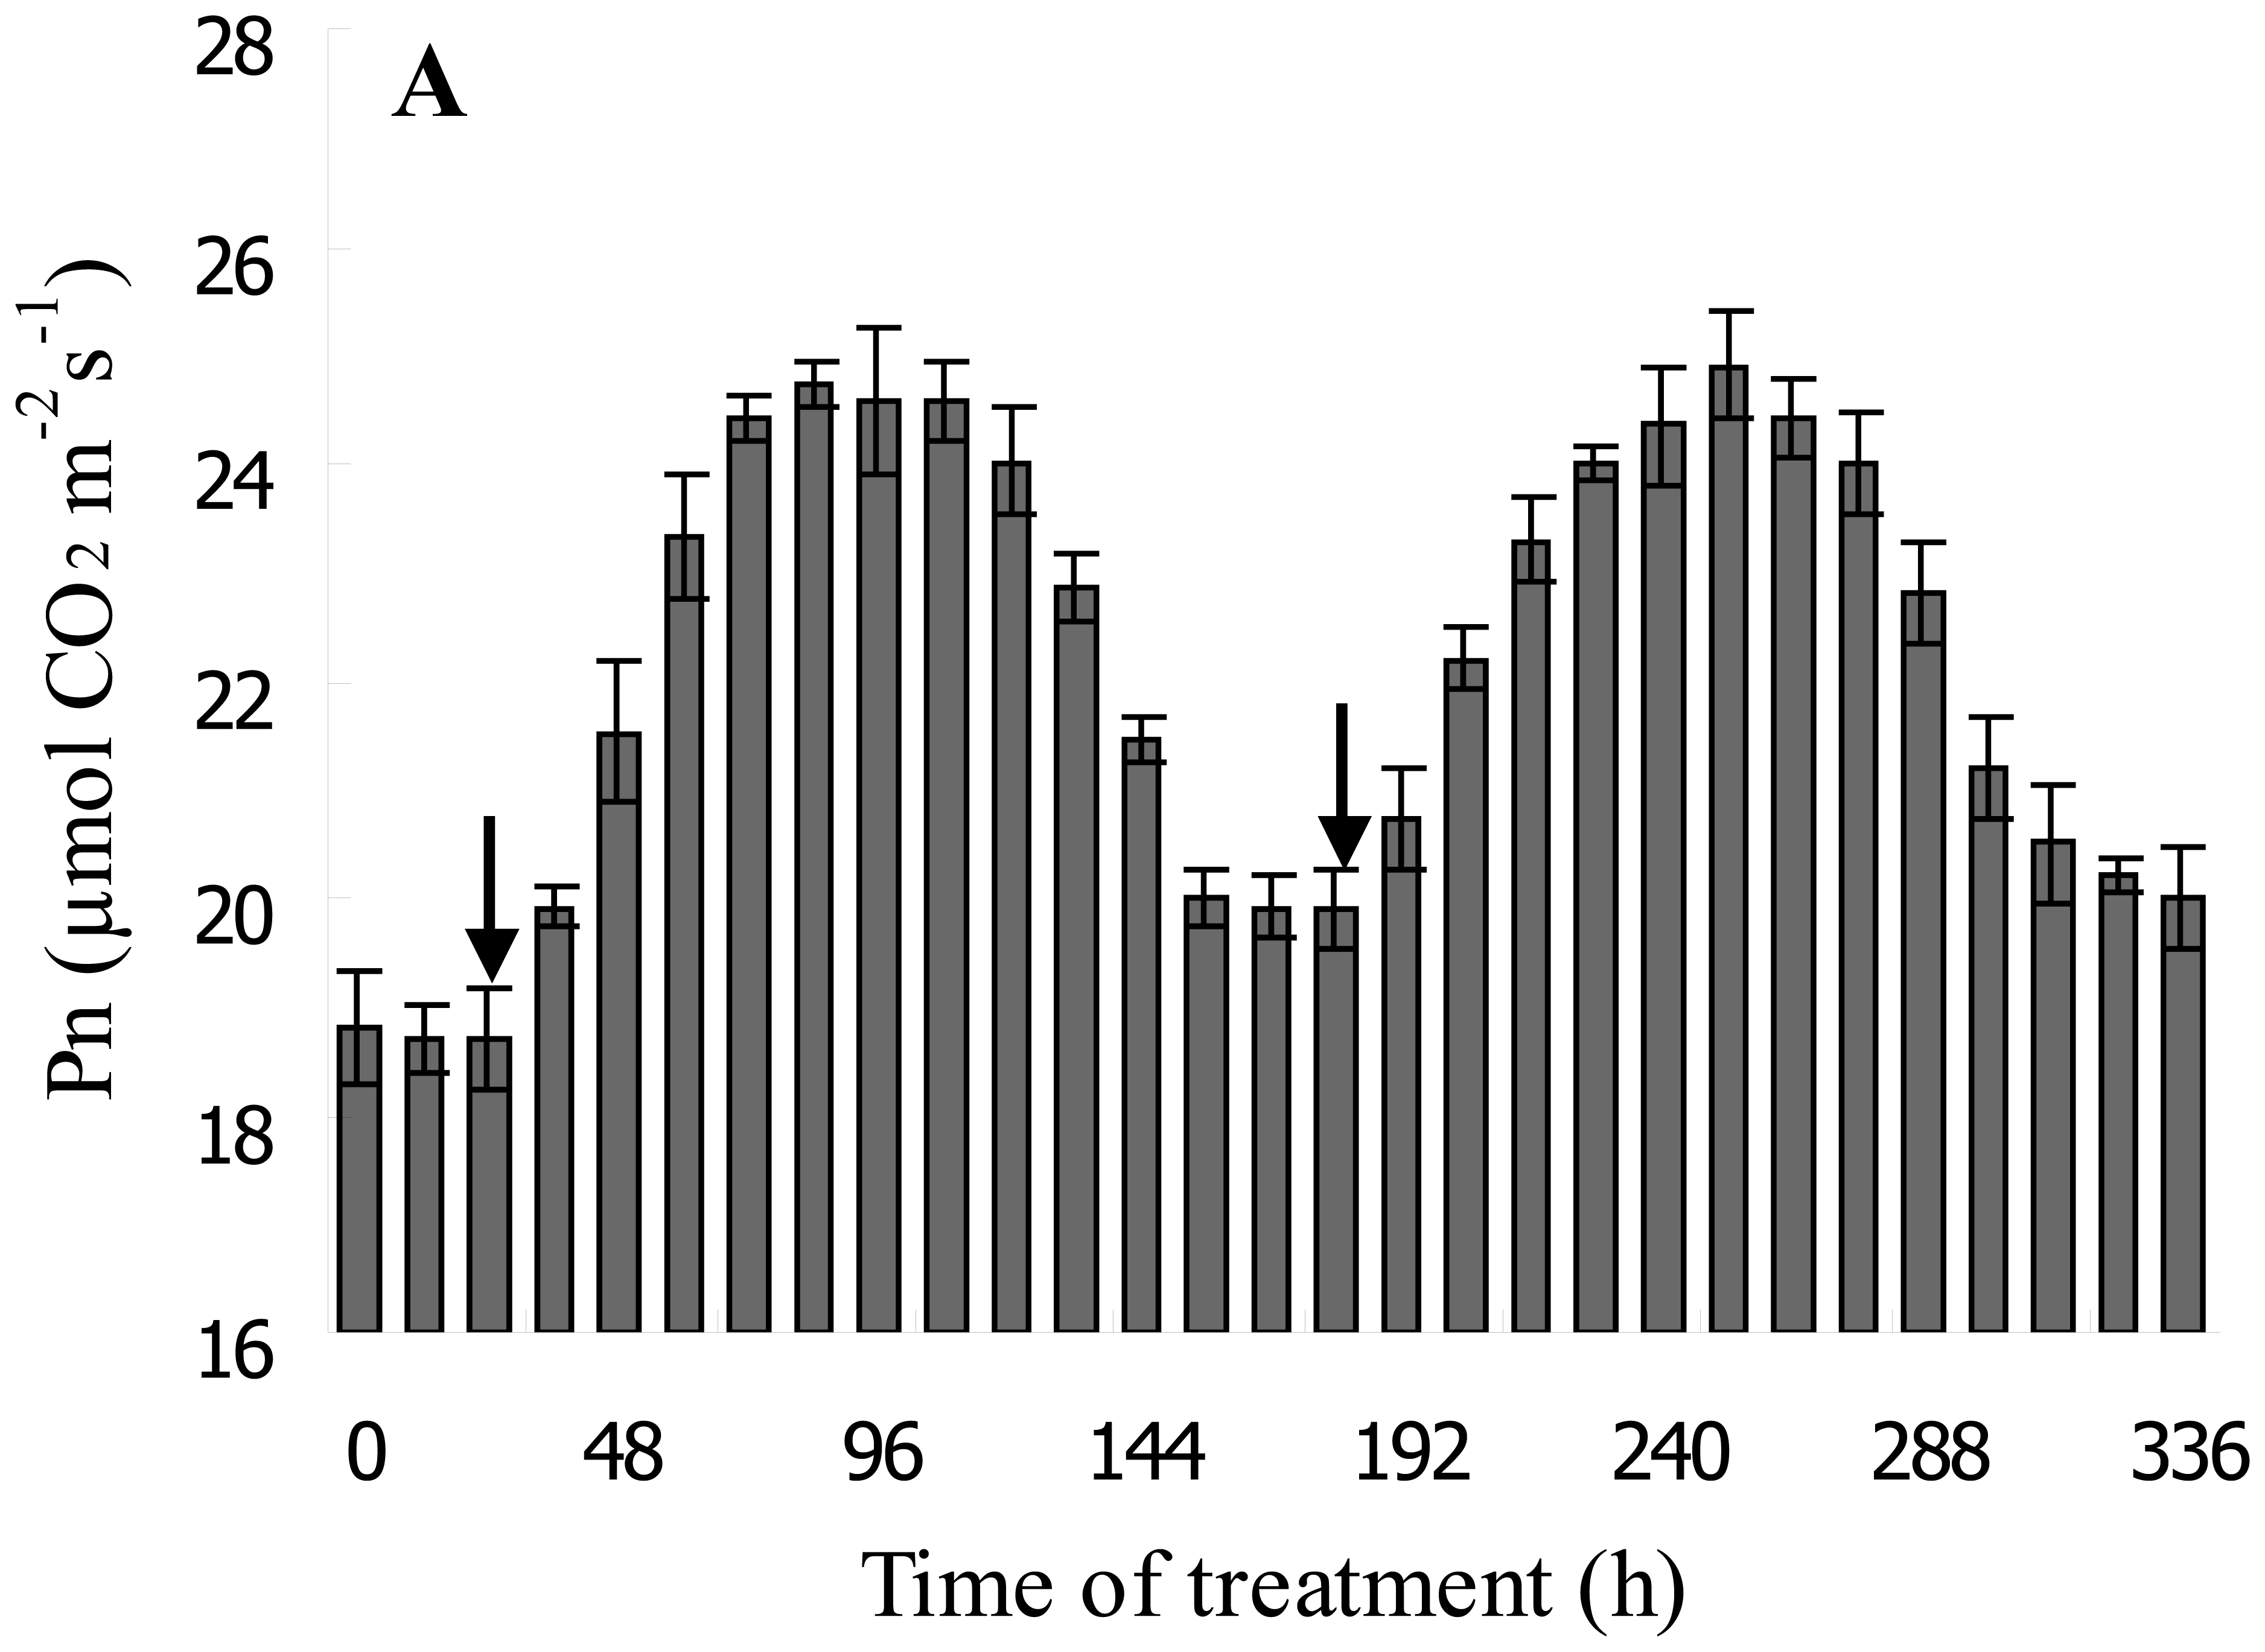
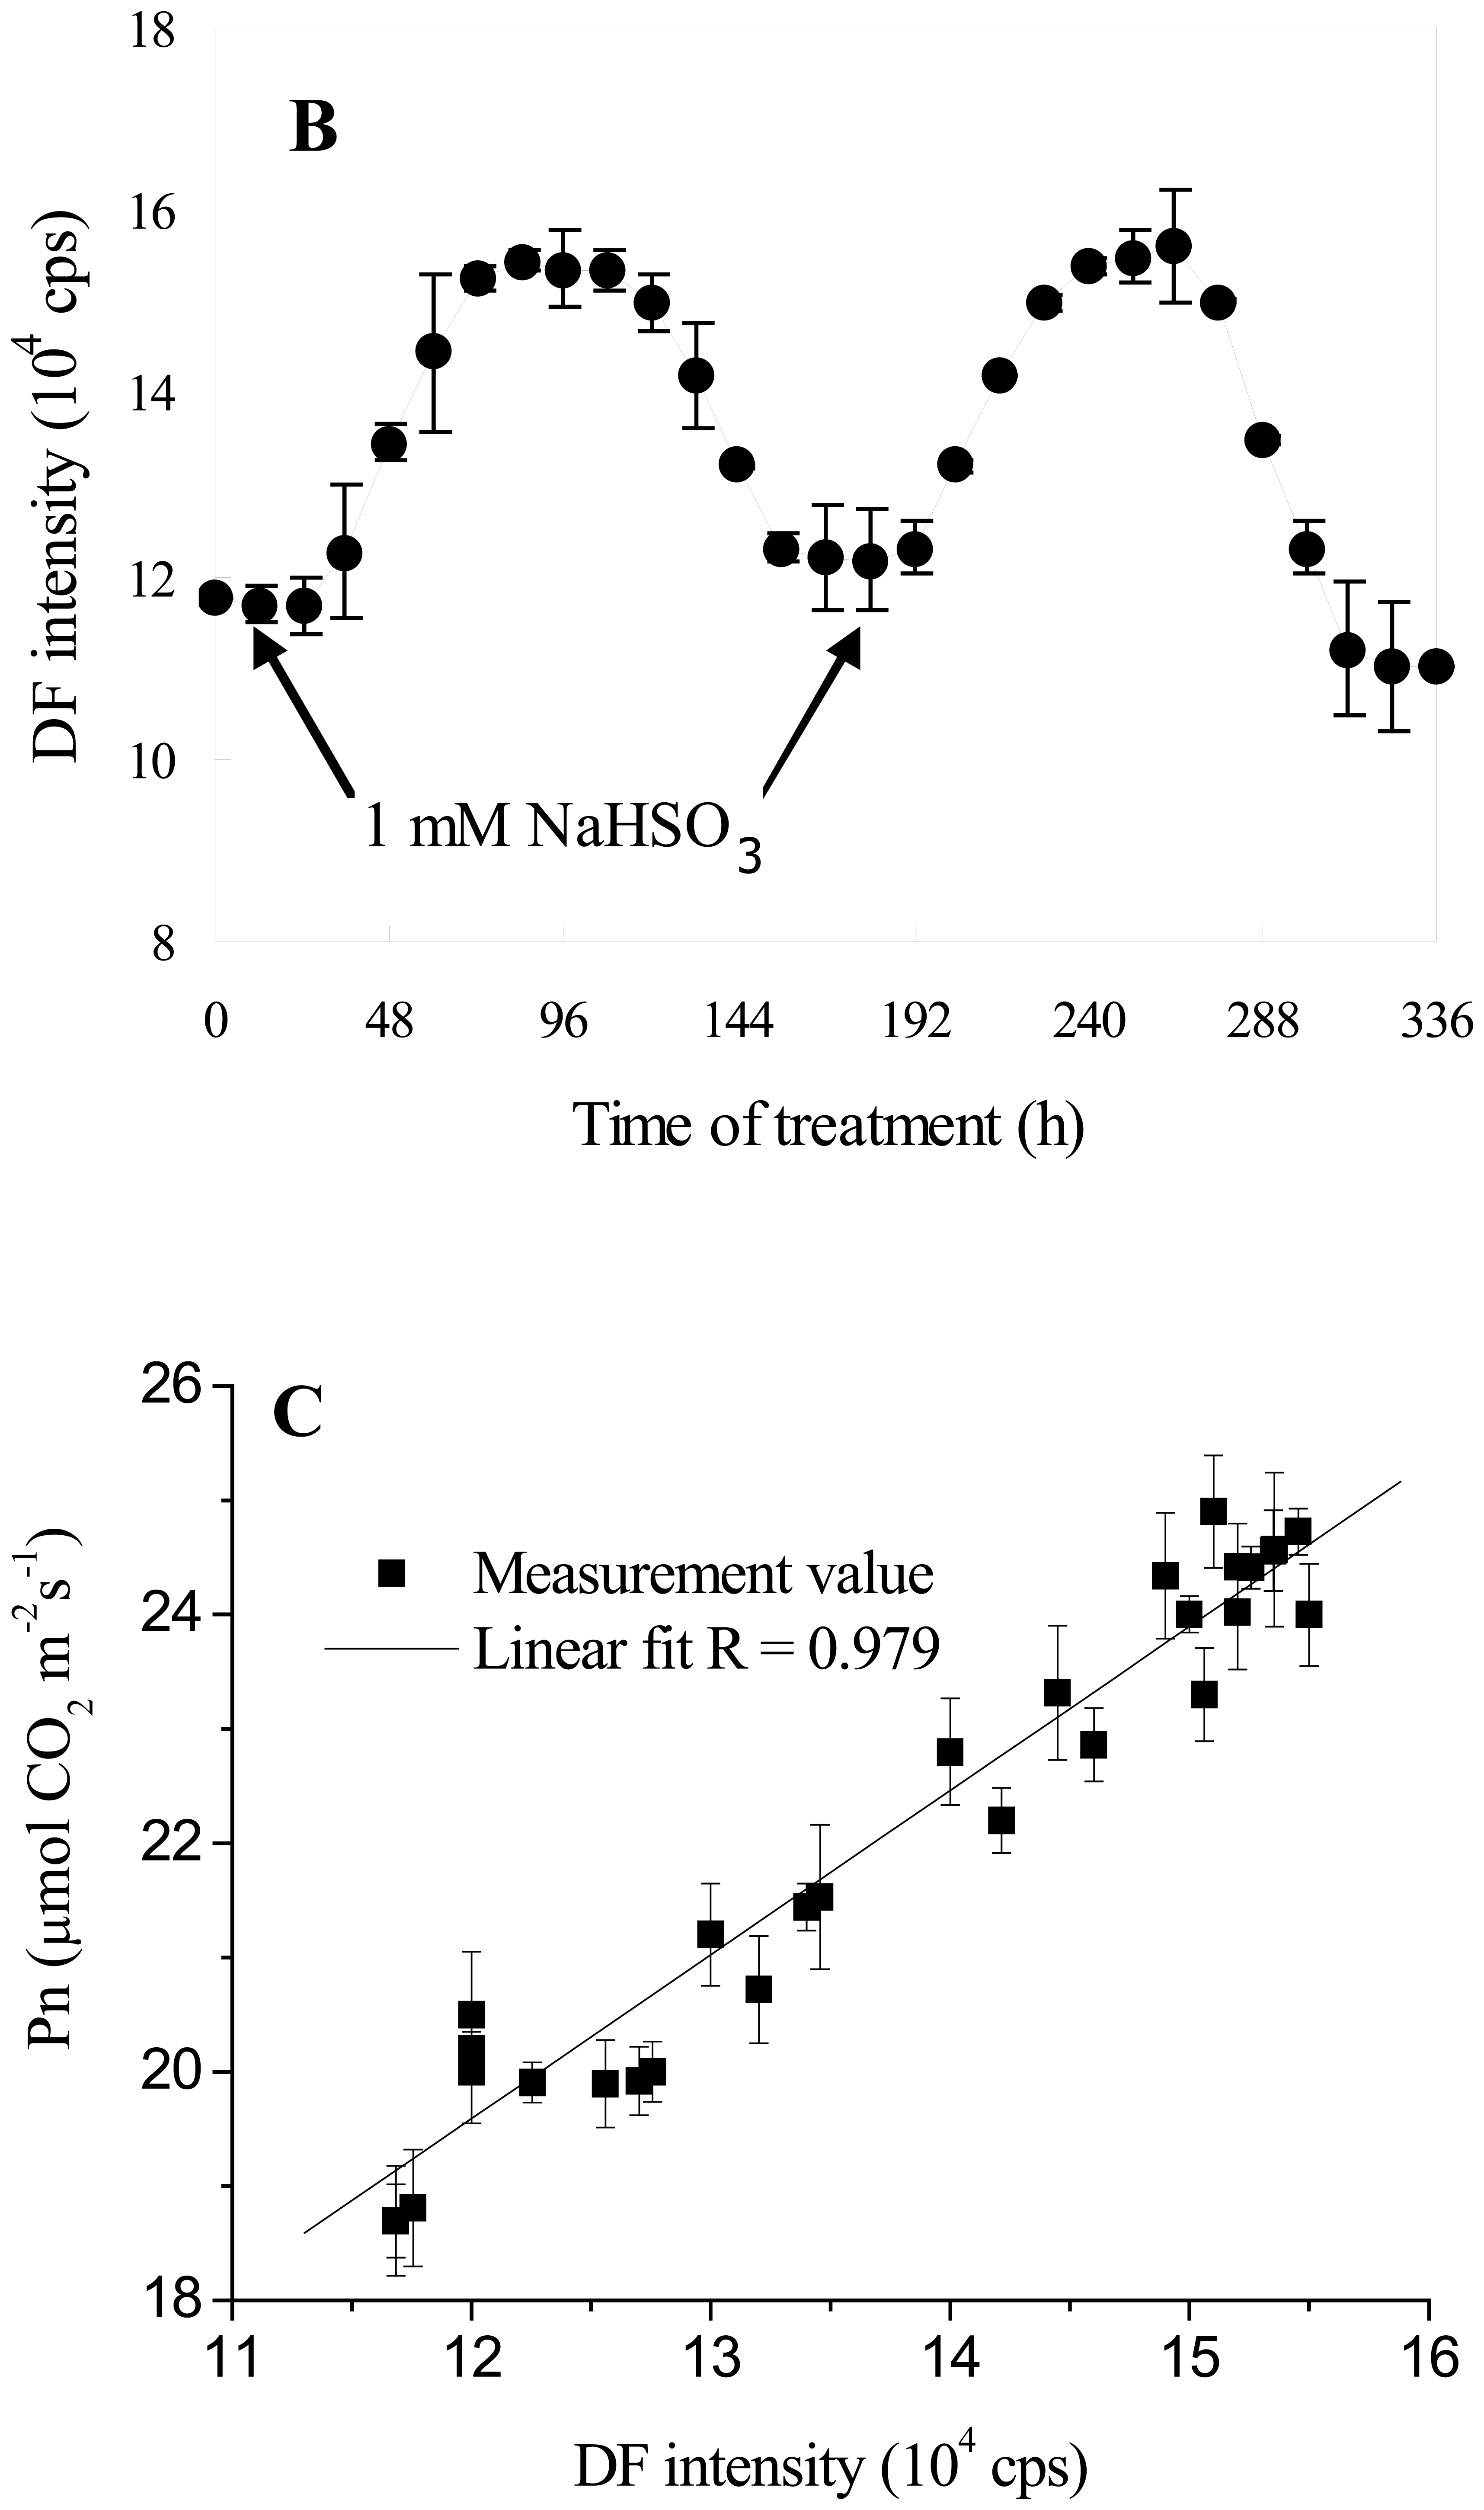
3.4. DF Monitoring the Dynamic Process of NaHSO3 on Soybean Seedling Photosynthesis

To test the function of the biosensor for real-time monitoring of the regulation of photosynthetic metabolism, the dynamic process of 1 mM NaHSO3 treatment on photosynthesis of leaves of soybean seedlings was examined by simultaneously measuring Pn and DF intensity (Figure 5). Figure 5A showed the changes in Pn with the extention of duration of 1 mM NaHSO3 treatment. It was clear that Pn gradually increased firstly, then reached maximum and lasting for 48 h. Subsequently, Pn gradually decrease to initial level. The trend could be observed again upon sparing 1 mM NaHSO3 on the leaves of seedlings that have been treated by NaHSO3 (Figure 5A). Moreover, the changes in Pn induced by NaHSO3 could be clearly reflected by the changes in DF intensity (Figure 5B). DF intensity in leaves of soybean seedlings measured 24 h after being sprayed with 1mM NaHSO3 began to slightly increase, followed by reaching maximum (131% of control) after another 36 h of treatment. The maximum of DF intensity could also last for 48 h (Figure 5B). Subsequently, DF intensity decreased to the initial level after another 36 h. When spraying 1mM NaHSO3 again, the changes in DF intensity showed a trend similar with that of the first NaHSO3 treatment. Therefore, DF intensity from the biosensor clearly indicated that the action of NaHSO3 on plant growth and photosynthetic metabolism showed a parabola trend, and the maximum effect of 1 mM NaHSO3 on soybean growth and photosynthesis could last for about 48 h.
Further statistical analysis showed that, there was an excellent linear correlation between DF intensity and Pn under 1mM NaHSO3 lasting action conditions (R = 0.979, Figure 5C). Thus, the biosensor could be used to in vivo and real-time monitor the regulatory effects of NaHSO3 on photosynthesis.

4. Discussion

Contrast measurements of gas exchange and DF signal showed that DF well correlated with Pn in soybean (Glycine max Zaoshu No. 18) seedlings after different concentration NaHSO3 treatments (Figure 2). This clearly demonstrated that the DF biosensor system could accurately indicate the changes in plant photosynthesis metabolism under NaHSO3 regulation conditions. In addition, because DF is the most intrinsic sensitive fluorescence label of the photochemical efficiency of PSII [8], the consistency of changes in DF and Pn suggested that the increase of Pn enhanced by low concentration NaHSO3 and the decrease of Pn inhibited by high concentration NaHSO3 could be attributed to the increase and decrease of photochemical efficiency of photosynthetic apparatus of mesophyll cells, respectively [3, 4]. Therefore, the biosensor could be potentially useful in predicting photosynthetic regulation site of the PGRs and other exogenous chemical factors.
DF and Pn responded to irradiance intensity and CO2 concentration in a quite consistent way even under 1 mM NaHSO3 regulation condition (Figures 3 and 4). This clearly demonstrated that the new functions of DF biosensor system for measuring the responses of DF to irradiance intensity and CO2 concentration could well work. So, the changes in plant photosynthetic metabolism induced by NaHSO3 under various excitation light intensity or various CO2 concentrations could be readily and really reflected by the biosensor. In addition, we also noticed that the changes in initial slope of the response curve of DF to irradiance intensity and Ci might be used to indicate the changes in the quantum efficiency and carboxylation efficiency of photosynthesis caused by NaHSO3 regulation, respectively (Figures 3A, B and 4A, B).
The regulatory effects of NaHSO3 on plant growth and photosynthesis may vary not only between different plant parts and developmental stages but also between different plant species [3, 4]. In the current investigation, we have demonstrated that there is an excellent linear correlation between DF intensity and Pn under 1mM NaHSO3 lasting action conditions (Figure 5C). The enhancement of photosynthesis in leaves of soybean seedlings of 30-day-old treated with 1 mM NaHSO3 could last for about 2 d, which is similar with that observed in wheat and rice [3, 4], and it could be observed again through changes in DF intensity when 1 mM NaHSO3 was sprayed subsequently (Figure 5). Increase or decrease in seedlings growth and photosynthetic metabolism related directly to NaHSO3 induced changes in the light-induced DF intensity. Therefore, the dynamic process of NaHSO3 on soybean seedling growth and photosynthesis could be truly monitored by changes in DF (Figure 5).
Taken together, all testing results have demonstrated that the improved biosensor works well, and can accurately determine the regulatory effects of NaHSO3 on photosynthetic metabolism. The developed biosensor, which has own illumination power and uses SPCM and MCU to detect and process DF signal from plants, makes portable and in vivo inspection possible. The sensitivity of DF to changes in photosynthetic metabolism coupled with the ease and speediness that measurements of DF can be made using the biosensor makes DF biosensor technique potentially useful for non-invasive and real-time monitoring the effects of PGRs and other exogenous chemical factors on plant growth and photosynthetic metabolism considerably before any visual effects on plant growth and development were observed. Thus, DF biosensor technique may be a novel method for providing the appropriate treatment time and dose of PGRs and other exogenous chemical factors for regulating plant growth and photosynthetic metabolism. Moreover, low cost, simple and convenient operation, and less interference of environment even working in field, which is realized through custom-built humidity, temperature, and CO2 controller, makes the DF biosensor of great perspectives in longtime inspection of plant growth and photosynthetic metabolism and wide application in precision agriculture. We anticipate our biosensor facilitating the non-invasive and real-time monitoring of regulation of plant growth and photosynthetic metabolism by reducing costs, consuming less time and labour, and requiring less training.

5. Conclusions

In this paper, we have thoroughly tested the effectiveness of the DF biosensor technique for evaluating in vivo photosynthetic performance and real-time monitoring the regulatory effects of NaHSO3 on plant photosynthetic metabolism. Important improvements in the biosensor can make it more accurate, rapid, non-invasive, and automated for detecting the regulation and behavior of photosynthetic metabolism. For the samples investigated, the results obtained by the DF biosensor were consistent with the results obtained by an instrument based on CO2 consumption. Increase or decrease in seedlings growth and photosynthetic metabolism related directly to NaHSO3 induced changes in the light-induced DF intensity. Therefore, it is likely that the DF biosensor presented here will likely to provide a potentially useful approach for non-invasive and real-time monitoring the effects of PGRs and other exogenous chemical factors on plant growth and photosynthetic metabolism.

Acknowledgments

Thanks to Dr. Baoge Zhu (Research Center for Molecular Agricultural Biology, Institute of Genetics and Development Biology Chinese Academy of Sciences) for providing the seeds of soybean, and to Drs. Changlian Peng, Debin Zhu, Lizhang Zeng, Liangzhong Xiang, Sihua Yang, Lingling Li, Li Jia, and Lili Zhang for their criticism and suggestions during the development of this paper. This work was supported by the National Natural Science Foundation of China (Grant No.: 60378043, 30470494), and the Natural Science Foundation of Guangdong Province (Grant No.: 015012; 04010394; 2004B10401011).

References

  1. Zhang, X.; Zhang, L.; Dong, F. C.; Gao, J. F.; Galbraith, D. W.; Song, C. P. Hydrogen Peroxide Is Involved in Abscisic Acid-Induced Stomatal Closure in Vicia faba. Plant Physiology 2001, 126, 1438–1448. [Google Scholar]
  2. Long, S. P.; Zhu, X. G.; Naidu, S. L.; Ort, D. R. Can Improvement in Photosynthesis Increase Crop Yields? Plant Cell and Environment 2006, 293, 315–330. [Google Scholar]
  3. Wang, H. W.; Wei, J. M.; Shen, Y. G. Enhancement in Wheat Leaf Photophosphorylation and Photosynthesis by Spraying Low Concentration of NaHSO3. Chinese Science Bulletin 2000, 45, 1308–1311. [Google Scholar]
  4. Wang, H. W.; Wei, J. M.; Shen, Y. G.; Zhang, R. X.; Yang, T. N. Enhancement of Photophosphorylation and Photosynthesis in Rice by Low Concentrations of NaHSO3 under Field Conditions. Acta Botanica Sinica 2000, 42, 1295–1299. [Google Scholar]
  5. Asada, K.; Deura, R.; Kasai, Z. Effects of Sulfate Ions on Photophosphorylation by Spinach Chloroplasts. Plant Cell Physiology 1968, 9, 143–146. [Google Scholar]
  6. Wang, C. L.; Xing, D.; Zeng, L. Z.; Ding, C. F.; Chen, Q. Effect of Artificial Acid Rain and SO2 on Characteristics of Delayed Light Emission. Luminescence 2005, 20, 51–56. [Google Scholar]
  7. Barbagallo, R. P.; Oxborough, K.; Pallett, K. E.; Baker, N. R. Rapid, Noninvasive Screening for Perturbations of Metabolism and Plant Growth Using Chlorophyll Fluorescence Imaging. Plant Physiology 2003, 132, 485–493. [Google Scholar]
  8. Wang, C. L.; Xing, D.; Chen, Q. A Novel Method for Photosynthesis Measuring Using Chloroplasts Delayed Fluorescence. Biosensors and Bioelectronics 2004, 20, 454–459. [Google Scholar]
  9. Christen, G.; Steffen, R.; Renger, G. Delayed Fluorescence Emitted from Light Harvesting Complex II and Photosystem II of Higher Plants in the 100 ns–5 micros Time Domain. FEBS Letters 2000, 475, 103–106. [Google Scholar]
  10. Wang, C. L.; Ma, G. X.; Fan, D. W.; Xia, R. B. Spectroscopy Research on the Origin Mechanism for Light Induced Delayed Fluorescence of Chloroplast. Spectroscopy and Spectral Analysis 2005, 25, 1262–1265. [Google Scholar]
  11. Wang, C. L.; Xing, D.; Zeng, L. Z. Spectroscopy Research on the Mechanism for 730 nm Component Delayed Fluorescence of Chloroplast. Spectroscopy and Spectral Analysis 2006, 26, 6–10. [Google Scholar]
  12. Chaerle, L.; Van der straeten, D. Seeing Is Believing: Imaging to Monitor Plant Health. Biochimica et Biophysica Acta-Gene Structure and Expression 2001, 1519, 153–166. [Google Scholar]
  13. Badretdinov, D. Z.; Kuznetsova, S. A.; Poltev, S. V.; Kukushkin, A. K. Backward Electron Transport in Photosystem 2 Reaction Center and Temperature Dependence of Delayed Luminescence Characteristics. Bioelectrochemistry 2002, 56, 13–16. [Google Scholar]
  14. Anderson, J. M.; Boardman, N. K. Fractionation of the Photochemical Systems of Photosynthesis. I. Chlorophyll Contents and Photochemical Activities of Particles Isolated from Spinach Chloroplasts. Biochimica et Biophysica Acta-Gene Structure and Expression 1996, 112, 403–421. [Google Scholar]
  15. Biswal, A. K.; Dilnawaz, F.; David, K. A.; Ramaswamy, N. K.; Misra, A. N. Increase in the Intensity of Thermoluminescence Q-Band During Leaf Ageing Is Due to a Block in the Electron Transfer from QA to QB. Luminescence 2001, 16, 309–313. [Google Scholar]
  16. Badretdinov, D. Z.; Baranova, E. A.; Kukushkin, A. K. Study of Temperature Influence on Electron Transport in Higher Plants via Delayed Luminescence Method: Experiment, Theory. Bioelectrochemistry 2004, 63, 67–71. [Google Scholar]
  17. Harbinson, J.; Genty, B.; Baker, N. R. Relationship between the Quantum Efficiencies of Photosystems I and II in Pea Leaves. Plant Physiology 1989, 90, 1029–1034. [Google Scholar]
  18. Fracheboud, Y.; Ribaut, J. M.; Vargas, M.; Messmer, R.; Stamp, P. Identification of Quantitative Trait Loci for Cold-Tolerance of Photosynthesis in Maize (Zea mays L.). The Journal of Experimental Botany 2002, 53, 1967–1977. [Google Scholar]
  19. Zhang, L. R.; Xing, D.; Wang, J. S.; Zeng, L. Z.; Li, Q. Light-Induced Delayed Fluorescence as an Indicator for the Effects of Salt Stress on Plant Physiology. Acta Photonica Sinica 2007, 10. in press. [Google Scholar]
  20. Law, R. D.; Crafts-Brandner, S. J. Inhibition and Acclimation of Photosynthesis to Heat Stress Is Closely Correlated with Activation of Ribulose-1,5-Bisphosphate Carboxylase/Oxygenase. Plant Physiol 1999, 120, 173–181. [Google Scholar]
  21. Goltsev, V.; Zaharieva, I.; Lambrev, P.; Yordanov, I.; Strasser, R. Simultaneous Analysis of Prompt and Delayed Chlorophyll a Fluorescence in Leaves During the Iinduction Period of Dark to Light Adaptation. Journal of Theoretical Biology 2003, 225, 171–183. [Google Scholar]
  22. Wang, H. W.; Mi, H.; Ye, J. Y.; Deng, Y.; Shen, Y. G. Low Concentrations of NaHSO3 Increase Cyclic Photophosphorylation and Photosynthesis in Cyanobacterium Synechocystis PCC6803. Photosynthesis Research 2003, 75, 151–159. [Google Scholar]
Figure 1. Diagram of experimental setup for DF measurement: LED, SPCM and MCU represent the light-emitting diode, single photon counting module, and micro control unit (AT89c55), respectively.
Sensors 07 00052f1
Figure 2. Effects of NaHSO3 on DF intensity and Pn of leaves of soybean (Glycine max Zaoshu No. 18) seedlings. (A) Changes in DF intensity and Pn of leaves of soybean seedlings exposed to various NaHSO3 concentrations for 72 h. (B) The correlation between DF intensity and Pn (R = 0.996, P < 0.0001). In the figure each value is the mean ± S.E. of nine independent leaves.
Sensors 07 00052f2
Figure 3. Light response curves of Pn (A) and DF intensity (B) of leaves of soybean (Glycine max Zaoshu No. 18) seedlings exposed to 1mM NaHSO3 concentration for 72 h. In the figure each value is the mean ± S.E. of nine independent leaves.
Sensors 07 00052f3
Figure 4. CO2 response curves of Pn (A) and DF intensity (B) of leaves of soybean (Glycine max Zaoshu No. 18) seedlings exposed to 1mM NaHSO3 concentration for 72 h. In the figure each value is the mean ± S.E. of nine independent leaves.
Sensors 07 00052f4
Figure 5. Temporal profile of DF intensity (A) and Pn (B) of leaves of soybean (Glycine max Zaoshu No. 18) seedlings with 1 mM NaHSO3 treatment and the relationship between DF intensity and Pn (C). Arrow indicates the time for spraying NaHSO3. In the figure each value is the mean ± S.E. of nine independent leaves.
Sensors 07 00052f5aSensors 07 00052f5b

