Abstract
In this paper, methods of sample preparation for potentiometric measurement of phenylalanine are presented. Basing on the spectrophotometric measurements of phenylalanine, the concentrations of reagents of the enzymatic reaction (10 mM L-Phe, 0,4 mM NAD+, 2U L-PheDH) were determined. Then, the absorption spectrum of the reaction product, NADH, was monitored (maximum peak at 340 nm). The results obtained by the spectrophotometric method were compared with the results obtained by the colourimetry, using pH indicators. The above-mentioned two methods will be used as references for potentiometric measurements of phenylalanine concentration.
Introduction
Phenylalanine, an exogenous amino acid (that cannot be synthesized by humans), is produced by microorganisms and plants. In animals, phenylalanine received with the diet is a precursor of tyrosine. In the liver, phenylalanine is reduced in the presence of phenylalanine hydroxylase to tyrosine. Tyrosine is a component of skin pigment – melanin and hormones such as adrenaline, noradrenalin and thyroxin.
Phenylketonuria (PKU) is a generic disorder. The symptoms of the disease are directly associated with deficiency in the liver enzyme that catalyses the conversion of phenylalanine into tyrosine. There are several qualitative [1] as well as quantitative methods of phenylalanine determination in blood and urine. The later methods, including mainly spectrophotometry [2,3], fluorometric [4-6], gas chromatography [7] and electrophoresis [8] are complicated and time consuming.
The aim of this study is to develop a novel, simple and cheap quantitative method for phenylalanine determination. For the purpose of potentiometric determination of phenylalanine, the following reaction catalysed by phenylalanine hydroxylase (PheDH) is used:
The proposed method of phenylalanine determination is an indirect technique, where the cofactor nicotinamide dinucleotide (NAD+) acting as an electron acceptor is reduced to NADH. The products of this reaction, such as hydrogen and ammonium ions, can be quantitatively assayed by potentiometric methods.
In the report, a quantitative method of phenylalanine determination based on the measurement of pH changes using colorimetric and potentiometric methods as well as problems related to sample preparation are presented.
Experimental
Chemicals
L-phenylalanine hydroxylase (or L-phenylalanine dehydrogenase – PheDH, EC 1.4.1.20) from Rhodococcus sp. and the cofactor nicotinamide dinucleotide (NAD+) were obtained from Fluka and Merck, respectively. The substrate for PheDH, L-phenylalanine (Phe) was purchased from Fluka.
Several pH colour indicators: bromocresol purple (Sigma), bromothymol blue (POCH, Poland) and meta-cresol purple (Aldrich) as well as buffer solutions based on 4-(2-hydroxyethyl)piperazine-1-propanesulfonic acid (EPPS) (Aldrich), glycine (Fluka) and phosphates NaH2PO4, Na2HPO4 (POCH) and KH2PO4 (Merck) were used.
Other chemicals of analytical grade were purchased in POCH, Poland.
Measurements
To investigate kinetics of reaction (1), a spectrophotometric method was used. The measurements were taken by means of a μQuant plate-spectrophotometer (Bio-Tek Instr.) within the wavelength range of 200 - 500 nm, where absorbance at the wavelength of 340 nm is specific for the reduced form of NAD+, i.e. NADH.
In evaluation of an appropriate pH in this reaction (1), several pH indicators, active at different pH, were used. In the cases with application of the pH indicators, the absorbance level was measured within a wide range of wavelength 200 - 700 nm. The wavelengths specific for each pH indicator are the following: 578 nm, 617 nm and 437 nm for meta-cresol purple (pH 7.4 - 9.0), bromothymol blue (pH 5.8 - 7.6) and bromocresol purple (pH 5.2 - 6.8), respectively.
The final measurements were taken in the phosphate buffer of 5 and 25 mM of pH 10.56 by means of a miniaturised combined glass pH-electrode (PCH3359-8, Radiometer).
The measurements were taken at room temperature.
Results and discussion
For the sake of establishment of the sample composition, effects of different factors such as the amount of the enzyme and cofactor (NAD+), relation between the composition and concentration of the buffer solution and the kinetics of the enzymatic reaction were investigated. The absorbance level (OD) for the samples at the wavelength specific for the product of the enzymatic reaction NADH (340 nm) was recorded in 2.5 min intervals. As an example, the kinetic curves for different concentrations of the cofactor (0.05 – 6.4 mM) at a constant activity of phenylalanie dehydrogenase (2 U/200 μl) in glycine buffer solution with a concentration of 176 mM and pH 10.56 are shown in Fig.1.
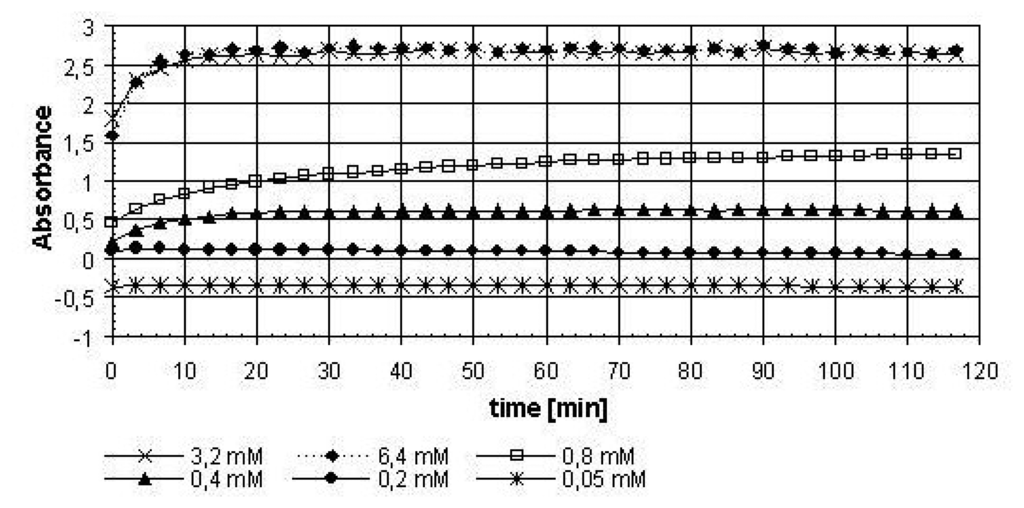
Figure 1.
Kinetics of the enzymatic reaction for samples of different concentrations of the cofactor (0.2 - 6.4 mM) and a constant concentration of substrate (0.01 M) and enzyme activity (2 U/200 μl). Background buffer solution: glycine (176 mM of pH 10.56).
It can be seen that, for a very low concentration of the cofactor, of the order of 0.2 mM and below, the absorbance level is zero. The concentration of the cofactor also affects the time required to reach the steady-state in the enzymatic reaction.
Similar measurements were performed for samples of different activity levels of the enzyme and at a constant concentration of the cofactor (NAD+) in 2.5 mM EPPS buffer solution of pH 7.93 (Fig. 2).
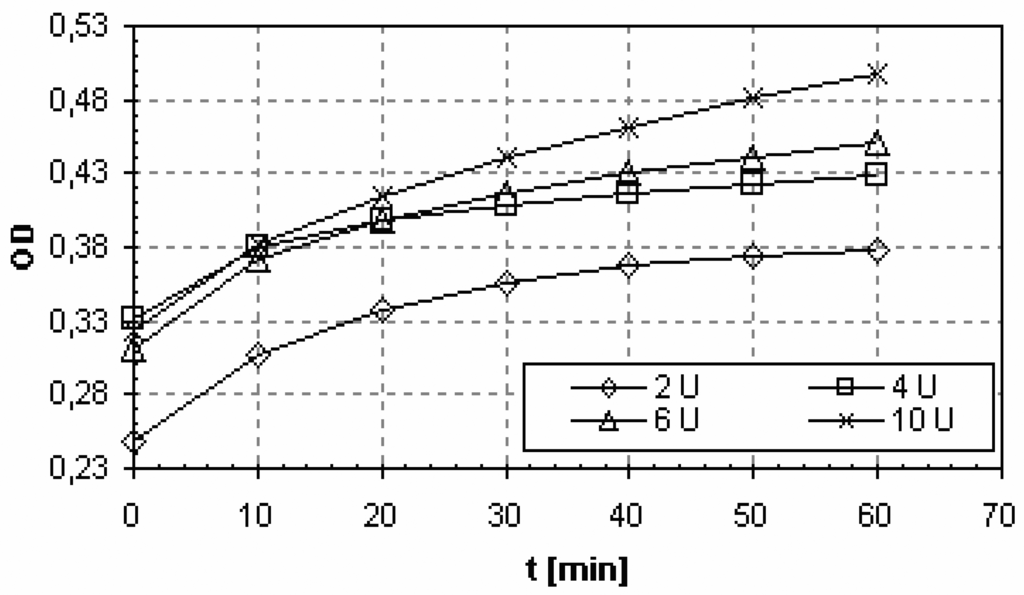
Figure 2.
Kinetics of the enzymatic reaction for samples of different enzyme activity levels (2-10 U) and constant concentration of the substrate (0.01 M) and the cofactor (0.4 mM). Background buffer solution: EPPS (2.5 mM of pH 7.93).
As it can be seen, the kinetic curves for the enzymatic reaction for different activity levels of the PheDH (above 6 U/200 μl) fail to reach the steady-state even after a long time up to 60 min of monitoring, while for lower activity levels of the enzyme (below 4 U/200 μl), the steady state point is approached very slowly.
In the both cases, changes of the concentration of the cofactor and the enzyme activity levels result in a differentiation of the time required to reach the steady-state for the enzymatic reaction (1). In other words, the concentration of the cofactor and activity of the enzyme are factors determining the rate of the enzymatic reaction.
The influence of the enzyme amount (0.4 - 4 U/200 μl) and the buffer composition and concentration: phosphate buffer KH2PO4 of the concentration 5, 25 and 50 mM, pH 10.56, and glycine buffer of 176 mM, pH 10.56 on the absorbance, is presented in Fig. 3.
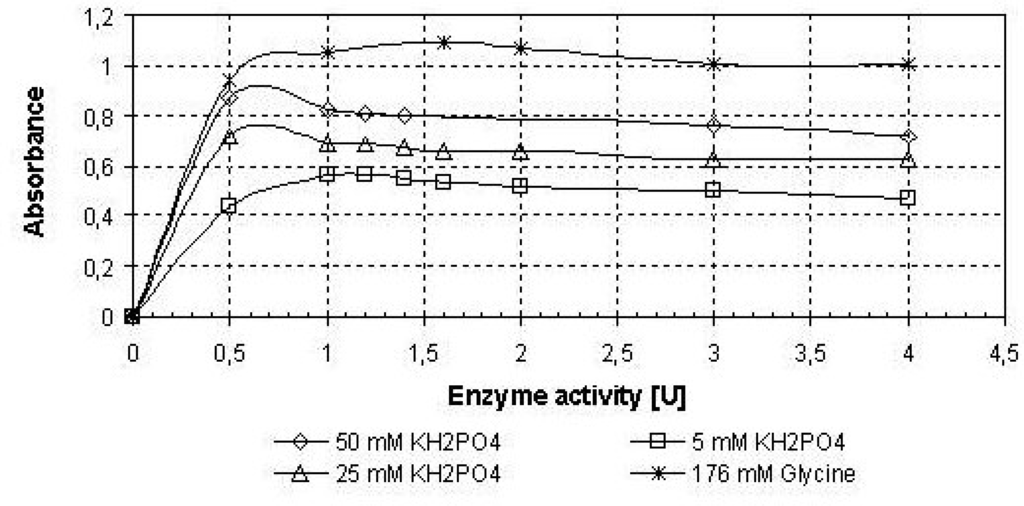
Figure 3.
Dependence of the absorbance level on the enzyme activity (0.4 – 4 U/200 μl) and composition of the buffer solution: phosphate buffer KH2PO4 of concentration 5, 25 and 50 mM of pH 10.56, and glycine buffer of 176 mM of pH 10.56 for constant concentration of the cofactor 0.4 mM.
As it can be seen, the highest absorbance level was obtained for the glycine buffer solution and the enzyme content of 1.6 U/200 μl.
The time changes of the spectra for the enzymatic reaction measured within the wavelength range of 200 - 500 nm are shown as a fragment within the range of 300 - 420 nm in Fig. 4. After 60 min of monitoring of changes of the NADH concentration (peak height at the wavelength 340 nm), when the reaction approached the steady-state, the sample was heated up to 37 °C and incubated at this temperature for 20 min. Afterwards, the sample was measured again (the spectrum described as for 90 min duration of the reaction in Fig. 4).
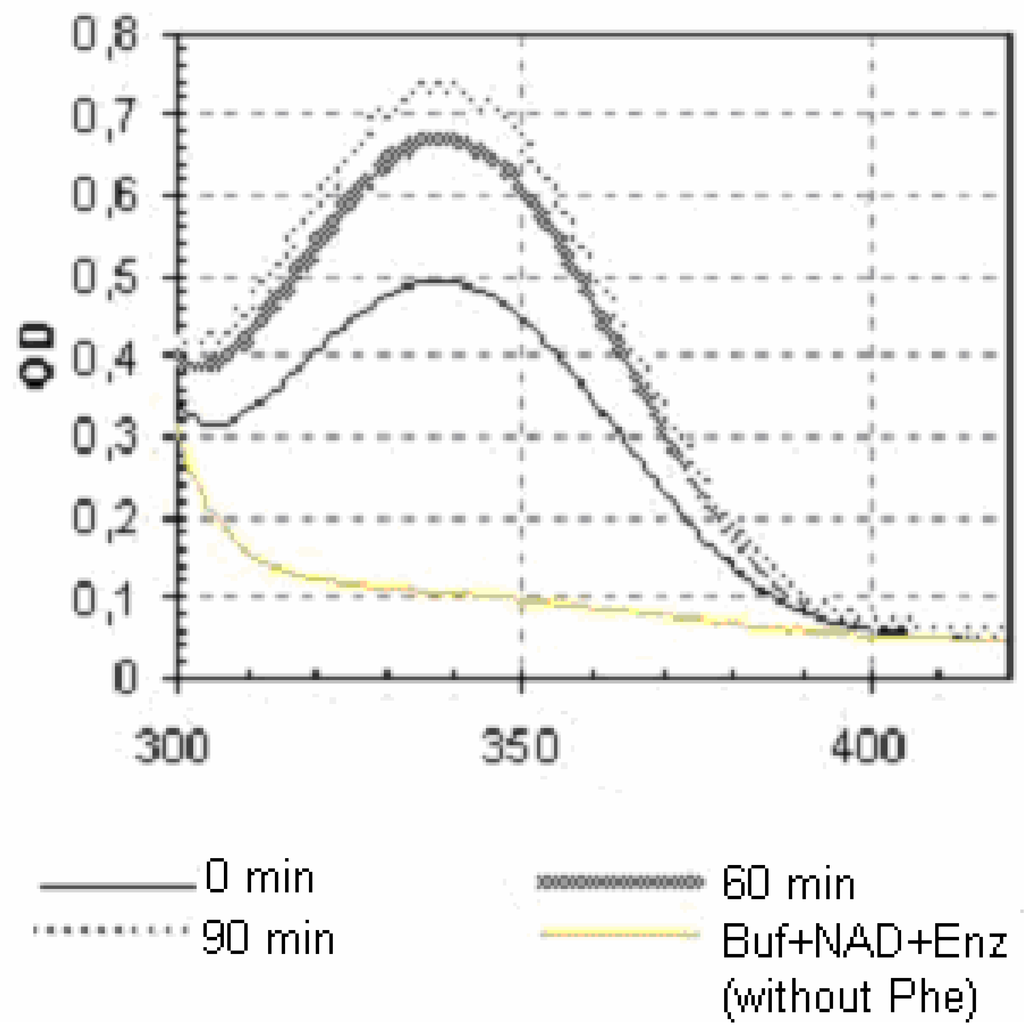
Figure 4.
A fragment of spectra of the reaction (1), taken within the range of wavelength 300 - 420 nm. Sample composition: 10 mM Phe, 0.4 mM NAD+, 2 U/200 μl PheDH, 5 mM NaH2PO4 buffer solution of pH 10.64.
For the sample, after the incubation at the elevated temperature, an increase of the absorbance level at a wavelength 340 nm was observed. Then, the temperature of the incubation may have also accelerated the enzymatic reaction as well as have increased its effectiveness.
In the next stage of this study, to bring the method closer to potentiometric methods of phenylalanine determination, the kinetics of the reaction was investigated by means of the colourometric reaction performed in the presence of the pH indicators such as meta-cresol purple, bromothymol blue and bromocresol purple. The results are shown in Table 1, where ΔOD is the increment of the absorbance level at 90 min of the enzymatic reaction versus the initial absorbance level at time 0 min (i.e., &DeltaOD = OD90 min - OD0 min).

Table 1.
Changes of absorbance in time for samples with different pH indicators measured at a specific wavelength.
The highest ΔOD was obtained for the meta-cresol purple (-0.022), with its operating range from pH 7.4 to 9.0. This indicates that the highest effectiveness of the enzymatic reaction can be obtained for samples of higher pH values.
Based on the spectrometric results, the composition of the sample for determination of phenylalanine by the potententiometric method was selected. The measurements were taken in phosphate buffer of 5 and 25 mM of pH 10.64 by means of a miniaturised pH electrode. The maximal signal (ΔpHmax) of the order of 0.6 pH unit was obtained for the sample prepared with the use of 5 mM phosphate buffer (NaH2PO4) of pH 10.64. This value corresponds to the OD increment c.a. 0.32, where the OD increment was post evaluated based on the spectrophotomteric NADH detection for the measured sample.
The above-mentioned two methods, the spectrophotometric method and the colorimetric, are used as references for potentiometric measurements.
The further research will be oriented towards the optimisation of the sample composition for the purpose of the pH determination of phenylalanine.
Conclusions
The changes of concentration of the cofactor and of the enzyme activity level result in a differentiation of the time required to reach the steady-state for the enzymatic reaction of phenylalanine oxidation. In other words, the concentration of the cofactor and activity level of the enzyme are factors determining the reaction velocity.
The highest ΔOD was obtained for the meta-cresol purple (-0.022) which indicates that the highest effectiveness of the enzymatic reaction can be obtained for samples of higher pH values.
The maximal signal in the form of a pH change (ΔpHmax) of the order 0.6 pH unit was obtained for the sample based on 5 mM phosphate buffer (NaH2PO4), pH 10.64.
The results obtained by the spectrophotometric method were compared with the results obtained by the colourimetric technique, using pH indicators. The two methods will be used as references for potentiometric measurements.
Acknowledgments
The authors thank the Ministry of Science and Information Society Technologies (MNiI) for their financial support in this research (Project No. 4T11E 022 24).
References
- Guthrie, R.; Susi, A. A simple phenylalanine method for detecting phenylketonuria in large populations of newborn infants. Pediatrics 1963, 33, 338. [Google Scholar]
- La Du, B.N.; Michael, P.J. An enzymatic spectrophotometric method for the determination of phenylalanine in blood. J. Lab. Clin. Med. 1960, 55, 491. [Google Scholar]
- Hummel, W.; Schutte, H.; Kula, M.-K. Enzymatic determination of L-phenylalanine and phenylpyruvate with L-phenylalanine dehydrogenase. Anal. Biochem. 1988, 170, 397. [Google Scholar]
- McCaman, M.W.; Robins, E. Fluorometric method for determination of phenylalanine in serum. J. Lab. and Clin. Med. 1962, 59, 885. [Google Scholar]
- Kiba, N.; Itagaki, A.; Fumsawa, M. Determination of L-phenylalanine in serum by flow injection analysis using immobilized phenylalanine dehydrogenase and fluorimetric detection. Talanta 1997, 44, 131. [Google Scholar]
- Wong, P.W.K.; O'Flyn, M.E.; Inouye, T. Micromethods for measuring phenylalanine and tyrosine in serum. Clin. Chem. 1964, 10/12, 1098. [Google Scholar]
- Piez, K.A.; Morris, L. A modified procedure for the automatic analysis of amino acids. Anal. Biochem. 1960, 1, 187. [Google Scholar]
- Curtius, E.Ch.; Roth, M. Clinical Biochemistry principles and methods; Walter de Gruyter, Ed.; 1974; Vol. II, 1073. [Google Scholar]
© 2006 by MDPI ( http://www.mdpi.org). Reproduction is permitted for non-commercial purposes.