1. Introduction
In everyday communication, non-verbal language plays an important role alongside verbal language, for example, through the use of hand gestures. They help us to express feelings and thoughts, to give context to spoken language (e.g., by pointing to something while speaking), or even to replace spoken language completely (e.g., by using the thumbs up gesture to signal to another person that everything is okay).
With technological progress, the desire to transfer this natural way of interpersonal interaction to computers is increasing. Thus, machines could be controlled directly using gestures: instead of the user learning to control the machines, they would use natural and instinctive means of communication, and the machine would learn to understand them.
In addition, even within a computer-generated environment, such as VR, interpersonal communication could be accomplished through the use of gestures. This would allow simple hand gestures, such as the aforementioned
thumbs up gesture, to be used in the context of operational force training. Significantly more complex issues could also be presented in the context of sign language, either because this is given by the application (e.g., sign learning software ) or because this is the user’s primary form of communication, e.g., for deaf and hard of hearing people. This is an aspect that is becoming increasingly important because, according to the World Health Organization [
1], there are approximately 430 million people worldwide with some degree of hearing loss, and the trend is increasing. Where hearing people within VR communicate predominantly with microphones in their spoken language, the deaf and hard of hearing have to express themselves non-verbally, for example, via a chat function. In addition, they cannot hear when other users communicate via the microphone. There are speech-to-text solutions that can display the spoken word as text, but an approach that can also convert signs into text or speech would still have to be developed for bidirectional communication.
Developing a system that can recognize and translate signs requires first determining how signs are structured. Linguist
William C. Stokoe [
2,
3] was one of the first to break down signs into their characteristic components. According to him, a sign consists essentially of the parameters of the hand shape, the orientation of the hand, the movement of the hand, and the location of execution of the sign. Other non-manual parameters such as facial expression are also conceivable, but the most important parameter is the hand shape [
4]. This is also evident when looking at the American Sign Language (ASL) finger alphabet: There are 26 signs with a total of 21 different hand shapes, which are all performed with the dominant hand. Two pairs of signs have the same hand shapes, but differ by having a movement of the hand (
I⇔
J and
1⇔
Z). Three other pairs of signs have the same hand shapes, but differ in the orientation of the hand (
K⇔
P,
G⇔
Q, and
H⇔
U).
To determine the hand shapes of an entire vocabulary, a suitable data set is needed.
ASL-Lex is a public sign lexicon for ASL [
5,
6]. It contains videos and information on 2723 signs. One component of this information is the so-called
Phonological Coding System, which is based on the
Prosodic Model of Sign Language by Brentari [
7]. It describes signs based on their characteristic features, similar to the aforementioned notation system of Stokoe [
3], only with significantly more parameters. To the best of our knowledge, there is no other publicly accessible database of this size that displays gestures in parametric form.
To recognize hand shapes reasonably, it also needs the appropriate hardware. There are different approaches, which can be distinguished in particular into video-based and (other) sensor-based approaches. In VR, data gloves are often used as an alternative to traditional controllers because they can capture hand shapes and movements even in complex motion sequences and are independent of occlusions [
8].
The main application of data gloves is hand-gesture recognition, especially for static gestures. Between 2015 and 2022, more than 100 papers were published in English on this topic in reputable sources, like the Institute of Electrical and Electronics Engineers (IEEE) or the Association for Computing Machinery (ACM), according to the Web of Science (WoS). More than 70% of these examine static gestures [
9].
Even though these papers all pursue the topic of hand gesture recognition with data gloves, they differ in some points: (
i) used classification methods, (
ii) number of participants, (
iii) number of samples, (
iv) number of hand gestures, (
v) type of hand gestures. The type of hand gestures is defined by the used features. The more features are present, the more information is available for the classifier to successfully recognize the hand gesture. Therefore, many of these papers ([
10,
11,
12]) not only use hand-shape information for classification, but also add hand orientation as an additional feature.
A distinction is also made between static and dynamic gestures: Static gestures possess spatial information, like the already-mentioned hand shape, the orientation of the hand, or the location of the hand where the gesture is performed. Dynamic gestures additionally possess temporal information, such as the movement of the hand [
12], the rotation of the ulnar, or a change in finger pose (e.g., closed fingers that are spread) [
5]. Therefore, some of the papers use dynamic gestures instead of static ones [
10,
12,
13,
14].
Goal and Methodology
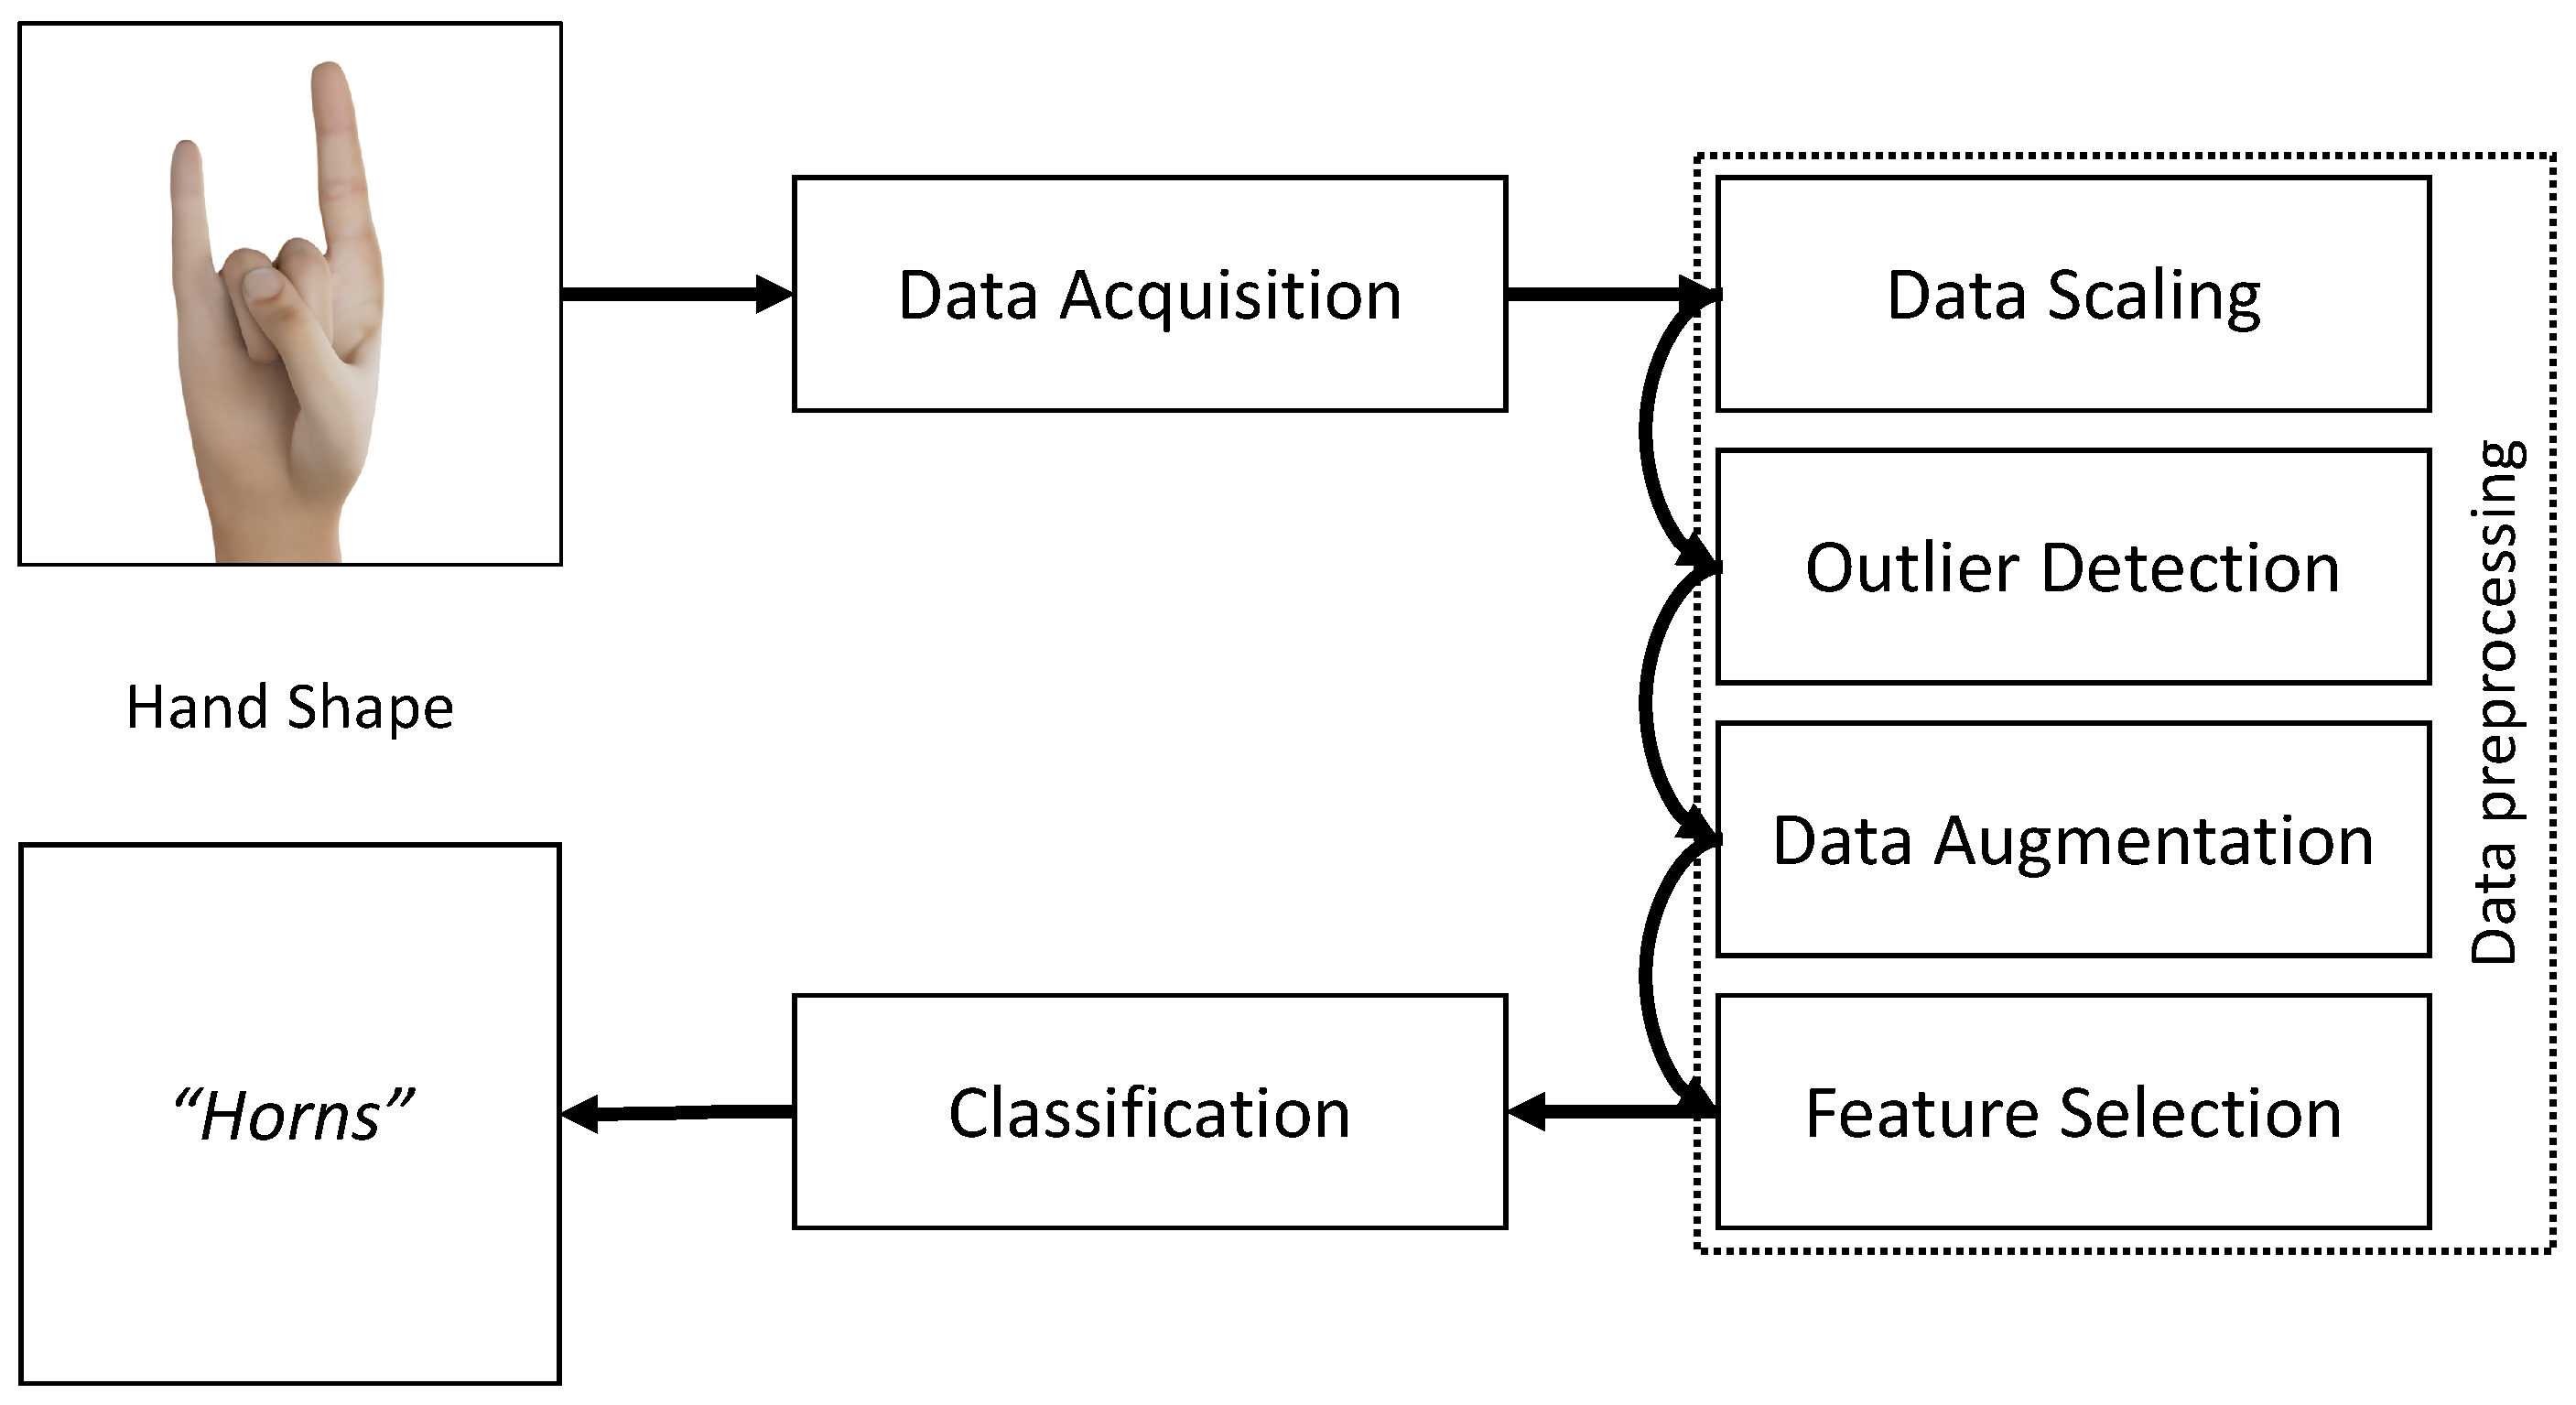
In this study, we focus on the recognition of static hand shapes with data gloves. We investigate whether commercially available data gloves are suitable for recognizing hand shapes of sign language in the use of VR. For this purpose, we designed a classification pipeline to reliably detect static hand shapes using a generalizable approach that can be used for other static data. The individual steps of data preprocessing will be examined with respect to their performance (accuracy and time for classification) and a recommendation is made as to which steps should be used for which use case. The classification pipeline can be seen in
Figure 1.
First, we acquire the hand shape with a Manus Prime X data glove. To ensure high-quality data, an outlier detection method called Density-Based Spatial Clustering of Applications with Noise (DBSCAN) is applied to the training data. The data are further augmented using a proprietary method and thus artificially duplicated with the goal of counteracting overfitting of the classification. To reduce the amount of training data and increase the speed of training and classification, we apply feature selection in the form of a genetic algorithm (GA).
For evaluation, we chose two different data sets: 27 hand shapes from the ASL finger alphabet (letters and numbers) and 56 hand shapes from a 2700+ word lexicon of ASL. On the one hand, this covers a variety of different hand shapes and, at the same time, serves to be able to create a basis for a sign language application within VR.
Our pipeline is generic and can be applied to any type of static data as long as they are in the correct data format. However, it is recommended to adjust the various parameters of the pipeline, such as the hyperparameters of the classifiers, to the new data.
2. Data Acquisition
To reliably recognize hand shapes, they must be recorded in a suitable form. The recordings can then be used to train machine learning (ML) classifiers. Attention must be paid to the choice of suitable hardware and the selection of features to be captured.
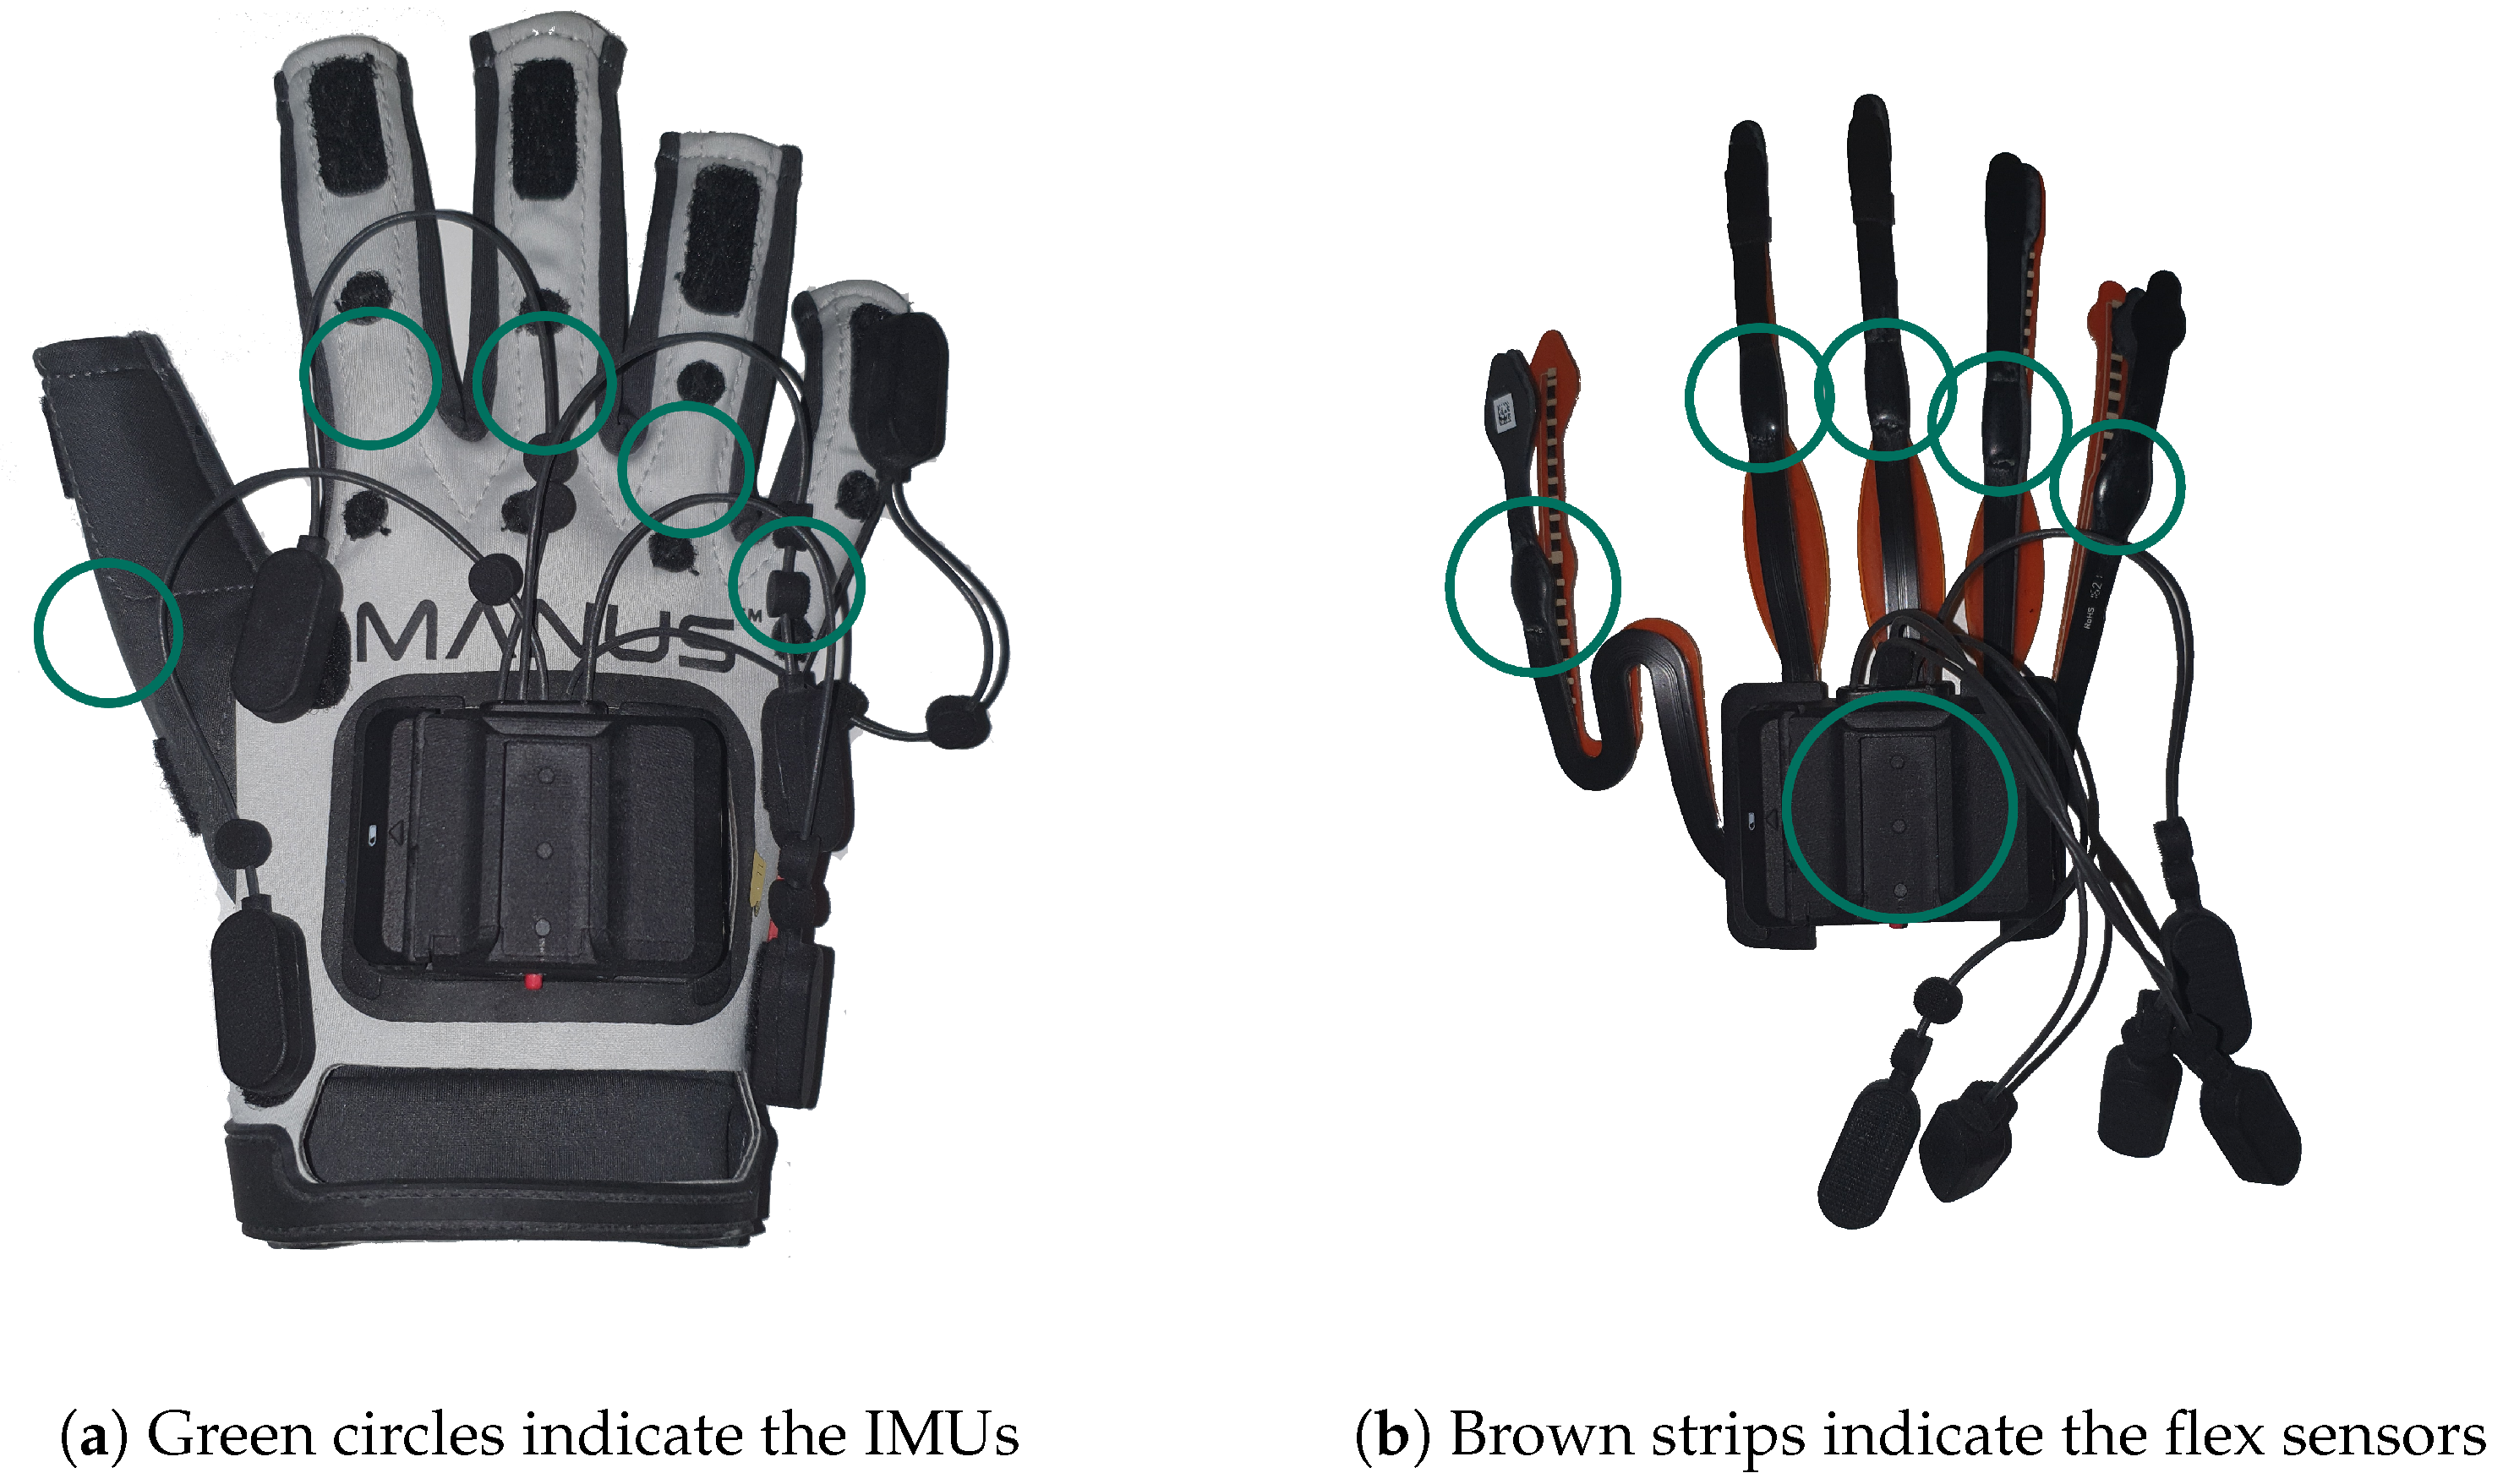
A 9-degrees of freedom (DoF) inertial measurement unit (IMU) and a 2D flex sensor are attached to each finger to obtain reliable values about the flexion/stretch of the fingers and the spread between each finger. The latter information is not available in some data gloves, but is indispensable for distinguishing individual hand shapes such as
R,
U, and
V (see
Figure 3) [
9]. A 6-DoF IMU is attached to the back of the hand to obtain its orientation. The accuracy of each finger measurement is ±2.5 degrees.
The acquired sensor values are internally fused and preprocessed with the
Manus Core C++ SDK (
https://documentation.manus-meta.com/v1.9.0/cpp-sdk/ (last visited on 21 October 2023)). The preprocessed data are transferred to the computer via Bluetooth. According to the manufacturer, the latency is less than 5 ms, and the glove’s sensor sampling rate is 90 Hz.
Table 1 shows all spread and stretch values given by the SDK that we use as features to represent each static gesture.
To obtain the best-quality sensor data, the gloves must be calibrated. This is achieved by performing three simple gestures via the SDK. This also compensates for deviations that may occur due to differently sized user hands. The calibration is stored in the glove so that it is immediately ready for use for the next session.
3. Data Preprocessing
The main idea of
data preprocessing is to highlight important information in the available data while also removing some of the redundant or misleading data that may be present [
10].
The first step of
data preprocessing is often to scale all data to a predetermined interval. The intervals
or
are often used. Alternatively, statistical properties of the training data can be used for scaling. In this study, we use sklearn’s
StandardScaler (
https://scikit-learn.org/stable/modules/generated/sklearn.preprocessing.StandardScaler.html (last visited 27 September 2023)). It calculates the average value of each feature
i, subtracts it from each data point, and divides it by the standard deviation.
In this way, all features follow a normal distribution with zero mean and unit variance. We chose this scaling procedure because it has been shown that some models, such as support vector machine (SVM) or certain linear models, may perform worse when the data are not scaled and centered around zero [
16,
17].
Other than scaling the data, we implemented several outlier detection and feature selection methods that sort out misleading data samples or unimportant features. We also experimented with various data augmentation techniques to artificially enrich our data set with the goal of improving the generalizability of our approach. The best methods in each category are presented in the following.
3.1. Outlier Detection
Outliers are samples that differ greatly from the other recorded samples. Outliers can occur during data acquisition, for example, due to sensor drift or because a user performs a gesture incorrectly. Such outliers can negatively impact the performance of ML classifiers, as it is often best for these models to be able to generalize and not overfit the data [
18].
Outlier detection therefore aims to find and remove all outliers within the given data.
Many algorithms used to achieve this goal are similar to clustering algorithms in that samples are also combined to form clusters. Points that do not belong to any cluster are then identified as outliers. In this study, we used the DBSCAN algorithm. DBSCAN starts at a random data point and searches for other samples within a predefined distance . If the number of samples within this distance is greater than the minPoints parameter, the original point is marked as a core point. This step is repeated for all data points. Afterwards, a random core point is selected and the point itself and all neighboring points within are added to a cluster. When all core points have been assigned to a cluster, the algorithm terminates. All samples that are not part of any cluster are considered outliers.
Outlier detection is rarely used in other works on gesture recognition. Most often, outliers are removed from the test set. This is usually carried out when outliers and incorrect predictions in the application phase can have serious consequences, such as in the medical field. In these scenarios, it is often more favorable to detect outliers and output a warning alongside the models’ prediction. Related works that operate in this way are, for example, by Zhang et al. [
19] or by Palipana et al. [
20].
In this study, we focused on detecting outliers only in the training data, since our application phase is not as critical at this time and it can be more easily compared to most other gesture recognition work. Test data should also, in our opinion, represent a possible real-world scenario; this includes biases in sensor values or erroneous user executions.
Once the outlier detection has been performed, the remaining data are scaled again according to the principle described above.
3.2. Data Augmentation
In order to use ML models for reliable hand-shape classification, a sufficient amount of high-quality training data must be available. In particular, in the application area of gesture recognition with the use of wearable sensors as a data source, the acquisition of large amounts of data for learning poses is one of the main challenges due to the cumbersome acquisition process. This is because the data must be physically gathered from individuals equipped with wearable sensors and then carefully labeled afterwards (see
Section 2), which takes time and effort and usually yields inadequate quantities, especially for
deep learning approaches [
21]. In addition, further challenges may arise, for example, at the time of the
COVID-19 pandemic, which required even stricter hygiene standards and therefore may increase the cost of physical data acquisition with wearable sensors. Thus, building a rich and diverse data set may become even more laborious. This potential scarcity of training data can then lead to poor generalization capabilities of the model.
One way to deal with these problems is the use of
data augmentation to artificially enrich the training data set. This is usually achieved by applying transformations to the existing data to create new, synthetic data samples.
Data augmentation can therefore be employed as a preprocessing step in order to ultimately reduce overfitting and enhance the robustness and generalizability of the ML models used [
22].
However, the applicability of different data augmentation methods depends on the type of data available and corresponding sensor technology, and therefore must be evaluated for the specific task at hand. Depending on these factors, and additionally on the ML classifiers used, the effectiveness of data augmentation may vary.
As introduced in
Section 2, static spread and stretch values for each joint are used in this study as features. However, the available literature on
data augmentation for wearable sensors is mainly concerned with dynamic data consisting of a gesture performed within a certain time interval. For example, Um et al. [
22] conducted one of the most comprehensive evaluations of
data augmentation techniques for wearable sensor data used in dynamic approaches. These methods leverage variations in orientation or timing and are therefore not applicable in this setting, since the available data do not capture positional or dynamic properties. In contrast, the literature on
data augmentation for static hand-shape recognition is rather scarce and mostly not the subject of studies. However, in this study, we have adapted a
data augmentation approach presented by Liu and Ostadabbas [
23] so that it is applicable to the available data and can be used in our setting to reduce overfitting and improve the generalizability of the models by introducing more variety to the way hand shapes are performed. Below, we present the
data augmentation approach we use to generate artificial data samples, i.e., hand shapes.
Methodology
We have adopted and slightly adapted a
data augmentation approach presented by Liu and Ostadabbas [
23], where joint angle constraints are used to define range boundaries for each joint. Using these range boundaries, new poses can be generated by randomly sampling within the defined limits for each joint. This ensures that the newly generated data samples are valid, since the boundaries can be set appropriately.
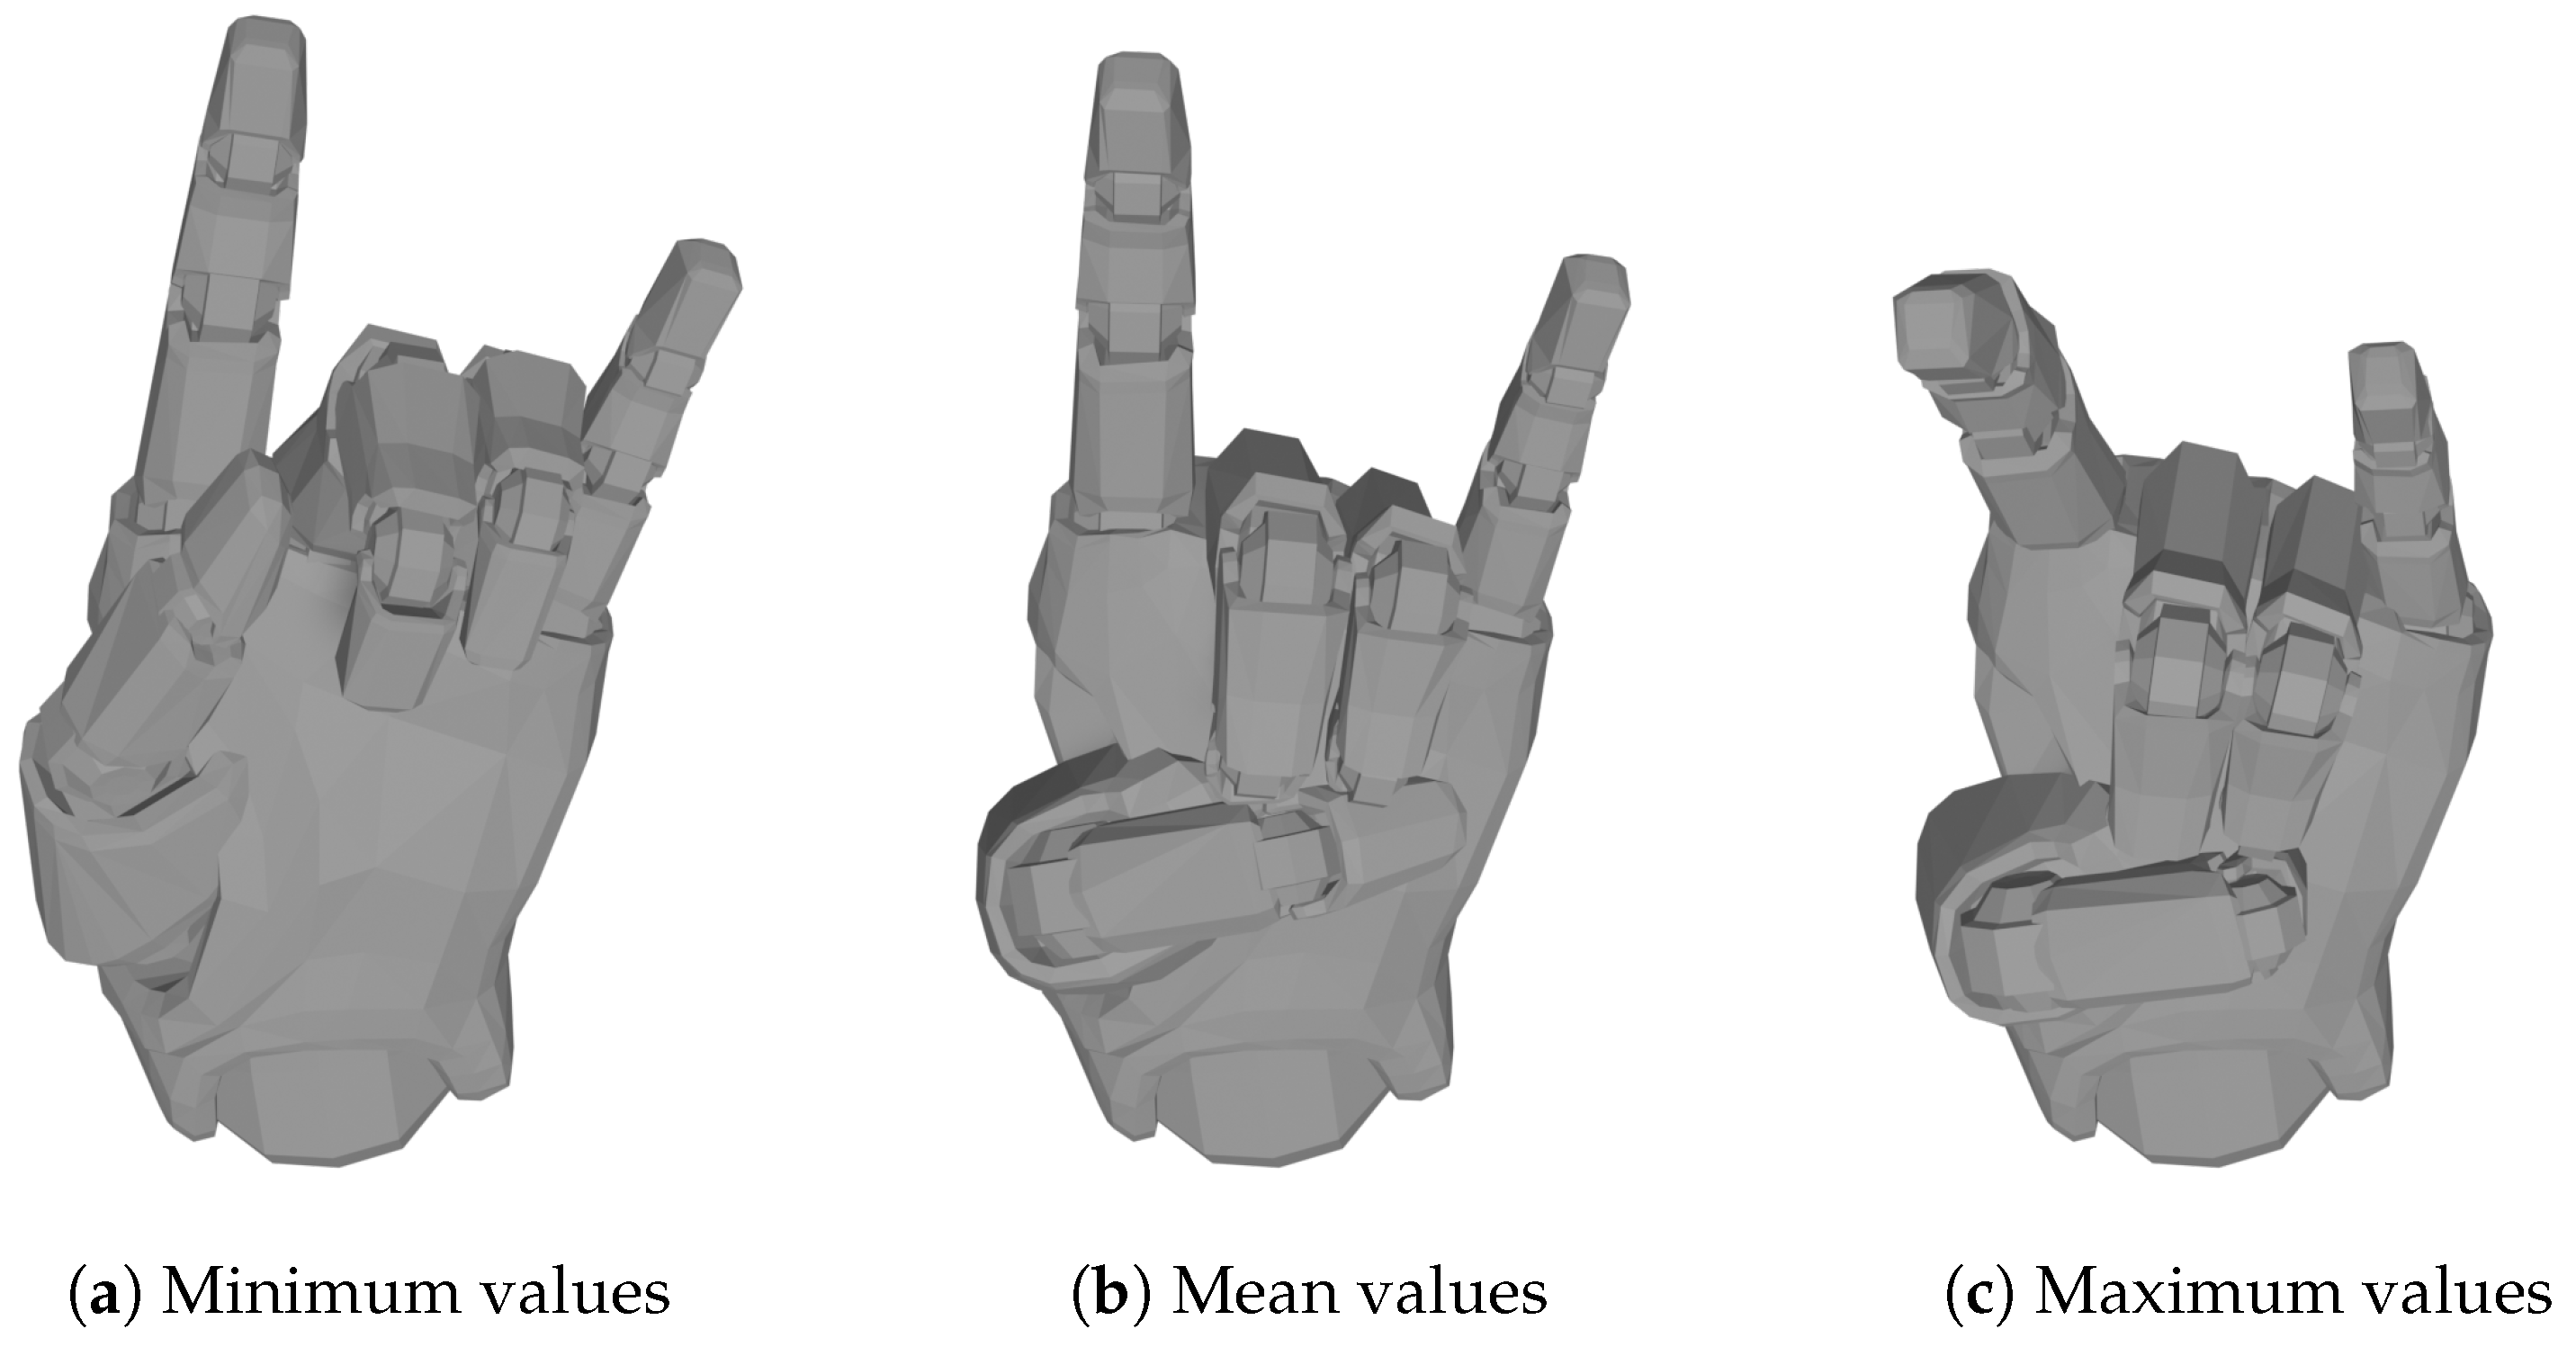
We modified this approach to generate new data samples for each specific hand shape (i.e., label). Therefore, these range boundaries must be chosen differently for each hand shape and define the amount of maximum and minimum joint bending that is still considered to be the respective hand shape. This would be required for each hand shape in our data set. In this study, we define the limits by first calculating the respective minimum and maximum joint values for each hand shape from the available data. As an example,
Figure 5a,c show the minimum and maximum hand shape for the
Horns label, which is illustrated in
Table A1 in
Appendix A (we used the 3D hand model provided by the
Manus Core Plugins and visualized it using
Blender [
24]). Compared to the mean hand shape in
Figure 5b, it becomes apparent that there may be slight variations in the way a hand shape is performed by individuals due to anatomical differences, which may lead to larger disparities in some feature values depending on the hand shape. In addition, inaccuracies in the glove data sensors also seem to play a role, because although the hand shapes were recorded under supervision and performed again in case of errors, there are still sometimes large differences in the data. These two factors can lead to large differences in some joint values, especially in the joints of the thumb.
In order to improve generalizability to yet-unseen data samples, we further add (subtract) half the standard deviation of each feature
to (from) the calculated maximum (minimum) values for each hand shape (i.e., label
l). Since we have a normal distribution with unit variance (
) due to standardization, the calculation simplifies as follows:
Concretely, this results in minimum values with feature vector
and maximum values with feature vector
for each label
l. Here,
is the number of features, as shown in
Table 1. Using these limits, a new data sample
can then be generated for a specific label
l by sampling new feature values
from a uniform distribution
where
.
Even after applying data augmentation, the entire data set, including the augmented data, is scaled again, as described at the beginning of the chapter.
3.3. Feature Selection
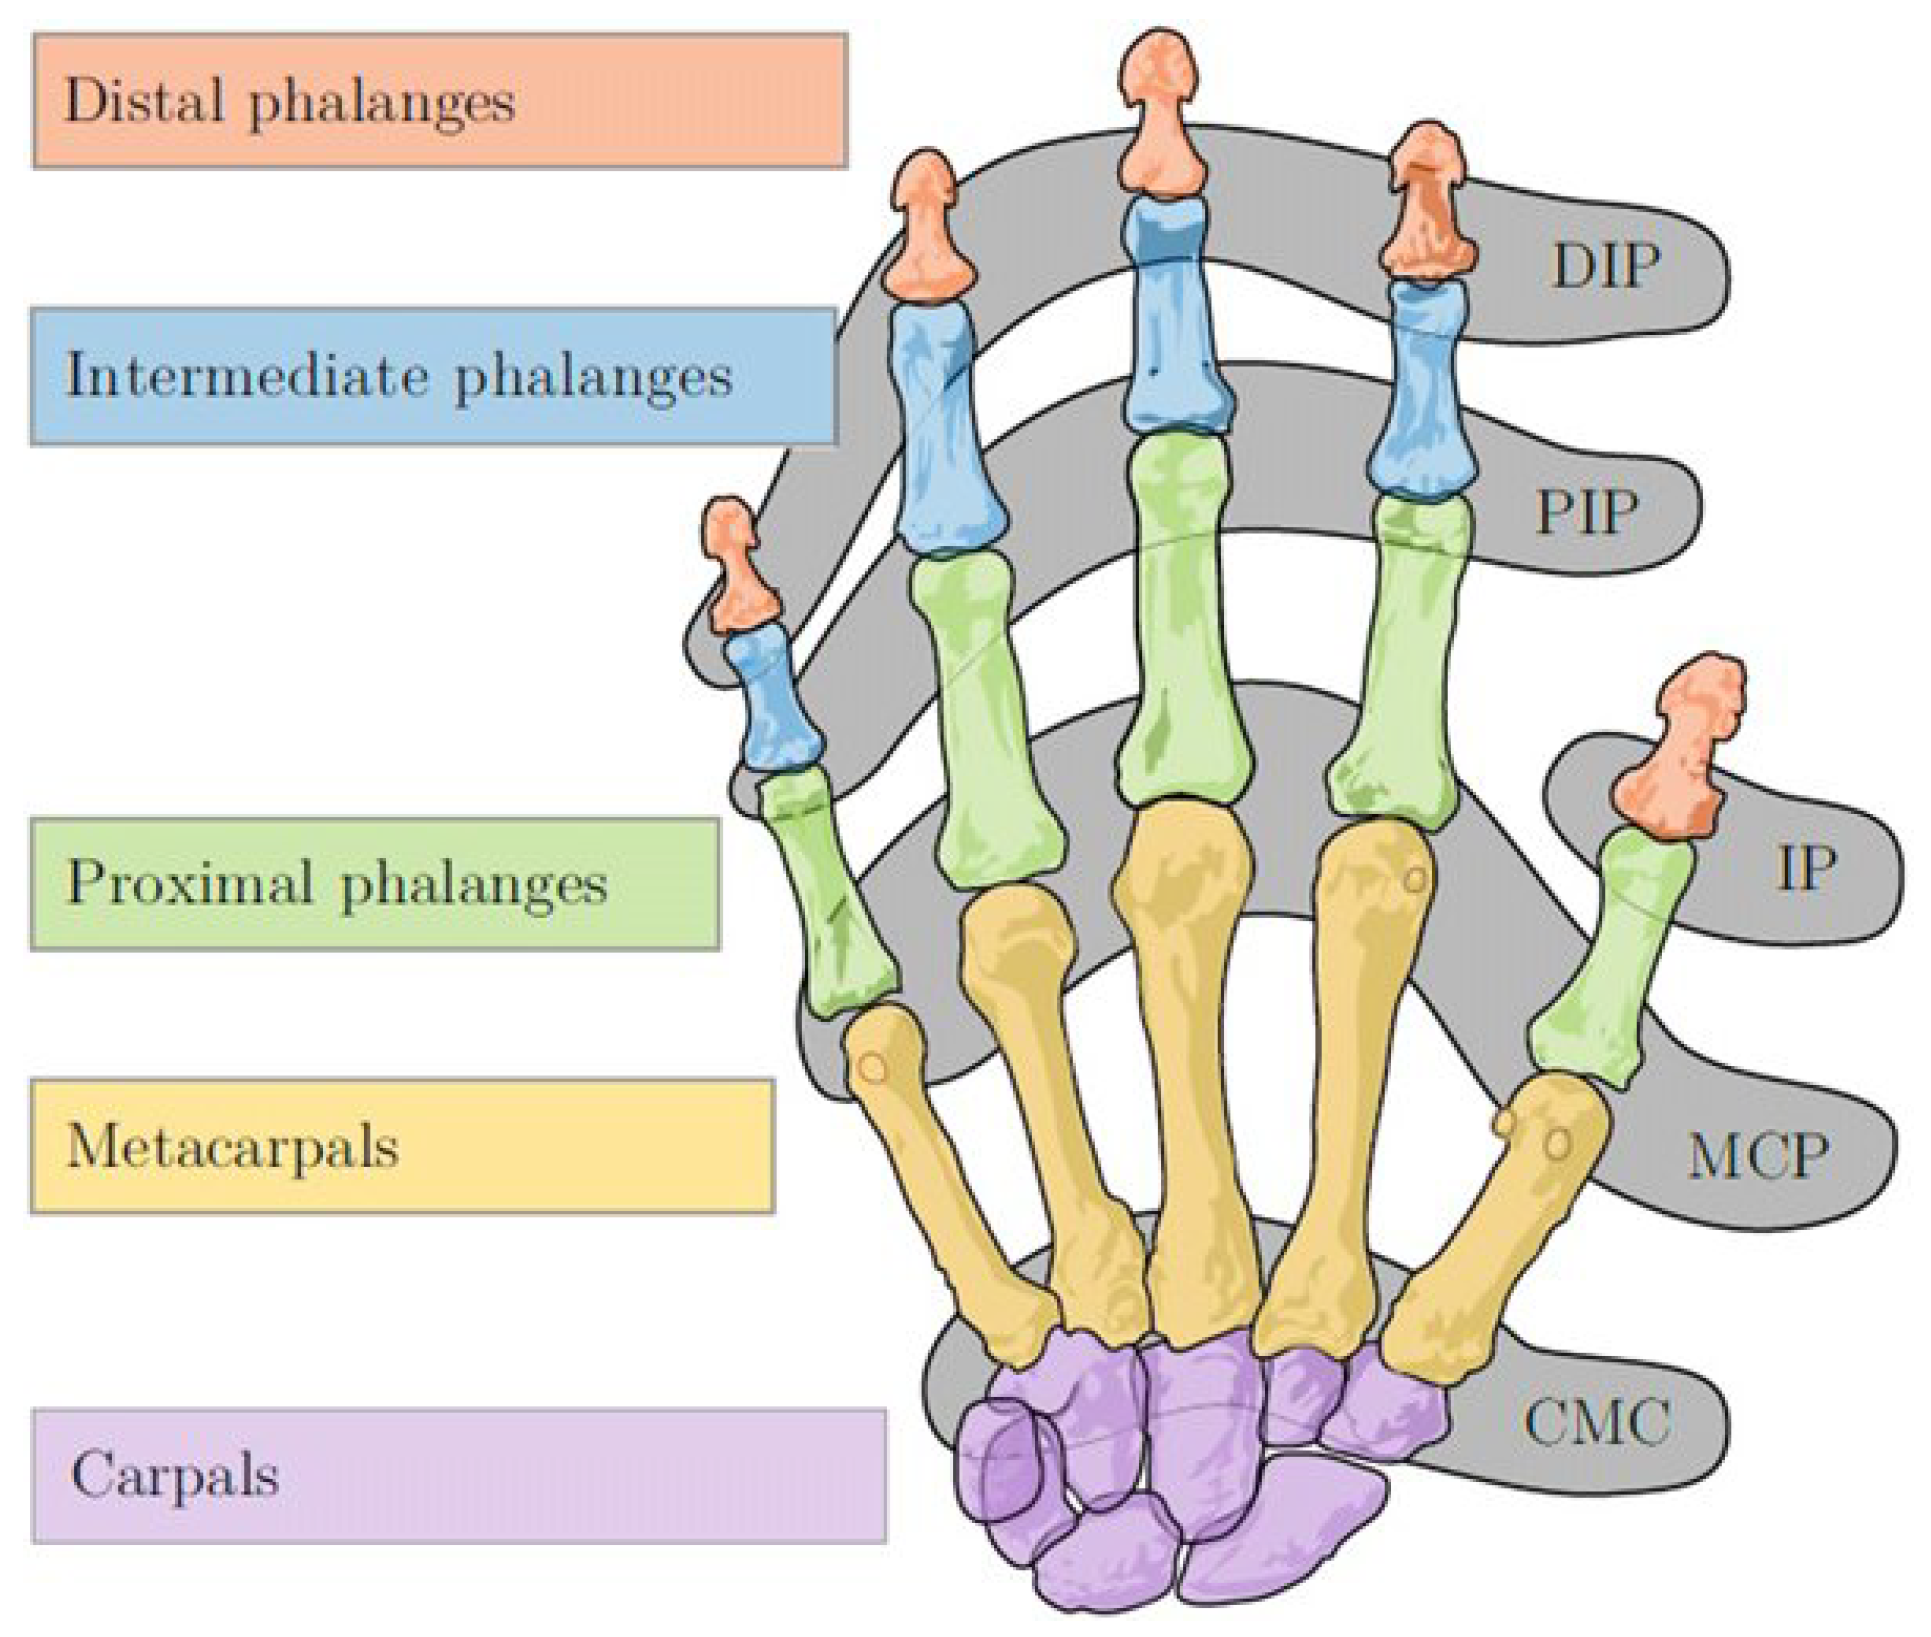
Each feature of a data sample holds a certain amount of information about the performed gesture. Some features may be more important than others. For example, the
distal interphalangeal (DIP) and
proximal interphalangeal (PIP) joints, shown in
Figure 6, are interdependent in most of the gestures that were investigated here [
9]. Consequently, only one of these features holds significant information about the performed gesture. This is in contrast to any of the thumb features, as the exact position of the thumb plays an important role in many of gestures that were examined in this study. Thus, in general, many of the
DIP and
PIP features hold very little information about the performed gesture, while other features, such as that of the thumb, are more important for the classification.
Figure 6.
Joints and bones of the human hand [
25].
Figure 6.
Joints and bones of the human hand [
25].
Feature selection takes advantage of this and tries to keep the most important features, while also removing features that hold very little information. That way, fewer features are used to represent a single gesture, meaning the data take up less space and the ML models can focus on the most important data [
26].
In this study, we used a genetic algorithm (GA) for
feature selection. The algorithm is loosely based on the theory of evolution and consists of an initialization phase and four repeating phases after that (a step-by-step instruction can be found at
https://neuraldesigner.com/blog/genetic_algorithms_for_feature_selection#GeneticAlgorithms (last visited 21 October 2023)): (
i) At first, multiple bitstrings are randomly created (initialization). Each bit corresponds to a single feature that is either kept (1) or discarded (0). For each of these bitstrings, one ML model is created and trained with the corresponding features. (
ii) Afterwards, some of these models are selected for the next phase of the algorithm. Models with high accuracy often have a higher chance to be selected by the algorithm. (
iii) The remaining bitstrings are combined to form new combinations of features. (
iv) These may randomly flip single bits (=
mutation). The resulting bitstrings are used to train new models. The whole process is repeated until either a predefined number of iterations is reached or there has not been a significant accuracy improvement for multiple iterations [
27].
The algorithm has also been used in related studies, such as that of Li et al. [
28], to reduce the training error alongside the number of epochs of a neural network, when classifying ten gestures. Without GA, a training error of about 0.00566 was reached after 5000 epochs. Using GA, the error was reduced to about 0.00042. Using a handcrafted modification of the GA reduced the error to about 0.00010 after just 608 epochs.
5. Experiment
In an experiment [
15], different hand shapes used in the
ASL-Lex lexical database (
https://asl-lex.org (last visited 27 September 2023)) and ASL manual alphabet (including digits) were recorded with a
Manus Prime X data glove. We examined two different data sets in this paper:
- ASL manual alphabet
consists of 26 different hand gestures with 21 different hand shapes. To represent the digits 0–9 as well, six more hand shapes were added. This leads us to 27 hand shapes with which fingerspelling is possible, i.e., the possibility to spell names and numbers.
- ASL-Lex
All hand shapes from the ASL manual alphabet are found in the set of hand shapes of
ASL-Lex, with the exception of the hand shape
M and
N. Therefore, we have a total set of 58 hand shapes, which are shown in
Table A1.
Since the focus of this study is on hand-shape recognition, all recorded hand gestures are static, differ only by hand shape, and are independent of hand orientation. Therefore, all stretch and spread values from
Table 1 were used as features. The quaternions of the individual fingers were not considered due to their dependence on orientation.
5.1. Data Acquisition
For data acquisition, a total of 20 participants took part in the experiment [
15]. The experiment was conducted as follows:
To allow for better hand mobility, the vibration motors on the gloves were removed. Prior to each experiment, the gloves were recalibrated using the associated software of Manus Core SDK to clean up any possible drift in the IMU sensors and to ensure that different hand sizes of the participants did not affect the results.
After calibration, each participant sat at a table and was shown a picture of the hand movement to be performed. Pressing the Enter key started the recording. The participant then had three seconds to perform the hand gesture and then held it for an additional two seconds. In a later segmentation, the static hand shape was then extracted as one keyframe from the middle of this second section.
After recording, participants were asked to return their hands to the starting position and place them on the table. This process was repeated three times for each hand gesture. Throughout the experiment, participants were under observation to ensure that the hand gestures were performed correctly. Incorrect recordings were repeated at the end of the experiment.
Thus, for each of the 58 hand gestures we used, three repetitions were recorded for 20 participants, yielding a total of 3480 samples.
5.2. Hyperparameters
To find suitable hyperparameters for our hand-shape recognition system, we first performed a pre-grid search with ten-fold cross-validation over all recorded samples for both data sets and each combination of our data preprocessing methods. The hyperparameters were searched in the same areas that Achenbach et al. [
11] already used. In this way, we were able to determine 16 different configurations of hyperparameters. From these, we have now defined a smaller, but more precise range, which can be viewed in
Table 2. This range was used in each run of our following experiments with a five-fold cross-validation grid search.
To save computational resources, we performed the grid search based on the successive halving algorithm and used sklearn’s
HalvingGridSearchCV (
https://scikit-learn.org/stable/modules/generated/sklearn.model_selection.HalvingGridSearchCV.html (last visited 7 November 2023)). This algorithm allocates resources dynamically and favors the most promising hyperparameter configuration. Starting with an equal distribution of resources, the grid search, therefore, iteratively excludes hyperparameter combinations that are considered to be the least effective. Overall, this leads to considerable time savings in the search for the best hyperparameter configuration.
5.3. Hardware
An
Apple MacBook Pro (
https://support.apple.com/kb/SP858 (last visited 15 November 2023)) (16
, 2021) with an
Apple M1 Max processor (10-core CPU with 8 performance cores and 2 efficiency cores, 32-core GPU, 16-core neural engine, and 400 GB/s memory bandwidth) and 32 GB RAM was used to compute the results presented here. The Python library scikit-learn (
https://scikit-learn.org/stable/ (last visited 28 September 2023)) (version 1.2.1) and Python (version 3.9.6) were used.
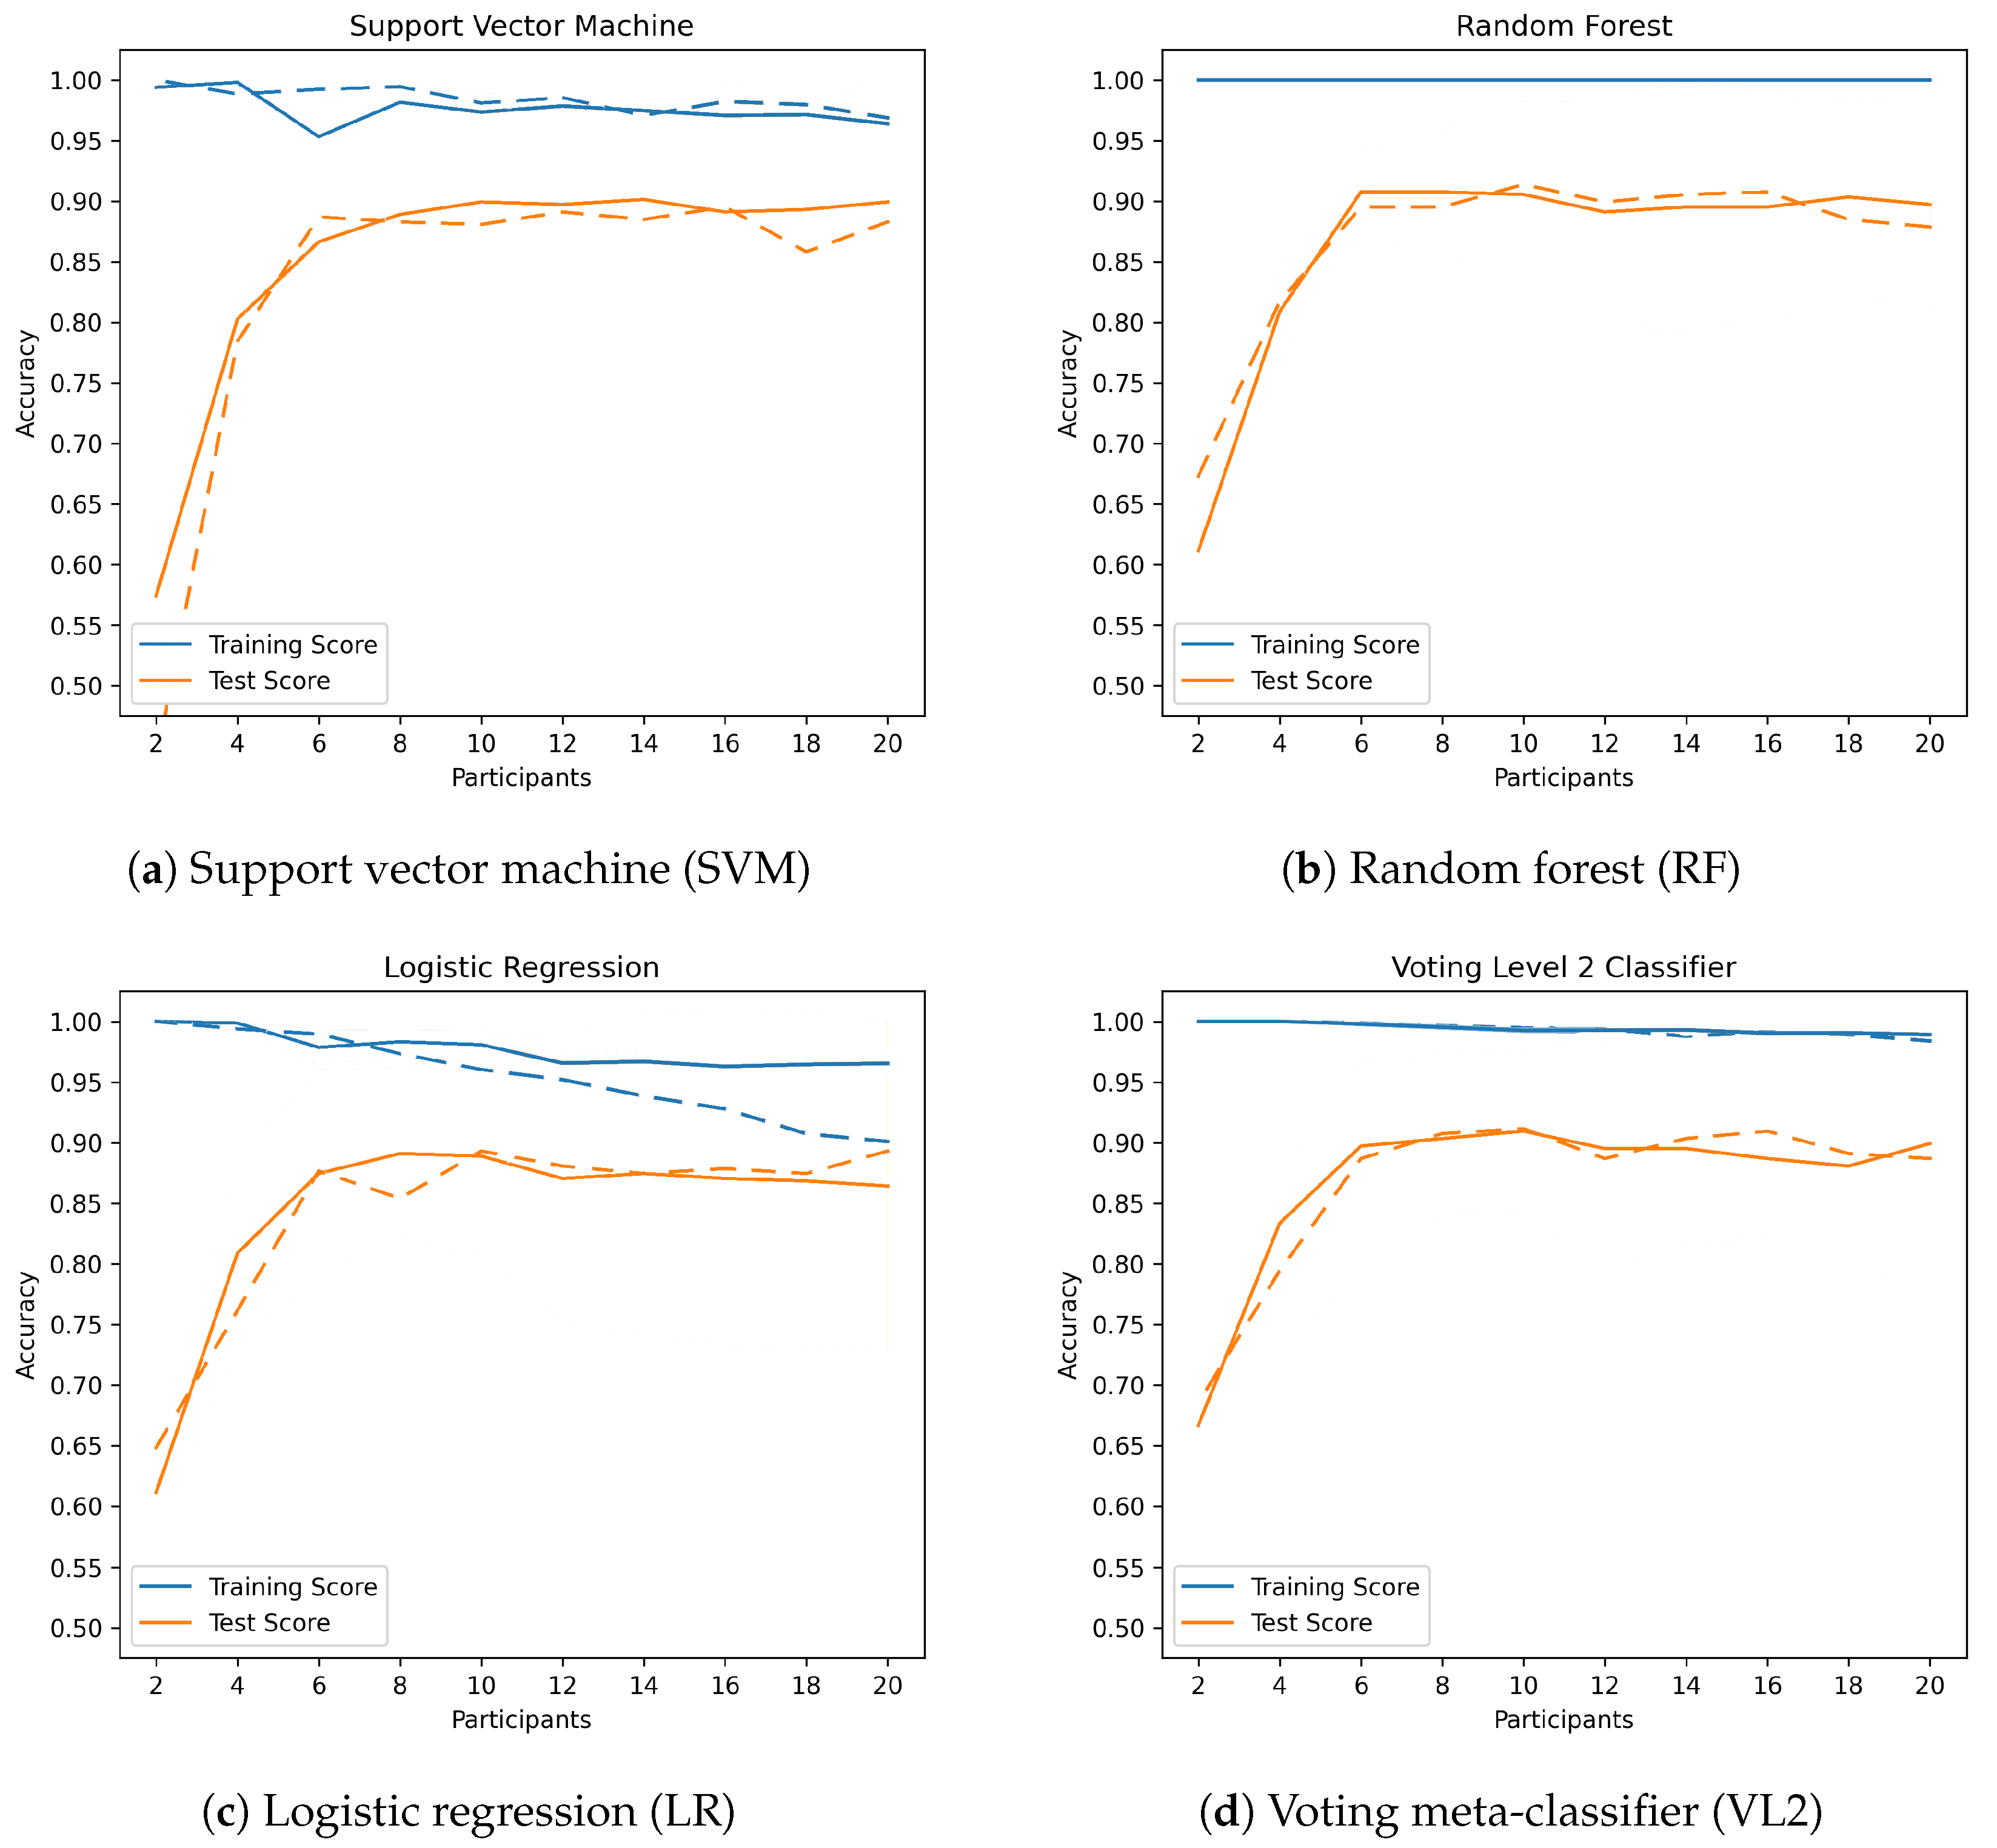
6. Results
The four classifiers were evaluated using a leave-one-out cross-validation, i.e., the training and test data were separated such that one participant’s data were used as test data and all other data were used as training data. In this way, all possible combinations were iterated, i.e., 20 repetitions for participants. To compare the performance of the classifiers, the accuracy and time for classification were stored and evaluated. The mean and standard deviation were calculated from the data thus obtained. Since we had an equal class distribution and prioritized each class equally, we omitted other measures such as the F-score.
Table 3 and
Table 4 show the accuracy values of all classifiers with respect to the data preprocessing methods used. The best results for each classifier and data preprocessing configuration are marked in green; the worst results are marked in red.
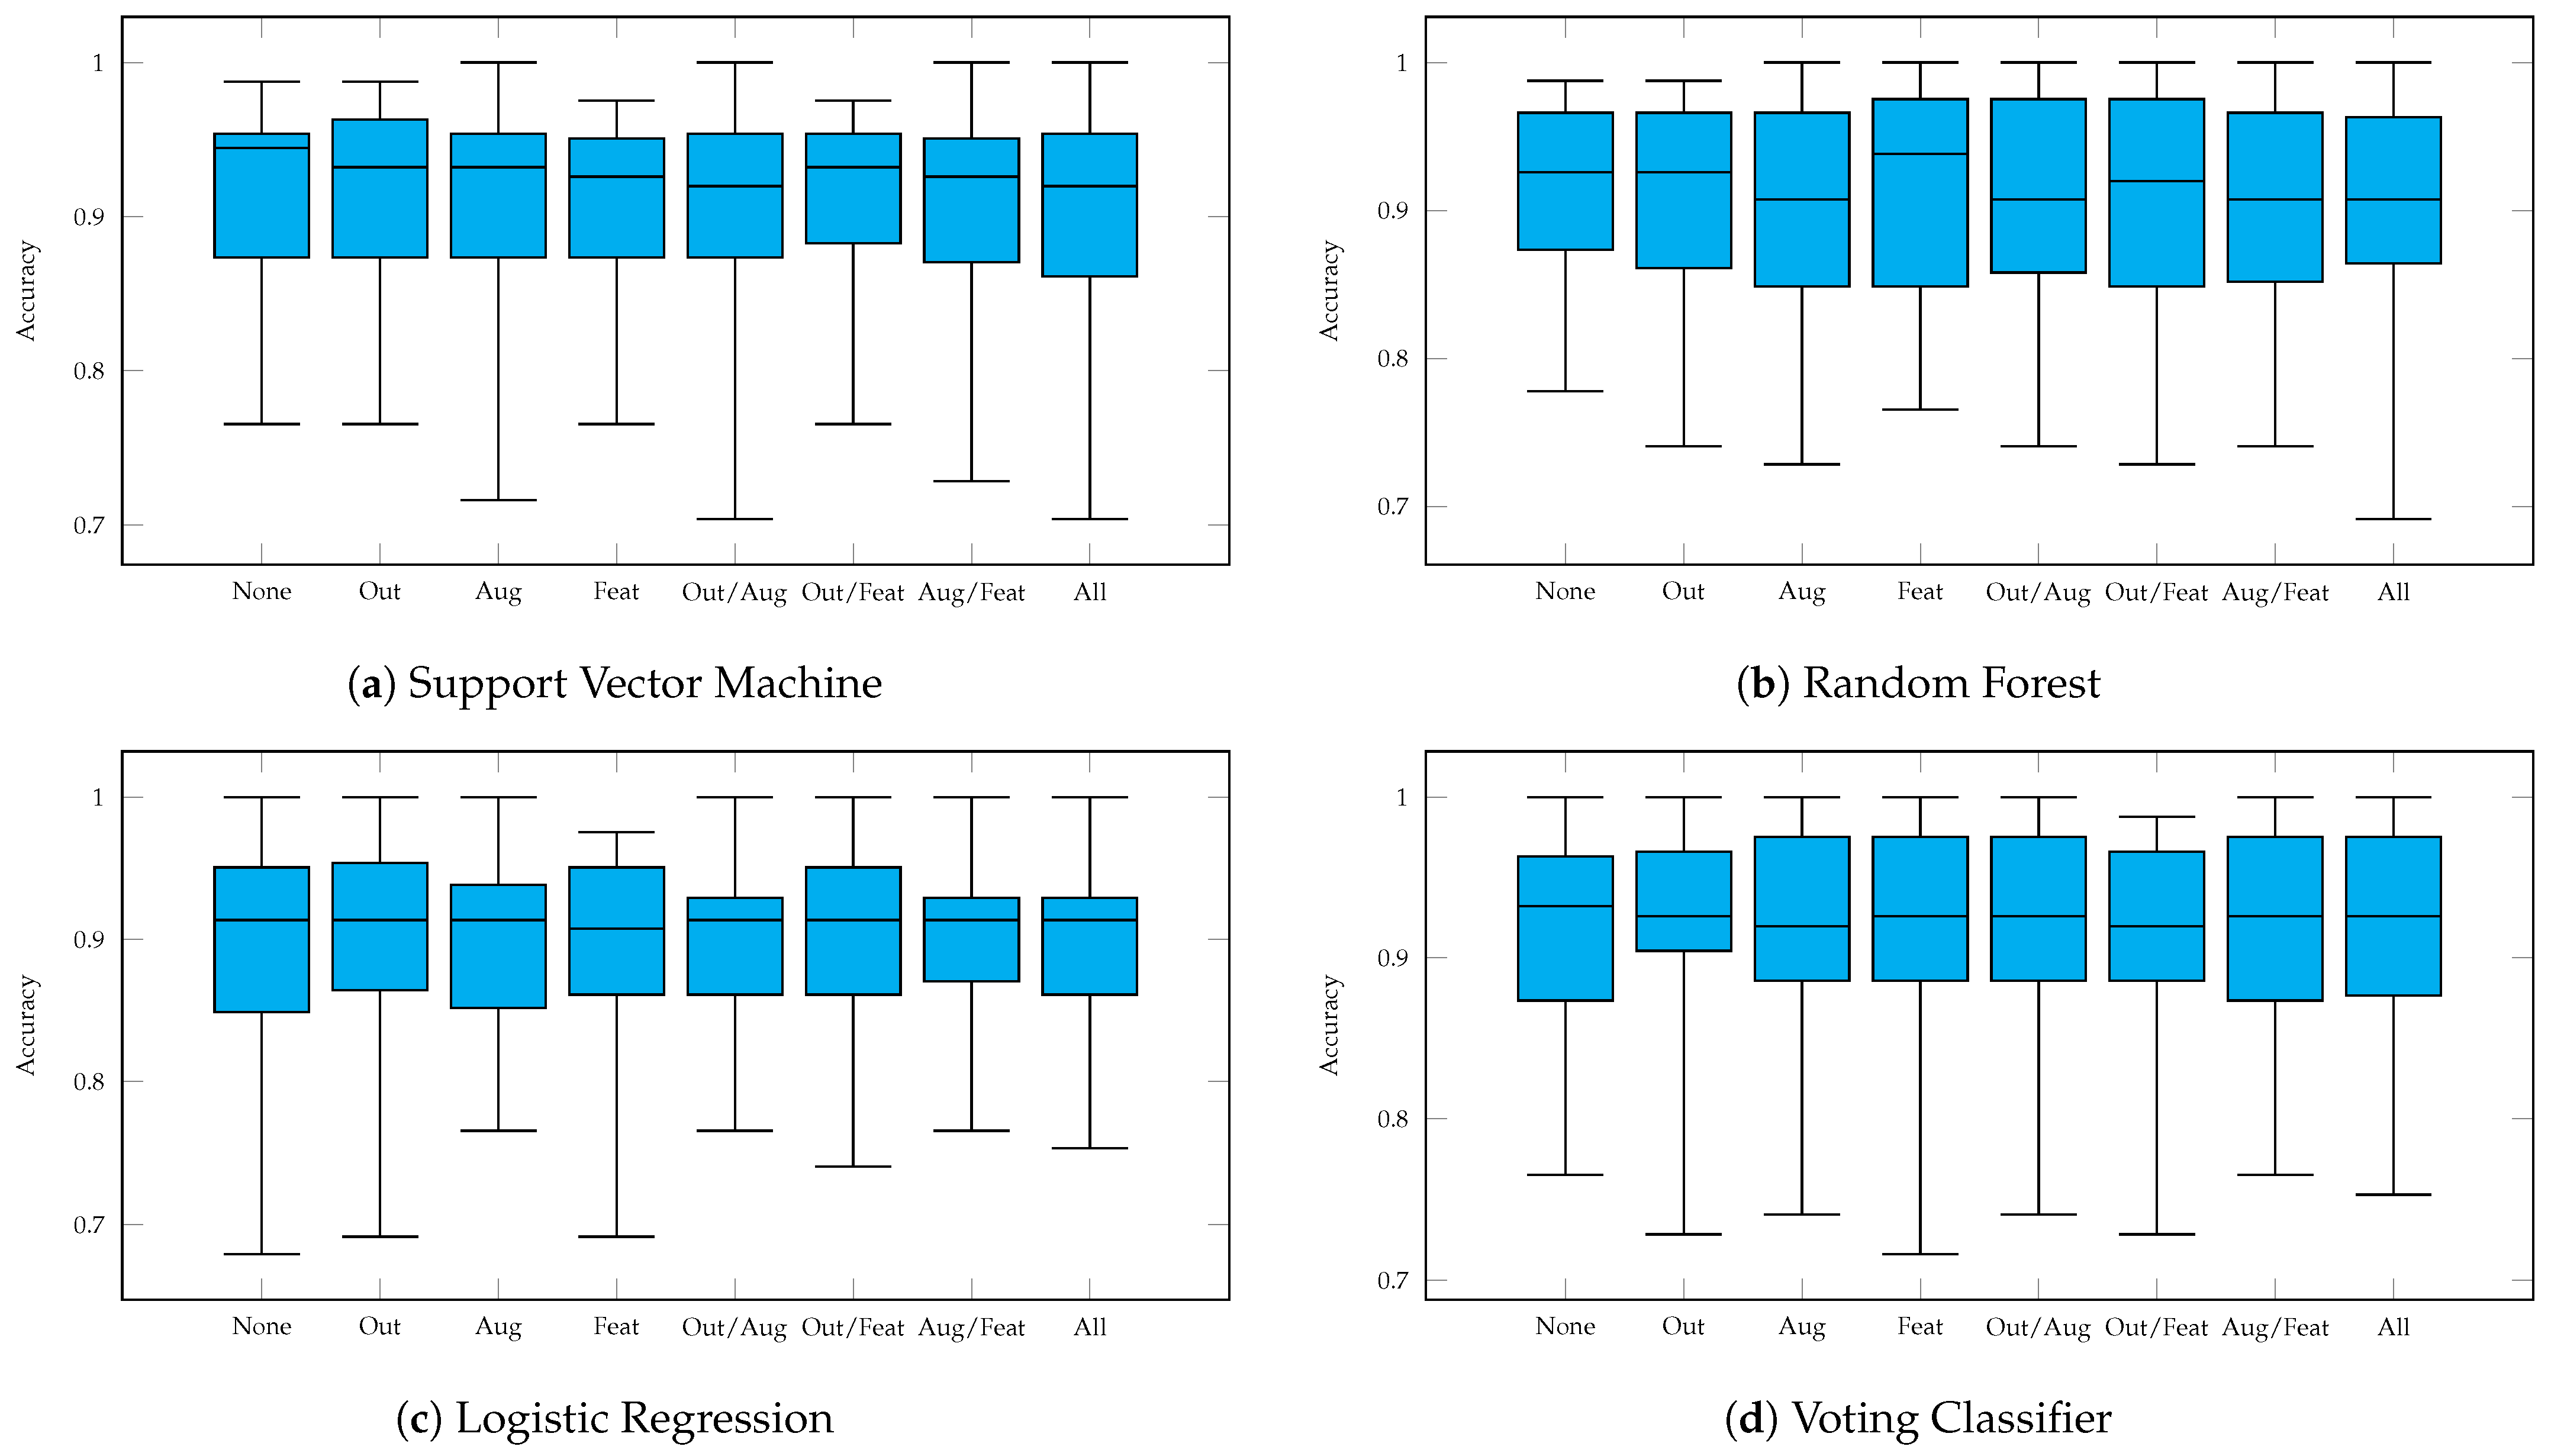
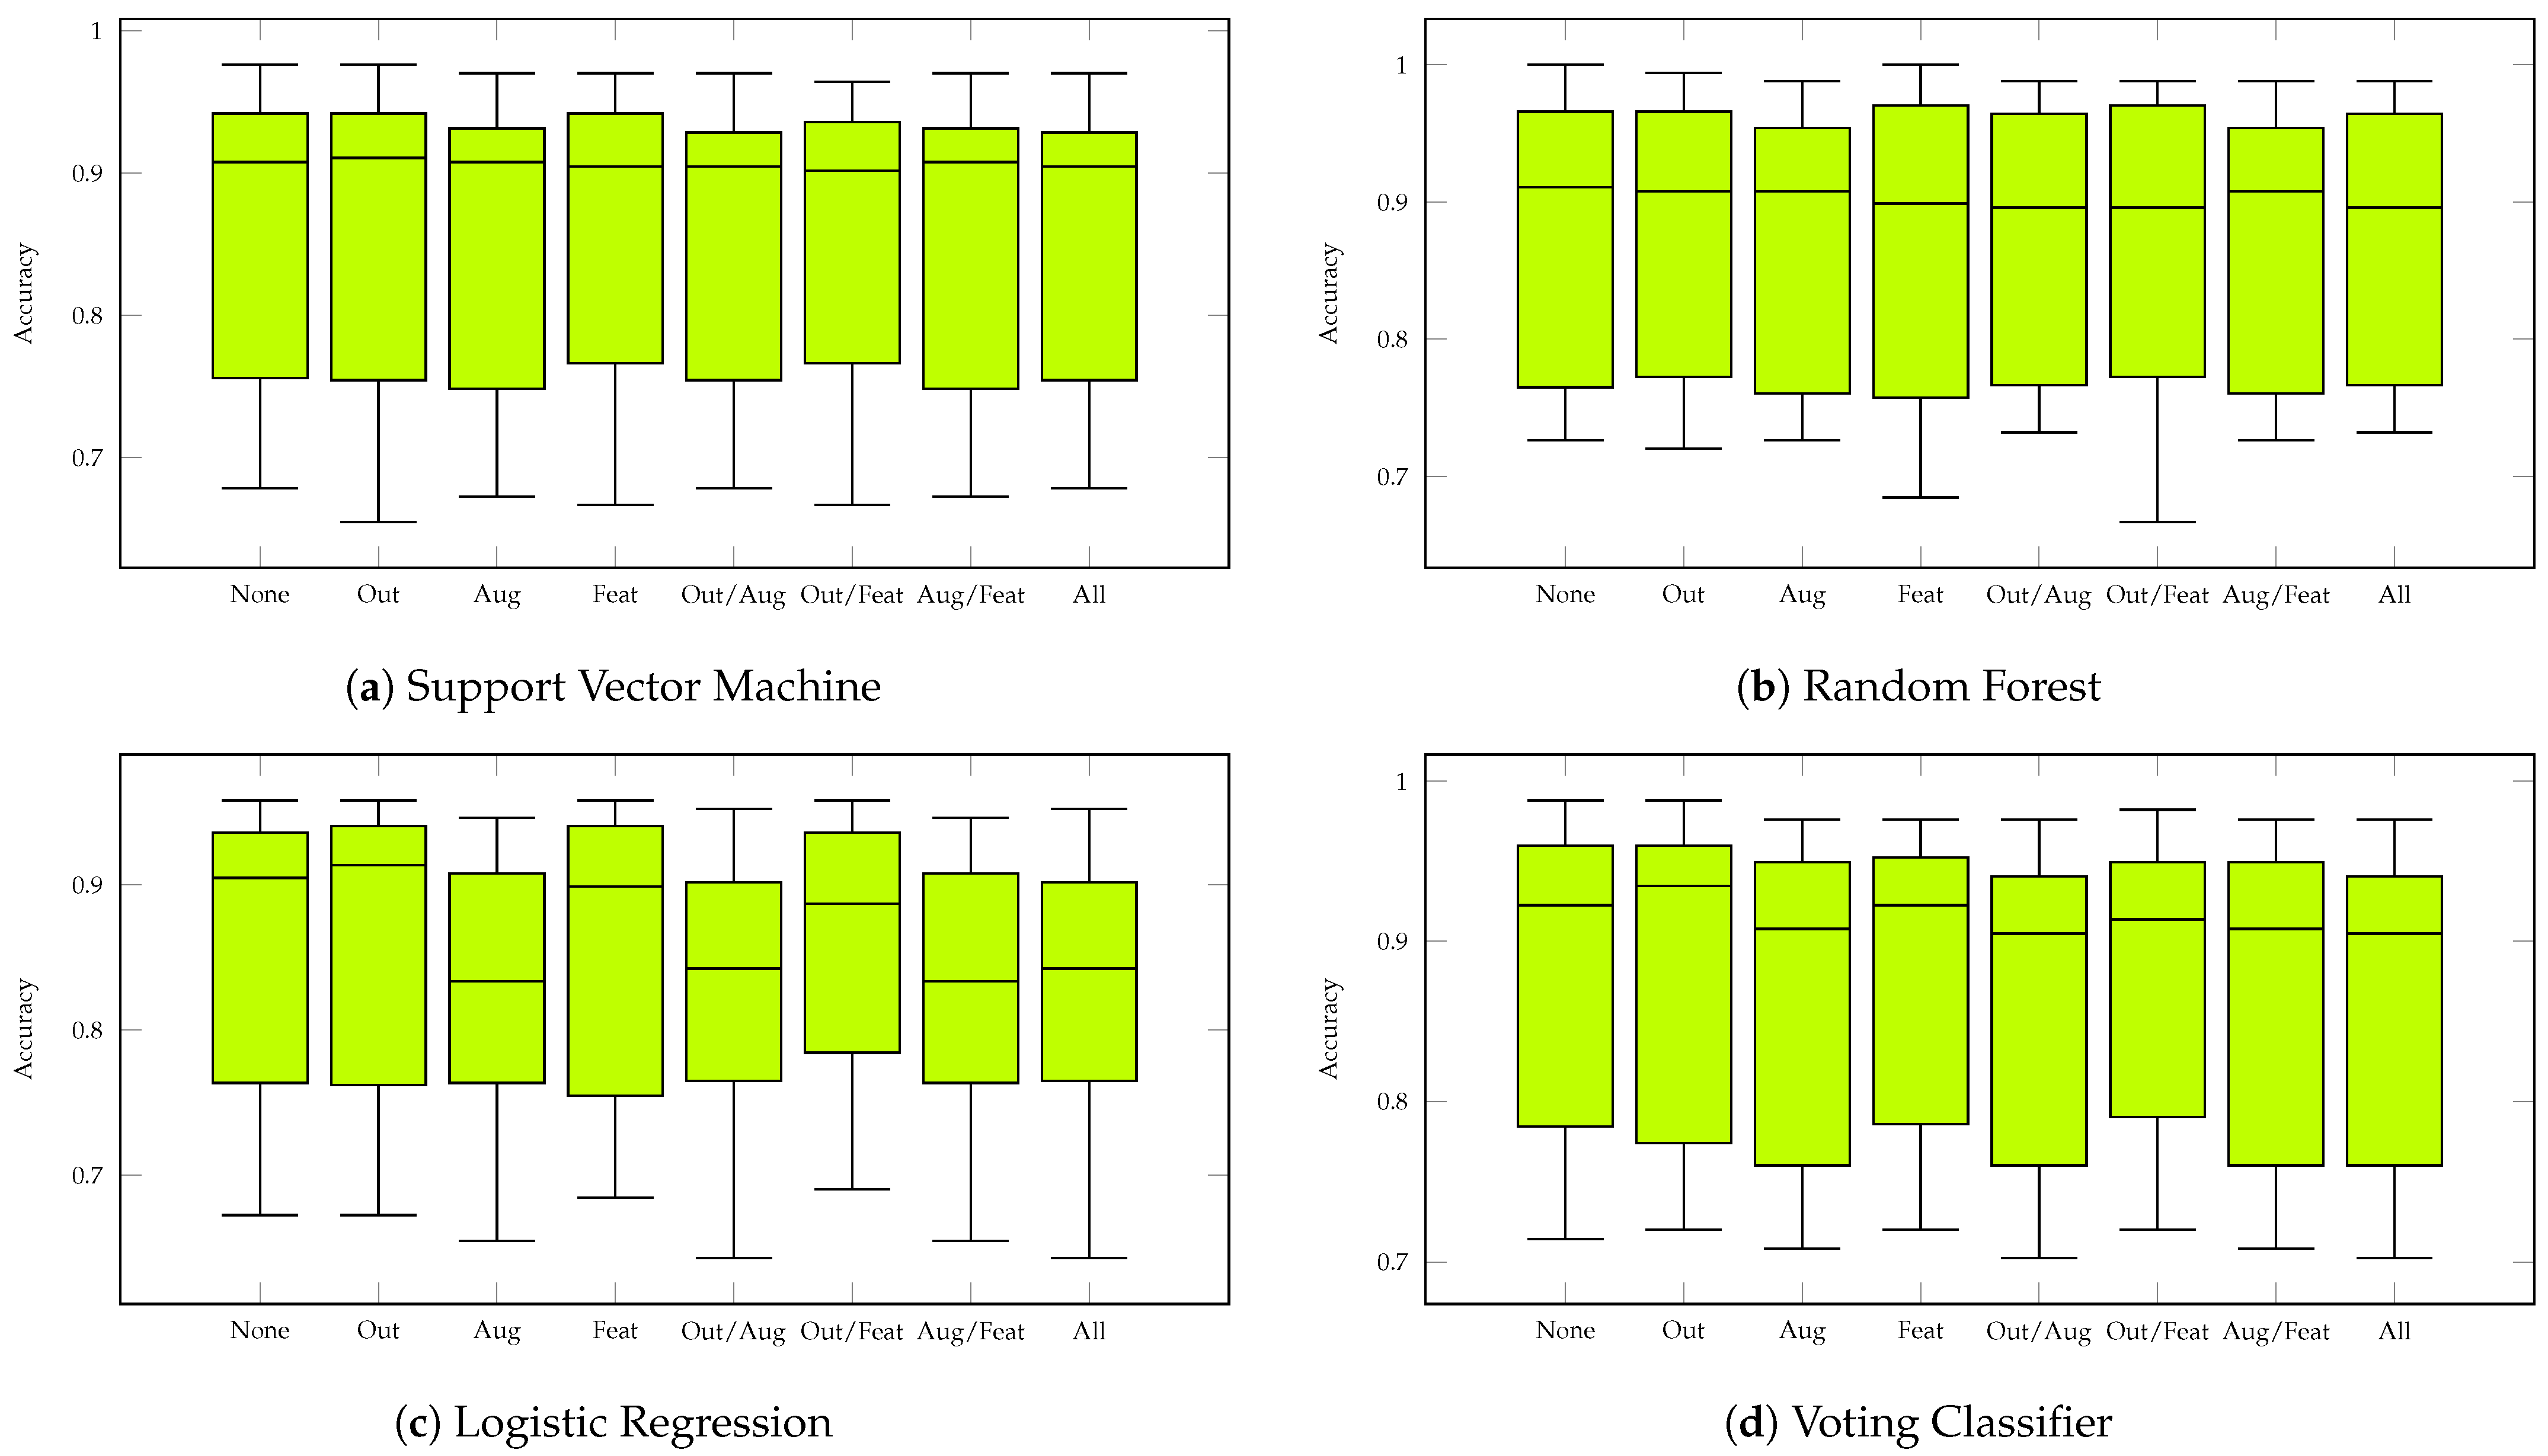
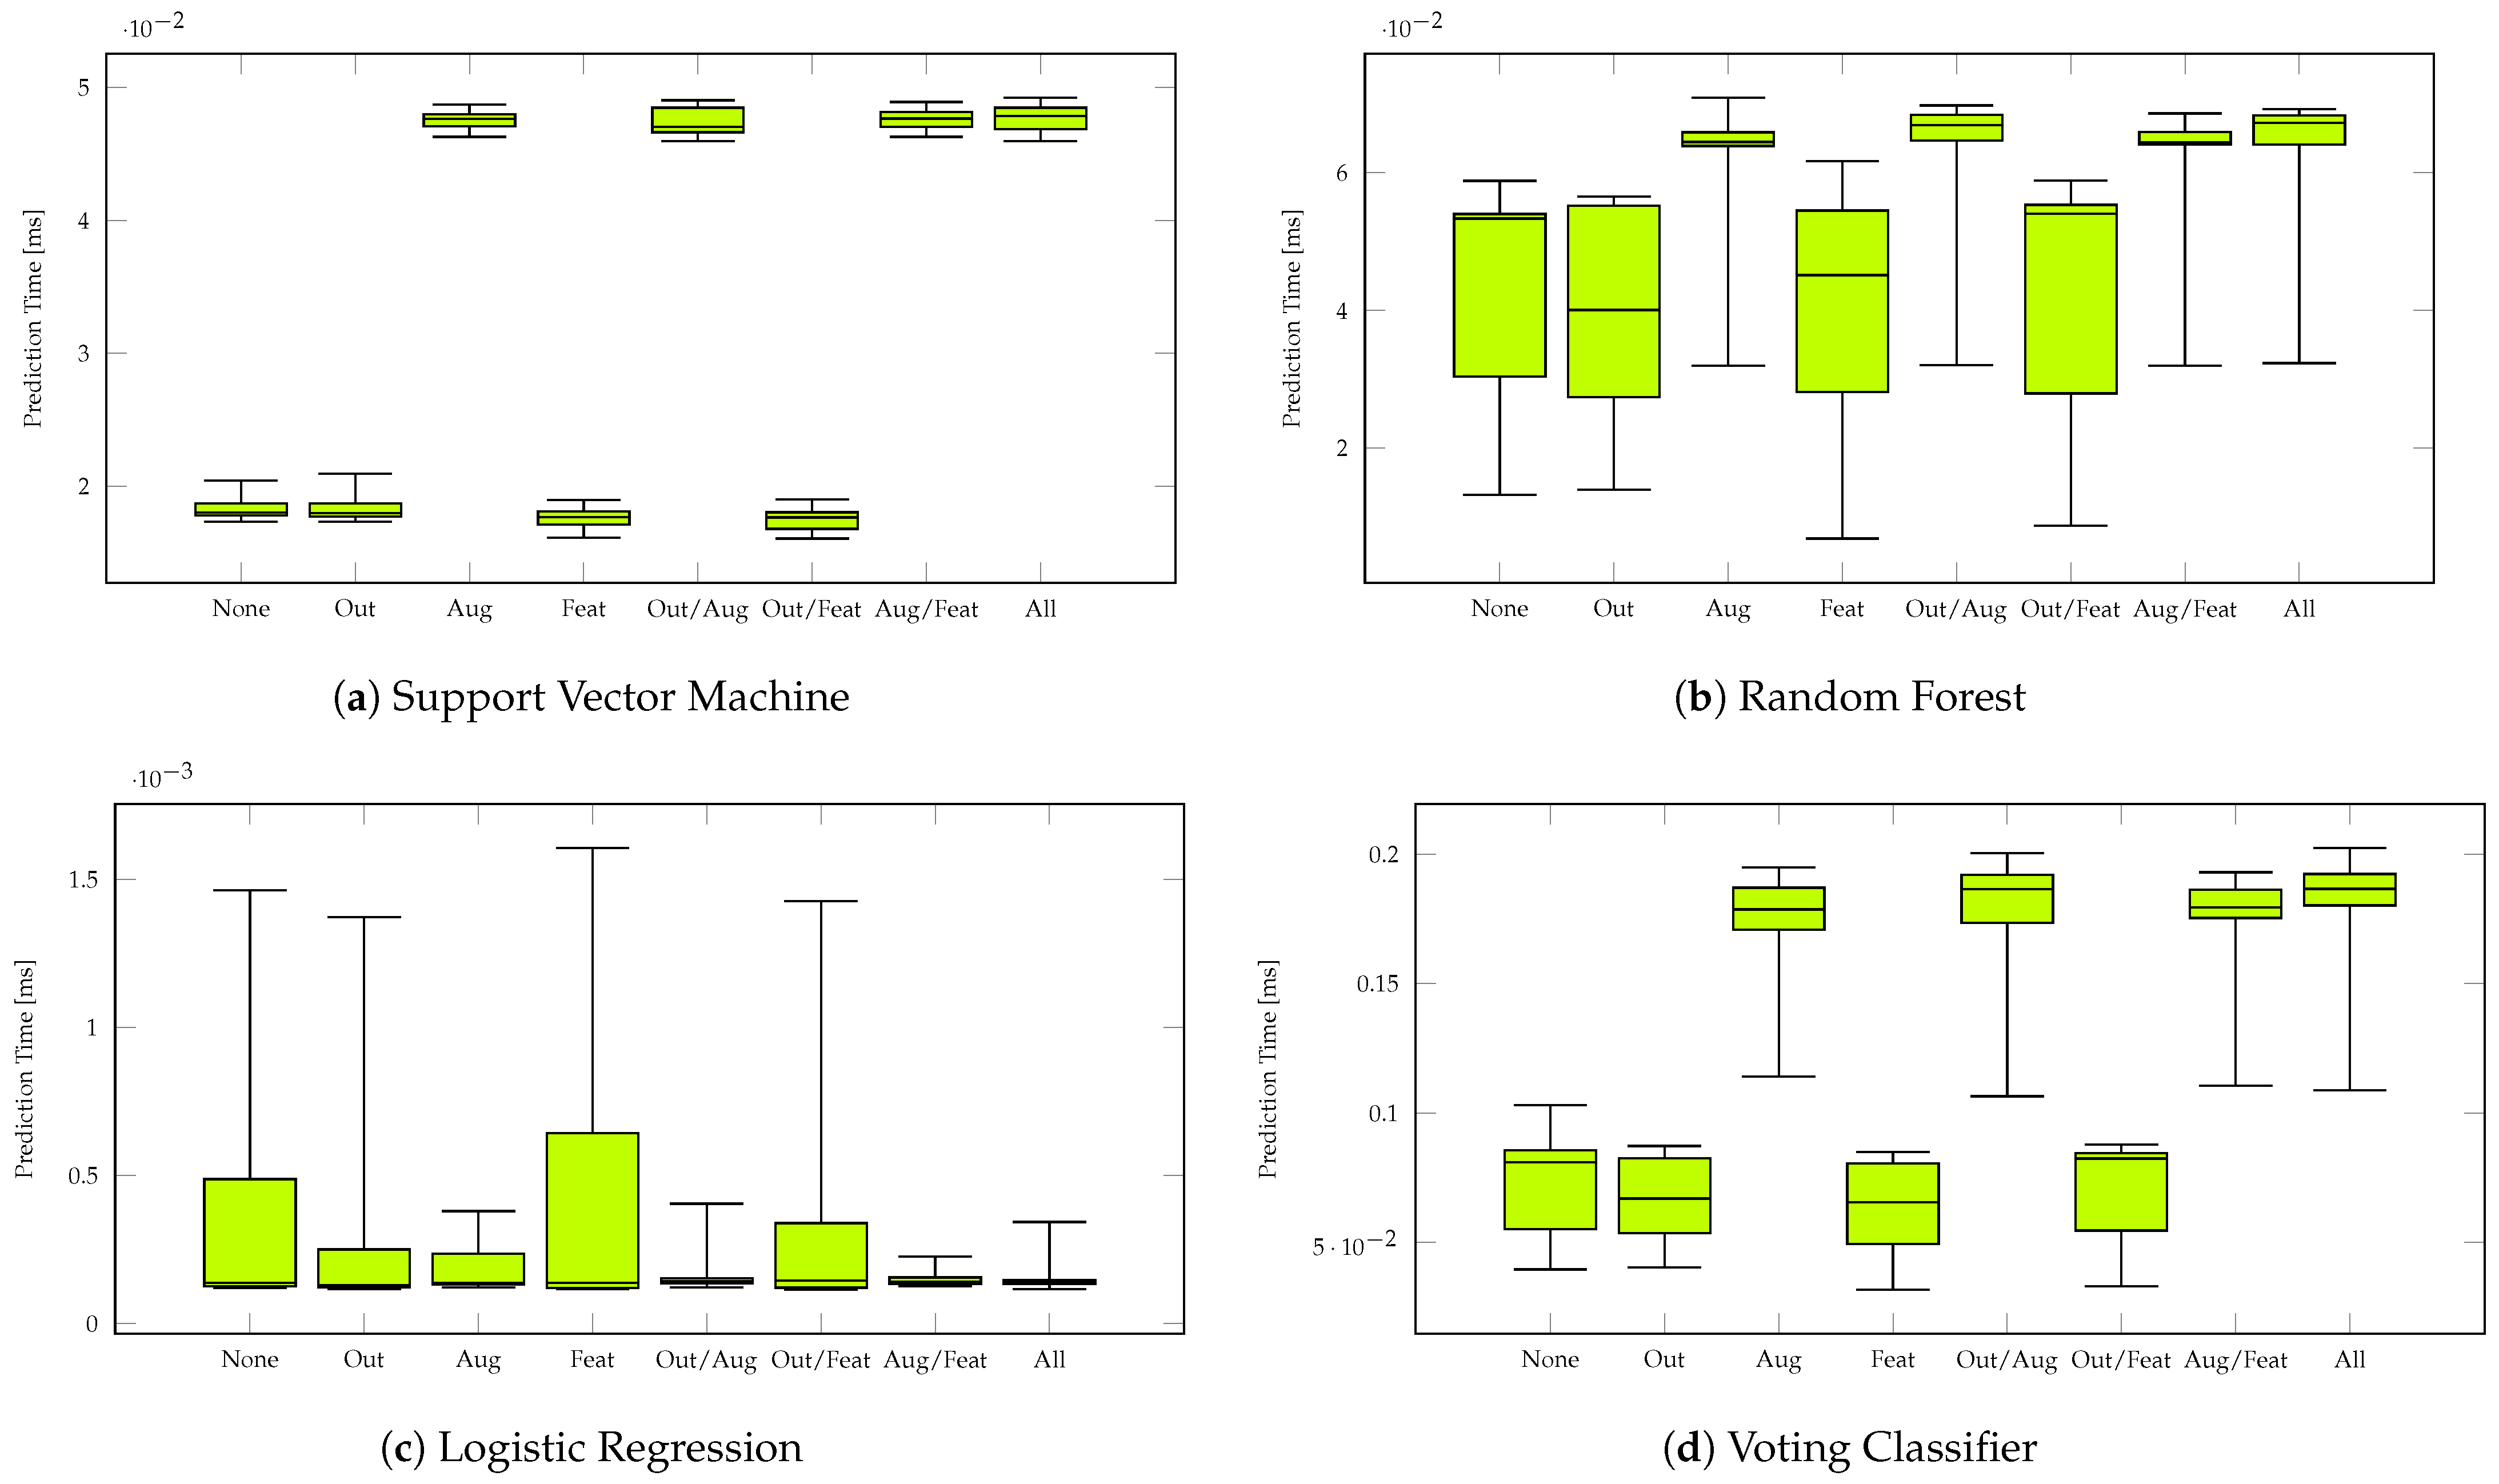
Figure A1,
Figure A2,
Figure A3 and
Figure A4 show the plotted metrics of the classifiers with different data preprocessing steps. The black lines mark the range where the metrics of each run can be found (maximum, mean, and minimum). The colored boxes represent the values of the first through third quartiles. Thus, inside a box there are 50% of the determined values from each of the 20 runs.
Independent of the data preprocessing methods used, 27 hand shapes can be classified with an accuracy of to and 56 hand shapes score to . In both cases, LR performs worst on average. For 27 hand shapes, VL2 can achieve the highest average accuracy values; for 56 hand shapes, RF performs best. Regardless of the number of hand shapes, there are only 0.51 to 2.53 percentage points between the best and worst feature combinations for each classifier, with the range varying significantly more for 56 hand shapes.
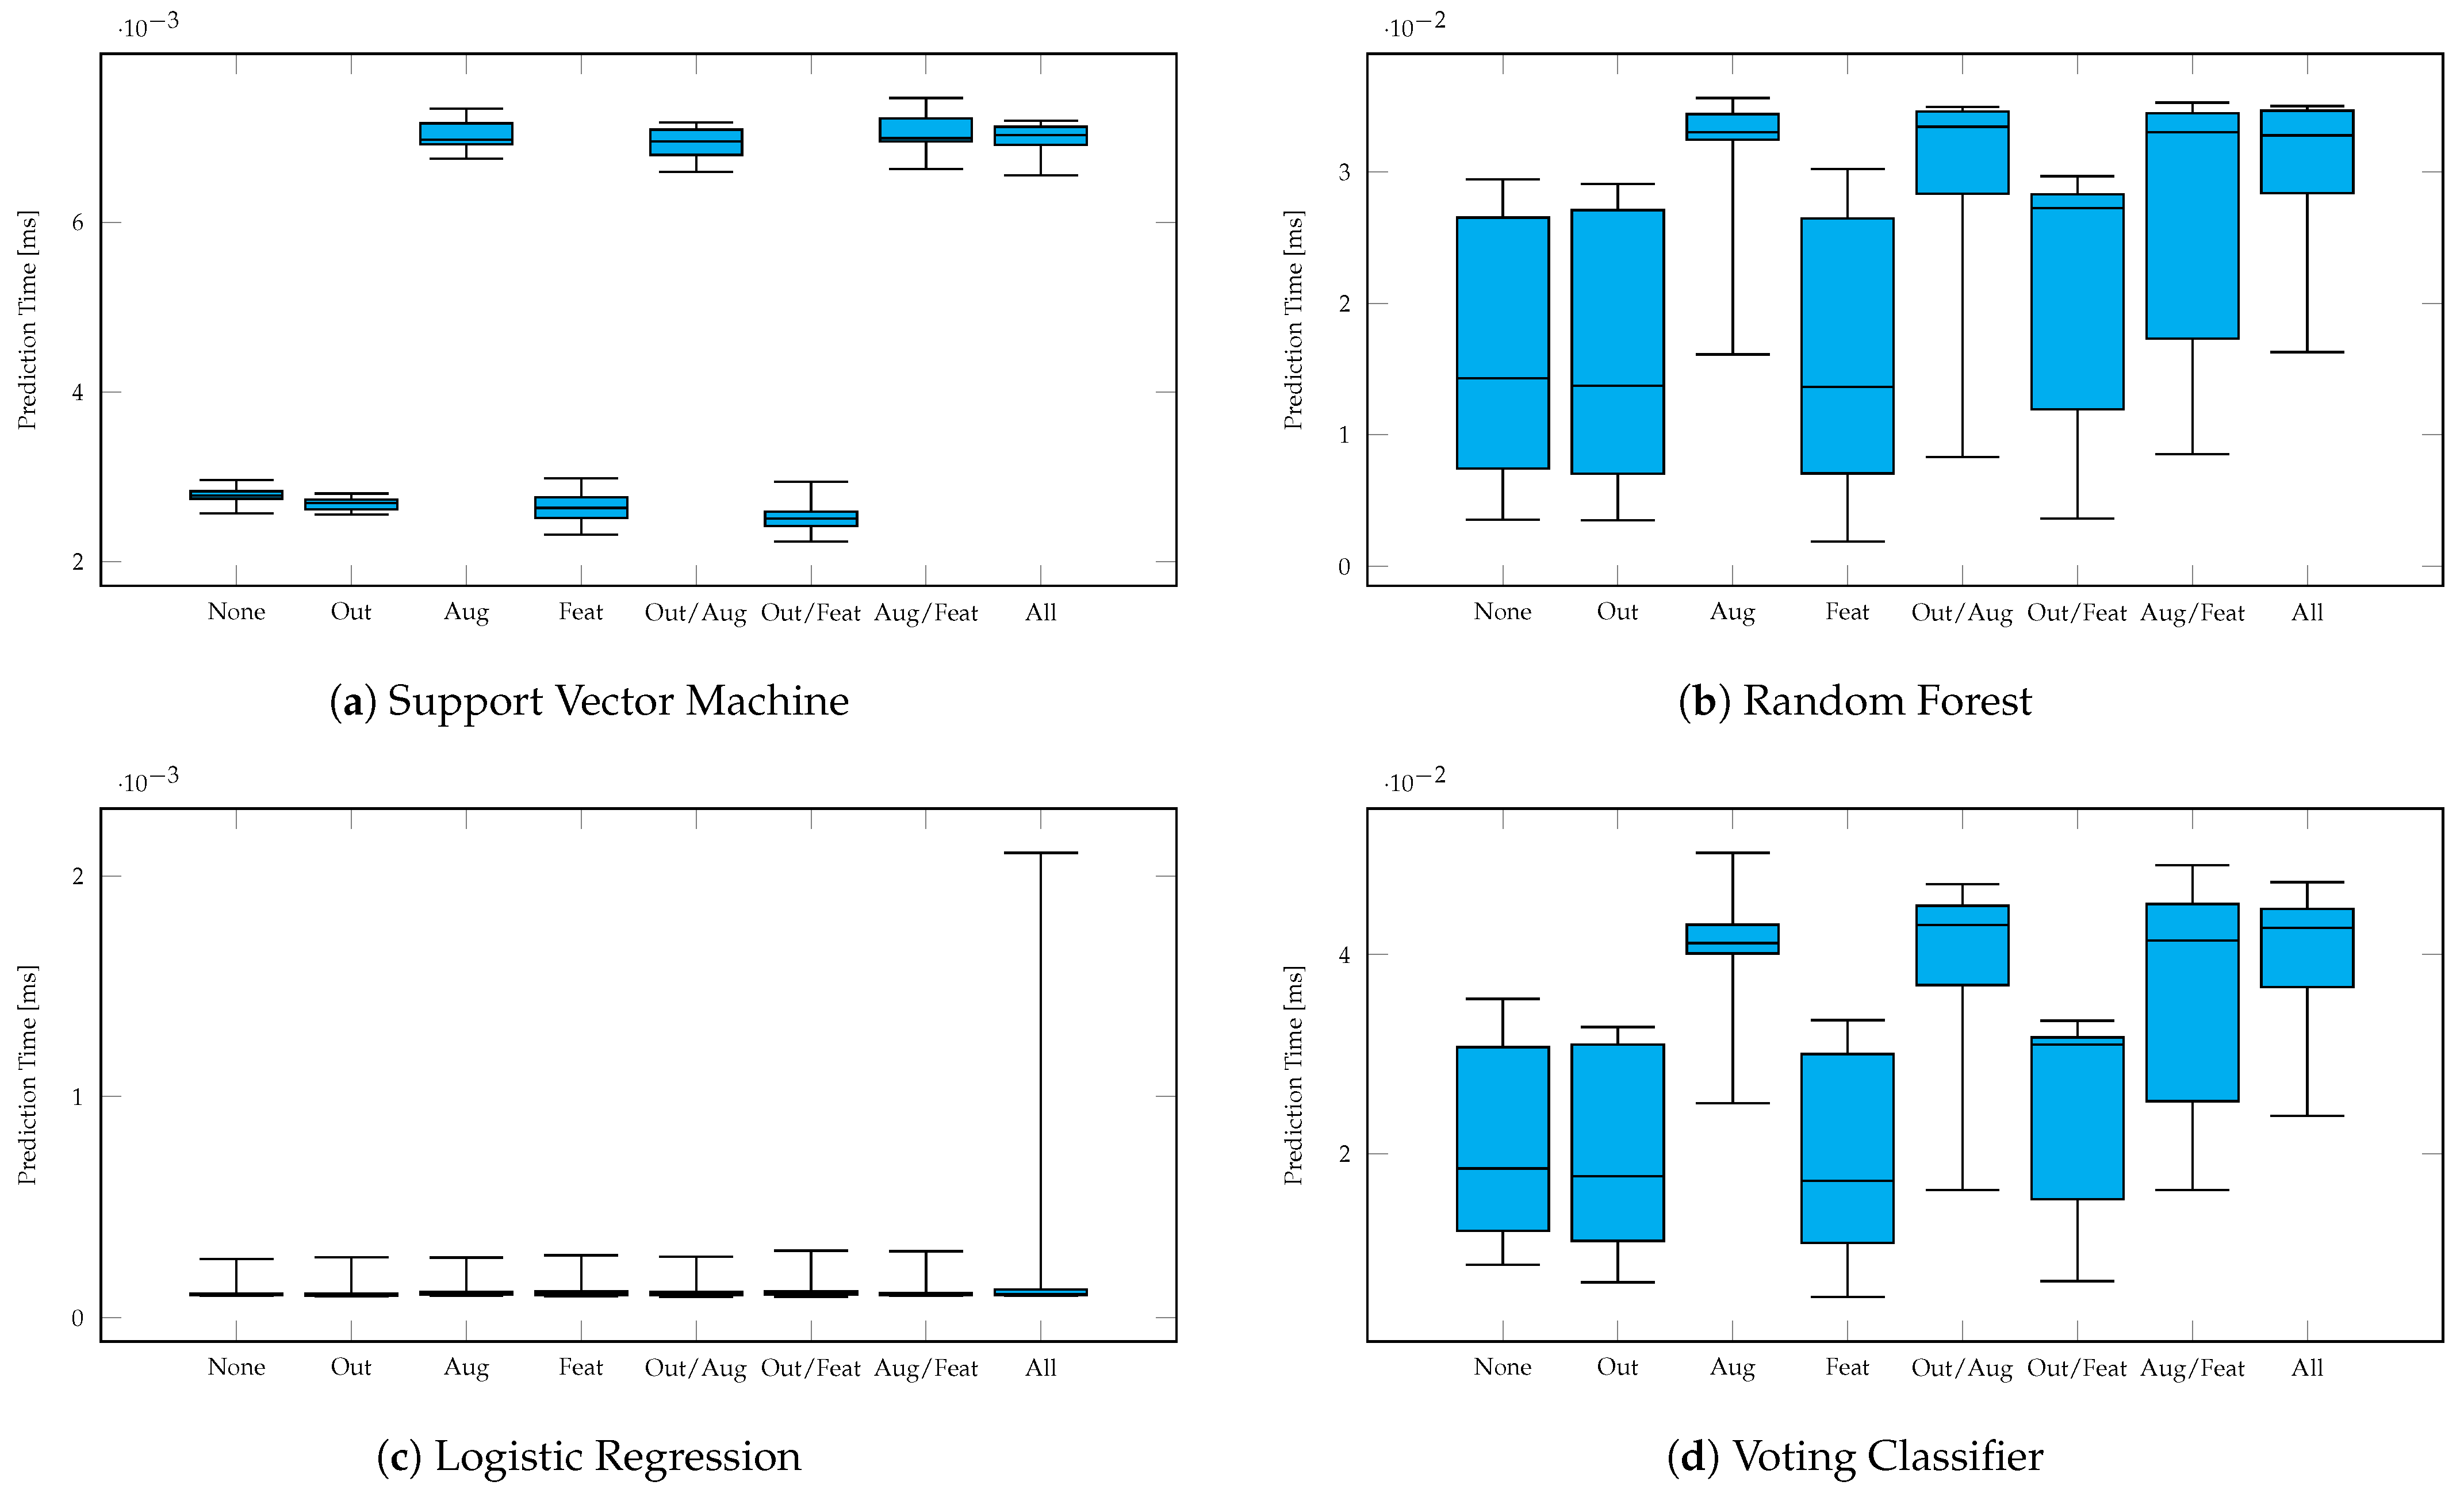
The classification time is the time difference immediately before and after calling the classifiers’
predict (
https://scikit-learn.org/stable/developers/develop.html (last visited 28 September 2023)) function. It includes the classification of an entire user data set, i.e., up to 168 samples (up to 56 hand shapes with three repetitions) before
outlier detection. In the case of the VL2 classifier, the classification times of the first layer classifiers are included.
Table 5 and
Table 6 show the classification times of all classifiers with respect to the data preprocessing methods used. Again, the best results are marked in green; the worst results are marked in red.
In contrast to the accuracy values, the classification times vary considerably: LR is by far the fastest classifier, with times below ms, whereas VL2 understandably takes the longest, with ms for 27 hand shapes and ms for 56 hand shapes, as it contains its own classification in addition to the three other classifiers. It is obvious that the classification times also increase sharply with the number of hand shapes. This affects LR the least (mean two-fold increase in classification time) and SVM the most (mean eight-fold increase in classification time) for the difference from 27 to 56 hand shapes. When doubling the data using data augmentation, the times also roughly double.
6.1. Machine Learning Classifier
We will now briefly look at the results of the individual ML classifiers before taking a closer look at the data preprocessing methods.
- Support vector machine (SVM)
showed a robust performance in classifying both data sets. For 27 hand shapes, SVM achieved an average accuracy of 90.46%, while for the more extensive data set with 56 hand shapes, the accuracy dropped slightly to 85.46%. These results suggest a marginal decline in SVM’s efficacy with increasing data complexity.
In terms of classification time, SVM took between ms and ms to classify the smaller data set and ms to classify the larger one, indicating good scalability.
- Random forest (RF)
offers comparable accuracy to SVM, with an average of 90.52% for 27 hand shapes and 86.79% for 56 hand shapes. However, the longer classification times ( ms for 27 hand shapes and ms for 56 hand shapes) could be a disadvantage in practical applications.
- Logistic regression (LR)
showed slightly lower accuracy, especially for the larger data set (average 89.58% for 27 hand shapes vs. 84.19% for 56 hand shapes). It can be seen that LR suffers a significant loss of accuracy () when data augmentation is applied to a larger data set. When looking at the learning curves in Figure 10c, it can also be seen that the accuracy decreases as the number of samples increases. It therefore appears that LR has problems with scalability.
Classification times were the shortest among all classifiers tested, which could make LR an attractive choice for very time-constrained applications, as long as the amount of data is not too high. Regardless of the number of classes, the classification times are below
ms, but are also the most dependent on processor runtime fluctuations due to these short runtimes. This can also be well-recognized in
Figure A3c and
Figure A4c. Therefore, comparisons of the classification time for LR should be treated with caution.
- Voting meta-classifier (VL2)
consistently achieved the highest average accuracy in both data sets (91.50% for 27 hand shapes and 86.59% for 56 hand shapes), if the results for procedures with data augmentation in the larger data set were omitted. It seems that the poor scalability of LR affects the accuracy of VL2.
Classification times were also the longest ( ms for 27 hand shapes and ms for 56 hand shapes), which may limit its practical applicability in time-critical environments, because it contains all other classifiers in the first layer and additionally its own meta-classification takes place in the second layer.
Figure 7.
Learning curves with (dashed line) and without (solid line) data augmentation for 27 hand shapes.
Figure 7.
Learning curves with (dashed line) and without (solid line) data augmentation for 27 hand shapes.
6.2. Data Preprocessing Methods
Considering the results with respect to the selected data preprocessing methods, it can be said that, with few exceptions, the highest accuracy values are achieved without data preprocessing (except scaling). Occasionally, some combinations of data preprocessing steps and classifiers (e.g., LR with feature selection and data augmentation for 56 hand shapes) can achieve higher accuracy values, but since the differences are minimal and no real pattern can be recognized, these exceptions are probably due to the choice of hyperparameters. Only VL2 with outlier detection shows better accuracy for both 27 and 56 hand shapes compared to VL2 without data preprocessing.
According to
Figure A2, the data preprocessing methods for 56 hand shapes and SVM almost all have the same mean, whereas the greatest fluctuations occur for LR. There, the approaches with
data augmentation are significantly worse than without. For 27 hand shapes (see
Figure A1), the fluctuations are lower for all classifiers.
We tested 64 different configurations of data preprocessing (see
Table 3 and
Table 4). Eight configurations used no data preprocessing, while fifty-six used a combination of the methods described so far. Our tests have shown that only seven of these combinations perform better in terms of accuracy than the runs without data preprocessing.
Feature selection, outlier detection, and the combination of both lead to improvements in classification times in most cases. The times for LR are difficult to evaluate here, as they are very low and are therefore strongly influenced by runtime fluctuations. Data augmentation roughly doubles the classification time when doubling the data.
6.2.1. Outlier Detection
Regarding the outlier detection, we found that detecting only very few outliers yielded the best results. Consequently, we set the the maximal distance one point is allowed to have to the closest point within the cluster to one standard deviation per feature on average. With 20 features, this resulted in an eps value of 4.4. The minPoints parameter was set to 51, as there were a total of 57 samples for each gesture in the training set and we figured that at least 90% of the data should be inliers. These parameters resulted in an average of 3.25 out 1539 samples being considered outliers in the 27-gesture data set. For 56 gestures, an average of 5.8 outliers were found in 3192 samples.
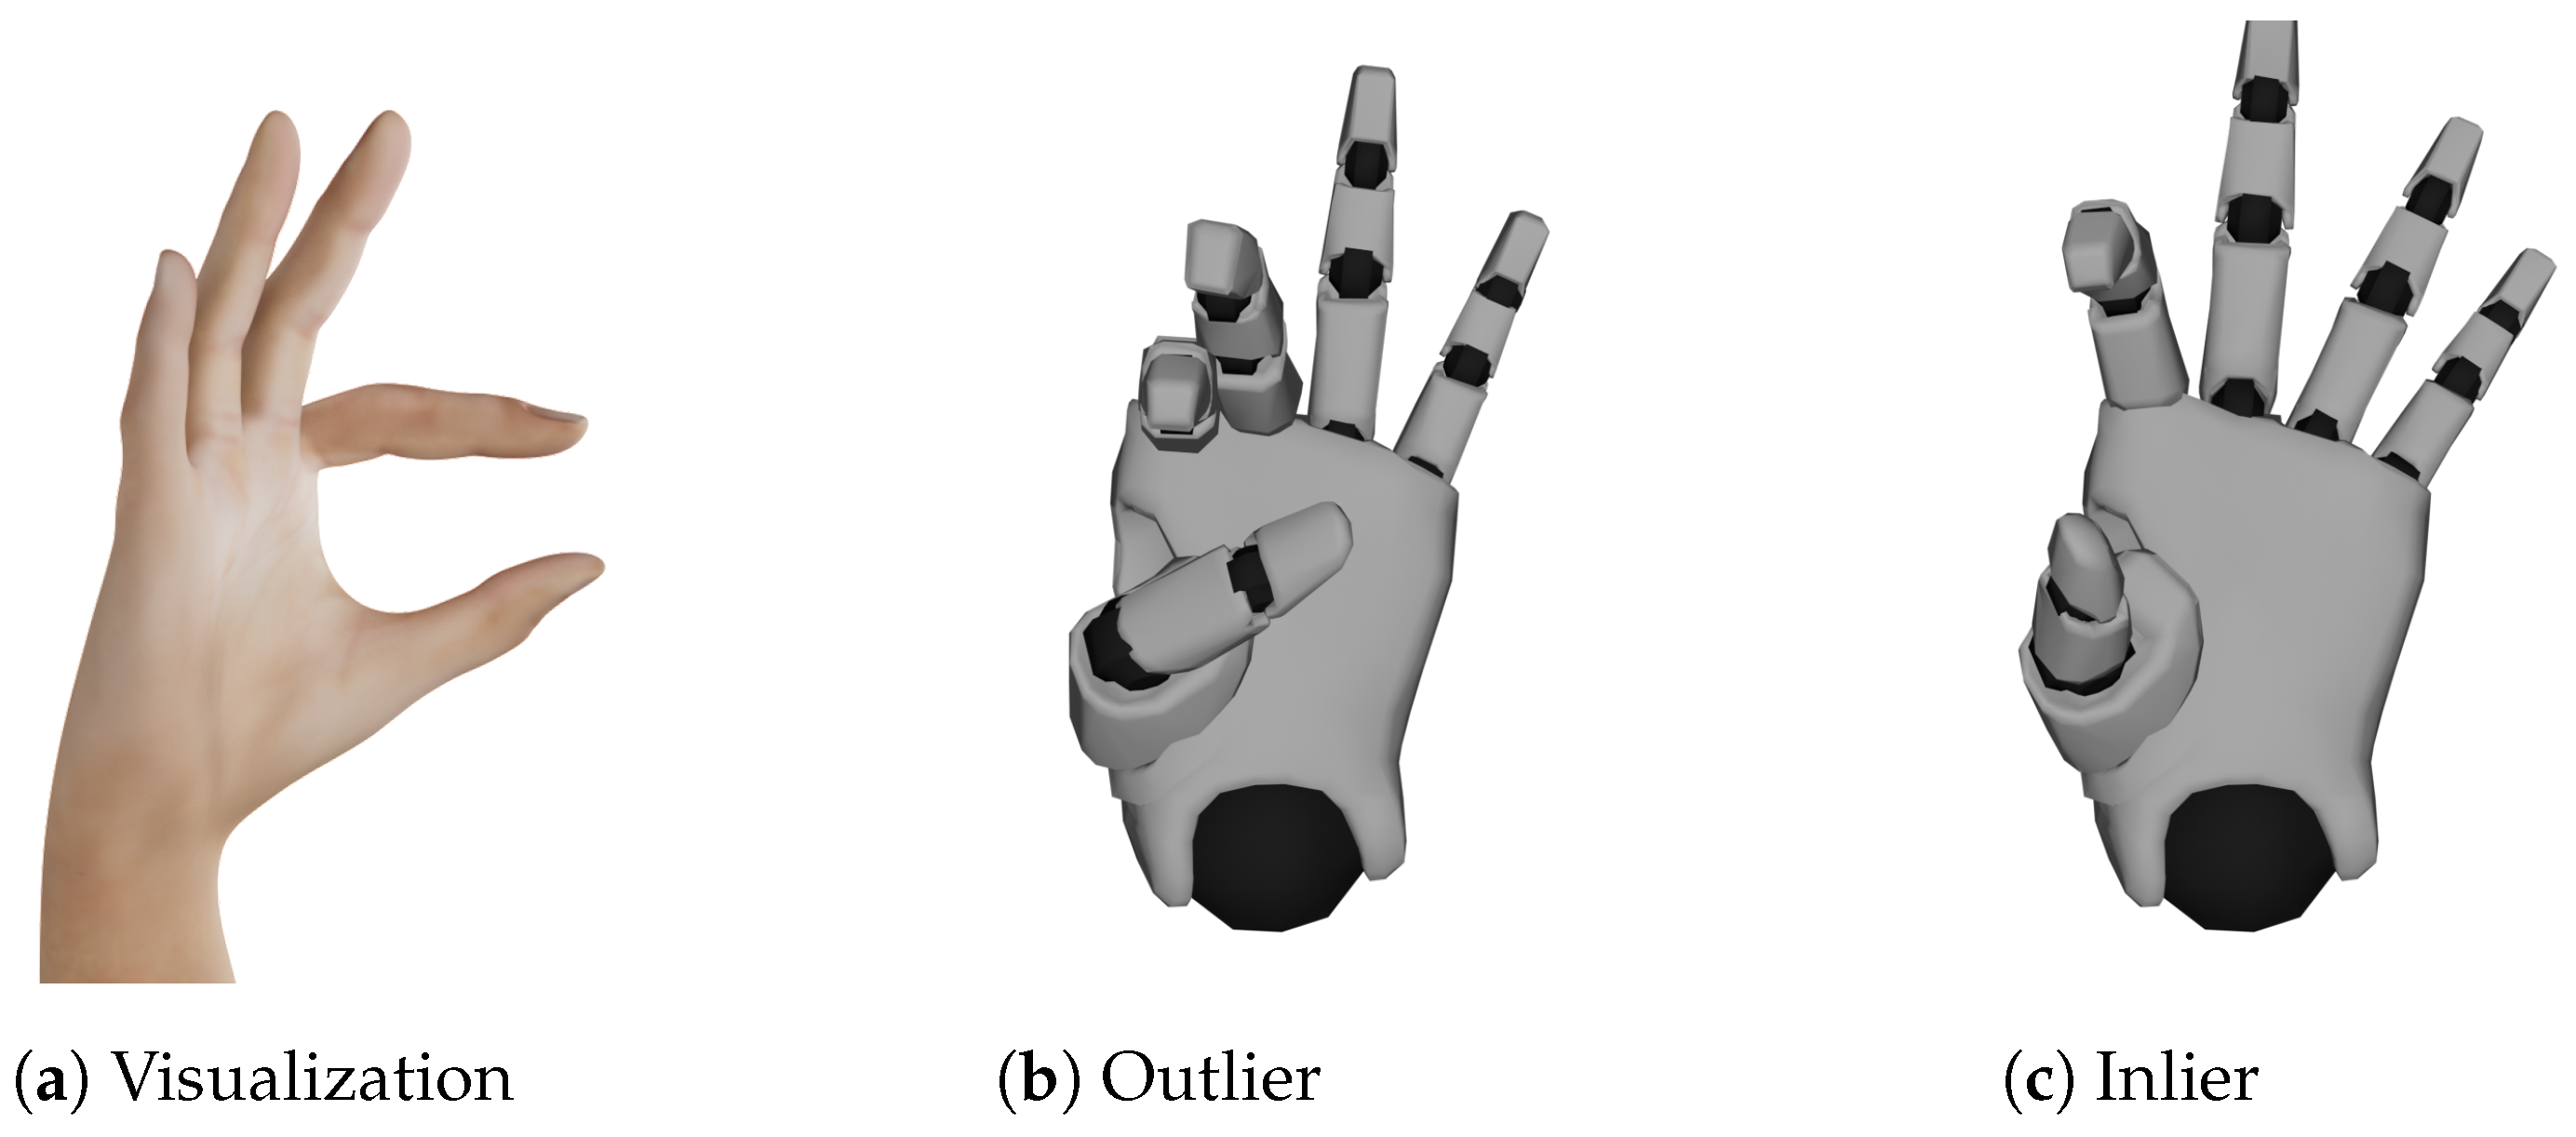
One example of an outlier alongside an inlier and the visualization of the gesture
Open F can be seen in
Figure 8. The outlier was created by bending the thumb and middle finger too much.
About 0.78% of all samples were identified as outliers, which slightly improved the performance in three of eight cases, as shown in
Table 3 and
Table 4. More importantly, the classification time improved in six out of eight cases, as seen in
Table 5 and
Table 6. This leads to a recommendation to use
outlier detection in time-critical applications.
6.2.2. Data Augmentation
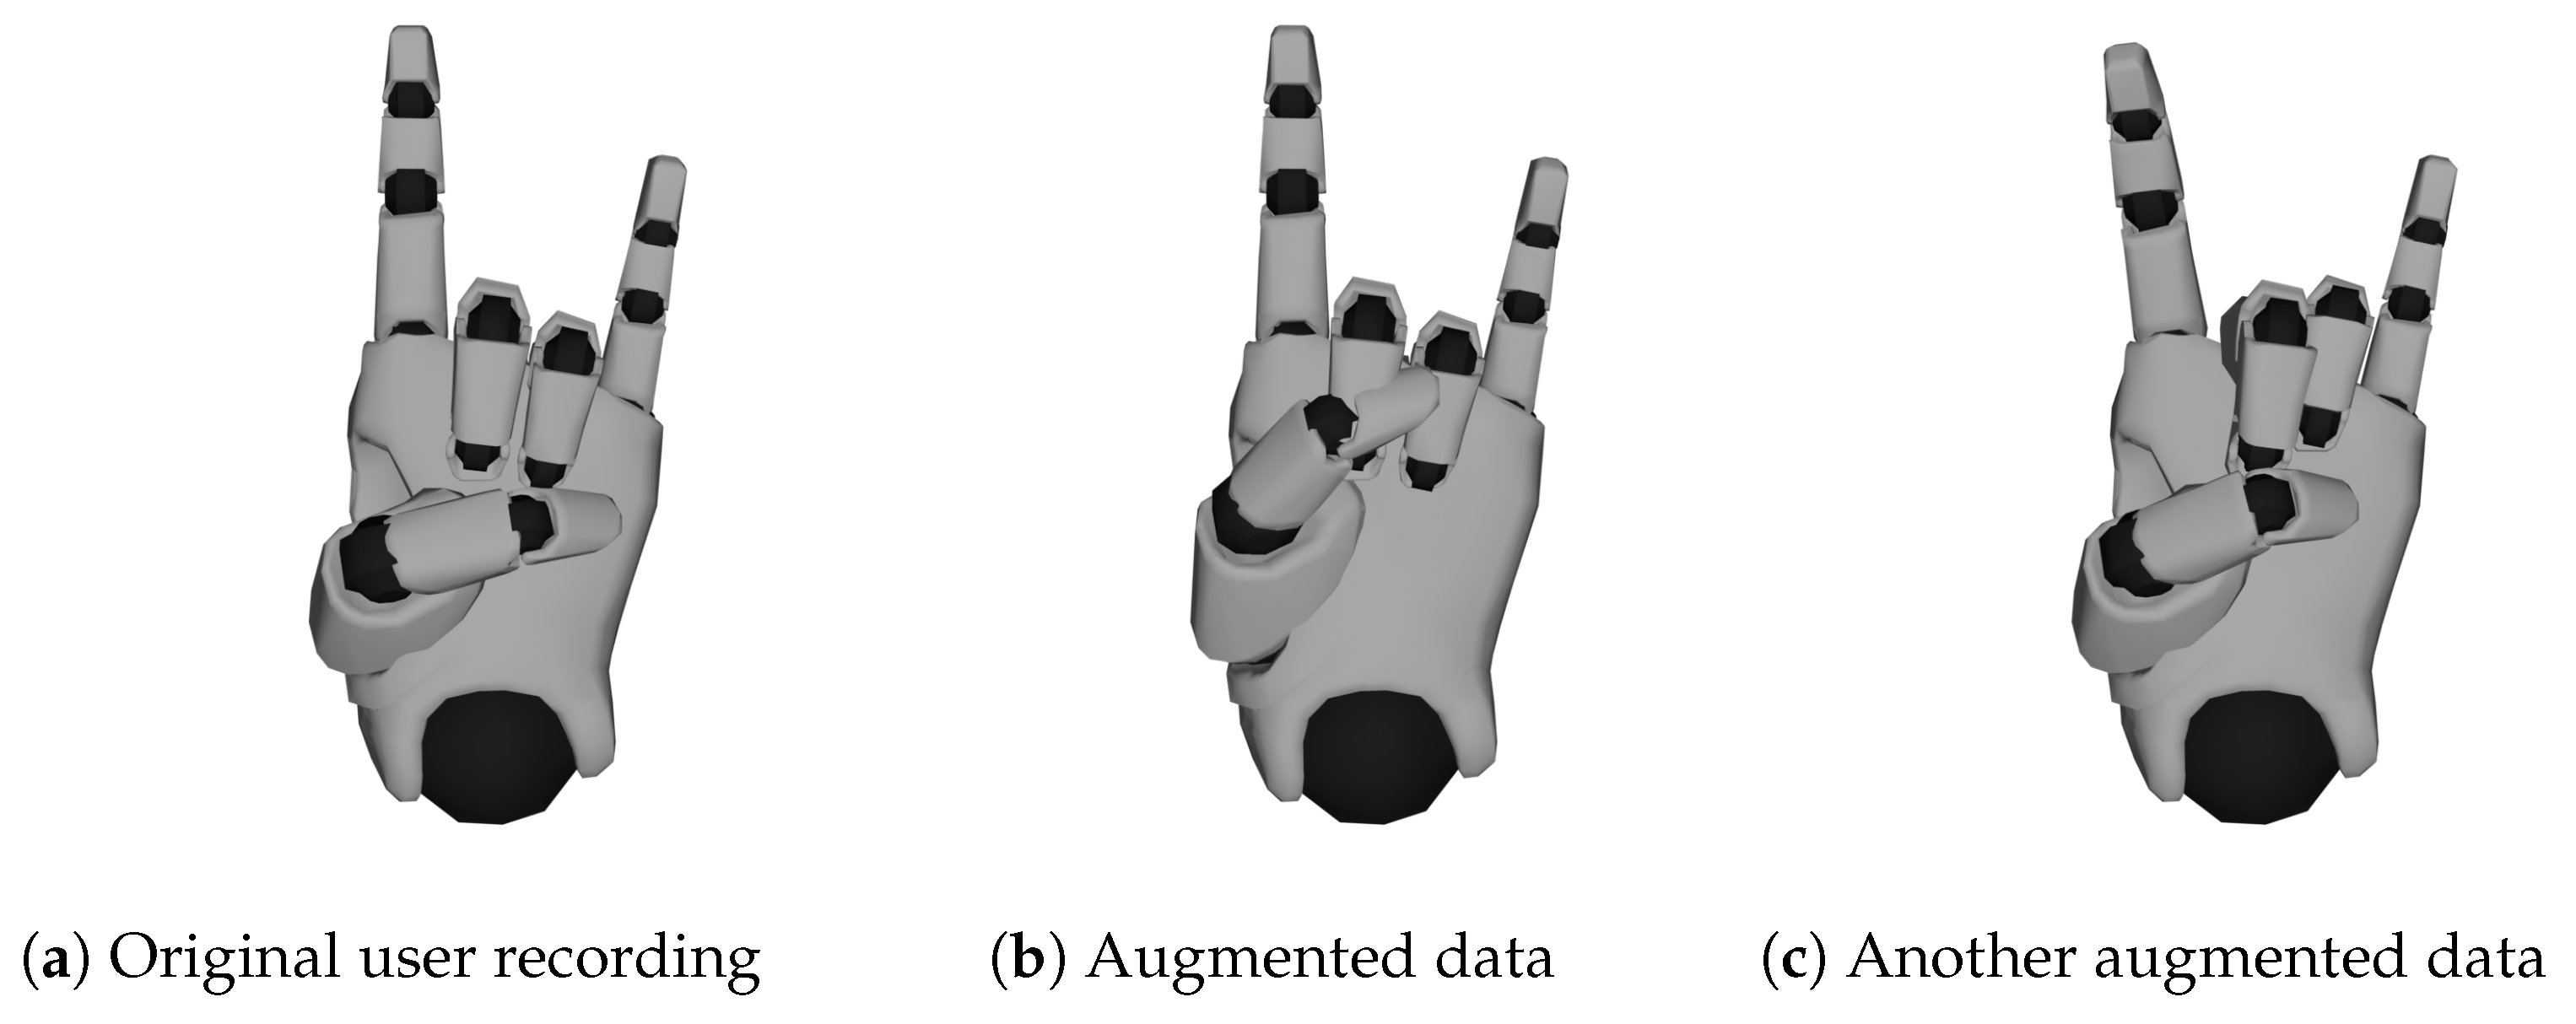
The effect of the applied
data augmentation method can best be seen in
Figure 9, where the result is visualized. Here, two synthetically generated hand shapes for the
Horns label are shown as an example, along with an original sample for comparison. As can be seen, new data samples can be successfully generated and show some variations in the way the hand shape is performed. Overall, we doubled our training data set using this technique.
As can seen in
Table 3 and
Table 4, the experimental application of
data augmentation failed to improve the accuracy further, especially with the larger data set. The reason could be that the collected data are sufficient for the chosen classifiers and, therefore, do not further improve the classification accuracy. As the number of data samples increases, the classification time also increases. To evaluate whether better generalizability can be achieved with
data augmentation, we created and compared learning curves: We plotted the accuracy obtained without
data augmentation as a function of the number of participants, i.e., the number and variety of available training data, and compared it with the results when
data augmentation is applied.
Figure 7 and
Figure 10 show these learning curves. When the data are not augmented, the curves already show a good fit, with the accuracy on the test set increasing steadily with the number of participants. The
generalization gap, i.e., the gap between the two curves, is also clearly visible. Just LR shows a significant decrease in training accuracy as the number of data increases (whether due to a larger data set or the use of
data augmention).
Figure 10.
Learning curves with (dashed line) and without (solid line) data augmentation for 56 hand shapes.
Figure 10.
Learning curves with (dashed line) and without (solid line) data augmentation for 56 hand shapes.
The generalizability can therefore not be increased by augmenting the data, as they already have a high generalizability, with the exception of LR.
Overall, we were able to successfully generate valid synthetic data samples to enrich our training set. For the reasons stated above, the application of the
data augmentation method is altogether not worth applying in this context and for this type of data. As mentioned in
Section 3.2, research on
data augmentation for wearable sensors has mainly been studied in a dynamic context, where models trained with this more complex type of data benefit more from artificial augmentation of the data set. The application of
data augmentation would, therefore, be more effective for dynamic gestures and would probably achieve a better effect on accuracy in the area of
deep learning, as these methods perform significantly better with a large amount of data than the traditional ML methods [
34].
6.2.3. Feature Selection
Feature selection was used for data preprocessing in a total of four configurations. When applied to both data sets with 20 runs per experiment, we obtained 160 executions. The amount of times each feature was discarded by the algorithm can be seen in
Table 7. There were no features discarded in 50 out of 160 runs. The maximum number of discarded features was six (five times in 160 runs). On average, 2.069 features were discarded per run.
According to
Table 7, the thumb, index finger, and middle finger seem to be the most important for classification. For example, no thumb stretch features were discarded at all, but the thumb spread feature was discarded more than every fourth time. Features of the index finger were discarded the least, and when they were, only the values of the upper extremities (DIP and PIP stretch features). For the middle finger, each of the four features was discarded at least three times, but the total number of discarded features is lower than for the thumb. The ring and little finger seem to contribute the least amount of information needed to classify gestures, as their features were discarded most often.
It is important to note that the stretch metacarpophalangeal (MCP) value was always preserved for almost all fingers, while the PIP and DIP values were frequently discarded. In most cases, only one of the latter two joints was discarded, while the other was kept for classification. After investigation this phenomenon further, we noticed that these two joints are rarely moved individually. For most gestures, both joints are flexed to about the same degree. Looking at our data, we also noticed that the value of these two joints is often exactly the same, explaining why one of these two joints for each finger was discarded by our feature selection so often. Anatomically, it is not possible to move the upper phalanx (= DIP) independently of the middle phalanx (= PIP) without external influence [
9]. This dependence explains why so many values are filtered out here.
Another noteworthy observation is that the ring finger spread value was the most frequently discarded feature and was discarded in more than 40% of all runs. This is likely due to the ring finger barely moving along this axis in most gestures. For example, when spreading your fingers, the ring finger barely moves, while the spread value of all other fingers changes significantly. As the ring finger mainly has a supporting function, its mobility is limited compared to the other fingers. In most cases, the ring finger is used together with its neighboring fingers and therefore exhibits a strong dependence on them. This dependency was obviously recognized by our feature selection.
Overall, it can be said that feature selection was able to achieve an improvement in classification time with a slight decrease in accuracy. On the other hand, we were able to prove that feature selection comprehensibly identified and filtered dependent values. The approach would probably bring even more time advantages if more than 20 features were used for classification.
7. Discussion
In this study, we evaluated the efficacy of various ML classifiers and data preprocessing techniques in recognizing hand shapes of ASL. Our focus was not only on achieving high accuracy but also on ensuring real-time applicability. The choice of the most suitable classifier and preprocessing method requires a careful consideration of both accuracy and classification time. The training time is not relevant for our purposes, since the training is performed offline and is not time-critical.
7.1. Key Findings
- Accuracy vs. Classification Time Trade-off:
VL2 achieved the highest accuracy, but was also the slowest, making its use in real-time applications a careful consideration. In contrast, LR offered the best speed but lowest accuracy ( percentage points less than VL2). RF and SVM are somewhere in between.
- Impact of Data Preprocessing:
Data preprocessing techniques such as feature selection and outlier detection improved the efficiency of classifiers in terms of classification time, but often at the cost of a slight decrease in accuracy. The particular benefit of data augmentation could not be proven; instead, it provided poorer accuracy values and higher classification times.
7.2. Optimal Classifier for Real-Time Application
In general, the accuracy values achieved are at a comparable level for all classifiers. Since VL2 can almost exclusively achieve the highest accuracy values by combining the advantages of the other classifiers, it is very suitable for our purpose. The high classification time is slightly relativized when considering that in a real-time scenario usually only one hand shape has to be recognized at a time. In our case, the classification time was given for the classification of 82 and 168 hand shapes, respectively, before applying outlier detection.
VL2 achieves an average classification time of ms for 27 hand shapes and ms for 56 hand shapes for data preprocessing without data augmentation. If we assume an approximately proportional ratio of classification time to the number of data to be classified, this results in a classification time of approximately ms or ms for a single hand shape to be classified. Theoretically, classification rates of over kHz would be possible, i.e., far more than the 90 Hz sampling rate supported by the data glove used in this study. It can therefore be assumed that a high classification rate for single hand shapes can be achieved even when using hardware that does not perform as well as what we had available.
Regarding data preprocessing, the use of outlier detection is recommended, as this leads to improvements, especially in classification times and, when used with VL2, in accuracy. Feature selection brought slight improvements in classification time, but these advantages do not add up to those of outlier detection, which is why it does not necessarily make sense to use both methods at the same time. The experimental data augmentation approach showed no improvements.
Overall, we therefore consider the use of VL2 in conjunction with outlier detection to be the most useful for our purpose.
7.3. Limitations of Classification
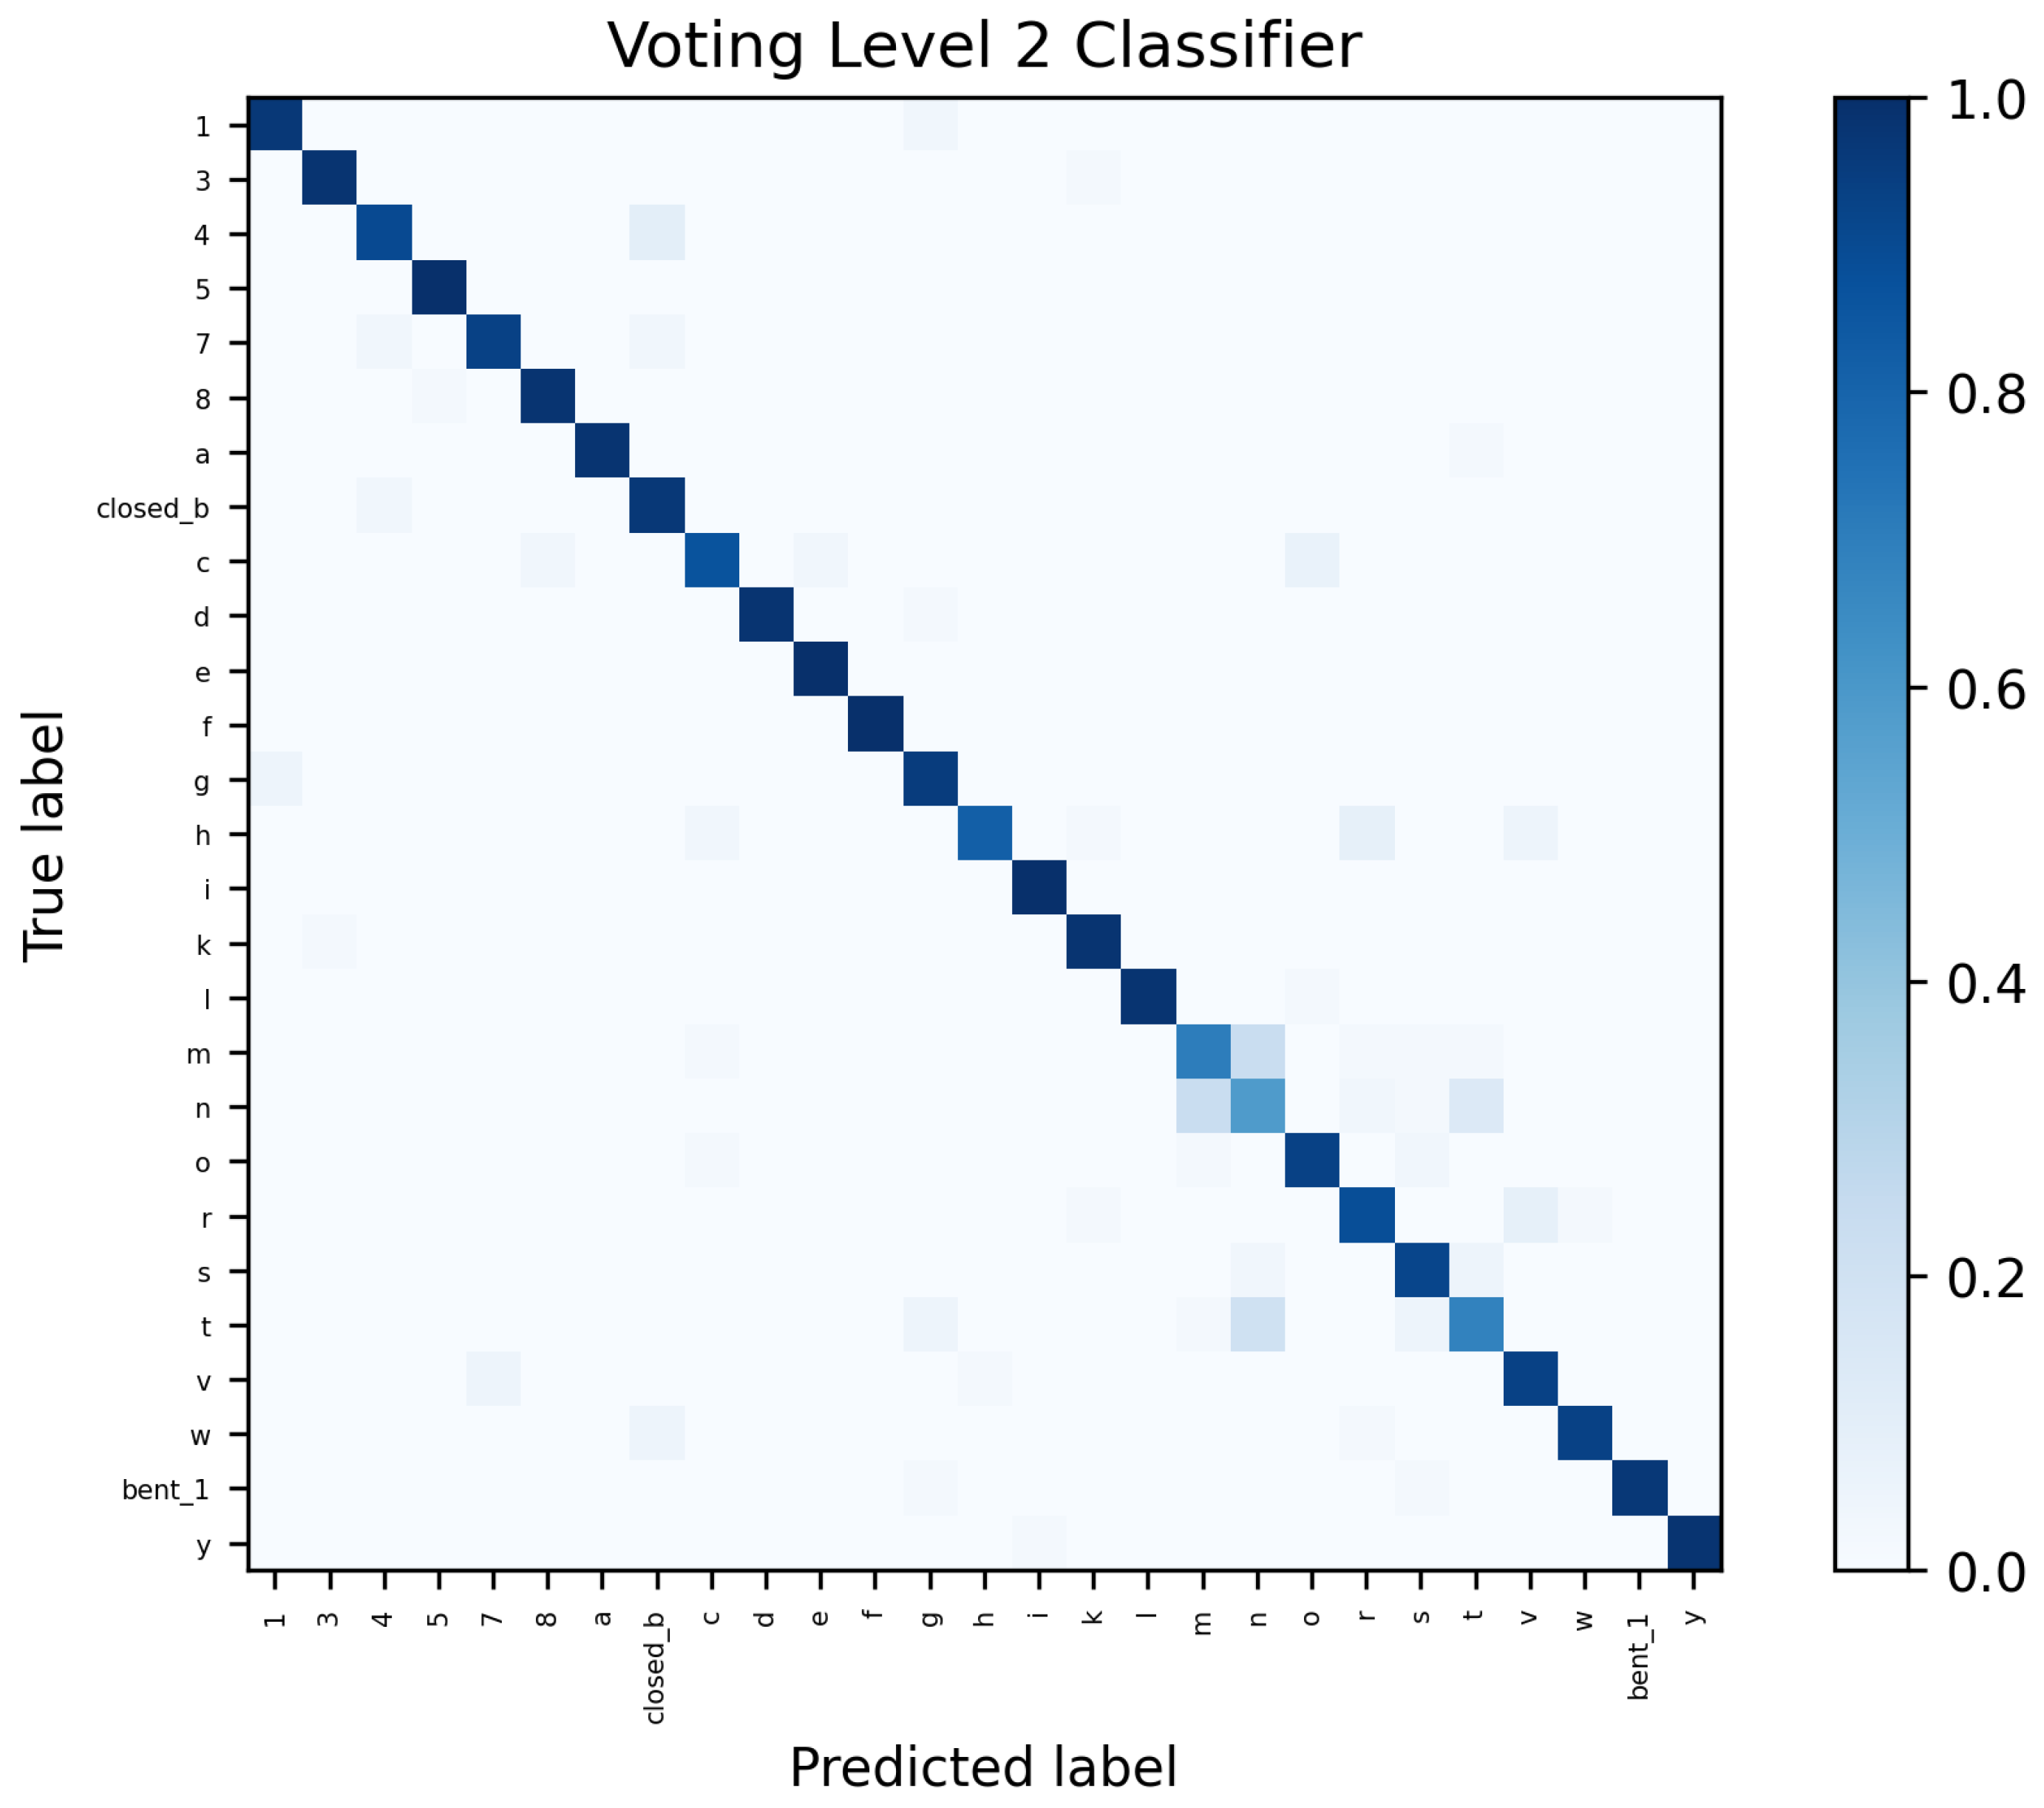
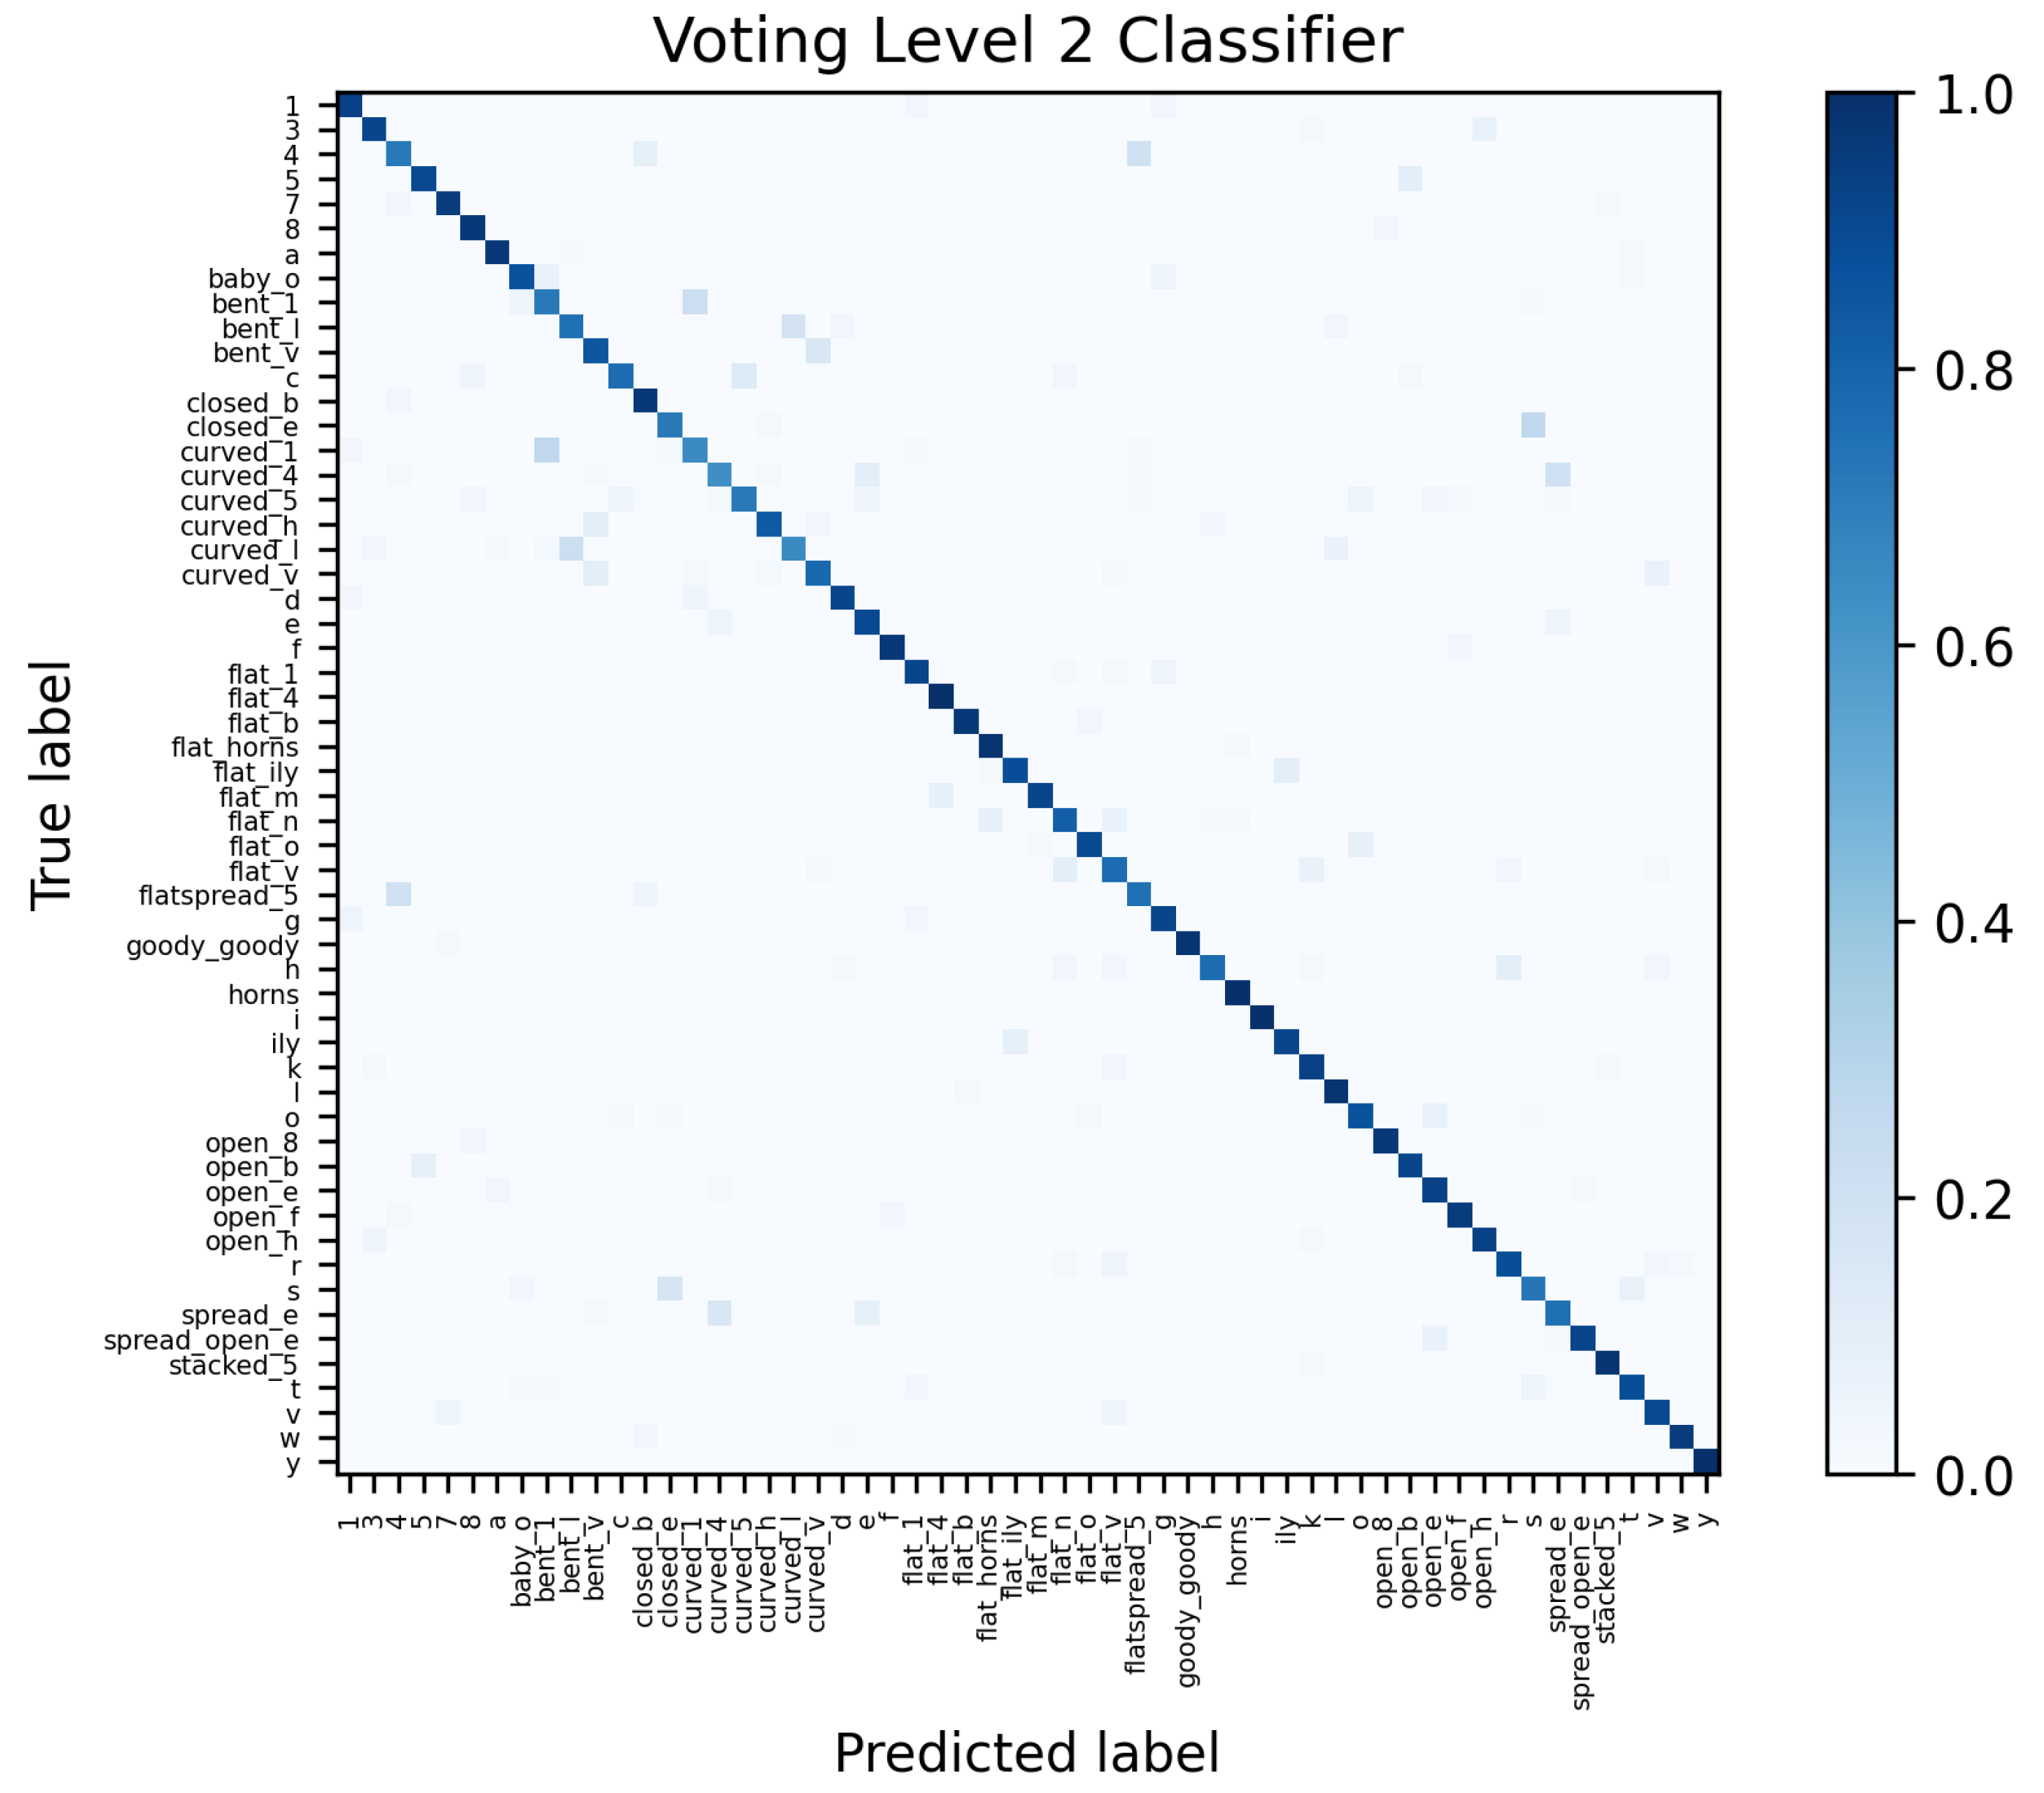
Looking at the confusions within the classification (see
Table 8 and
Table 9), the types of hand shapes for which there are difficulties in classification can be seen. The data acquisition was supervised, i.e., whether the hand shapes were correctly executed was monitored during the recording. The listed errors are therefore mainly due to the data gloves or the classification methods.
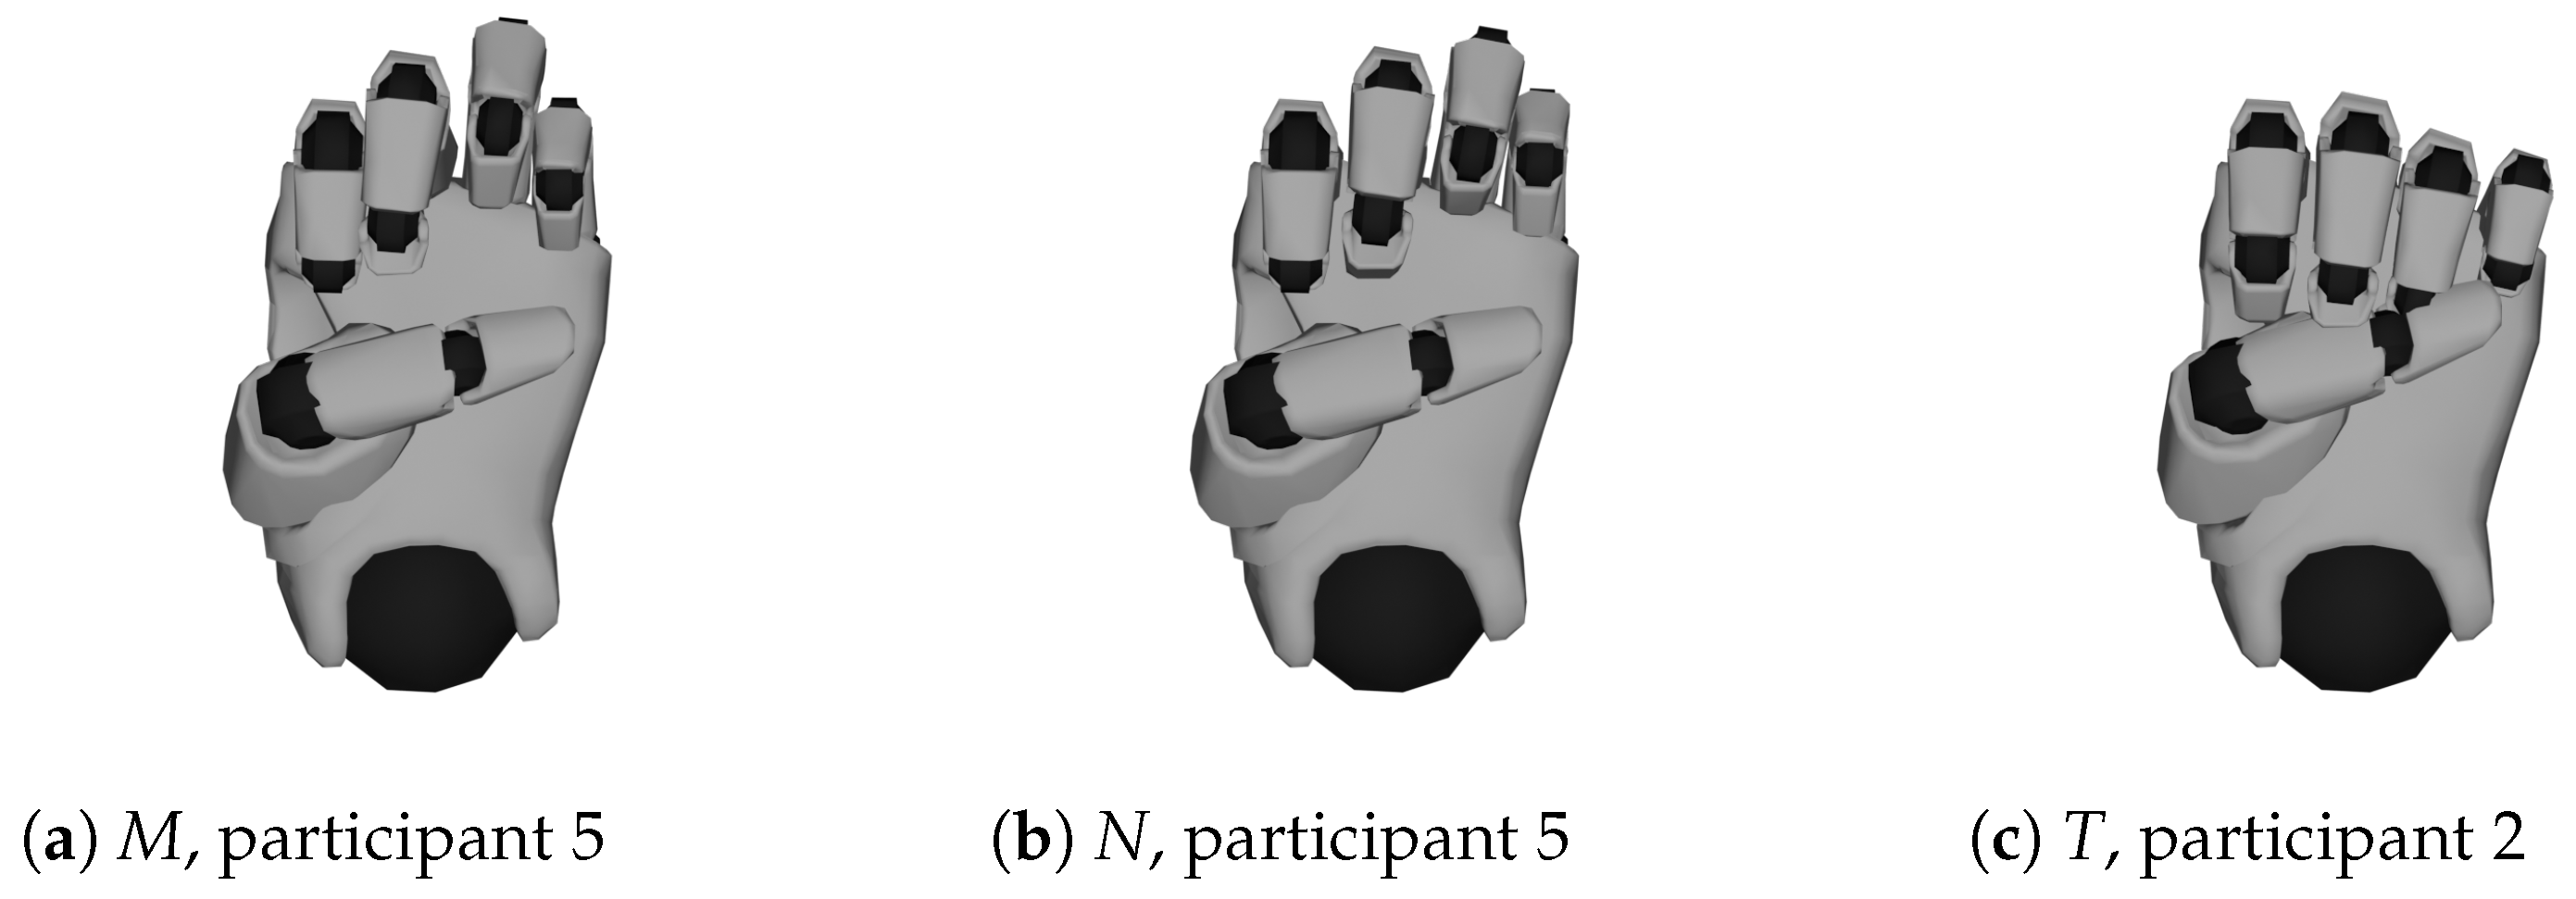
- Thumb Position:
There are particular difficulties with the hand shapes M, N, and T, where a fist is formed and the thumb crosses a certain number of fingers below. Looking beyond the top 10, it can be seen that S is also often interchanged with the hand shapes just mentioned, because here the hand also forms a fist, but the thumb crosses the fingers at the top (and not at the bottom). Moreover, S is confused with Closed E, where the thumb does not rest on the fingers but directly below them.
Upon closer inspection of the visualized data, it is noticeable that the position of the thumb is not recorded accurately enough by the data glove (examples can be seen in
Figure 11). This is generally a weakness of this glove and seems to be the case with other IMU-controlled gloves [
11]. Similarly, it is difficult for the glove to tell whether the thumb is on top of or underneath the crossed fingers.
The hand shapes Flat Spread 5 and 4 are also confused and differ only in the position of the thumb.
- Spread Values:
Another example where the classifiers had difficulties with recognition are the hand shapes
R,
H, and
V, already shown in
Figure 3, which differ only in the spread of the index finger and ring finger. The same applies to
4 and
Closed B.
- Stretch Values:
The classifiers also often had problems with stretch values, for example, to distinguish between curved and bent hand shapes. Even though the recording of the hand shapes was monitored, it cannot be completely ruled out that the hand shapes were all recorded uniformly, as the difference between bent and curved is sometimes marginal. Examples are Curved L⇔Bent L and Curved 1⇔Bent 1. The differences between the hand shapes Curved 4⇔Spread E and C⇔O are more significant, but there are also cases of confusion.
Figure 11.
Faulty recordings of hand shapes M, N, and T of participants 2 and 5.
Figure 11.
Faulty recordings of hand shapes M, N, and T of participants 2 and 5.
Based on our results and the visualizations shown (see
Figure 11), we were able to clarify that the limiting factor in the recognition of static hand shapes at this level of accuracy is the hardware used and not the classifiers. To achieve better results, an alternative, more accurate hardware should therefore be considered.
7.4. Comparison to Related Work
Pan et al. [
9] published a state-of-the-art paper on data gloves in 2023. They examined over 100 English-language papers from reputable publishers and created a comprehensive review that we use for comparison:
- Number of gestures:
One of their results shows that the papers validate at least three to a maximum of thirty-one hand gestures. The average for static gestures is 20 gestures. Therefore, in comparison, our paper is in the upper range or well above, with 27 and 56 static hand gestures, respectively.
- Number of participants:
For the number of participants and data recorded (samples), our study is right on the average of 20 participants and 1000 to 10,000 samples (it has 1620 and 3360 samples, and double that if the data are augmented).
- Number of classifiers:
Most papers examined between three and five classifiers; again, we are in the mean range with four classifiers examined. However, we examine eight different combinations of data preprocessing methods for each classifier.
Table 10 shows us an overview of the related studies [
9,
11,
13,
14]. Since most papers ([
10,
11,
12,
14]) report their results in a user-dependent manner, we conducted an additional experiment for this purpose. This means that a user’s data can appear in both the training and the test data. For better comparability, we therefore conducted another experiment for both data sets.
This time, randomly combined training and test data were examined in a ratio of 80 to 20. For this, we used VL2 with the already-used hyperparameter ranges and with outlier detection, as this was the most promising approach, and trained and tested them 100 times. The training and testing data were randomized again before each run.
An accuracy of 95.55% was achieved for the data set with 27 hand shapes, and 93.19% for 56 hand shapes. Looking at the other classifiers, we see that they are at a similarly high level, between 94.17% (LR) and 95.34% (RF) for 27 hand shapes and between 90.16% (LR) and 93.28% (RF) for 56 hand shapes. It should be noted here that RF can even achieve a slightly higher result than VL2 and that LR obviously scales poorly.
Comparable works, such as Pezzuoli et al.’s [
12], achieve an accuracy of up to 99.70% for 27 dynamic gestures, but also use five times as many features. These 96 features include information about hand orientation and movement.
Plawiak et al. [
10] use ten sensor values per frame to detect dynamic hand gestures, two of which are rejected using principal component analysis (PCA). They interpolate the average of 60 frames of data to 20 frames, resulting in 160 data points, which they use to classify the 22 different hand gestures. While this gives them a higher accuracy of 98.32% than us (95.92% for 27 hand shapes), they also use eight times the amount of features for classification.
Achenbach et al. [
11] achieve a higher accuracy than we do with a comparable number of gestures (25 compared to 27) and features (19 compared to 20) with 99.50%, but they can also rely on information about the orientation of the hands, which we lack.
In direct comparison with the related studies shown in
Table 10, we perform slightly worse with 27 hand shapes in terms of accuracy, but we can also rely on significantly less information, which generally has a positive effect on the classification times. With 56 hand shapes, we can distinguish more than twice as many hand shapes as the related studies and this still with a high accuracy.
8. Conclusions
In this study, the effects of different data preprocessing steps on the classification of 27 and 56 static hand shapes were investigated. The metrics considered were accuracy and classification time.
According to our research, we can recommend the VL2 classifier with outlier aetection, as it has a high accuracy with an acceptable classification time. With this setting, 91.91% (27 hand shapes) and 87.50% (56 hand shapes) accuracy could be achieved for user-independent tests, with a classification time of less than 15 ms and less than 60 ms, respectively. In user-dependent tests, as much as 95.55% and 93.28% accuracy could be achieved. Comparable studies with better accuracy values either had more information available to classify the data or were only able to distinguish significantly fewer classes. For very time-critical applications, LR with outlier detection can also be used, whose accuracy is slightly lower, but classification time is significantly higher. This recommendation is independent of the number of hand shapes to be classified.
The use of feature selection brought a slight improvement in classification times, but this is not necessarily additive to the advantages of outlier detecion. With more features, the advantages of feature selection would certainly be greater. Our approach to data augmentation was able to double the number of training data with valid data; however, no improvement in accuracy or generalizability was observed. This is certainly due to the fact that we classified static gestures, whereas related studies have pointed to noticeable improvements for dynamic gestures.
Outlook
Future work will evaluate how the data preprocessing methods would behave with dynamic data with significantly more features. Especially improvements in data augmentation and feature selection could then be expected. Data augmentation should lead to higher accuracy and better generalizability, whereas feature selection should lead to faster classification times.
In this paper, we have examined and compared some traditional classifiers in detail, so it would be exciting to know how deep-learning algorithms would perform in comparison. The development and optimization of these classifiers could be one of the main topics of the next study.
It would also be conceivable to include hand orientation in the future. This would increase the number of features from the current 20 to 24. This additional information could help to further increase accuracy and classify an even greater number of different hand shapes. It would then also be possible to classify not only hand shapes, but simple signs, such as letters from the finger alphabet, as well. A distinction between, for example,
K and
P, which share the same hand shape (see
Section 1), would then be possible.
We hope to achieve a further significant improvement in accuracy by using a new generation of data gloves. The
Manus Quantum Precision XR data gloves use magnetic tracking instead of an IMU and flex sensor-based tracking. With this, the position of the various sensors in the glove is measured by detecting fluctuations in the magnetic field around the glove [
35]. Especially the problems with the thumb position (see
Figure 11) could be solved with this new technology. Overall, the new glove makes a very accurate impression in initial tests.


