Correction: Lagrois et al. Low-to-Mid-Frequency Monopole Source Levels of Underwater Noise from Small Recreational Vessels in the St. Lawrence Estuary Beluga Critical Habitat. Sensors 2023, 23, 1674

 ,
, - 2.
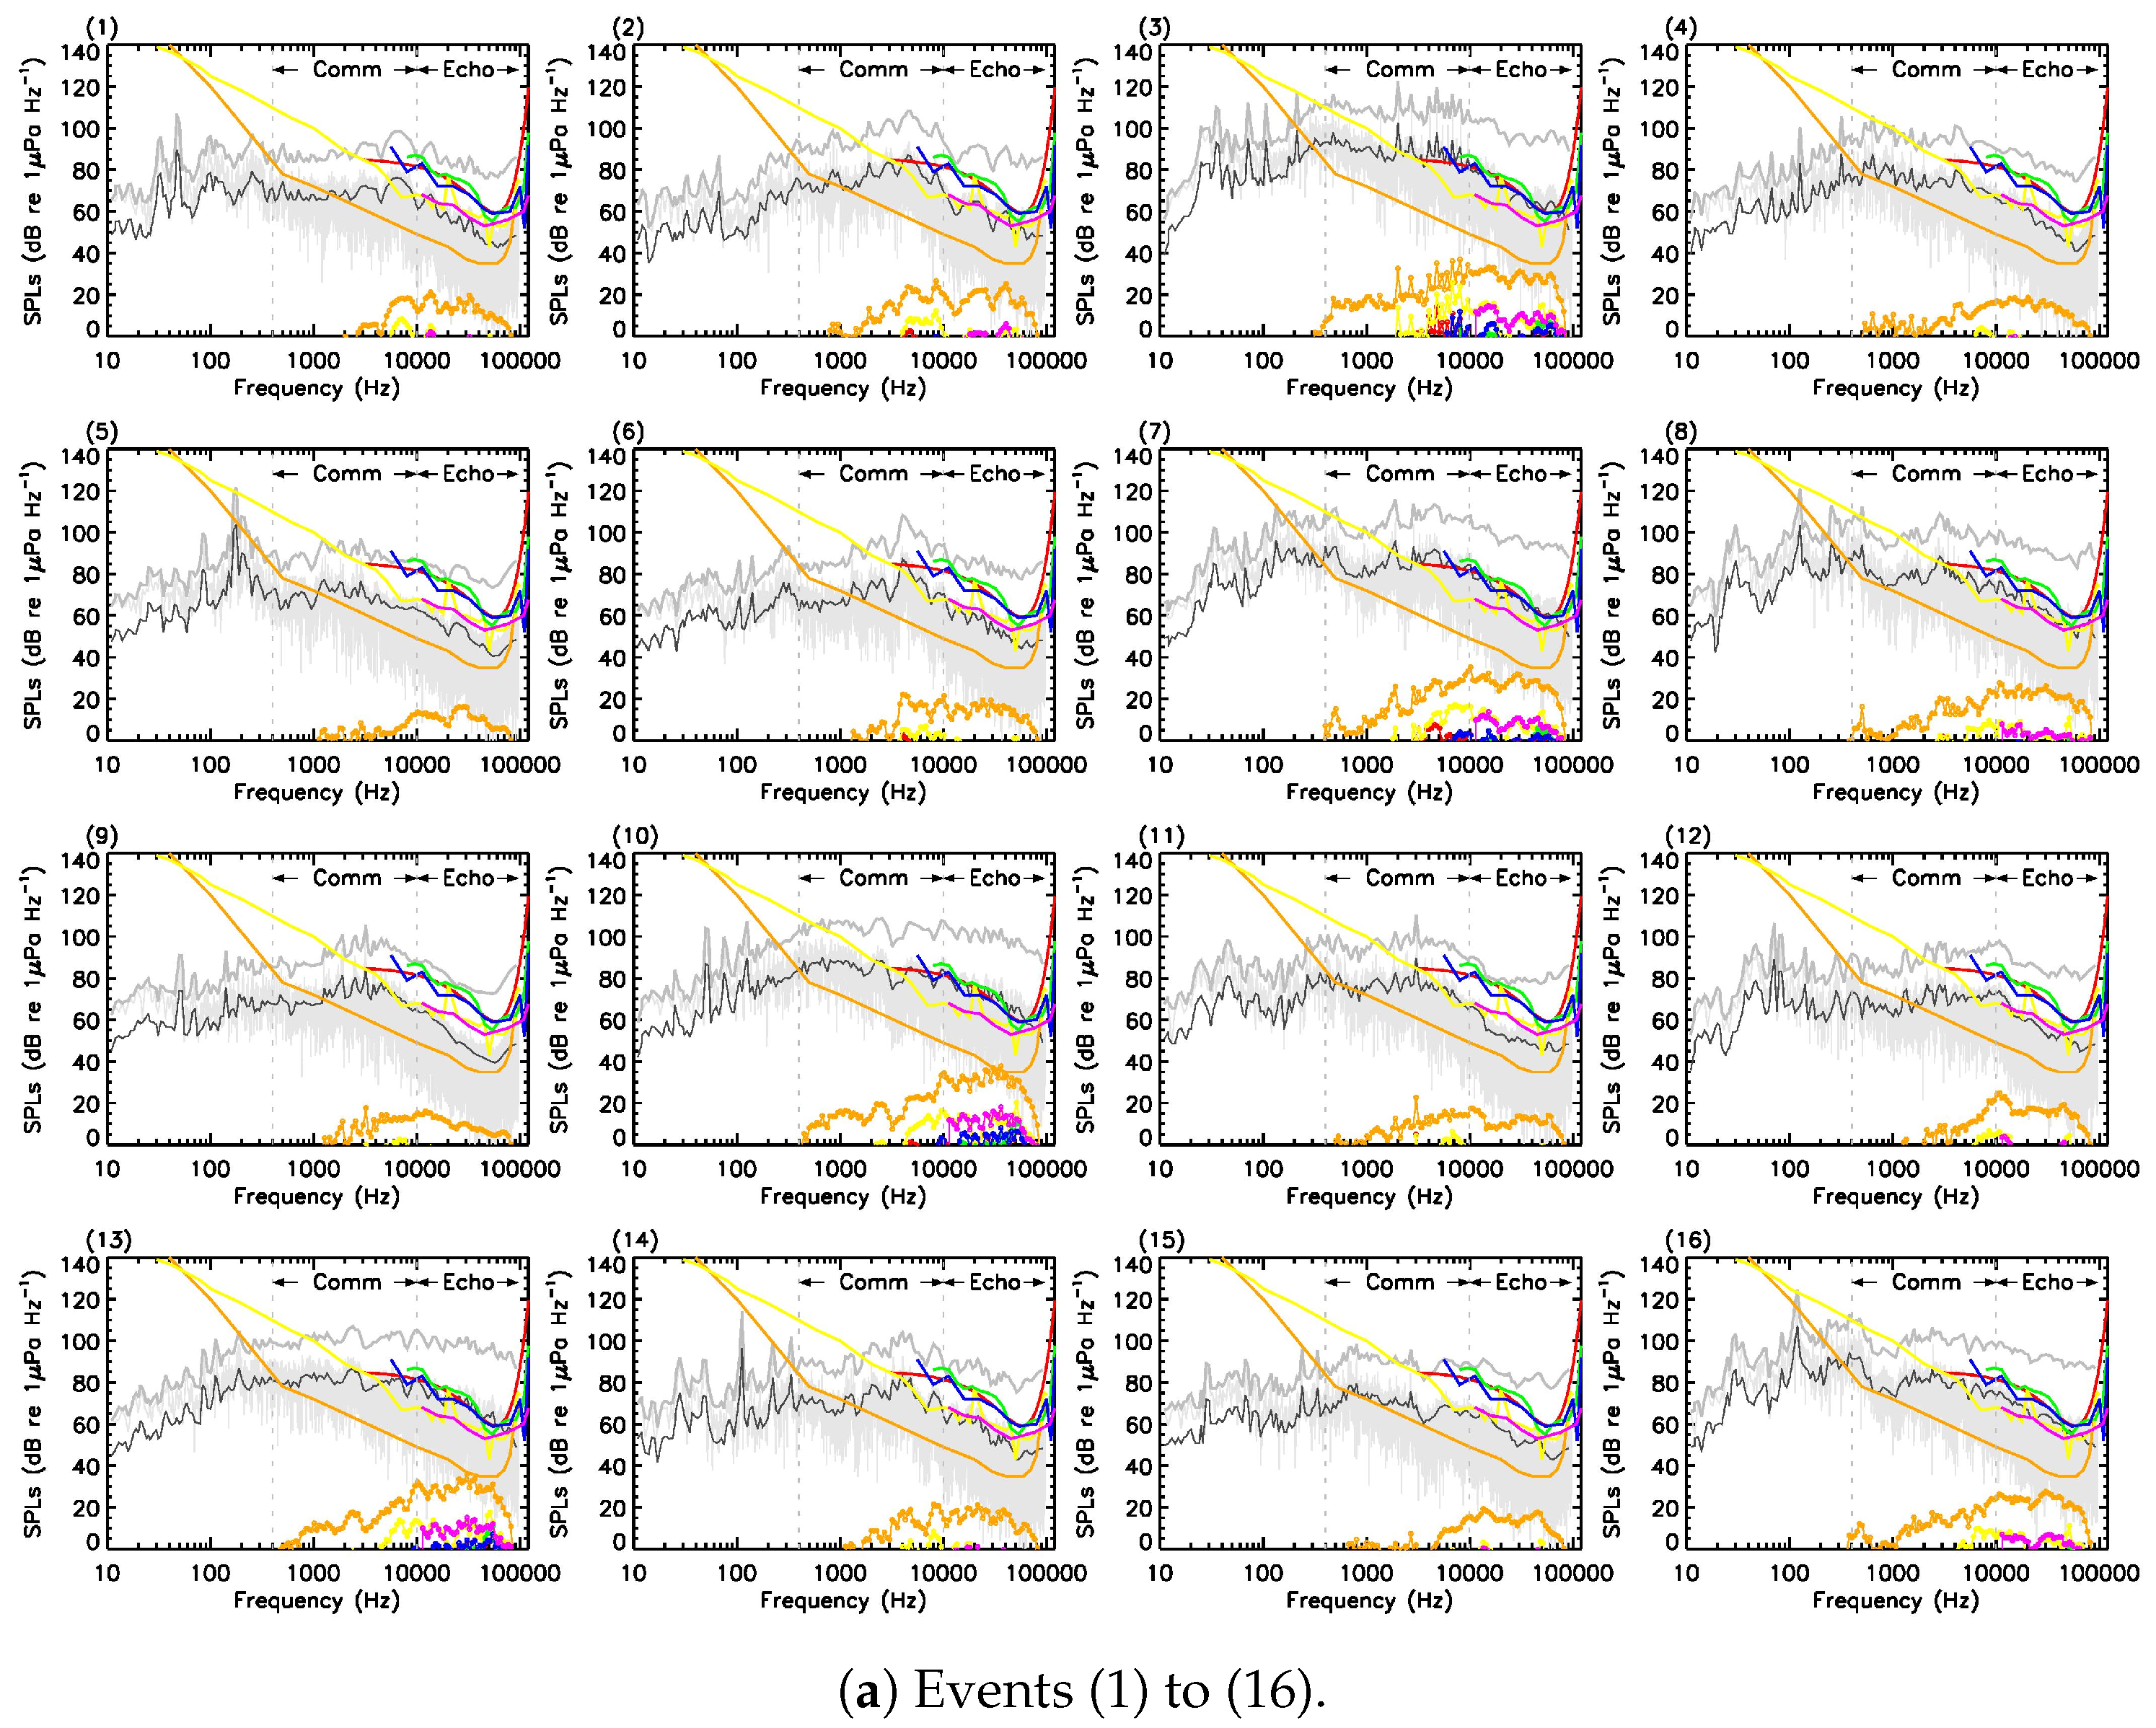
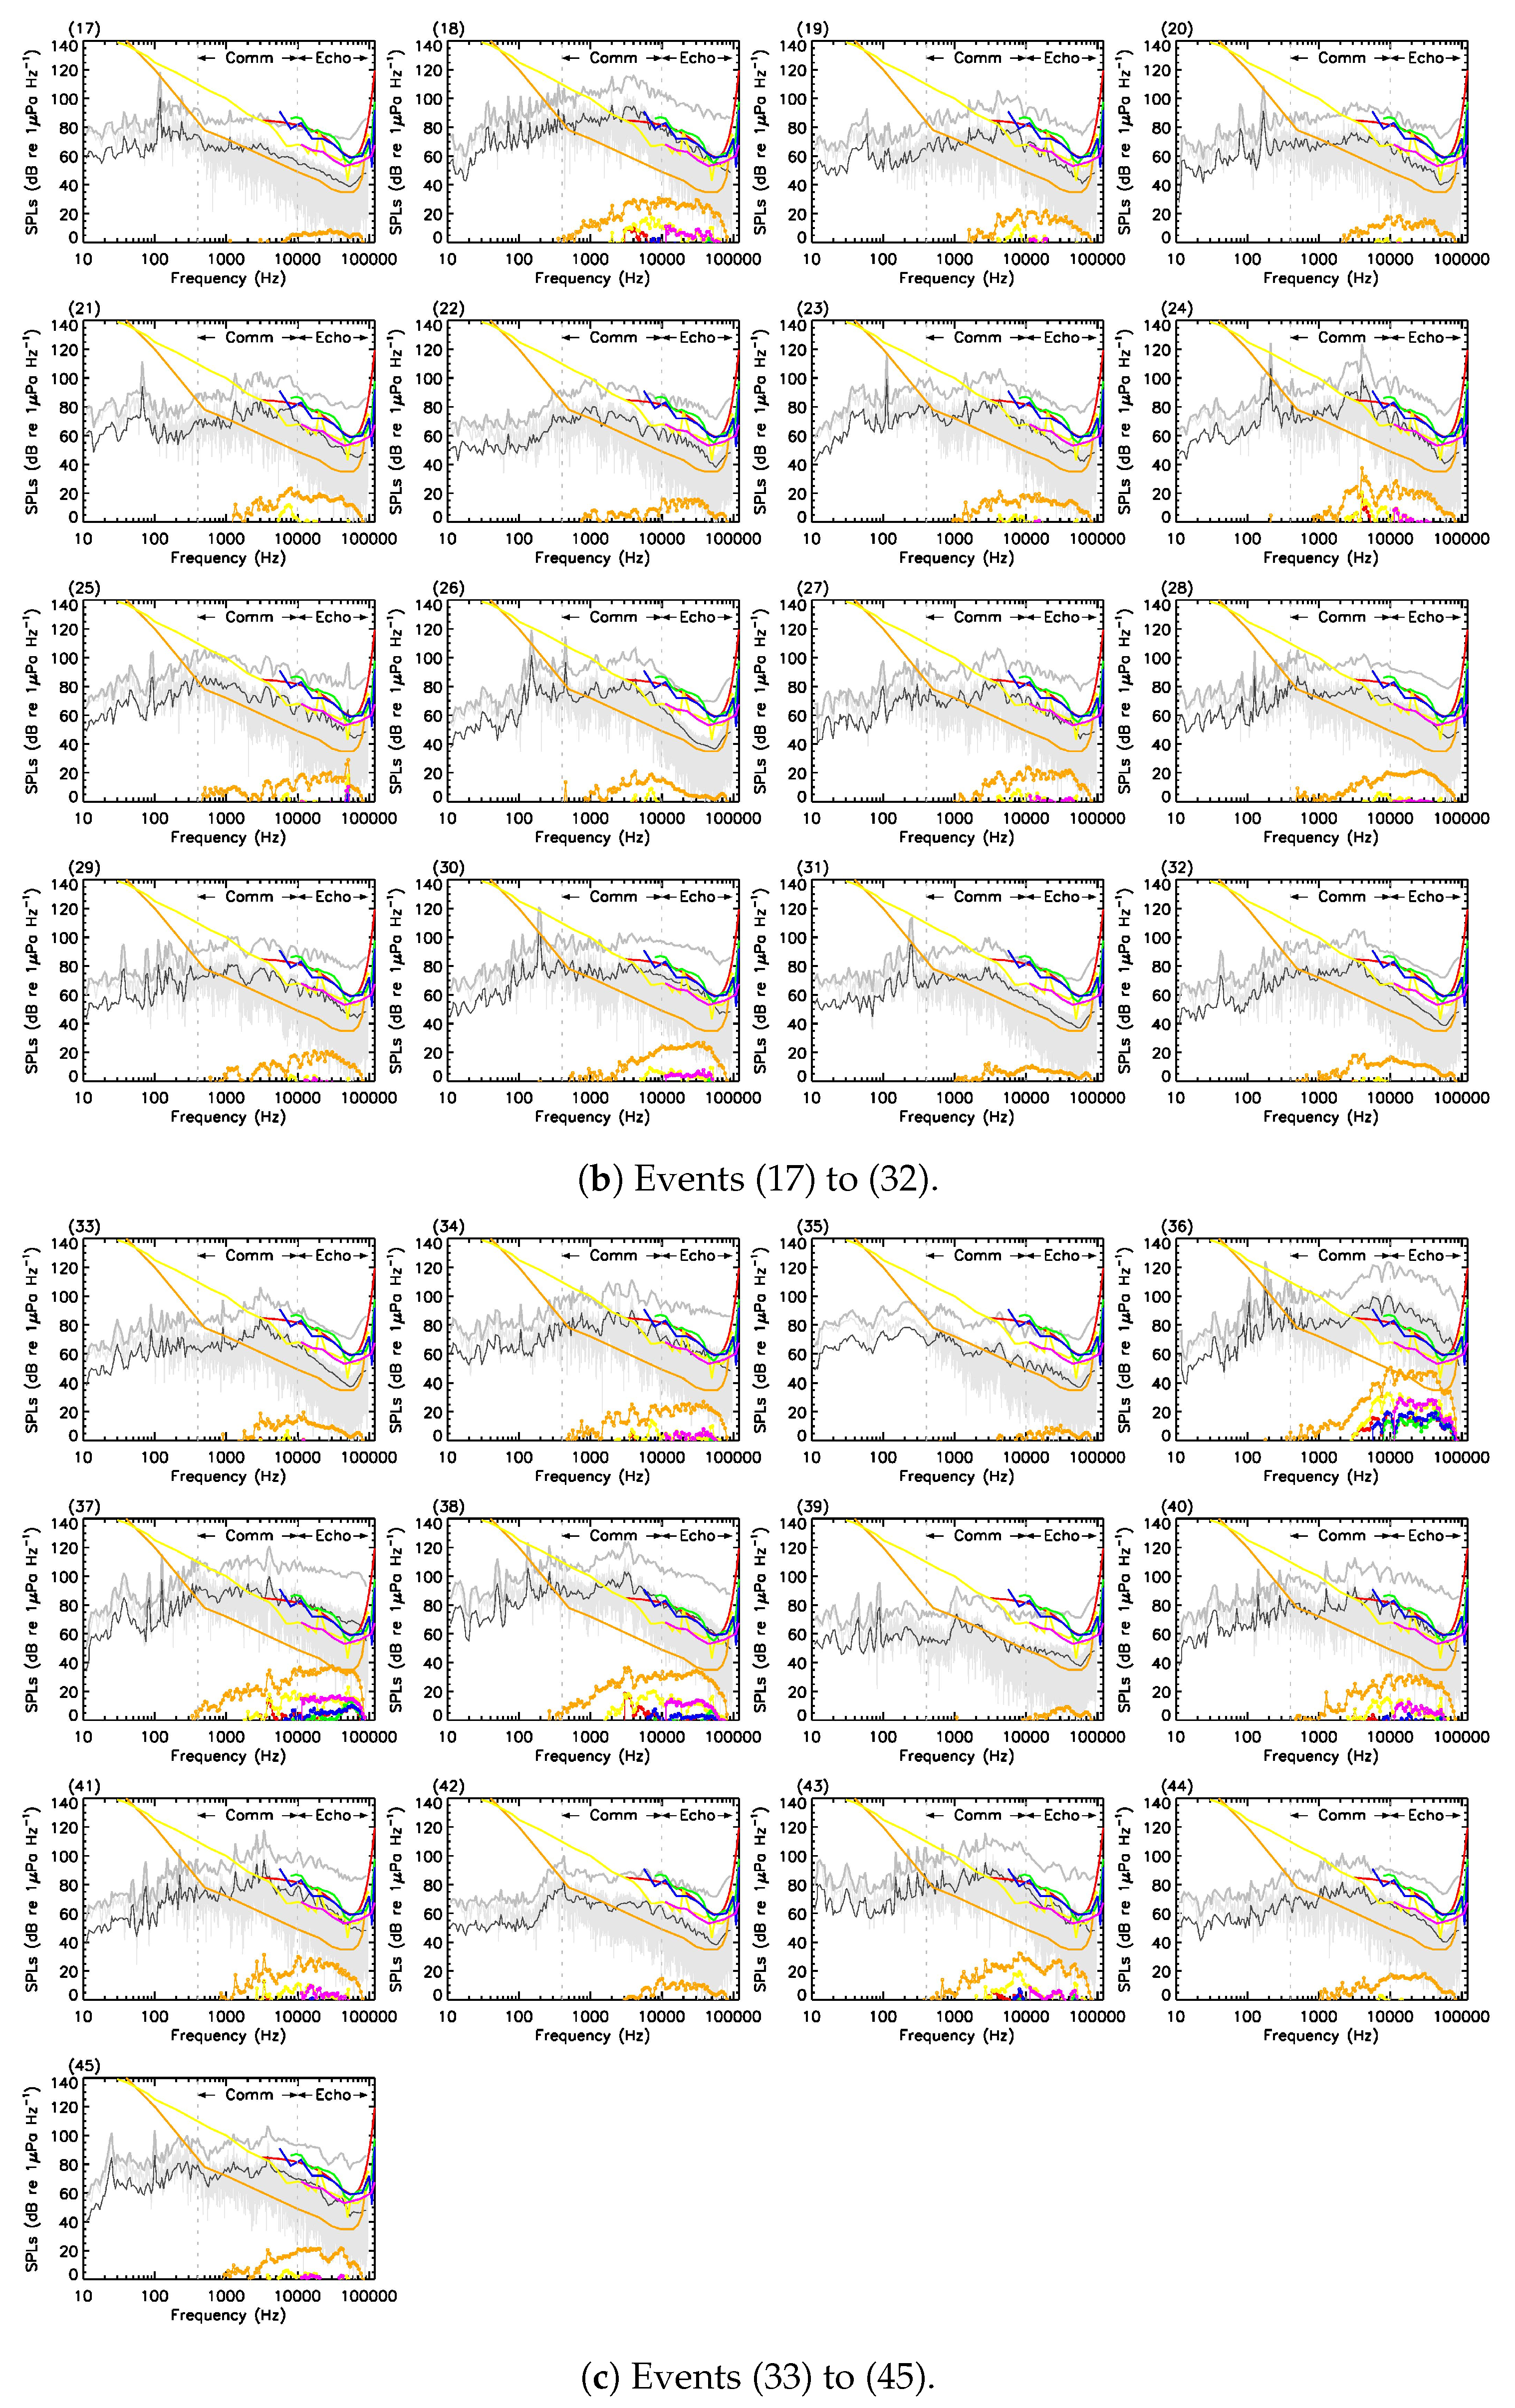
- At least 31.1% of the recorded targets (14 out of 45 events) in Anse-Saint-Étienne have shown received noise levels in excess of the St. Lawrence Estuary beluga hearing audiogram, hence suggesting evidence for acoustic disturbance at CPA distances of a few hundreds meters. In those specific cases, both the beluga’s communication and echolocation bands have increased risks of auditory masking during short-to-intermediate range interactions (<600 m) (see Appendix D).

| Event | Castellote et al. [77] | Erbe et al. [5] | Finneran et al. [45] | Klishin et al. [78] | Mooney et al. [79] | Sysueva et al. [80] | Masking? | ||||||
|---|---|---|---|---|---|---|---|---|---|---|---|---|---|
| Frequency | Excess | Frequency | Excess | Frequency | Excess | Frequency | Excess | Frequency | Excess | Frequency | Excess | ||
| (kHz) | (dB) | (kHz) | (dB) | (kHz) | (dB) | (kHz) | (dB) | (kHz) | (dB) | (kHz) | (dB) | ||
| 1 | − | − | 13.6 | 21 | 7.2 | 8 | − | − | − | − | 13.6 | 2 | ✗ |
| 2 | 4.5 | 3 | 8.5 | 27 | 8.5 | 12 | − | − | − | − | 40.6 | 6 | ? |
| 3 | 4.8 | 14 | 8.1 | 37 | 6.8 | 26 | 57.5 | 7 | 8.1 | 12 | 15.2 | 15 | ✓ |
| 4 | − | − | 20.3 | 19 | 7.2 | 4 | − | − | − | − | − | − | ✗ |
| 5 | − | − | 28.7 | 16 | − | − | − | − | − | − | − | − | ✗ |
| 6 | 4.0 | 3 | 4.0 | 22 | 6.8 | 7 | − | − | − | − | − | − | ✗ |
| 7 | 4.5 | 8 | 10.2 | 35 | 7.2 | 17 | 45.6 | 6 | 15.2 | 5 | 15.2 | 14 | ✓ |
| 8 | 3.0 | 2 | 10.8 | 28 | 51.2 | 11 | 51.2 | 1 | − | − | 11.4 | 8 | ? |
| 9 | − | − | 3.2 | 18 | 6.8 | 3 | − | − | − | − | − | − | ✗ |
| 10 | 36.2 | 8 | 36.2 | 38 | 51.2 | 20 | 54.2 | 10 | 36.2 | 8 | 36.2 | 18 | ✓ |
| 11 | 3.0 | 5 | 3.0 | 23 | 6.8 | 6 | − | − | − | − | − | − | ? |
| 12 | − | − | 10.8 | 25 | 8.5 | 7 | − | − | − | − | 12.1 | 4 | ✗ |
| 13 | 54.2 | 7 | 30.4 | 36 | 51.2 | 18 | 54.2 | 11 | 54.2 | 7 | 30.4 | 15 | ✓ |
| 14 | − | − | 8.0 | 21 | 8.0 | 8 | − | − | − | − | 21.5 | 1 | ✗ |
| 15 | − | − | 13.6 | 19 | 48.3 | 4 | − | − | − | − | − | − | ✗ |
| 16 | − | − | 30.4 | 28 | 51.2 | 11 | 51.2 | 1 | − | − | 11.4 | 7 | ? |
| 17 | − | − | 28.7 | 9 | − | − | − | − | − | − | − | − | ✗ |
| 18 | 4.0 | 10 | 9.1 | 31 | 7.2 | 17 | 45.6 | 3 | 7.6 | 3 | 12.8 | 11 | ✓ |
| 19 | − | − | 7.6 | 23 | 7.6 | 12 | − | − | − | − | 19.2 | 2 | ✗ |
| 20 | − | − | 13.6 | 18 | 9.1 | 3 | − | − | − | − | − | − | ✗ |
| 21 | − | − | 8.1 | 23 | 7.6 | 12 | − | − | − | − | − | − | ✗ |
| 22 | − | − | 10.2 | 16 | − | − | − | − | − | − | − | − | ✗ |
| 23 | 4.3 | 1 | 4.3 | 21 | 7.2 | 5 | − | − | − | − | 15.2 | 1 | ✗ |
| 24 | 4.0 | 18 | 4.0 | 38 | 4.0 | 21 | − | − | − | − | 12.1 | 9 | ✓ |
| 25 | 51.2 | 4 | 51.2 | 29 | 51.2 | 18 | 51.2 | 8 | 51.2 | 4 | 51.2 | 10 | ✓ |
| 26 | 4.3 | 1 | 4.2 | 21 | 7.2 | 9 | − | − | − | − | − | − | ✗ |
| 27 | 4.0 | 1 | 10.8 | 24 | 7.6 | 8 | − | − | − | − | 11.4 | 4 | ✗ |
| 28 | − | − | 27.1 | 22 | 7.2 | 6 | − | − | − | − | 27.1 | 1 | ✗ |
| 29 | − | − | 17.1 | 21 | 8.1 | 4 | − | − | − | − | 17.1 | 2 | ✗ |
| 30 | − | − | 38.4 | 27 | 48.3 | 9 | 48.3 | 1 | − | − | 38.4 | 8 | ? |
| 31 | − | − | 3.0 | 12 | − | − | − | − | − | − | − | − | ✗ |
| 32 | − | − | 4.3 | 18 | 6.8 | 2 | − | − | − | − | − | − | ✗ |
| 33 | 3.0 | 1 | 12.1 | 20 | 7.2 | 7 | − | − | − | − | 12.1 | 0 | ✗ |
| 34 | 3.8 | 6 | 38.4 | 27 | 7.2 | 14 | 48.3 | 1 | − | − | 38.4 | 8 | ✓ |
| 35 | − | − | 30.4 | 10 | − | − | − | − | − | − | − | − | ✗ |
| 36 | 38.4 | 19 | 10.2 | 50 | 9.1 | 33 | 43.1 | 20 | 9.1 | 20 | 13.6 | 29 | ✓ |
| 37 | 4.0 | 15 | 30.4 | 38 | 51.2 | 23 | 54.2 | 13 | 57.5 | 10 | 38.4 | 17 | ✓ |
| 38 | 3.0 | 18 | 3.4 | 37 | 7.6 | 20 | 51.2 | 6 | 8.1 | 8 | 13.5 | 14 | ✓ |
| 39 | − | − | 38.4 | 9 | − | − | − | − | − | − | − | − | ✗ |
| 40 | 3.2 | 8 | 18.1 | 31 | 9.1 | 15 | 51.2 | 5 | 18.1 | 4 | 18.1 | 13 | ✓ |
| 41 | 3.4 | 13 | 3.4 | 31 | 3.4 | 13 | − | − | 16.1 | 1 | 15.2 | 10 | ✓ |
| 42 | − | − | 10.2 | 15 | − | − | − | − | − | − | − | − | ✗ |
| 43 | 3.4 | 6 | 8.1 | 32 | 8.1 | 19 | 48.3 | 3 | 8.1 | 7 | 11.4 | 8 | ✓ |
| 44 | − | − | 30.4 | 18 | 7.2 | 3 | − | − | − | − | − | − | ✗ |
| 45 | 3.8 | 1 | 40.6 | 22 | 7.2 | 6 | − | − | − | − | 15.2 | 3 | ✗ |
- 73. Erbe, C.; Farmer, D.M. A software model to estimate zones of impact on marine mammals around anthropogenic noise. J. Acoust. Soc. Am. 2000, 108, 1327–1331.
- 74. Erbe, C.; Farmer, D.M. Zones of impact around icebreakers affecting beluga whales in the Beaufort Sea. J. Acoust. Soc. Am. 2000, 108, 1332–1340.
- 75. Johnson, C.S.; McManus, M.W.; Skaar, D. Masked tonal hearing thresholds in the beluga whale. J. Acoust. Soc. Am. 1989, 85, 2651–2654.
- 76. Sponagle, N. Variability of Ship Noise Measurements. In Defense Research Establishment Atlantic; Technical Report; Defence Research Establishment Atlantic: Dartmouth, NS, Canada, 1988.
- 77. Castellote, M.; Mooney, T.A.; Quakenbush, L.; Hobbs, R.; Goertz, C.; Gaglione, E. Baseline hearing abilities and variability in wild beluga whales (Delphinapterus leucas). J. Exp. Biol. 2014, 217, 1682–1691.
- 78. Klishin, V.O.; Popov, V.V.; Supin, A.Y. Hearing capabilities of a beluga whale, Delphinapterus leucas. Aquat. Mamm. 2000, 26, 212–228.
- 79. Mooney, T.A.; Castellote, M.; Quakenbush, L.; Hobbs, R.; Gaglione, E.; Goertz, C. Variation in hearing within a wild population of beluga whales (Delphinapterus leucas). J. Exp. Biol. 2018, 221, jeb171959.
- 80. Sysueva, E.V.; Nechaev, D.I.; Popov, V.V.; Supin, A.Y. Electrophysiological audiograms in seven beluga whales (Delphinapterus leucas) from the Okhotsk Sea population. In Proceedings of the Meetings on Acoustics, Acoustical Society of America, Minneapolis, MN, USA, 7–11 May 2018; Volume 33, p. 010001.
Reference
- Lagrois, D.; Kowalski, C.; Sénécal, J.F.; Martins, C.C.A.; Chion, C. Low-to-Mid-Frequency Monopole Source Levels of Underwater Noise from Small Recreational Vessels in the St. Lawrence Estuary Beluga Critical Habitat. Sensors 2023, 23, 1674. [Google Scholar] [CrossRef] [PubMed]
Disclaimer/Publisher’s Note: The statements, opinions and data contained in all publications are solely those of the individual author(s) and contributor(s) and not of MDPI and/or the editor(s). MDPI and/or the editor(s) disclaim responsibility for any injury to people or property resulting from any ideas, methods, instructions or products referred to in the content. |
© 2023 by the authors. Licensee MDPI, Basel, Switzerland. This article is an open access article distributed under the terms and conditions of the Creative Commons Attribution (CC BY) license (https://creativecommons.org/licenses/by/4.0/).
Share and Cite
Lagrois, D.; Kowalski, C.; Sénécal, J.-F.; Martins, C.C.A.; Chion, C. Correction: Lagrois et al. Low-to-Mid-Frequency Monopole Source Levels of Underwater Noise from Small Recreational Vessels in the St. Lawrence Estuary Beluga Critical Habitat. Sensors 2023, 23, 1674. Sensors 2023, 23, 9143. https://doi.org/10.3390/s23229143
Lagrois D, Kowalski C, Sénécal J-F, Martins CCA, Chion C. Correction: Lagrois et al. Low-to-Mid-Frequency Monopole Source Levels of Underwater Noise from Small Recreational Vessels in the St. Lawrence Estuary Beluga Critical Habitat. Sensors 2023, 23, 1674. Sensors. 2023; 23(22):9143. https://doi.org/10.3390/s23229143
Chicago/Turabian StyleLagrois, Dominic, Camille Kowalski, Jean-François Sénécal, Cristiane C. A. Martins, and Clément Chion. 2023. "Correction: Lagrois et al. Low-to-Mid-Frequency Monopole Source Levels of Underwater Noise from Small Recreational Vessels in the St. Lawrence Estuary Beluga Critical Habitat. Sensors 2023, 23, 1674" Sensors 23, no. 22: 9143. https://doi.org/10.3390/s23229143
APA StyleLagrois, D., Kowalski, C., Sénécal, J.-F., Martins, C. C. A., & Chion, C. (2023). Correction: Lagrois et al. Low-to-Mid-Frequency Monopole Source Levels of Underwater Noise from Small Recreational Vessels in the St. Lawrence Estuary Beluga Critical Habitat. Sensors 2023, 23, 1674. Sensors, 23(22), 9143. https://doi.org/10.3390/s23229143