
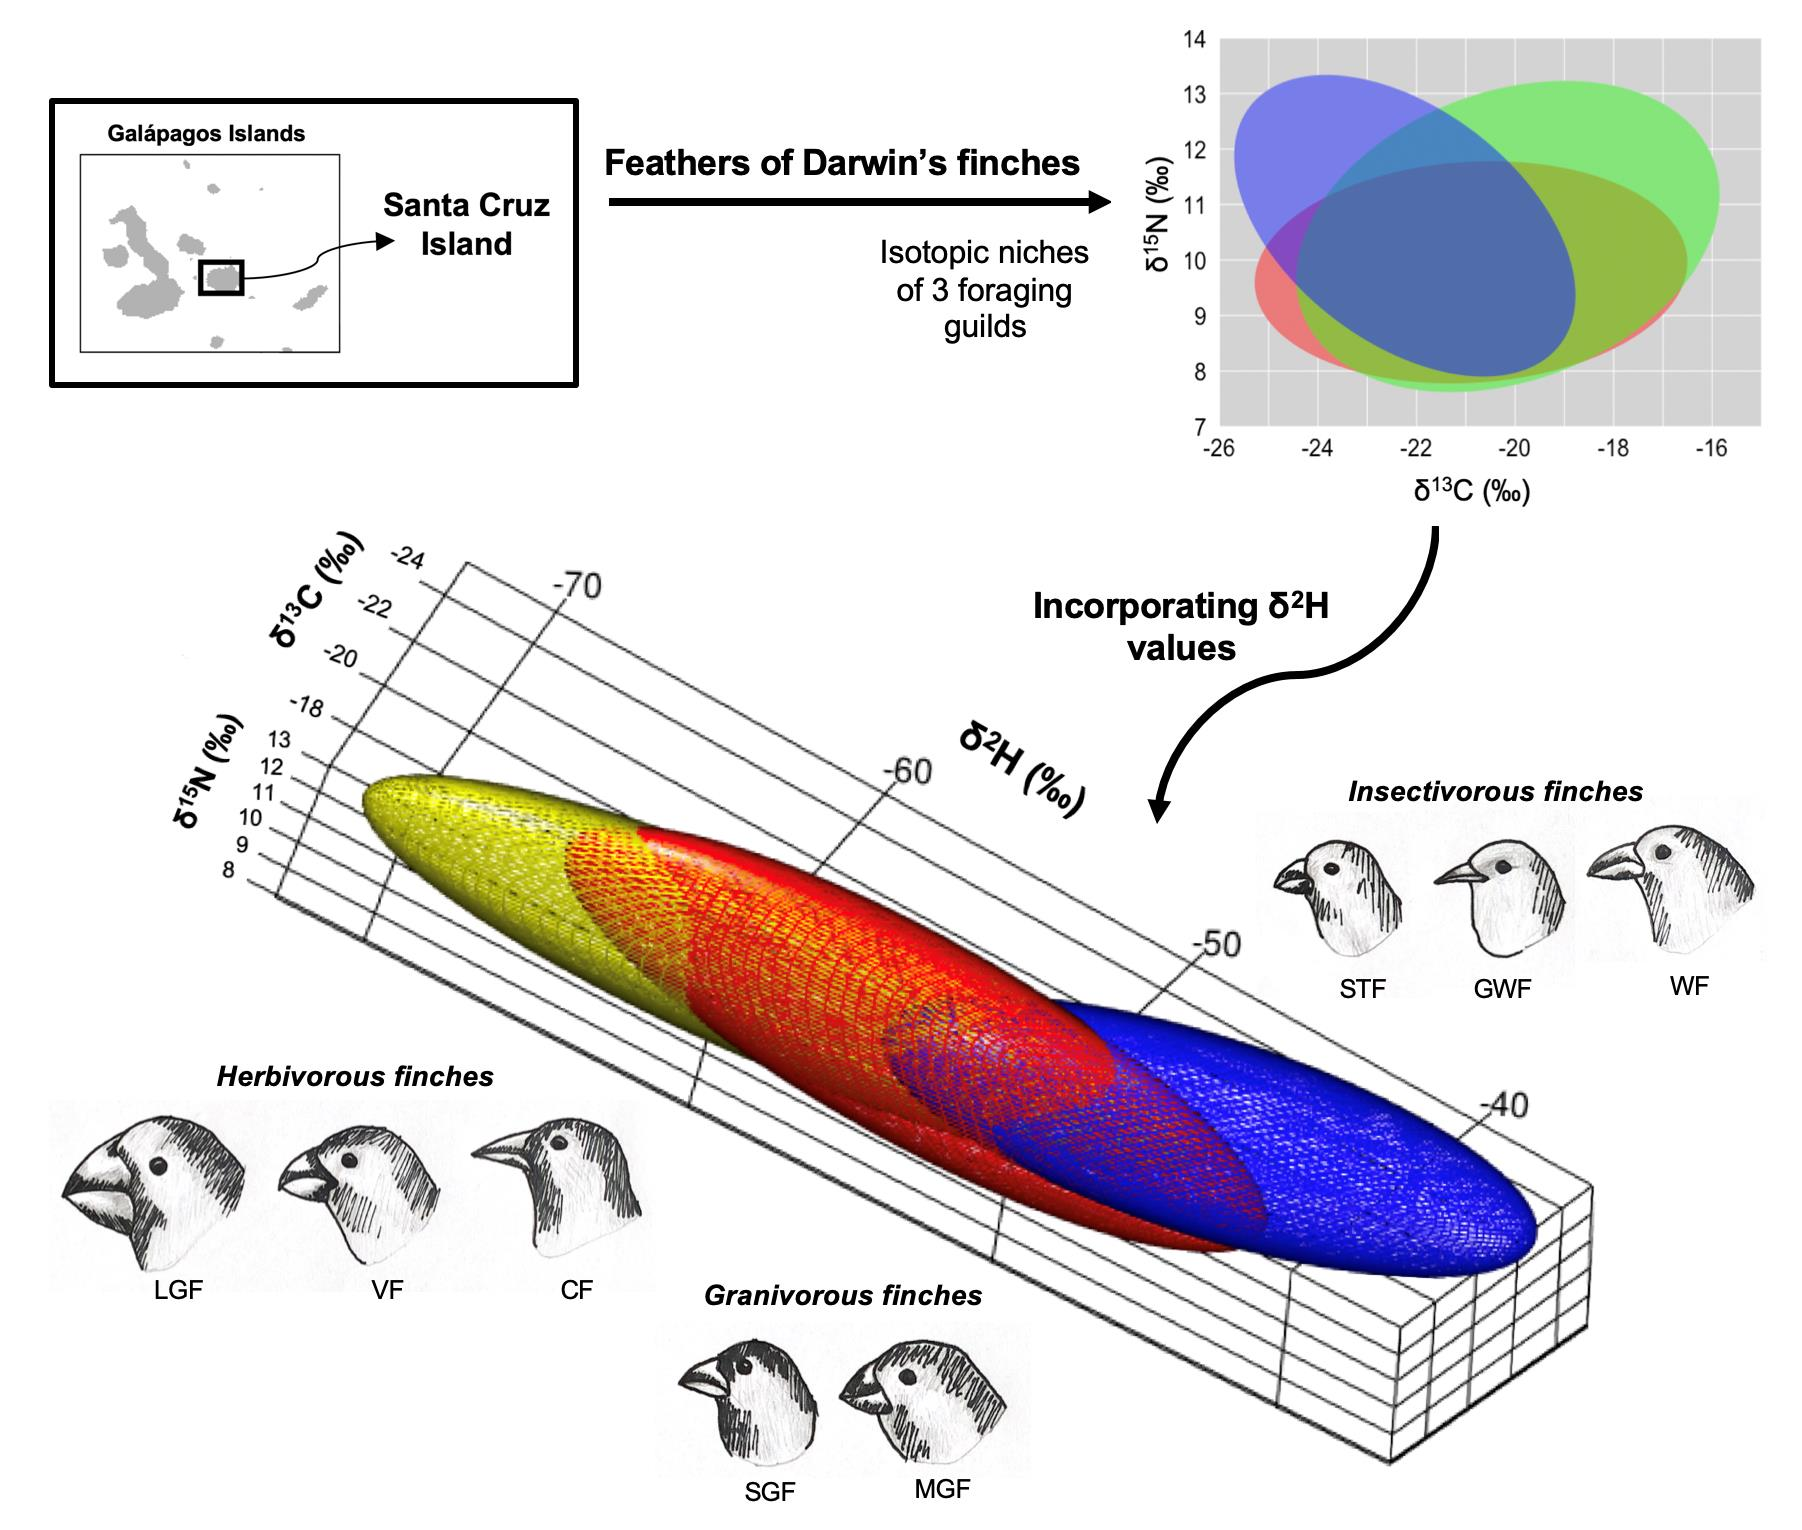
Isotopic Niche Segregation among Darwin’s Finches on Santa Cruz Island, Galápagos

 ,
,  ,
, 
Abstract

1. Introduction
2. Materials and Methods
2.1. Field Collections
2.2. Museum Collections
2.3. Laboratory Analyses
2.4. Statistical Analyses
3. Results
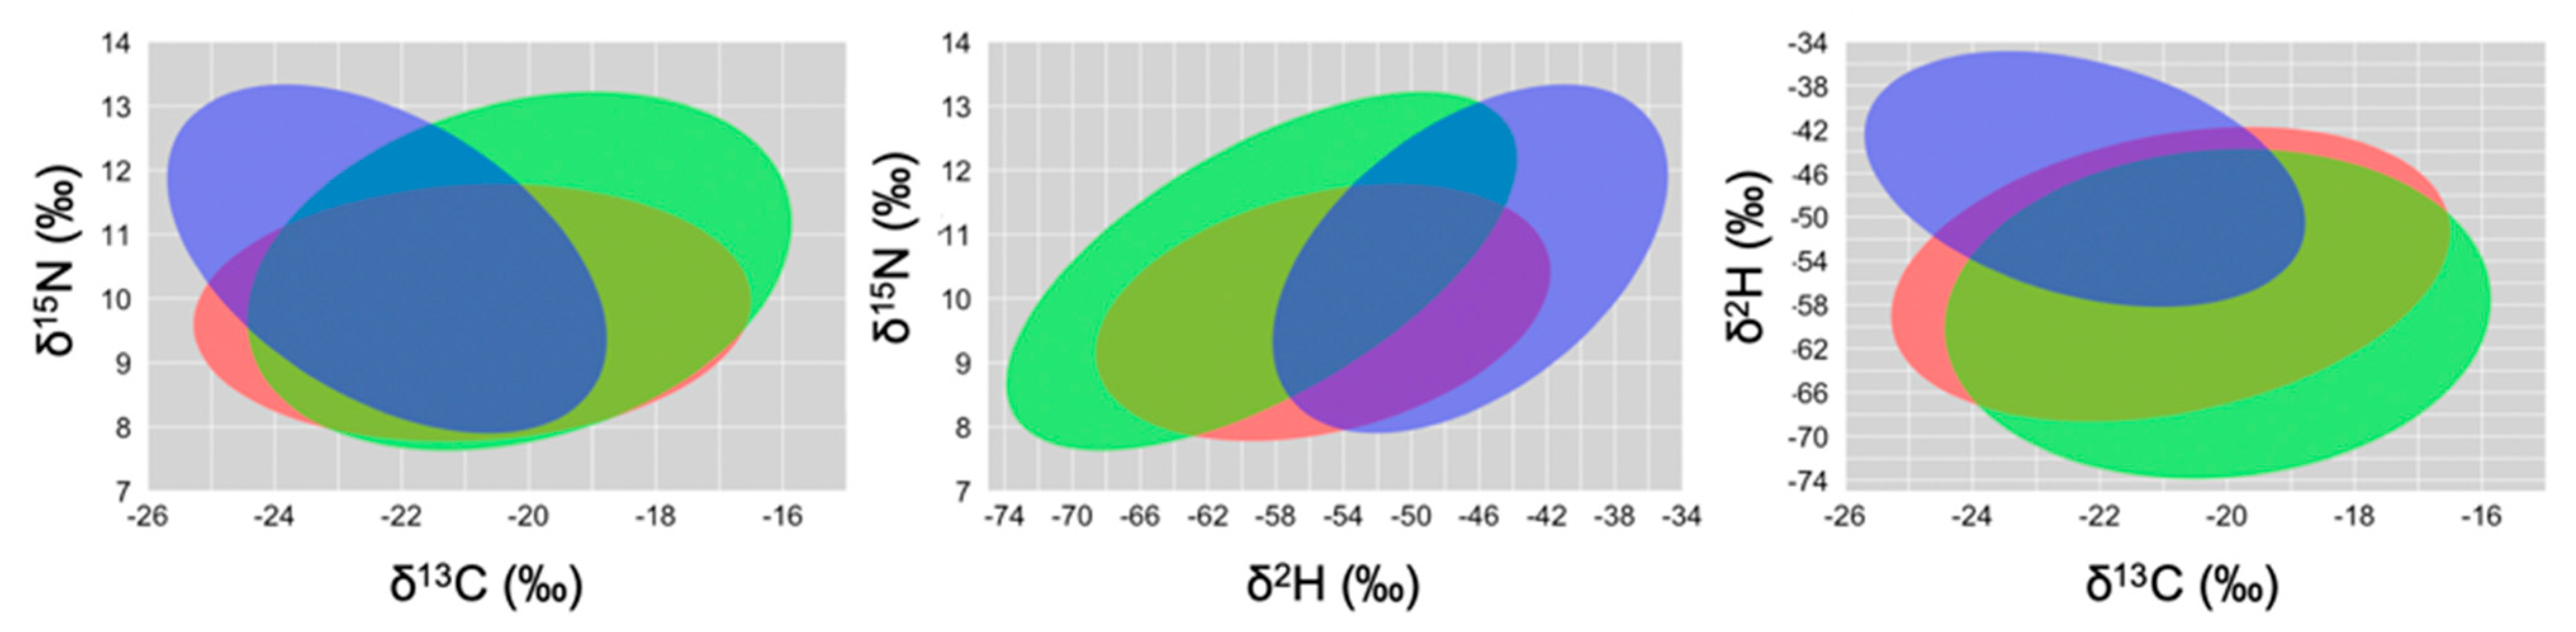
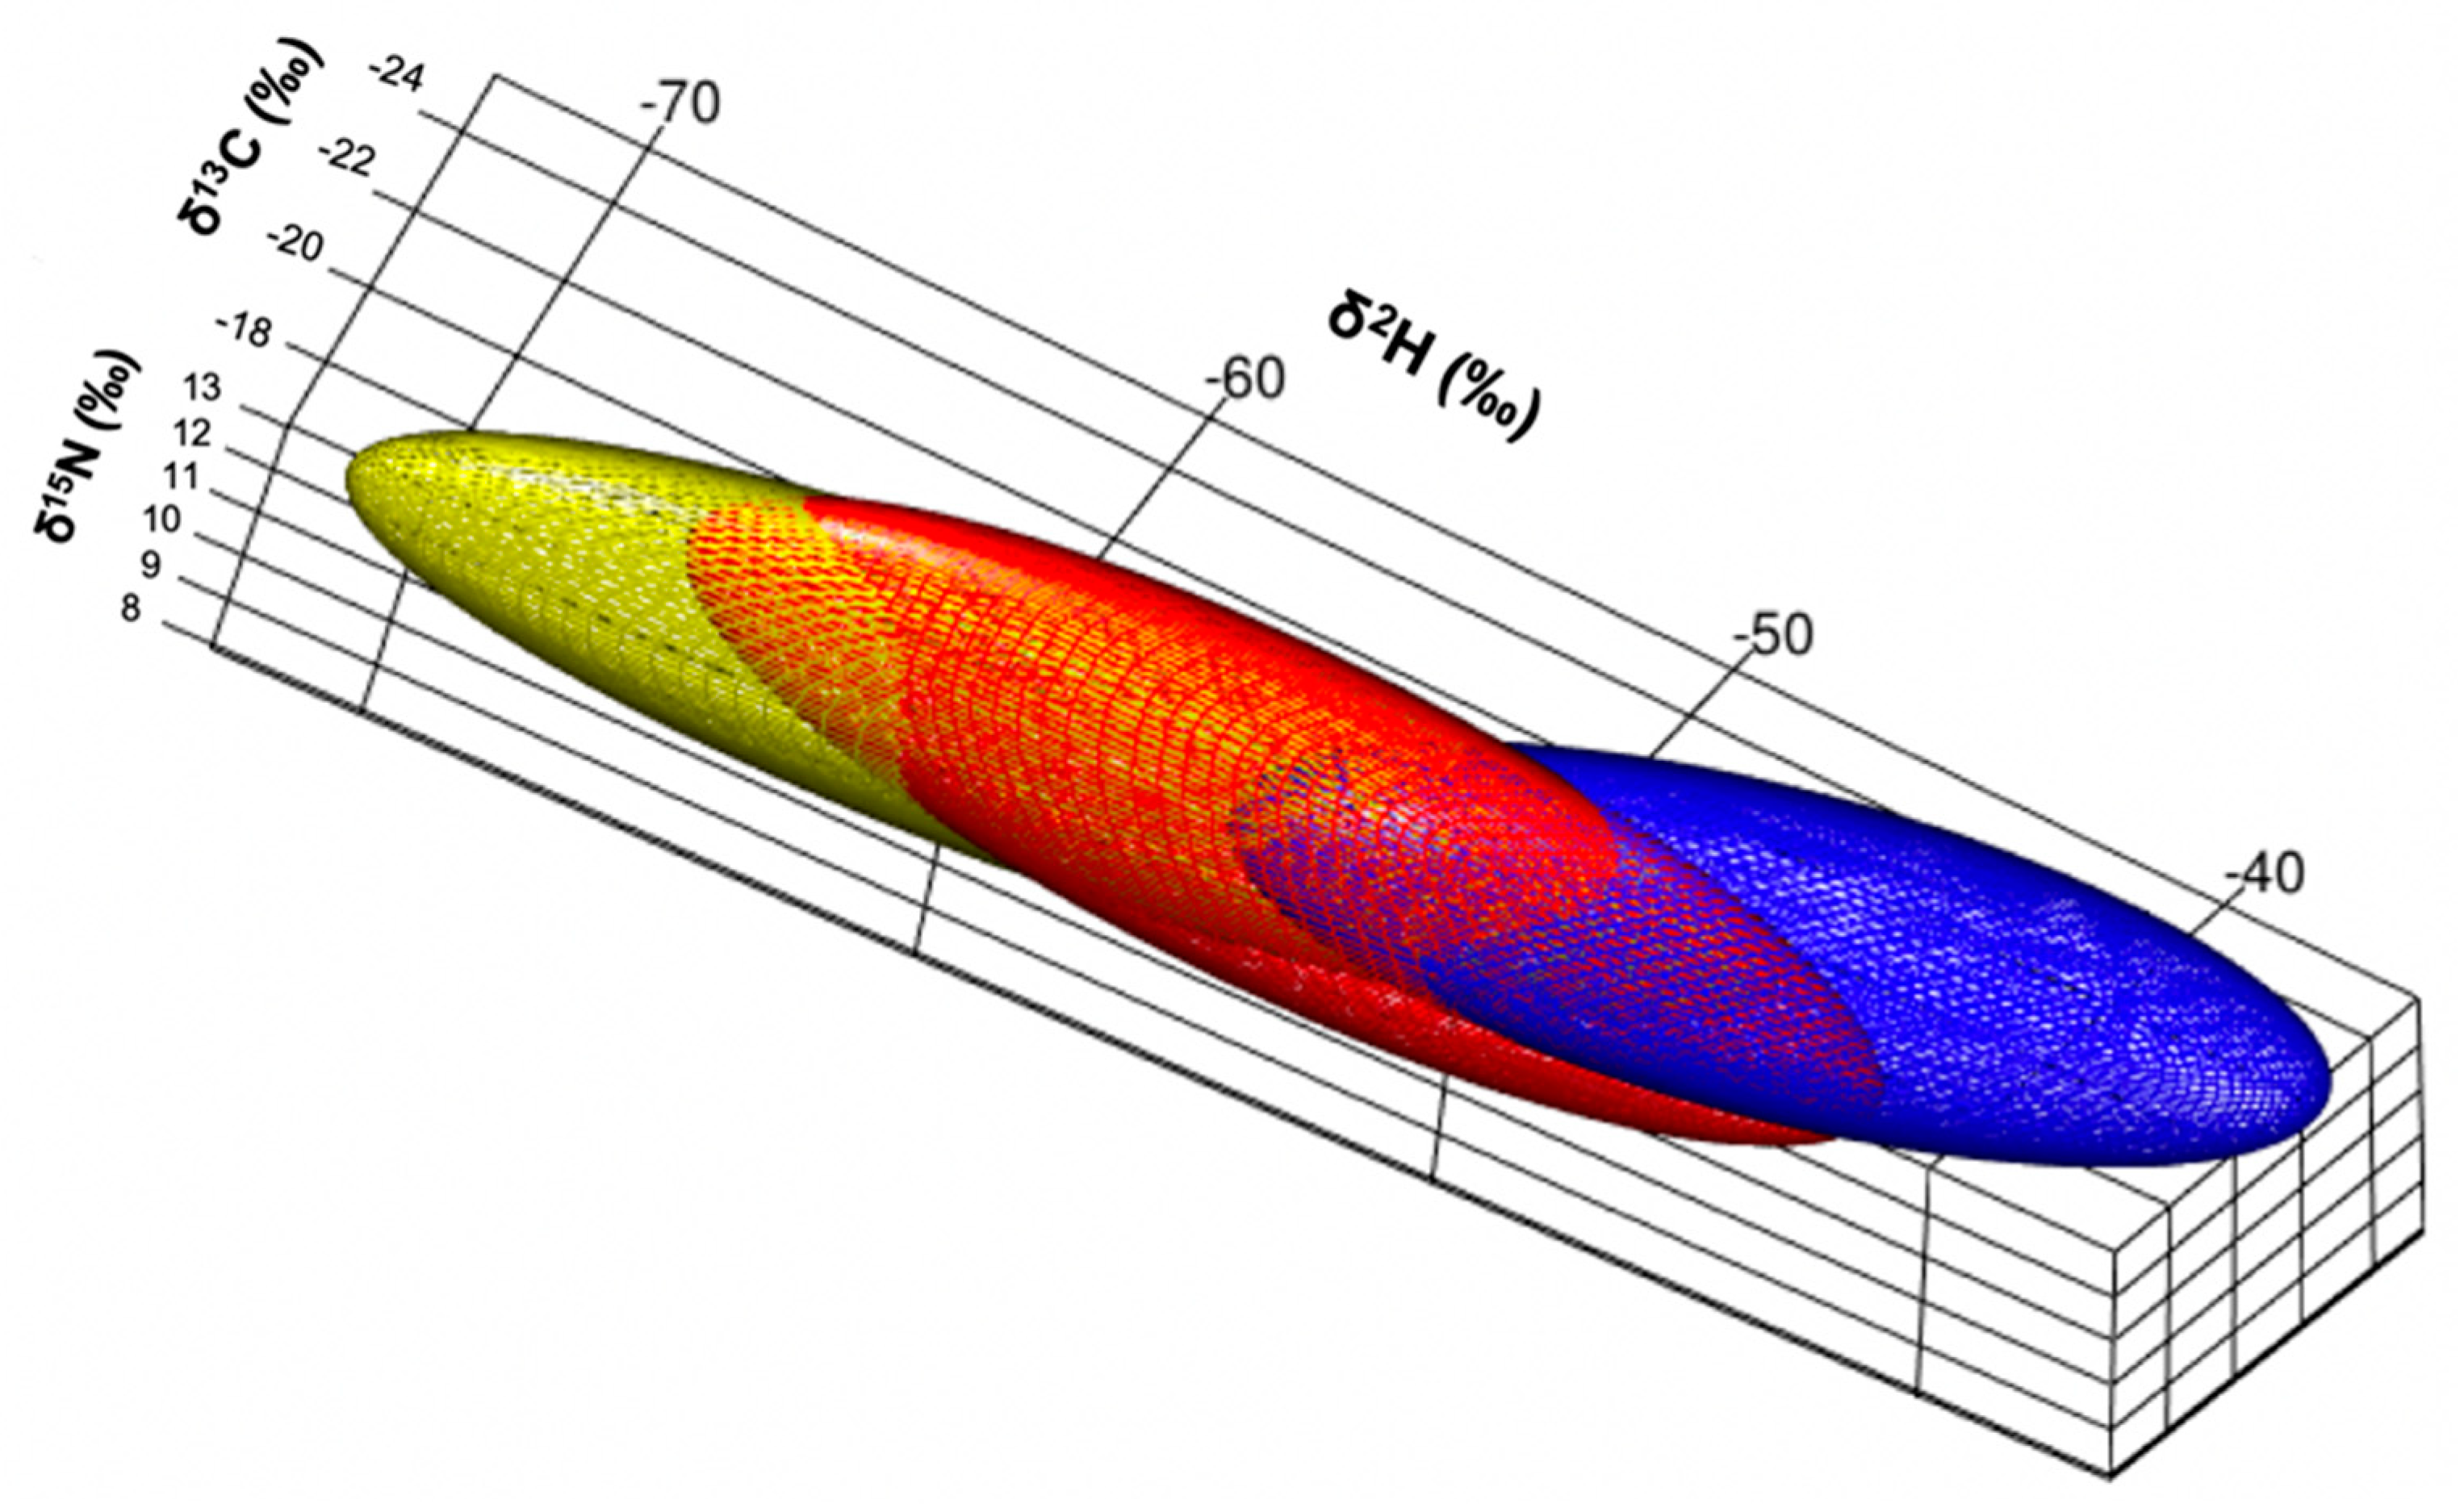
Isotopic Niche Size, Overlap and Trophic Position
4. Discussion
Supplementary Materials
Author Contributions
Funding
Institutional Review Board Statement
Data Availability Statement
Acknowledgments
Conflicts of Interest
References
- Grant, P.R. Ecology and Evolution of Darwin’s Finches; Princeton University Press: Princeton, NJ, USA, 1999. [Google Scholar]
- Grant, P.R.; Grant, B.R. Adaptive radiation of Darwin’s finches: Recent data help explain how this famous group of Galapagos birds evolved, although gaps in our understanding remain. Am. Sci. 2002, 130, 1–7. [Google Scholar]
- Tebbich, S.; Stereln, K.; Teschke, I. The tale of the finch: Adaptive radiation and behavioural flexibility. Philos. Trans. R. Soc. B Biol. Sci. 2010, 365, 1099–1109. [Google Scholar] [CrossRef] [PubMed]
- Farrington, H.L.; Lawson, L.P.; Clark, C.M.; Petren, K. The evolutionary history of Darwin’s Finches: Speciation, gene flow, and introgression in a fragmented landscape. Evolution 2014, 68, 2932–2944. [Google Scholar] [CrossRef] [PubMed]
- Lamichhaney, S.; Berglund, J.; Almén, M.S.; Maqbool, K.; Grabherr, M.; Martínez-Barrio, A.; Promerová, M.; Rubin, C.-J.; Wang, C.; Zamani, N.; et al. Evolution of Darwin’s finches and their beaks revealed by genome sequencing. Nature 2015, 518, 371–377. [Google Scholar] [CrossRef] [PubMed]
- De León, L.F.; Podos, J.; Gardezi, T.; Herrel, A.; Hendry, A.P. Darwin’s finches and their diet niches: The sympatric coexistence of imperfect generalists. J. Evol. Biol. 2014, 27, 1093–1104. [Google Scholar] [CrossRef]
- Smith, J.N.M.; Grant, P.R.; Grant, B.R.; Abbott, I.J.; Abbott, L.K. Seasonal variation in feeding habits of Darwin’s ground finches. Ecology 1978, 59, 1137–1150. [Google Scholar] [CrossRef]
- Boag, P.T.; Grant, P.R. Darwin’s finches (Geospiza) on Isla Daphne Major, Galapagos: Breeding and feeding ecology in a climatically variable environment. Ecol. Monogr. 1984, 54, 463–489. [Google Scholar] [CrossRef]
- Christensen, R.; Kleindorfer, S. Jack-of-all-trades or master of one? Variation in foraging specialisation across years in Darwin’s Tree Finches (Camarhynchus spp.). J. Ornithol. 2009, 150, 383–391. [Google Scholar] [CrossRef]
- Grant, B.R.; Grant, P.R. What Darwin’s Finches can teach us about the evolutionary origin and regulation of biodiversity. Bioscience 2003, 53, 965–975. [Google Scholar] [CrossRef]
- Bearhop, S.; Adams, C.E.; Waldron, S.; Fuller, R.A.; Macleod, H. Determining trophic niche width: A novel approach using stable isotope analysis. J. Anim. Ecol. 2004, 73, 1007–1012. [Google Scholar] [CrossRef]
- West, J.B.; Bowen, G.J.; Cerling, T.E.; Ehleringer, J.R. Stable isotopes as one of nature’s ecological recorders. Trends Ecol. Evol. 2006, 21, 408–414. [Google Scholar] [CrossRef]
- Newsome, S.D.; Martinez del Rio, C.; Bearhop, S.; Phillips, D.L. A Niche for Isotope Ecology. Front. Ecol. Environ. 2007, 5, 429–436. [Google Scholar] [CrossRef]
- Sulzman, E.W. Stable Isotope Chemistry and Measurement: A primer. In Stable Isotopes in Ecology and Environmental Science; Michener, R.H., Lajtha, K., Eds.; Blackwell Publishing: Oxford, UK, 2007; pp. 1–18. [Google Scholar]
- McLoughlin, P.D.; Lysak, K.; Debeffe, L.; Perry, T.; Hobson, K.A. Density-dependent resource selection by a terrestrial herbivore in response to sea-to-land nutrient transfer by seals. Ecology 2016, 97, 1929–1937. [Google Scholar] [CrossRef] [PubMed]
- Wiley, A.E.; James, H.F.; Ostrom, P.H. Emerging Techniques for Isotope Studies of Avian Ecology. In The Extended Specimen: Emerging Frontiers in Collections-Based Ornithological Research; Webster, M.S., Ed.; CRC Press: Boca Raton, FL, USA, 2017; pp. 89–109. [Google Scholar]
- Kelly, J.F. Stable isotopes of carbon and nitrogen in the study of avian and mammalian trophic ecology. Can. J. Zool. 2000, 78, 1–27. [Google Scholar] [CrossRef]
- Post, D.M. Using stable isotopes to estimate trophic position: Models, methods and assumptions. Ecology 2002, 83, 703–718. [Google Scholar] [CrossRef]
- Kendall, C.; Elliott, E.M.; Wankel, S.D. Tracing anthropogenic inputs of nitrogen to ecosystems. In Stable Isotopes in Ecology and Environmental Science, 2nd ed.; Michener, R., Lajtha, K., Eds.; Blackwell Publishing: Oxford, UK, 2007; pp. 375–449. [Google Scholar]
- Fairhurst, G.D.; Vögeli, M.; Serrano, D.; Delgado, A.; Tella, J.L.; Bortolotti, G.R. Can synchronizing feather-based measures of corticosterone and stable isotopes help us better understand habitat-physiology relationships? Oecologia 2013, 173, 731–743. [Google Scholar] [CrossRef]
- Bowen, G.J. Isoscapes: Spatial pattern in isotopic biogeochemistry. Annu. Rev. Earth Planet. Sci. 2010, 38, 161–187. [Google Scholar] [CrossRef]
- Bowen, G.J.; West, J.B. Isotope landscapes for terrestrial migration research. In Tracking Animal Migration with Stable Isotopes; Hobson, K.A., Wassenaar, L.I., Eds.; Elsevier Inc.: Saskatoon, SK, Canada, 2008; pp. 89–105. [Google Scholar]
- Hong, P.; Wiley, D.N.; Powers, K.D.; Michener, R.H.; Kaufman, L.; Hatch, K.A. Stable Isotope analyses of multiple tissues of Great Shearwaters (Ardenna gravis) reveals long-term dietary stability, short-term changes in diet, and can be used as a tool to monitor food webs. Diversity 2019, 11, 163. [Google Scholar] [CrossRef]
- Rubenstein, D.R.; Hobson, K.A. From birds to butterflies: Animal movement patterns and stable isotopes. Trends Ecol. Evol. 2004, 19, 256–263. [Google Scholar] [CrossRef]
- Wassenaar, L.I.; Hobson, K.A. Stable-carbon and hydrogen isotope ratios reveal breeding origins of red-winged blackbirds. Ecol. Appl. 2000, 10, 911–916. [Google Scholar] [CrossRef]
- Vander Zanden, H.B.; Soto, D.X.; Bowen, G.J.; Hobson, K.A. Expanding the isotopic toolbox: Applications of hydrogen and oxygen stable isotope ratios to food web studies. Front. Ecol. Evol. 2016, 4, 1–19. [Google Scholar] [CrossRef]
- Newsome, S.D.; Sabat, P.; Wolf, N.; Rader, J.A.; Martinez del Rio, C. Multi-tissue δ2H analysis reveals altitudinal migration and tissue-specific discrimination patterns in Cinclodes. Ecosphere 2015, 6, 1–18. [Google Scholar] [CrossRef]
- Hobson, K.A.; Wassenaar, L.I.; Milá, B.; Lovette, I.; Dingle, C.; Smith, T.B. Stable isotopes as indicators of altitudinal distributions and movements in an Ecuadorean hummingbird community. Oecologia 2003, 136, 302–308. [Google Scholar] [CrossRef]
- Snell, H.M.; Stone, P.A.; Snell, H.L. A summary of geographical characteristics of the Galápagos Islands. J. Biogeog. 1996, 23, 619–624. [Google Scholar] [CrossRef]
- Dvorak, M.; Fessl, B.; Nemeth, E.; Kleindorfer, S.; Tebbich, S. Distribution and abundance of Darwin’s finches and other land birds on Santa Cruz Island, Galápagos: Evidence for declining populations. Oryx 2011, 46, 78–86. [Google Scholar] [CrossRef]
- Rivas-Torres, G.F.; Benítez, F.L.; Rueda, D.; Sevilla, C.; Mena, C.F. A methodology for mapping native and invasive vegetation coverage in archipelagos: An example from the Galápagos Islands. Profress Phys. Geogr. 2018, 42, 83–111. [Google Scholar] [CrossRef]
- Herrera, L.G.; Hobson, K.A. Trophic partitioning in tropical rain forest birds: Insights from stable isotope analysis. Oecologia 2003, 136, 439–444. [Google Scholar] [CrossRef] [PubMed]
- Rossman, S.; Ostrom, P.H.; Gordon, F.; Zipkin, E.F. Beyond carbon and nitrogen: Guidelines for estimating three-dimensional isotopic niche space. Ecol. Evol. 2016, 6, 2405–2413. [Google Scholar] [CrossRef] [PubMed]
- Jiménez-Uzcátegui, G.; Vaca, L.; Cotín, J.; García, C.; Costales, A.; Sevilla, C.; Páez-Rosas, D. Using referential values of δ13C and δ15N to infer the foraging ecology of Galápagos seabirds. Marine Ornithol. 2019, 47, 5–10. [Google Scholar]
- Hette-Tronquart, N. Isotopic niche is not equal to trophic niche. Ecol. Lett. 2019. [Google Scholar] [CrossRef] [PubMed]
- Yeakel, J.D.; Bhat, U.; Elliott Smith, E.A.; Newsome, S.D. Exploring the isotopic niche: Isotopic variance, physiological incorporation, and the temporal dynamics of foraging. Front. Ecol. Evol. 2016, 4. [Google Scholar] [CrossRef]
- Rader, J.A.; Newsome, S.D.; Sabat, P.; Chesser, R.T.; Dillon, M.E.; Martinez del Río, C. Isotopic niches support the niche breadth hypothesis. J. Anim. Ecol. 2017, 86, 405–413. [Google Scholar] [CrossRef] [PubMed]
- Bosenbecker, C.; Bugoni, L. Trophic niche similarities of sympatric Turdus thrushes determined by fecal contents, stable isotopes and bipartite network approaches. Ecol. Evol. 2020, 10, 9073–9084. [Google Scholar] [CrossRef]
- English, P.A.; Green, D.J.; Nocera, J.J. Stable isotopes from museum specimens may provide evidence of long-term change in the trophic ecology of a migratory aerial insectivore. Front. Ecol. Environ. 2018, 6, 1–13. [Google Scholar] [CrossRef]
- Guerrero, A.M.; Tye, A. Darwin’s Finches as Seed Predators and Dispersers. Wilson J. Ornithol. 2009, 121, 752–764. [Google Scholar] [CrossRef]
- Kleindorfer, S.; Fessl, B.; Peters, K.; Achundia, D. Guía de Campo: Aves Terrestres Residentes de Galápagos; Fundación Charles Darwin para las Islas Galápagos: Puerto Ayora, Ecuador, 2019. [Google Scholar]
- Wassenaar, L.I.; Hobson, K.A. Comparative equilibration and online technique for determination of non-exchangeable hydrogen of keratins for use in animal migration studies. Isotopes Environ. Health Stud. 2003, 39, 211–217. [Google Scholar] [CrossRef] [PubMed]
- Jackson, A.L.; Inger, R.; Parnell, A.C.; Bearhop, S. Comparing isotopic niche widths among and within communities: SIBER—Stable Isotope Bayesian Ellipses in R. J. Anim. Ecol. 2011, 80, 595–602. [Google Scholar] [CrossRef]
- R Core Team. R: A Language and Environment for Statistical Computing; R Foundation for Statistical Computing: Vienna, Austria, 2020. [Google Scholar]
- Dammhahn, M.; Goodman, S. Trophic niche differentiation and microhabitat utilization revealed by stable isotope analyses in a dry forest bat assemblage at Ankarana, northern Madagascar. J. Trop. Ecol. 2014, 30, 97–109. [Google Scholar] [CrossRef]
- Shipley, O.N.; Matich, P. Studying animal niches using bulk stable isotope ratios: An updated synthesis. Oecologia 2020. [Google Scholar] [CrossRef]
- Snow, D.W. Moult and the breeding cycle in Darwin’s finches. J. Ornithol. 1966, 107, 283–291. [Google Scholar] [CrossRef]
- Michel, A.J.; Ward, L.M.; Goffredi, S.K.; Dawson, K.S.; Baldassarre, D.T.; Brenner, K.; Gotanda, K.A.; McCormack, J.E.; Mullin, S.W.; O’Neill, A.; et al. The gut of the finch: Uniqueness of the gut microbiome of the Galápagos vampire finch. Microbiome 2018, 6, 167. [Google Scholar] [CrossRef] [PubMed]
- Heleno, R.H.; Olesen, J.M.; Nogales, M.; Vargas, P.; Traveset, A. Seed dispersal networks in the Galápagos and the consequences of alien plant invasions. Proc. R. Soc. B Biol. Sci. 2013, 280, 1887–1894. [Google Scholar] [CrossRef] [PubMed]
- Maldonado, K.; Bozinovic, F.; Newsome, S.D.; Sabat, P. Testing the niche variation hypothesis in a community of passerine birds. Ecology 2017, 98, 903–908. [Google Scholar] [CrossRef] [PubMed]
- Buelow, C.A.; Reside, A.E.; Baker, R.; Sheaves, M. Stable isotopes reveal opportunistic foraging in a spatiotemporally heterogenous environment: Bird assemblages in mangrove forests. PLoS ONE 2018, 13, e0206145. [Google Scholar] [CrossRef]
- Charles Darwin Foundation. Available online: https://www.darwinfoundation.org/en/datazone/climate (accessed on 13 January 2021).
- National Geographic. 2019 May Be the Hottest Year Yet—Here’s Why. Available online: https://www.nationalgeographic.com/environment/article/2019-may-be-hottest-year-yet-el-nino-climate-change (accessed on 15 March 2021).
- Sachs, J.P.; Ladd, S.M. Climate and oceanography of the Galapagos in the 21st century: Expected changes and research needs. Galapagos Res. 2010, 67, 50–54. [Google Scholar]
- Hobson, K.A. Tracing origins and migration of wildlife using stable isotopes: A review. Oecologia 1999, 120, 314–326. [Google Scholar] [CrossRef]
- Fraser, K.C.; McKinnon, E.A.; Diamond, A.W.; Chavarría, L. The influence of microhabitat, moisture and diet on stable-hydrogen isotope variation in a Neotropical avian food web. J. Trop. Ecol. 2011, 27, 563–572. [Google Scholar] [CrossRef]
- Voigt, C.C.; Lehmann, D.; Greif, S. Stable isotope ratios of hydrogen separate mammals of aquatic and terrestrial food webs. Methods Ecol. Evol. 2015, 6, 1332–1340. [Google Scholar] [CrossRef]
- Quezada-Romegialli, C.; Jackson, A.L.; Hayden, B.; Kahilainen, K.K.; Lopes, C.; Harrod, C. tRophicPosition, an r package for the Bayesian estimation of trophic position from consumer stable isotope ratios. Methods Ecol. Evol. 2018, 9, 1592–1599. [Google Scholar] [CrossRef]
- Voigt, C.C.; Schneeberger, K.; Luckner, A. Ecological and dietary correlates of stable hydrogen isotope ratios in fur an body water of syntopic tropical bats. Ecology 2013, 94, 346–355. [Google Scholar] [CrossRef]
- Peters, J.M.; Wolf, N.; Stricker, C.A.; Collier, T.R.; Martínez del Rio, C. Effects of trophic level and metamorphosis on discrimination of hydrogen isotopes in a plant-herbivore system. PLoS ONE 2012, 7, e32744. [Google Scholar] [CrossRef]
- Magozzi, S.; Vander Zanden, H.B.; Wunder, M.B.; Bowen, G.J. Mechanistic model predicts tissue–environment relationships and trophic shifts in animal hydrogen and oxygen isotope ratios. Oecologia 2019, 191, 777–789. [Google Scholar] [CrossRef]
- Poage, M.A.; Chamberlain, P. Empirical relationships between elevation and the stable isotope composition of precipitation and surface waters: Considerations for studies of paleoelevation change. Am. J. Sci. 2001, 301, 1–15. [Google Scholar] [CrossRef]
- Bond, A.L.; Jardine, T.D.; Hobson, K.A. Multi-tissue stable-isotope analyses can identify dietary specialization. Methods Ecol. Evol. 2016, 7, 1428–1437. [Google Scholar] [CrossRef]
- De León, L.F.; Sharpe, D.M.T.; Gotanda, K.M. Urbanization erodes niche segregation in Darwin’s finches. Evol. Appl. 2018. [Google Scholar] [CrossRef] [PubMed]
- Hendry, A.P.; Grant, P.R.; Grant, B.R.; Ford, H.A.; Brewer, M.J.; Podos, J. Possible human impacts on adaptive radiation: Beak size bimodality in Darwin’s finches. Proc. R. Soc. B 2006, 273, 1887–1894. [Google Scholar] [CrossRef]
- Hobson, K.A.; Slater, G.L.; Lank, D.B.; Milner, R.L.; Gardiner, R. Agricultural lands subsidize winter diet of the dunlin at two major estuaries. Condor 2013, 115, 515–524. [Google Scholar] [CrossRef]
- Mason, N.A.; Unitt, P.; Sparks, J.P. Agriculture induces isotopic shifts and niche contraction in Horned Larks (Eremophila alpestris) of the Colorado Desert. J. Ornithol. 2020. [Google Scholar] [CrossRef]


| n | δ13C Mean ± SD | δ15N Mean ± SD | δ2H Mean ± SD | ||
|---|---|---|---|---|---|
| LIVE BIRDS (N = 231) | |||||
| Per species: | |||||
| Species | Common name | ||||
| Geospiza fuliginosa | Small Ground Finch (SGF) | 83 | −20.18 ± 3.53 a | 9.67 ± 1.53 a | −54.33 ± 9.95 b |
| Geospiza fortis | Medium Ground Finch (MGF) | 51 | −22.07 ± 2.17 ab | 9.93 ± 1.32 a | −56.74 ± 9.53 bc |
| Geospiza magnirostris | Large Ground Finch (LGF) | 27 | −20.96 ± 2.01 ab | 9.83 ± 2.02 a | −64.17 ± 8.22 c |
| Geospiza scandens | Common Cactus Finch (CF) | 9 | −19.27 ± 3.39 a | 10.84 ± 2.13 a | −50.77 ± 13.93 ab |
| Camarhynchus parvulus | Small Tree Finch (STF) | 32 | −21.78 ± 2.88 ab | 10.33 ± 2.20 a | −47.88 ± 8.56 ab |
| Camarhynchus pallidus | Woodpecker Finch (WF) | 6 | −22.82 ± 1.16 ab | 11.12 ± 1.80 a | −40.91 ± 7.52 a |
| Certhidea olivacea | Green Warbler Finch (GWF) | 10 | −23.85 ± 0.70 b | 10.76 ± 1.01 a | −47.86 ± 6.27 ab |
| Platyspiza crassirostris | Vegetarian Finch (VF) | 13 | −21.45 ± 1.46 ab | 10.13 ± 1.26 a | −54.59 ± 9.78 bc |
| Per guilds: | |||||
| Granivorous (SGF, MGF) | 134 | −20.89 ± 3.21 a | 9.77 ± 1.45 b | −55.25 ± 9.52 b | |
| Herbivorous (LGF, CF, VF) | 65 | −20.15 ± 3.13 a | 10.41 ± 2.04 ab | −58.99 ± 11.05 c | |
| Insectivorous (STF, GWF, WF) | 51 | −22.23 ± 2.52 b | 10.61 ± 1.97 a | −46.62 ± 8.53 a | |
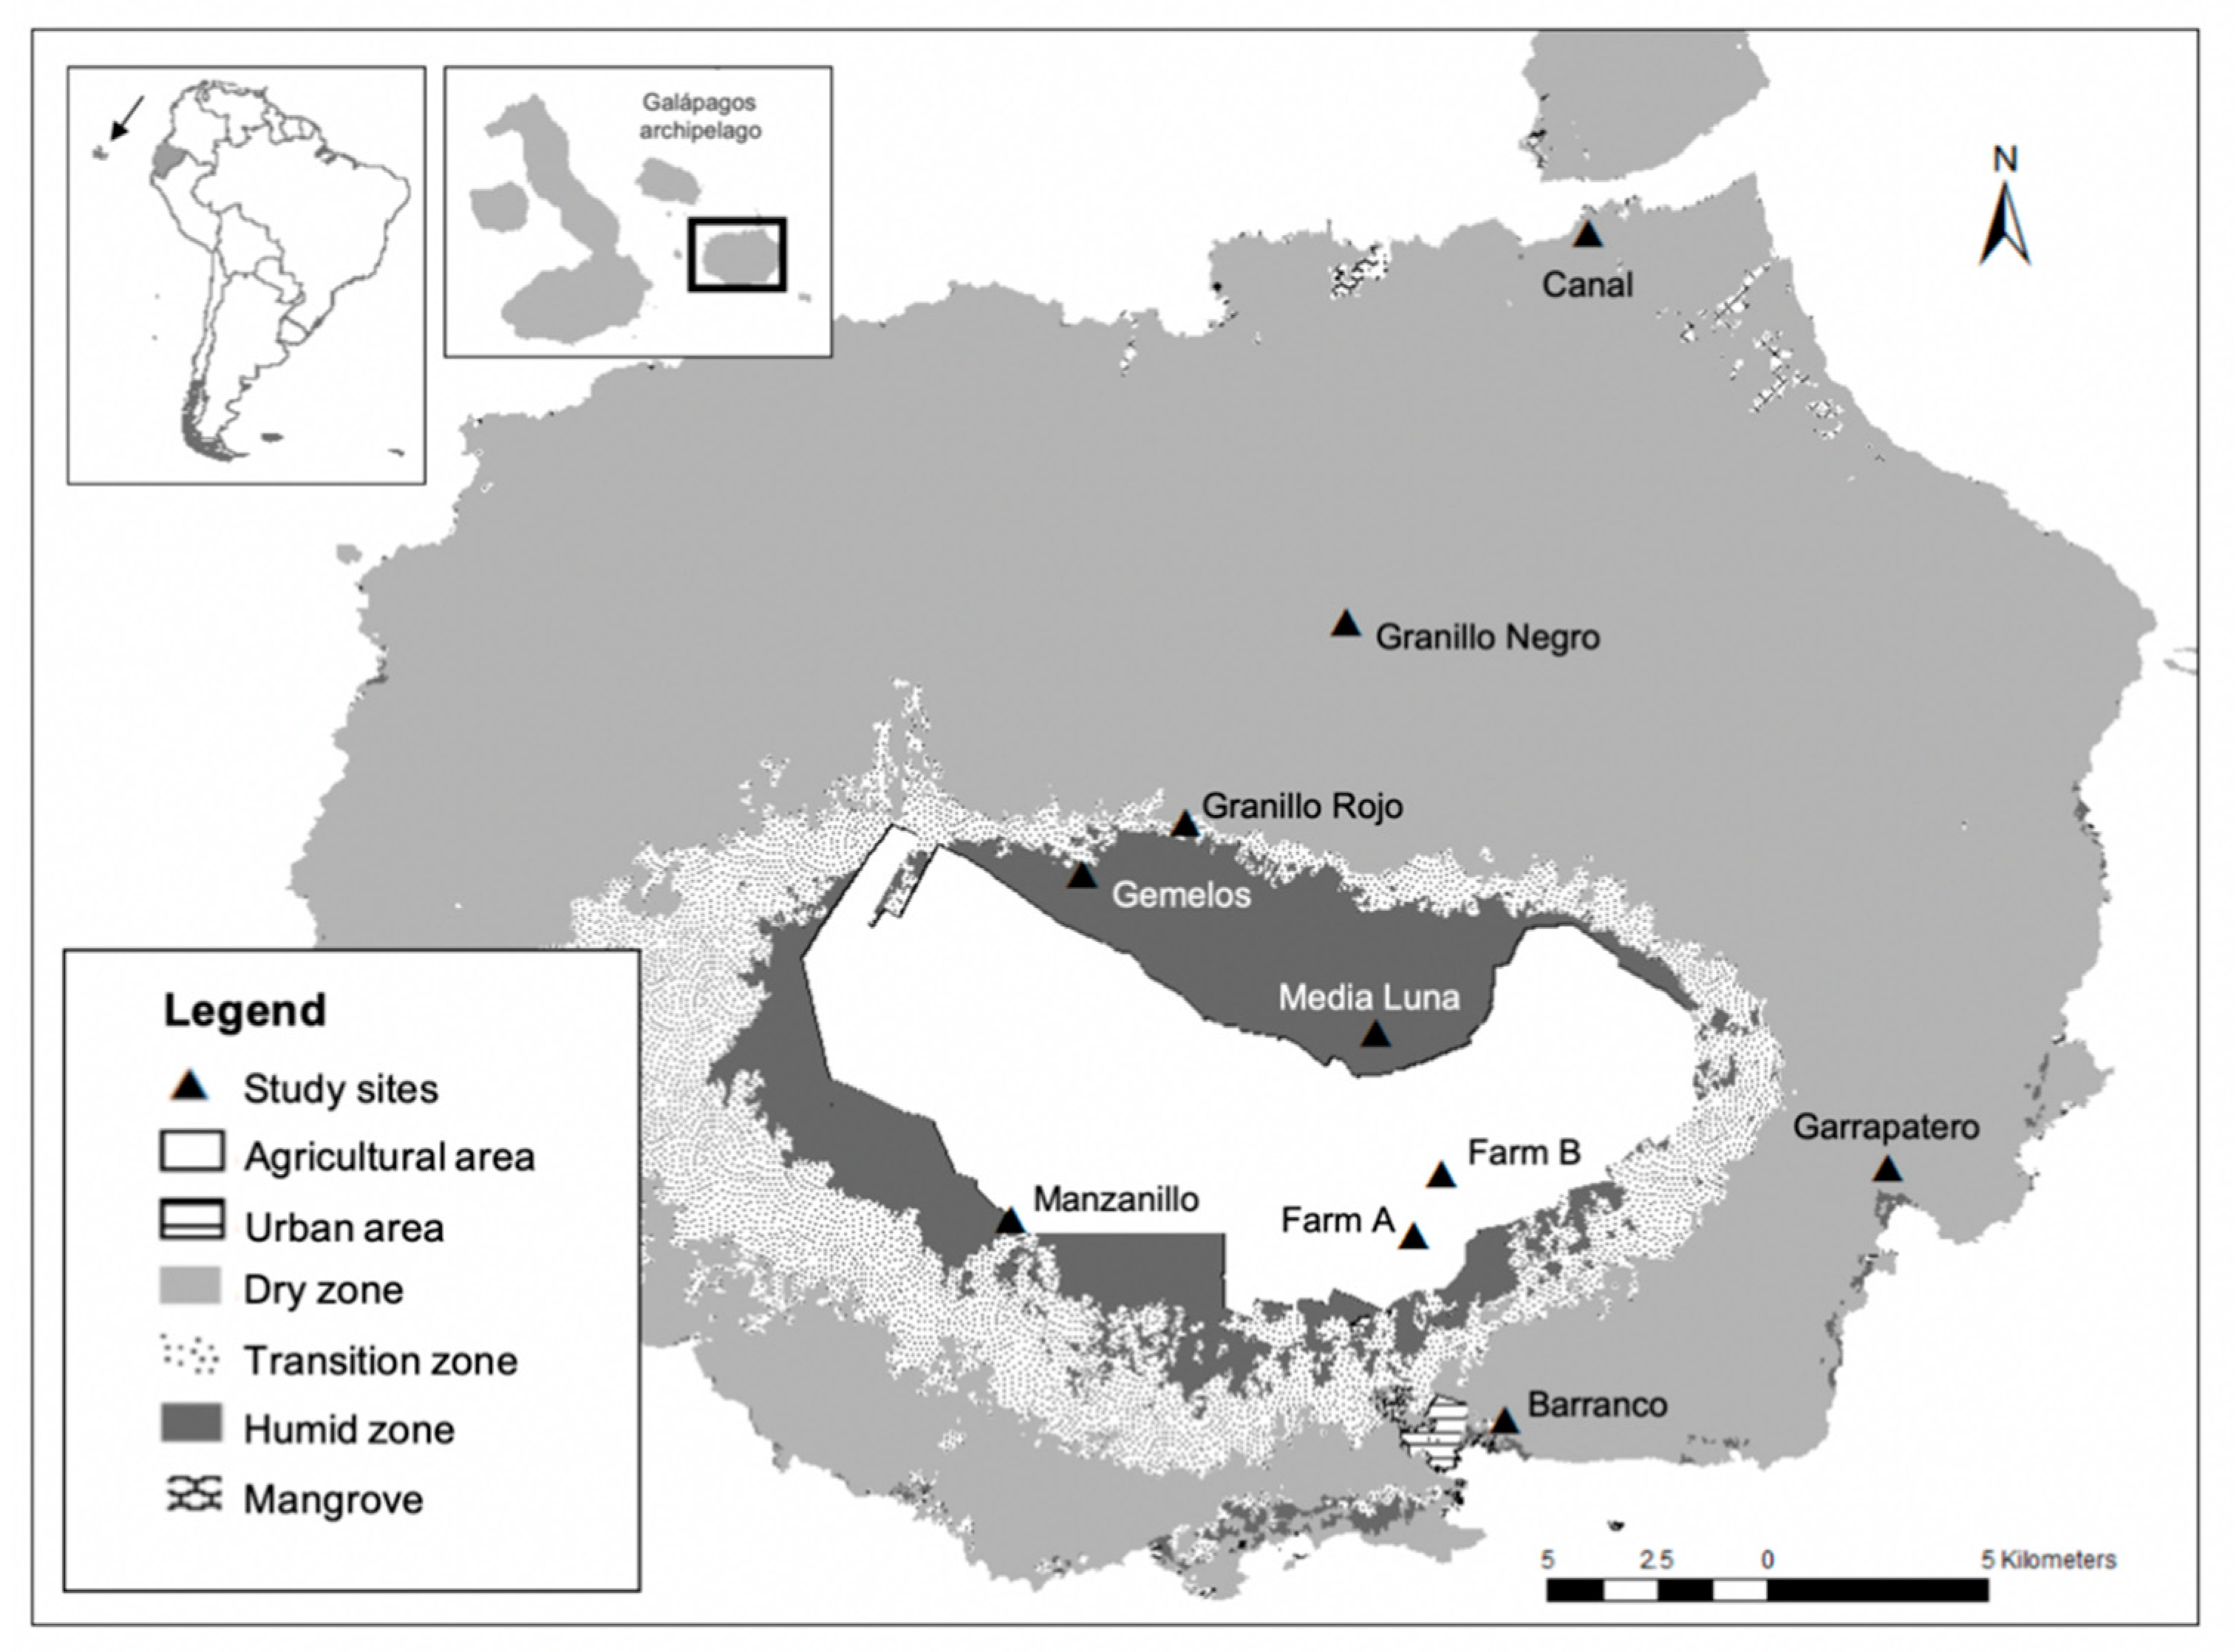
| Per habitats: | |||||
| Dry Zone | 85 | −20.77 ± 2.72 ab | 10.17 ± 1.37 a | −53.36 ± 10.80 a | |
| Transition zone | 49 | −22.19 ± 2.62 c | 10.05 ± 1.97 a | −54.85 ± 10.97 a | |
| Humid zone | 53 | −21.91 ± 2.62 bc | 9.96 ± 1.92 a | −55.95 ± 10.99 a | |
| Agricultural areas (farms) | 44 | −19.91 ± 3.52 a | 9.64 ± 1.55 a | −53.87 ± 6.51 a | |
| MUSEUM SPECIMENS (N = 19) | |||||
| Species | Common Name | ||||
| Geospiza magnirostris | Large Ground Finch (LGF) | 9 | −20.15 ± 1.47 | 9.83 ± 1.21 | −65.81 ± 4.36 |
| Geospiza scandens | Common Cactus Finch (CF) | 7 | −15.77 ± 5.88 | 13.35 ± 1.67 | −48.97 ± 9.13 |
| Camarhynchus parvulus | Small Tree Finch (STF) | 3 | −20.54 ± 1.42 | 12.08 ± 2.08 | −40.53 ± 13.37 |
| Model | AICc | Delta AICc | Weight |
|---|---|---|---|
| (A) Live birds (N = 231) | |||
| δ13C~Mass + Species + Site | 1121.12 | 0.00 | 0.674 |
| δ13C~Mass + Guild + Habitat | 1123.87 | 2.75 | 0.170 |
| δ13C~Species + Altitude + Habitat | 1125.09 | 3.97 | 0.092 |
| δ13C~Species + Habitat | 1127.84 | 6.72 | 0.023 |
| δ13C~Habitat + Site + Species | 1128.39 | 7.27 | 0.018 |
| δ13C~1 | 1159.05 | 37.93 | <0.001 |
| δ15N~Mass + Guild + Habitat | 892.46 | 0.00 | 0.452 |
| δ15N~Mass | 895.02 | 2.56 | 0.125 |
| δ15N~Guild + Altitude | 895.43 | 2.96 | 0.102 |
| δ15N~Guild | 895.69 | 3.23 | 0.089 |
| δ15N~1 | 899.54 | 6.42 | 0.018 |
| δ2H~Mass + Species + Site | 1658.24 | 0.00 | 0.951 |
| δ2H~Species + Altitude + Habitat | 1664.43 | 6.18 | 0.043 |
| δ2H~Habitat + Site + Species | 1670.11 | 11.87 | 0.002 |
| δ2H~Species + Site | 1670.11 | 11.87 | 0.002 |
| δ2H~1 | 1749.64 | 91.40 | <0.001 |
| (B) Species with live and museum data (N = 85) | |||
| δ13C~Species + Habitat | 426.77 | 0.00 | 0.194 |
| δ13C~Habitat + Site | 427.00 | 0.23 | 0.173 |
| δ13C~Site | 427.00 | 0.23 | 0.173 |
| δ13C~Guild + Site | 427.16 | 0.38 | 0.159 |
| δ13C~1 | 447.02 | 20.24 | <0.001 |
| δ15N~Origin + Species | 370.48 | 0.00 | 0.305 |
| δ15N~Species + Habitat | 371.63 | 1.15 | 0.172 |
| δ15N~Species + Altitude | 372.88 | 2.39 | 0.092 |
| δ15N~Species + Altitude + Guild | 372.88 | 2.39 | 0.092 |
| δ15N~1 | 378.99 | 8.51 | 0.004 |
| δ2H~Species + Habitat | 612.09 | 0.00 | 0.636 |
| δ2H~Species + Altitude + Habitat | 614.49 | 2.40 | 0.191 |
| δ2H~Guild + Site | 616.59 | 4.50 | 0.066 |
| δ2H~Habitat + Site + Species | 617.32 | 5.22 | 0.046 |
| δ2H~1 | 698.95 | 58.75 | <0.001 |
| Model | F Value | Residual SE | DF | p-Value |
|---|---|---|---|---|
| (A) Live birds (N = 231) | ||||
| δ13C~Species | 4.685 | 2.801 | 223 | <0.0001 |
| δ13C~Guild | 4.928 | 2.905 | 228 | 0.008 |
| δ13C~Habitat | 6.706 | 2.85 | 227 | 0.0002 |
| δ13C~Site | 3.283 | 2.831 | 221 | 0.0008 |
| δ13C~Altitude | 12.03 | 2.886 | 229 | 0.0006 |
| δ13C~Mass | 0.263 | 2.954 | 227 | 0.608 |
| δ15N~Species | 1.716 | 1.664 | 223 | 0.1063 |
| δ15N~Guild | 3.665 | 1.663 | 228 | 0.027 |
| δ15N~Habitat | 0.985 | 1.682 | 227 | 0.4007 |
| δ15N~Site | 1.554 | 1.664 | 221 | 0.131 |
| δ15N~Altitude | 1.372 | 1.681 | 229 | 0.243 |
| δ15N~Mass | 0.0123 | 1.693 | 227 | 0.912 |
| δ2H~Species | 9.326 | 9.745 | 223 | <0.0001 |
| δ2H~Guild | 19.85 | 9.832 | 228 | <0.0001 |
| δ2H~Habitat | 0.707 | 10.63 | 227 | 0.5483 |
| δ2H~Site | 5.265 | 9.82 | 221 | <0.0001 |
| δ2H~Altitude | 17.51 | 10.25 | 229 | <0.0001 |
| δ2H~Mass | 11.82 | 10.38 | 227 | 0.0006 |
| (B) Species with live and museum data (N = 85) | ||||
| δ13C~Species | 9.73 | 2.973 | 84 | 0.0001 |
| δ13C~Guild | 7.16 | 3.15 | 85 | 0.0008 |
| δ13C~Altitude | 2.42 | 3.266 | 83 | 0.1236 |
| δ13C~Origin | 9.83 | 3.105 | 85 | 0.0023 |
| δ15N~Species | 5.689 | 2.081 | 84 | 0.0048 |
| δ15N~Guild | 0.00001 | 2.204 | 85 | 0.9972 |
| δ15N~Altitude | 0.3327 | 2.217 | 83 | 0.5656 |
| δ15N~Origin | 5.344 | 2.138 | 85 | 0.0232 |
| δ2H~Species | 36.05 | 8.978 | 84 | <0.0001 |
| δ2H~Guild | 32.11 | 10.37 | 85 | <0.0001 |
| δ2H~Altitude | 0.1189 | 12.23 | 83 | 0.7311 |
| δ2H~Origin | 0.077 | 12.16 | 85 | 0.7812 |
| Foraging Guild | δ13C~δ15N | δ13C~δ2H | ||
|---|---|---|---|---|
| SEA (‰2) | SEAc (‰2) | SEA (‰2) | SEAc (‰2) | |
| Granivorous | 16.26 | 16.39 | 94.75 | 95.47 |
| Herbivorous | 13.25 | 13.53 | 79.24 | 80.92 |
| Insectivorous | 12.24 | 12.51 | 58.73 | 60.01 |
| Overlap between guilds (in ‰2) | ||||
| Granivorous and herbivorous | 74.30 | 405.72 | ||
| Granivorous and insectivorous | 68.66 | 275.99 | ||
| Herbivorous and insectivorous | 62.67 | 276.45 | ||
Publisher’s Note: MDPI stays neutral with regard to jurisdictional claims in published maps and institutional affiliations. |
© 2021 by the authors. Licensee MDPI, Basel, Switzerland. This article is an open access article distributed under the terms and conditions of the Creative Commons Attribution (CC BY) license (https://creativecommons.org/licenses/by/4.0/).
Share and Cite
Villegas, M.; Soos, C.; Jiménez-Uzcátegui, G.; Matan, S.; Hobson, K.A. Isotopic Niche Segregation among Darwin’s Finches on Santa Cruz Island, Galápagos. Diversity 2021, 13, 147. https://doi.org/10.3390/d13040147
Villegas M, Soos C, Jiménez-Uzcátegui G, Matan S, Hobson KA. Isotopic Niche Segregation among Darwin’s Finches on Santa Cruz Island, Galápagos. Diversity. 2021; 13(4):147. https://doi.org/10.3390/d13040147
Chicago/Turabian StyleVillegas, Mariana, Catherine Soos, Gustavo Jiménez-Uzcátegui, Shukri Matan, and Keith A. Hobson. 2021. "Isotopic Niche Segregation among Darwin’s Finches on Santa Cruz Island, Galápagos" Diversity 13, no. 4: 147. https://doi.org/10.3390/d13040147
APA StyleVillegas, M., Soos, C., Jiménez-Uzcátegui, G., Matan, S., & Hobson, K. A. (2021). Isotopic Niche Segregation among Darwin’s Finches on Santa Cruz Island, Galápagos. Diversity, 13(4), 147. https://doi.org/10.3390/d13040147