Abstract
We conducted a citizen science survey on overwinter honey bee colony losses in Austria. A total of 1534 beekeepers with 33,651 colonies reported valid loss rates. The total winter loss rate for Austria was 15.2% (95% confidence interval: 14.4–16.1%). Young queens showed a positive effect on colony survival and queen-related losses. Observed queen problems during the season increased the probability of losing colonies to unsolvable queen problems. A notable number of bees with crippled wings during the foraging season resulted in high losses and could serve as an alarm signal for beekeepers. Migratory beekeepers and large operations had lower loss rates than smaller ones. Additionally, we investigated the impact of several hive management practices. Most of them had no significant effect on winter mortality, but purchasing wax from outside the own operation was associated with higher loss rates. Colonies that reported foraging on maize and late catch crop fields or collecting melezitose exhibited higher loss rates. The most common Varroa destructor control methods were a combination of long-term formic acid treatment in summer and oxalic acid trickling in winter. Biotechnical methods in summer had a favourable effect on colony survival.
Keywords:
Apis mellifera; varroa control; colony losses; forage; beekeeping; citizen science; overwintering; monitoring 1. Introduction
Apis mellifera, the western honey bee, is not only an important pollinator for wild flowers but also crucial for the pollination of the world agricultural production. It was calculated in 2005 that the estimated economic value of pollinating insects in the European Union equals 14.2 billion euro [1]. The threats for honey bees are increasingly well studied and understood and range from abiotic stressors, such as pesticides, to biotic stressors [2,3,4]. The latter include parasites, pathogens, and pests, like the parasitic mite Varroa destructor or monoculture plantings that influence the quality and richness of forage sources [5]. Further, synergistic effects of single factors may add up to a threat that is greater than the sum of its individual factors. Beekeepers try their best to support their colonies by optimizing their hive management to help them cope with the environmental conditions they are facing. Comparisons of hive management practices of large data sets collected from beekeepers have demonstrated different strategies and consequently different overwintering success [6,7,8,9]. For example, efficient treatments of colonies against varroa mite are necessary, as this parasite is known to reduce winter survival [10,11,12].
Honey bee monitoring via citizen scientist beekeepers or crowdsourcing has been carried out for a couple of years in Austria [13] and other countries [6,7]. It helps to identify potential risk factors and provides a data base to gain a better understanding of honey bee colony losses. Thanks to the nonprofit honey bee research association COLOSS (Prevention of honey bee COlony LOSSes) [14], monitoring of honey bee colonies is done in various European and some non-European countries following international standards [15]. This facilitates the comparison between countries and a joint identification of risk factors [16,17]. The analysis of this data has already revealed successful practices for colony management and identified unfavourable biotic factors, such as crops which negatively influence colony survival [18]. In Austria, a substantial data set, which has been acquired over several years, has already been used to investigate the effect of weather [19] and land use [20] on colony losses.
In contrast to previous COLOSS publications [7,16] that have combined loss rates from countries with quite different environmental conditions and hence are limited in analyses of regional risk factors, we present a complete examination of the data collected within COLOSS for Austria. This complements the last comprehensive risk analysis on Austrian honey bee colony winter mortality published a while ago [13]. We present a study using a large data set obtained by crowdsourcing for winter 2018/2019 in Austria and a substantially improved methodology. The aim is to report internationally comparable loss rates, to identify factors which have negative or positive effects on honey bees, and to reappraise different hive management techniques.
2. Materials and Methods
2.1. Survey Design and Response Rate
Our survey was based on the questions of the international COLOSS questionnaire, which has been translated to German. The questionnaire asks for the number of honey bee colonies wintered and the number of colonies lost with three possible categories (colony dead or reduced to a few hundred bees, lost due to natural disaster (i.e., flooding, falling trees, and vandalism), or alive but with unsolvable queen problems (drone laying queen or no queen at all)) [15]. The number of colonies lost due to natural disaster was not included in the total loss calculation and risk analysis because it is not directly related to biological (i.e., age of queen bees) or operational risk factors in the survey.
Questions on hive management practices are also part of the COLOSS international survey and were used unmodified. These questions concerned topics like the number of the wintered colonies that had a new queen (born and mated 2018), observed queen problems in colonies during foraging season compared to previous seasons, certified organic beekeeping, queens bred from varroa tolerant/resistant stock, hives fabricated from synthetic materials, insulated hives, screened bottom boards, purchase of wax from outside of the own operation (a measure of professionalism and wax quality), natural comb without foundation, small brood cell size, migratory beekeeping, replacement of brood frames (in relative percentage categories), notice of bees with crippled/deformed wings (often, seldom, none, and do not know), and foraging crops perceived by the beekeeper. As for the foraging crops, the participants were asked if the majority of their bee colonies had significantly foraged on one or more of the asked crops (only crops relevant for Austria were listed). The selection of some of these operational factors followed suggestions from beekeepers in previous surveys or discussion groups and were accepted for international use in COLOSS.
An important part of the survey was dedicated to varroa control. Beekeepers could identify if and in which month they monitored varroa infestation level. Additionally, the methods and application time of varroa control were surveyed.
The estimated percentage of beekeepers participating in the survey was calculated with the number of beekeepers and colonies registered at the national beekeeping association (Table 1). Data collection was carried out via an online survey (LimeSurvey Version 3.16.1+) and a questionnaire published in a beekeeping journal and physically handed out at beekeeper meetings. This ensured that also beekeepers without an internet connection had access to the survey [15]. Overall, the survey followed the guidelines of the COLOSS Project rather closely [15]. To guarantee the protection of the participants private data, a data privacy protocol was established between the people involved in the project. All private data was removed when working on the analysis of received survey data and only used to enquire questionable data.

Table 1.
Number and percentage of survey participants in relation to the amount of registered beekeepers with the national beekeeping association “Biene Österreich” (2018): Commercial beekeepers are subsumed as “not specified” due to the absence of state data.
2.2. Data Validation and Error Control
If beekeepers did participate via paper questionnaire, the data was manually transferred to a Microsoft Excel file, where all survey data was collected. Automatic checks with simple formulas in Excel were used to minimize processing errors and to highlight possible invalid responses, i.e., more colonies lost than existent, as described in References [15,16]. These contradictory entries or multiple entries of the same beekeeper were removed. The survey in the beekeeping journal did not cover all the questions that were asked in the internet survey, and omitted answers also led to a reduced number of responses for several questions. If the response for one factor was not enough for statistical analysis, the data was not used. The participants did not disclose the exact location of their apiaries, only the rough area of their main wintering apiary, i.e., district and zip code at minimum. Coordinates for plotting were generated with a batch geolocation finder and, if not feasible, by a manual search. The resulting locations were plotted on a district map and tested for correct assignment to districts as given by the participants in the survey, to minimize incorrect geolocations. The estimation of elevation for the apiary locations was carried out with the topography model SRTM-3v4 via a web service [21].
2.3. Statistical Analysis
The statistical software R [22] and the package ggplot2 [23] were used for data analysis and the construction of graphics and plots. The code is available on GitHub (https://github.com/HannesOberreiter/coloss_honey_bee_colony_losses_austria and version 1.0 is archived [24]) under an open source MIT license. Calculation and estimation of loss rates and corresponding confidence intervals (CI) were computed with a quasibinominal generalized linear model (GZLM) link “logit” function [15]. These calculated estimates are plotted as boxed error bars, where the box represents the 95% CI.
The majority of analyses was done as a single factor with two possible different groups, i.e., yes and no questions. To identify significant differences, the confidence intervals between the variables (factors) were compared. If the confidence intervals did not overlap, we counted that as a significant difference. If the overlap was on a small margin and it was a comparison between two groups, the null deviance minus the residual deviance in the model was tested. If it significantly differed from zero, the analyzed factor in the model had a significant influence on colony survival (ANOVA with deviance, p < 0.05).
The analysis of young queens was only performed for participants with valid answers for the number of colonies and young queens at the onset of winter. The percentage was calculated with declared colonies and divided by young queens. The total young queen population was calculated with these valid answers by summarising all colonies and by dividing them by the total number of young queens going into the winter.
For the analysis of the combination of different varroa control methods, a usage histogram for each method was generated and grouped into spring, summer, and winter. After that, a vector of all applied methods with at least 15 answers and without drone brood removal was generated to minimize calculation time and to generate statistically relevant results. To calculate all possible combinations inside the given vector, the R function combn [25] was used to generate a matrix with up to a maximum of three different methods per row. Then, each row with less than 15 participants for the particular combination was dropped before calculating the loss rate as described before.
The plotted maps were made with R [22] and shapefiles (https://github.com/ginseng666/GeoJSON-TopoJSON-Austria by Floo Perlot, latest commit 2017-11-06) under creative common licence. Aggregation of apiaries on the map was conducted with k-means cluster search method. To improve the accuracy in areas with lower density, the resulting clusters, which included only a single apiary or a low number of apiaries and high within cluster sum of squares, were removed and the original geolocation of the affected apiaries were used for plotting.
3. Results
3.1. Survey Data
The distribution of the number of colonies managed by beekeepers showed that most of the participating beekeepers (50.8%) had between 1–10 colonies (Figure 1A). On the contrary, only 1.7% of the beekeepers had more than 150 colonies but owned 21.5% of the colonies in the survey (Figure 1B). The distribution of losses per individual operation showed a positive skew with more than half (51.4%) of the participating beekeepers loosing between 0–10% of their colonies over the winter period and only 30.3% loosing more than 20% (Figure 1C). The approximate location of the main winter apiary (Figure 1D) showed a nationwide coverage all over Austria, with some areas more dominant than others, which could be traced back to geographical inaccessible areas like mountain ranges. Most participants did use the online form (n = 1378, 90%), while the paper form (n = 93, 6%) and the questionnaire from the beekeeping journal (n = 63, 4%) only accounted for 10% of the responses. The loss rate was not significantly different between online form users 15.4% (95% CI: 14.5–16.3%, n = 1378) and users who responded via paper 13.2% (95% CI: 10.4–16.5%).
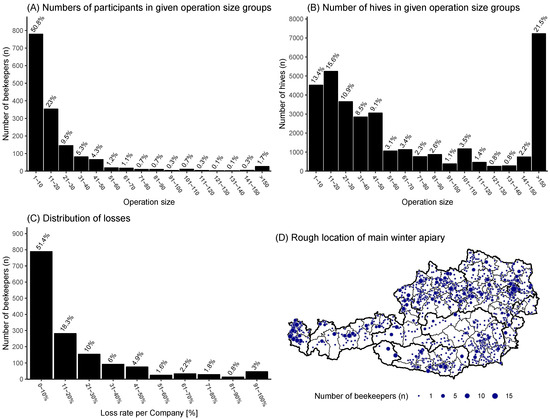
Figure 1.
(A,B) Operation size distribution in the survey: The operation size is the number of colonies owned by the individual beekeeper or beekeeping operation. (C) Distribution of losses in the survey, grouped into 10% loss rate groups. (D) Approximate location of the main winter apiary location: dot size represents number of apiaries in this area.
3.2. Loss Rate Overview
The total colony mortality over the winter period of 2018/2019 in Austria equals 15.2% (95% CI: 14.4–16.1%) (Figure 2A). The survey received valid answers from 1534 beekeepers, which stated that they wintered 33,651 colonies and had lost 5293 colonies over the winter (Table 1). Among these lost colonies, 1304 colonies were reported to struggle due to unsolvable queen-related problems and were counted as losses. Additionally, 60 colonies were lost due to natural disasters, which are not included in our risk analysis. The loss rate of the state Carinthia with 11.5% (95% CI: 9.5–14.0%) is significantly lower than the Austrian average. Burgenland had the lowest loss rate with 9.9% (95% CI: 6.0–15.7%) (Figure 2B) but also had the lowest number of participants (n = 35) and a wide confidence interval. Vienna had the highest loss rate but also the widest confidence interval with 19.6% (95% CI: 14.8–25.4%). The loss rates at the district level were highest for Waidhofen an der Ybbs, Lower Austria with 65.0% (95% CI: 48.6–79.9%, n = 7) and lowest for Tamsweg, Salzburg 0.0% (95% CI: 0.0–100.0%, n = 6).
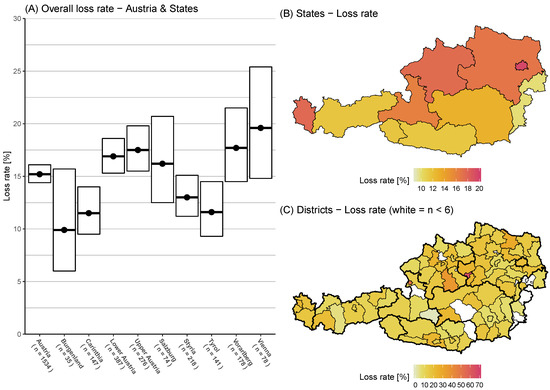
Figure 2.
(A) Austria and its state winter honey bee colony loss rates (and 95% CI) over the winter period of 2018/2019. (B) Map with loss rates colour coded on the Austrian state level. (C) Map with loss rates colour coded on the district level: white spots are n < 6.
The elevation of the main winter apiary location showed significantly lower loss rates for higher elevations (601–800 m: 13.0% (95% CI: 11.3–15.0%), >800 m: 11.8% (95% CI: 9.9–14.0%)) than the middle groups (201–400 m: 17.0% (95% CI: 15.4–18.9%), 401–600 m: 16.6% (95% CI: 15.0–18.2%)). No significant difference can be seen if compared to the lowest elevation group (0–200 m) with 15.4% (95% CI: 12.8–18.4%) (Figure 3).
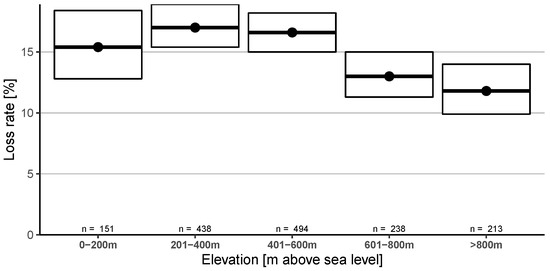
Figure 3.
Winter honey bee colony loss rates (and 95% CI) grouped into five different elevation above sea level categories.
3.3. Queen Management
Colonies, which were still alive post winter but had queen problems that could not be solved by the beekeeper (drone laying queens or no queen at all) were counted as queen-related losses. This accounted for less than half of the combined losses, with an overall loss rate in Austria of 3.9% (95% CI: 3.6–4.1%). Lower Austria, 4.8% (95% CI: 4.3–5.4%), showed a significantly higher queen-related loss rate than the Austrian average (Figure 4A).
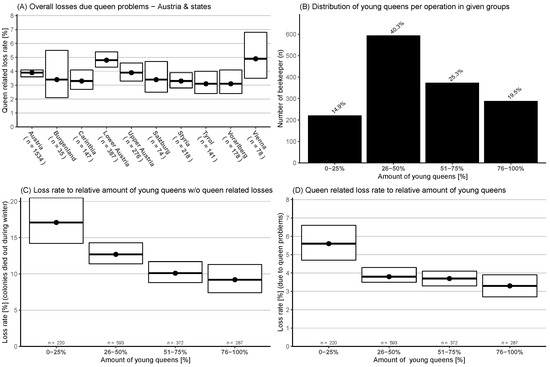
Figure 4.
(A) Queen-related losses (and 95% CI) for Austria and its states. (B) Distribution of survey participants who replaced their old queens in four categories. (C) Categorized relative number of young queens and their winter honey bee colony loss rates (and 95% CI) without queen-related losses. (D) Categorized relative number of young queens and queen-related loss rate (and 95% CI).
The distribution of the survey data showed that most beekeepers (85.1%) did renew more than a quarter of their queens (Figure 4B) and only 14.9% exchanged 0–25%. These result in a young queen percentage in the winter colonies population of about 52.3%. Loss rate without queen-related losses in relation to the relative number of exchanged young queens, categorised in four groups, showed a significant higher loss rate for the first two groups with a lower number of renewed queens (0–25%: 17.1% (95% CI: 14.2–20.5%), 26–50%: 12.7% (95% CI: 11.4–14.3%)). The third group (51–75%) showed a significantly lower loss rate 10.1% (95% CI: 8.8–11.7%) compared to the first group, and the last group (75–100%) with most renewed queens had the lowest loss rate with 9.2% (95% CI: 7.4–11.3%) and was significantly lower than the first two groups (Figure 4C). Colony losses due to queen-related problems, using the same four categories of young queens, showed again a significantly higher loss rate for the first group with a 0–25% exchange rate and with 5.6% (95% CI: 4.7–6.6%) loss rate than the other three groups (26–50%: 3.8% (95% CI: 3.5–4.3%), 51–75%: 3.7% (95% CI: 3.3–4.1%), and 76–100%: 3.3% (95% CI: 2.7–3.9%)) (Figure 4D).
Participants were asked to what extent they observed queen problems in their colonies during the foraging season compared to previous seasons (four categories: more often, normal, more rare, and do not know). Only 7.8% of the participants stated that problems occurred more often, and 80.1% reported less or a normal experience (Figure 5A). There was no significant difference between these categories to loss rate without queen-related losses (Figure 5B). If looking at the queen-related losses in relation to the given categories, the category, “more often” had a significantly higher loss rate with 6.0% (95% CI: 4.8–7.3%) than “more rare” with 3.7% (95% CI: 3.1–4.3%) (Figure 5C).
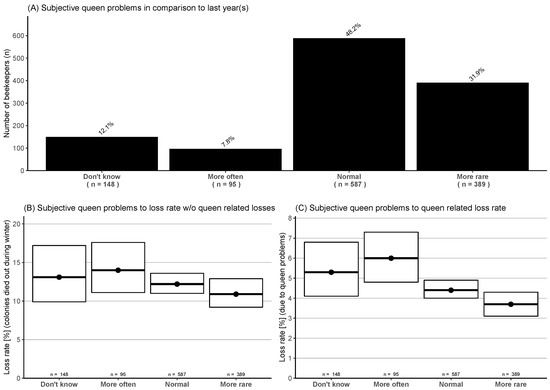
Figure 5.
(A) Rating of observed queen problems during the foraging season in four categories compared to previous season(s). (B) Winter honey bee colony loss rates (and 95% CI) without queen-related losses to queen problem occurrences. (C) Queen-related loss rate (and 95% CI) related to queen problem occurrences.
3.4. Hive Management Practices
Nine operational hive management practices were provided with “yes”, “no”, or “uncertain” as possible options and compared as a single factor to colony mortality (Figure 6). Participants who did migrate their colonies had a significantly lower loss rate 11.3% (95% CI: 10.1–12.7%) than the ones who did not migrate their colonies 17.3% (95% CI: 16.3–18.5%) (Figure 6B). If beekeepers purchased wax from outside their own operation, they had a significantly higher loss rate 17.4% (95% CI: 15.8–19.2%) than participants with their own wax 14.0% (95% CI: 13.0–15.1%) (Figure 6G). No other significant effect of an operational factor on winter loss rate was found (Figure 6). The highest number of participants answering “uncertain” (n = 124, 9.3%) was recorded for the question whether small brood cell size was used.
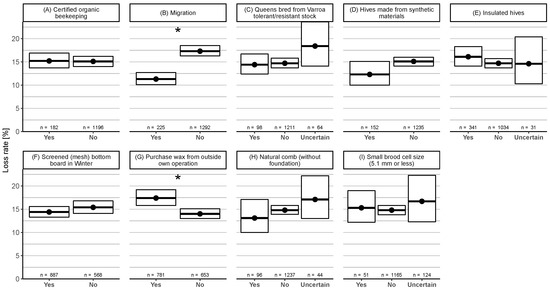
Figure 6.
Winter honey bee colony loss rates (and 95% CI) for nine different hive management practices with three possible answers: “yes”, “no”, or “uncertain”. These were compared as single factors to the loss rates. The category “uncertain” was removed from the plot when there were less than 30 answers.
Another question concerned the amount of old brood frames that were exchanged in the previous summer (Figure 7). The four categories in the survey were compared, which provided us with the relative amount of renewed brood frames by the participants. Higher exchange rates (>30%) showed a trend to lower loss rate but with no significant difference between the categories (Figure 7).
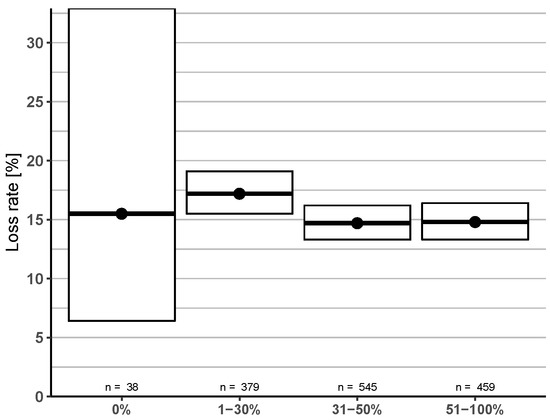
Figure 7.
Comparison between relative amount of exchange rate of old brood frames in four given percentage groups and corresponding winter honey bee colony loss rates (and 95% CI).
Reports categorized by operation size showed a significantly higher loss rate for beekeepers with 1–25 colonies (17.5%, 95% CI: 16.0–19.1%) over participants with 26–50 colonies (13.0%, 95% CI: 11.4–14.7%) and over 50 colonies (14.5%, 95% CI: 13.3–15.9%) (Figure 8).
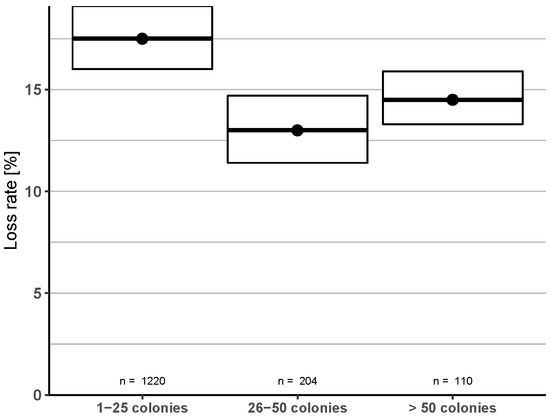
Figure 8.
Categorized operation size groups and their winter honey bee colony loss rates (and 95% CI): The number of reported colonies before the onset of winter (2018) were used for the grouping.
3.5. Forage as Risk Factor
Participants were asked in the survey if their bees foraged on the following sources in 2018: oilseed rape (Brassica napus), maize (Zea mays), sunflower (Helianthus annuus), late catch crop, honeydew, and melezitose.
Significantly higher loss rates were observed with melezitose (yes: 17.4% (95% CI: 15.4–19.5%), no: 14.1% (95% CI: 13.1–15.3%)) (Figure A1F) and late catch crop (yes: 15.9% (95% CI: 14.5–17.3%, = 29.2, p < 0.05), no: 13.4% (95% CI: 12.0–15.0%)) (Figure A1D), and colonies with bees reported foraging in maize fields (yes: 18.1% (95% CI: 15.0–21.8%), no: 13.8% (95% CI: 12.7–14.9%)) (Figure A1B).
No difference was observed for rapeseed (yes: 16.5% (95% CI: 14.7–18.6%), no: 14.6% (95% CI: 13.5–15.8%)) (Figure A1A), sunflower (yes: 15.9% (95% CI: 13.9–18.1%), no: 14.9% (95% CI: 13.8–16.1%)) (Figure A1C), and honeydew (yes: 13.9% (95% CI: 12.5–15.5%), no: 15.5% (95% CI: 14.2–16.8%)) (Figure A1E).
The spatial distribution of the crops as reported by beekeepers revealed an aggregation of oil seed rape in Upper Austria and Lower Austria (Figure A1G). Most sunflower fields were present in Lower Austria (Figure A1I). Late catch crop and honeydew occurred all over Austria (Figure A1J,K). Melezitose occurred predominantly in Styria and Carinthia (Figure A1L).
3.6. Varroa Control
3.6.1. Overview
Participants reported the number of sighted bees with crippled/deformed wings in four categories. There was a significantly higher loss rate in the category “often” 36.3% (95% CI: 28.0–45.5%) than in “seldom” 16.8% (95% CI: 15.4–18.3%). The category “seldom” was also significantly higher than “none” with 13.5% (95% CI: 12.5–14.7%) (Figure 9B).
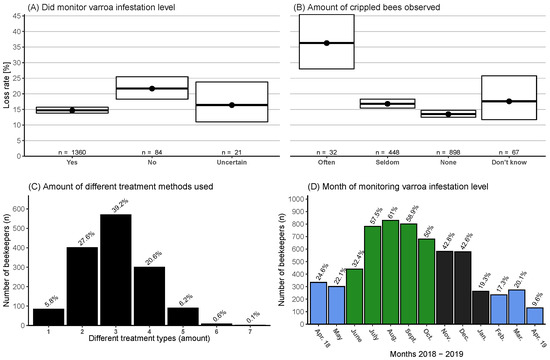
Figure 9.
(A) Categories for if monitoring for varroa mites during the period April 2018–April 2019 was practiced and the corresponding winter honey bee colony loss rates (and 95% CI). (B) If and how often the participants noticed bees with crippled/deformed wings in their colonies (during summer season) in four categories and their loss rate (and 95% CI). (C) Distribution of how many different treatment methods (including drone brood removal) per operation were used, i.e., formic acid—short term and thymol would be two. (D) Histogram of which months monitoring of varroa infestation level (e.g., counting mite fall) was done and by how many beekeepers (n = 1360) in the survey. Spring, summer, and winter are color coded; see Figure 10.
Beekeepers who monitored varroa infestation level had a significantly lower loss rate at 14.7% (95% CI: 13.8–15.7%) than those that did not at 21.7% (95% CI: 18.3–25.5%) (Figure 9A). The monitoring of varroa infestation level was primarily performed in the months between July and October (Figure 9D).
Varroa control information was provided by 1455 participants. Most beekeepers (87.4%) used between two and four different treatment methods (Figure 9C). The most common treatment in spring (April–May) was drone brood removal (Figure 10A). In summer (June–October) the prevalent treatment was formic acid, with more participants using a long-term than short-term method (Figure 10C,D). In the autumn/winter period (November–January), oxalic acid treatment in its various forms was the most dominant (Figure 10B,E,F). Lactic acid, synthetic methods (including Amitraz, Coumaphos, and other synthetic methods), and “another method” (without synthetic methods) were the least common used treatments in the survey (Figure 10J–L).
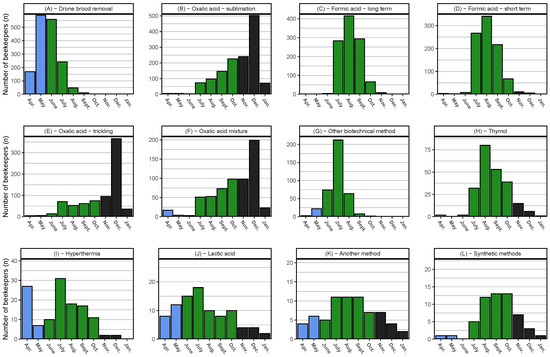
Figure 10.
Varroa control methods and their month of usage as histograms starting with April 2018 and sorted by total frequencies. (L) “Synthetic methods” are combined and include Amitraz, Coumaphos, and “other synthetic methods”; (G) “other biotechnical methods” do not include drone brood removal or hypothermia; and (K) “another method" excludes synthetic methods. We defined April–May as spring (blue), June–October as summer (green), and November–January as autumn/winter (black). The months February, March, and April 2019 are excluded. The Y-axis has separate scales for each treatment. n = 1455 participants.
3.6.2. Treatment as Single Factor
The colony loss rates of operations with different treatment methods were compared. Methods were grouped into spring, summer, and winter according to the month of usage (Figure 10). Within the groups, we did not differentiate if the same treatment methods were used multiple times by any given beekeeper, only if they were performed.
In spring (April–May), four control methods were applied by at least 20 participants (Figure A2). Results of drone brood removal as a single factor is discussed in the next section. The application of the other three spring control methods (hyperthermia, other biotechnical method, and oxalic acid trickling) had no significant effect on winter loss rates.
For summer (June–October), eleven treatment methods (yes = n > 19) were compared (Figure A3). Significantly lower loss rates were found for participants using other biotechnical methods (13.1%, 95% CI: 11.7–14.8%) than for those participants not using them (16.2%, 95% CI: 15.2–17.4%) (Figure A3C). Participants who performed oxalic acid trickling (including oxalic acid mixtures) in summer had a significantly higher loss rate (17.4%, 95% CI: 15.7–19.4%) compared to those who did not use this treatment method (14.6%, 95% CI: 13.7–15.7%) (Figure A3H).
Only oxalic acid methods (sublimation and trickling) were applied in winter (November–January) with a minimum of 20 reports. No significant differences between the application or non-application of these methods were found (Figure A4).
3.6.3. Drone Brood Removal Combination
Drone brood removal performed only in spring, only in summer, and in both seasons did not have an effect on winter losses compared to no drone brood removal at all. Removing drone brood only in summer was significantly worse (17.6%, 95% CI: 15.3–20.3%) than drone brood removal in spring and summer (13.3%, 95% CI: 11.8–15.0%) (Figure 11).
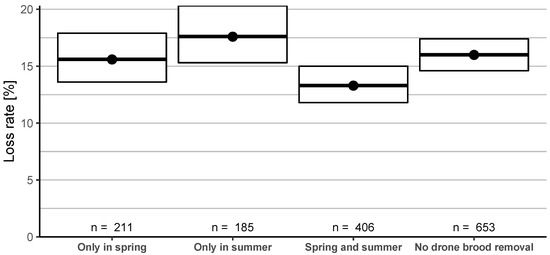
Figure 11.
Winter honey bee colony loss rates (and 95% CI) in dependence of drone brood removal performed only in spring, only in summer, in spring and summer or not performed at all.
Drone brood removal as a single factor in spring (which includes also the abovementioned beekeepers that apply this treatment in both spring and summer) resulted in a just significant effect compared to those not removing drone brood in spring: confidence intervals are overlapping (yes: 14.1% (95% CI: 12.8–15.4%), no: 16.3% (95% CI: 15.1–17.5%)) (Figure A2A), but = 29.7 (p < 0.05). In summer, no significant difference was found between whether beekeepers applied this control method.
3.6.4. Treatment Combinations
To gain a more thorough understanding of the used methods, their combinations, and their success, all possible combinations of different treatment methods were calculated. How the combinations were generated and selected is described in the Materials and Methods section. The used letters and abbreviations for the generated treatment combinations as seen in Figure 12 are explained in Table 2.
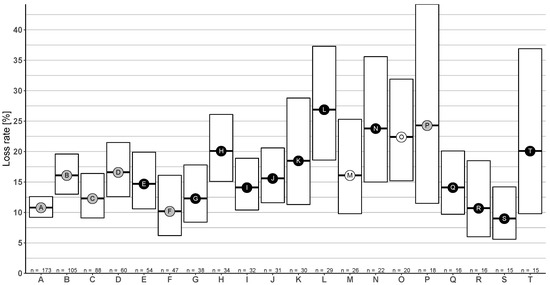
Figure 12.
Winter honey bee colony loss rates (and 95% CI) resulting from combinations of various varroa control methods ordered by number of participants using the given combination: The point fill colour represents the number of different methods (single method = white, two methods = gray, and three methods = black). Please refer to Table 2 for explanation of the combination letter.

Table 2.
This table shows the 20 most used combinations of treatment methods in the survey (n > 14), ordered by number of participants using the combination from highest to lowest for summer (June–October) and Winter (November–January).
The most used method combination in the survey was (A) formic acid—long term in summer—and oxalic acid—trickling in winter. It showed the smallest confidence interval and significantly lower loss rate of 10.8% (95% CI: 9.2–12.6%) than the second most frequent combination (B) formic acid—short term in summer—and oxalic acid—trickling in winter—with 16.1% (95% CI: 13.0–19.6%), combination (D) formic acid—short term in summer—and oxalic acid—sublimation in winter—with 16.6% (95% CI: 12.6–21.5%), and the combination (H) formic acid—long term in summer—and oxalic acid—sublimation in winter and summer with—20.1% (95% CI: 15.1–26.1%). The highest loss rates were observed for (L) formic acid—short term in summer—and oxalic acid—trickling in summer and winter—with a loss rate of 26.9% (95% CI: 18.6–37.3%), combination (N) formic acid—long term—and biotechnical method in summer followed by oxalic acid—trickling in winter—with 23.8% (95% CI: 15.0–35.6%) and the single treatment (O) formic acid—short term in summer—with 22.4% (95% CI: 15.2–31.9%). The widest confidence interval was observed for the combination (P) oxalic acid—trickling in summer and winter—with a loss rate of 24.3% (95% CI: 11.5–44.2%).
Thymol was only found in one of the generated combinations: (T) thymol in summer and oxalic acid—trickling in summer and winter—resulting in a loss rate of 20.1% (95% CI: 9.8–36.9%).
4. Discussion
4.1. Survey Data and Overall Losses
Compared to previous years, honey bee colony winter mortality in Austria 2018/2019 was at an average [26]. The individual loss rates in the survey are not normally distributed (Figure 1C), which is one of the reasons why a GZLM was used for the analysis [15]. More than half of the participants (69.7%) suffered no losses at all or a loss rate lower than 20%. Therefore, it should be feasible for the majority of beekeepers with lower losses to restock the lost colonies by themselves over the next summer season [13]. A multiple winter analysis revealed that, after winters with high losses, more new colonies are created over the summer season and low loss winters result in lower net gain of new colonies in the following season [26].
The variation of loss rates in different states does not seem to be a phenomenon restricted to Austria but can also be observed in the Czech Republic or the USA, where different regions show contrasting loss rates [6,26,27]. In other studies, this was explained by the fact that different regions consist of a divergent composition of landscape which could influence honey bee colony development and winter mortality [20,28]. In addition to this, weather effects have been found to influence colony survival [19]. Weather conditions also influence the hive management practices and varroa treatments examined in this article, but this lies beyond the scope of this study.
Different loss rates with respect to the elevation above sea level of the main winter apiary locations could be explained by more than one factor (Figure 3). One of those could be the climatic difference between elevation groups. In a previous study conducted in Austria, colder mean temperatures in September did result in lower overwintering loss rates [19]. Colder temperatures could infer longer winters and, therefore, a shorter breeding season, which results in lower varroa mite pressure. As mentioned before, the change in landscape could also play a role [20]. The latter study showed that semi-natural areas, pastures, and coniferous forests had a positive effect on colony survival in Austria. The lower loss rates with wintering colonies above 600 m elevation could further be explained by fewer honey bee colonies in higher regions and, connected to this, lower spread of viruses or other bee pathogens [29,30,31].
4.2. Queen Management
Queen problems after winter and winter colony loss rate are influenced by many factors, such as biological causes or beekeeping management practices [2,32,33]. Compared to previous years, the special case of winter colony losses due to unsolvable queen problems (living colonies without a laying queen or a drone laying queen) seem stable within 3.6–4.4% [26] and are similar to many other countries participating in COLOSS surveys, with 4–5% [17]. Only 7.8% of the participants experienced more queen problems in their colonies during the 2018 foraging season compared to what they usually observed (Figure 5A). More queen-related problems seemed to go hand in hand with a higher queen-related loss rate after winter (Figure 5B). A study from the USA identified “queen events”, i.e., colonies with emergency or supersedure queen cells, as a significant negative factor for colony survival [34]. Possible causes for more queen problems could be led back to neonicotinoids [35] or even package transport of queen bees [36]. These findings and the given results underline the importance of queen bees to colony success [33].
One of the biological influences is likely the age of queen bees going into winter. Several studies found that old queens lower the chance of colony survival [11,12,18,37]. Interestingly, we found significantly lower queen-related losses and winter colony losses (excluding queen-related losses) when the participants exchanged more than one-fourth of their old queens with younger ones in the season before winter (Figure 4C,D). This is in accordance with References [11,18], where each percentage of new queens resulted in a small increase of colony survival. Thus, we conclude that a healthy young and well-mated queen is an important factor for overwintering survival and colony health, probably because a younger queen can build a stronger colony than an older queen [33,38]. Therefore, to replace old queens each year seems to be practical and could lower the winter loss rate [11,37].
4.3. Hive Management Practices
Beekeeping management practices and operational factors are directly influenced by the individual beekeeper [39]. In international analyses of COLOSS surveys, large sample sizes are used to identify beekeeping practices that reduce colony mortality [7]. The power of big data sets (with varying participation from different countries) may obscure regionally important results. We therefore use the opportunity to investigate the efficacy and importance of hive management practices for Austria.
We found a lower winter colony loss rate for migratory beekeeping operations compared to non-migrating operations (Figure 6B). The reasons for this could be that migratory beekeepers are more experienced and that migrated colonies have access to better foraging sources [18]. In Austria, colonies are mainly migrated to harvest special honeys, while migrating colonies for paid pollination service is rarely utilized. However, this effect was not consistently found in Austria for some previous investigations [13,40]. In a multi-country analysis of the winter season of 2016/2017 [16], most countries, including Austria, did show no significant difference between migrating and non-migrating beekeepers; however, in the following year, an effect could be found [17]. US beekeepers that migrated their colonies into almond fields experienced a higher total loss rate for the winter 2007/2008 [6]. In contrast to this, two years later, the results indicated significantly lower total losses [27].
Due to the fact that most beekeepers in Austria are hobbyists or sideline beekeepers, the operation size of most participants is relatively small [13]. Hence, most survey participants own a small amount of the total colonies whereas a small number of participants own a significant amount of colonies in Austria (Figure 1A,B). Significant different loss rates among operation sizes were already demonstrated before [12,13,17,41]. Beekeepers with a smaller number of colonies are at a greater risk of losing their colonies (Figure 8). Beekeepers who manage more colonies are likely to have better training and more experience than hobbyist beekeepers, a hypothesis supported by another Austrian study [12].
Over the years of conducting this survey, beekeepers requested to further investigate effects of some operational factors, which they thought might mitigate colony losses. Of these operational factors, only one could be statistically verified, underlining the importance of wax for honey bee health. If participants did purchase wax from outside their own operation, they had a higher loss rate than beekeepers using only their own wax. Bees are exposed to various pesticides, and beeswax, due to its chemical character, is the most contaminated beehive matrix and a bio accumulator of acaricides, fungicides, and insecticides over years [42]. Residues in the wax are frequently found in multiple countries [43,44]. A study in which beeswax foundations were artificially contaminated with pesticide resulted in no negative effect on colony survival [45] but could still influence the survival of bees in addition with other factors. Viruses and spores have also be found in beeswax, and it can therefore pose as a possible viral reservoir [46]. In the cited study, the removal of viral pathogens from old frames did not make a significant difference in the probability of colony survival, and varroa and its varroa-transmitted viruses were considered the greater problem [46]. However, removing pathogens still lowered the chance of infected emerging broods. Commercial wax producers do commonly heat the wax to eliminate American foulbrood spores, which also can remove other pathogens, but this has no effect on pesticides [44]. Thus, the reason why participants who purchased wax from outside their own operation had a higher loss rate is not entirely clear to us. It is possible that participants who bought wax from outside their own operation are beginners who do not possess the equipment or resources for executing their own wax cycle. The result of our study suggests that the factor “buying-in wax” may be a proxy for a certain management or degree of professionalism. We suggest further investigation of wax quality and origin as a risk factor for honey bee colony losses. Overall, colonies with new combs are healthier than colonies with old combs [47,48]. Nevertheless, the sourcing and previous treatment of foreign wax could be an important factor to lowering the amount of residue in colonies near agriculture fields.
We found no difference in winter loss rate between colonies on natural comb or on a foundation of wax (Figure 6H). Replacing old brood frames had no significant influence on colony survival but showed a tendency for lower loss rates with exchange rates above 30% (Figure 7). Comparing this year to the previous years in Austria (2013/14, 2014/15, 2015/16, and 2016/17) two of the years showed a significantly lower loss rate while the other two did not [40]. One possible explanation for this fact could be the varroa treatment strategy “other biotechnical methods” and the lower loss rate associated with this method (Figure A3C), which often includes removal of old brood frames as a side effect.
Certificated organic beekeeping or nonorganic operations had no different probability of honey bee colony winter loss (Figure 6A). The European organic regulation (EC No. 834/2007, 889/2008) is the minimum standard for other organic authorities in the EU. The main restrictions for organic certified beekeepers are the mandatory use of organic certificated sugar/syrup for feeding, the prohibition for the use of synthetic treatments against mites or other pests, and the compulsory use of comb wax from organic beekeeping operations [49]. The location of organic certified apiaries could influence the winter loss rate but is not well defined in the organic regulation and can be differently interpreted by organic control bodies; the same can be said for wax which should be free of contamination by substances not authorized for organic production [49]. As the number of survey participants using synthetic treatments was quite low (Figure 10L) [26], we conclude that feeding and wax quality are the only major differences between conventional and organic beekeeping in our study.
The type of hive (hives fabricated from synthetic materials, insulated hives, or open screened bottom board in winter) had no negative or positive influence on the loss rate (Figure 6D–F). Previous analysis of these factors in Austria came to the same conclusion [40]. A study in Spain examined the temperature and humidity in hives with open screened bottom boards and without, but there seems to be no crucial difference between the hive types regarding colony health [50]. Naturally, the lowest outside temperature in this experiment was around 7 °C and is not comparable to cold winter periods in Austria.
Breeding lines with queens bred from varroa tolerant/resistant stocks had no different colony mortality than others (Figure 6C). Such breeding lines are often selected based on the amount of removed damaged brood, for example, via freeze-killed brood assay. In field studies from the US, such lines showed reduced mites in worker brood and adult bees [51]. Beekeepers from the US with varroa resistant bee stocks also experienced lower loss rates than those without [52]. It is probably difficult for the individual beekeeper to check if most of their honey bees have traits favourable for survival, but it shows that more research on this topic is needed.
It should be discussed for future surveys if beekeeping management questions, which obviously do not influence the colony survival over winter in multiple years and countries, should be removed to minimize the amount of time spent by the participants to conclude the survey. However, these factors could still have an effect in combination with other factors. On the other hand, most of the questions discussed in this section resulted from participatory processes and reflect the interest of beekeepers.
4.4. Forage as Risk Factor
Colonies reported to be foraging on maize showed significantly higher winter loss rates compared to colonies that did not (Figure A1B). Maize does not produce nectar but pollen, which can be directly collected by bees; however, it is not a preferred source for honeybees [53,54]. Still, some cases of colonies collecting large amounts of maize pollen have been documented in Austria [55]. A possible explanation for the higher loss rate could be pesticide contaminated pollen, residues in guttation water, or other indirect ways of getting into contact with agriculture chemicals used in maize fields [18,54,56]. Other reasons for our result include poor landscape for foraging with a lot of maize fields nearby, which presumably increases honey bees collecting poor-quality maize pollen or guttation water as well as the lack of nutritive pollen [18,57]. Maize pollen foraging is difficult to assert by participants, but this causality is not needed to explain our results, as this may only describe the quality of maize growing landscapes versus environments without maize. This was also proposed as potential risk in the multi-country analysis from Gray et al. [17].
Late catch crop likewise caused a higher probability of loss (Figure A1D), which at least was not observed in winter 2017/2018 for Austria [17]. Possible reasons could be an extended brood period due to late honey and pollen flows or, again, contact with pesticides in these fields [17].
Honeydew had no influence on colony survival over winter, but participants experiencing a melezitose forage, which often comes in areas with honeydew, had significantly higher loss rates (Figure A1E,F). Melezitose sometimes appears in July or in autumn and has been a familiar problem for beekeepers for a long time. Melezitose fills the brood and honey frames with hard to remove crystalline honey, and bees can invert only a small percentage of the collected melezitose sugar in comparison to sucrose [58]. Furthermore, colonies overwintering on it are often affected of dysentery, which is attributed to the high mineral content [59]. The time when melezitose forage occurs could play a crucial role and is not the same each year. Though melezitose honey is poorly studied, it is a well-recognized problem for beekeepers located in dedicated areas of Austria.
Sunflower and oilseed rape forages are often discussed as risk factors for honey bees. In this study, bees foraging on sunflower could not be linked to raised colony losses (Figure A1C), although this was found in previous years [17,40]. Observed oilseed rape foraging could also not be associated with higher loss rates (Figure A1A). Contrary results are published for Austria and other European countries in winter 2013/2014 [18] and 2017/2018 [17], though some countries experienced the opposite. Oilseed rape provides abundant nectar and pollen for bees, but insecticidal treatments might affect colony development and survival of bees [60,61,62]. Finally, similar as discussed for maize, diversity of forage due to monoculture fields in such areas could be low [63].
4.5. Varroa Control
Varroa destructor is regarded as the greatest threat to apiculture. Beekeepers need to efficiently treat their colonies or they might face their collapse within 3–4 years [10,12]. The majority of participants stated to monitor varroa infestation levels. Those beekeepers experienced a significantly lower loss rate (Figure 9A). Though this monitoring alone does not decrease varroa levels, such practices can be promoted as good beekeeping practices.
Observations of bees with crippled/deformed wings were associated with a higher loss rate (Figure 9B). Crippled bees can emerge due to cold or viral damage, but they are most often connected to the mite transmitted deformed wing virus (DWV). Therefore, if beekeepers see such bees, this can be interpreted as an alarm signal and counter measures must immediately be taken. The need to monitor DWV load and varroa mite infestation was demonstrated in southern Spain, where high DWV load and high varroa counts resulted in weaker colonies and a higher probability of losing colonies but did not show a significant correlation between DWV symptoms and viral load [64]. This supports the notion that mite-related damage strongly influences the winter loss rate and is one of the crucial factors for colony losses in Austria [12].
The spectrum of varroa control methods applied in Austria is rather limited compared to other countries [26]. To treat colonies, most participants follow the recommendation from the Austrian Agency for Health and Food Safety (AGES) [65] to evaporate formic acid after honey harvest and trickle or sublimate oxalic acid products in winter (Table 2C–F). The benefits of organic acids are a low risk of resistance, a low risk of residues, and a good efficacy against V. destructor [10]. Beekeepers in Austria do not commonly apply synthetic acaricides (Figure 10L). Therefore, we pooled the few applications of different types of synthetic acaricides (e.g., Amitraz, Coumaphos, etc.). These agents could lead to wax residues or pollution of honey [10]. The residues in wax could account for the various complications in the bee brood stage [45]. Nevertheless, the synthetic acaricide Amitraz did result in lower loss rates than other varrocide products (synthetic and organic) in a study from the US [52].
In spring (April–May), the most common control method in Austria was drone brood removal (Figure A2A). Participants who performed this method had a significantly lower loss rate the upcoming winter period. If drone brood removal was done in spring and summer (June–October), there is a trend to lose less colonies compared to only removing drone brood in spring or summer (Figure 11). This result was also observed in Austria in other years [40]. In a field study from the US, frequent removal of drone brood resulted in lower mite infestation [66]. However, in comparison to participants who did not remove drone brood at all, there is no significant difference in loss rates. More research on this method under local environmental conditions needs to be done to possibly enhance the positive effect.
In summer (June–October). significantly lower loss rates were observed for participants applying “other biotechnical methods”, e.g., trapping comb or complete brood removal to control mites (Figure A3C). These effective methods are often labour intensive [10]. In spring, biotechnical methods (excluding drone brood removal or hyperthermia) are not often used in Austria but could be considered as good practice to fight V. destructor with rising temperatures and a prolonged brood period in the future. This was shown in a study in Italy (Reggio Emilia, Po Valley) where the caging of the queen in spring produced no negative impact on honey harvest or brood amount but resulted in a lower mite infestation rate [67]. This could also encourage beekeepers aiming for late honey flows, which they would otherwise miss because the mite population is already too high. Participants applying oxalic acid by trickling in summer experienced high winter losses (Figure A3H). Possible reasons for this could be multiple tricklings and a negative effect on bee health or remaining broods in the colonies which leads to insufficient treatment success [68]. Therefore, oxalic acid trickling is recommended to be performed only once in the broodless period [10,69].
In winter (November–January), oxalic acid represents the dominant choice of treatment with no differences between application by trickling or sublimation (Figure A3A,B). Both treatments have already been evaluated to be very effective in the broodless period, and there is currently no alternative available [10,69].
So far, we solely discussed single treatment methods, but integrated varroa control strategies are comprised of combinations of different treatments. We therefore identified the most common combinations of treatments (Table 2, Figure 12). This allows, for example, further examination of the shown negative effect of oxalic acid—trickling in summer—in combination with other treatments. We found high loss rates for the combination (L) formic acid—short term in summer—and oxalic acid—trickling in summer and winter (Table 2L) and the combination (P) only oxalic acid—trickling in summer and winter (Table 2P). We conclude that trickling in summer is either not effective or causes negative effects on bee health. In combination with formic acid—long term in summer (Table 2I), this resulted in average losses. This might be due to the positive impact of formic acid—long-term evaporation.
Two frequently applied combinations were long-term evaporation of formic acid in summer and oxalic acid trickling or sublimation in winter (Table 2A,C), which both resulted in average colony losses. Formic acid is the only allowed organic acid in Austria which is effective against phoretic and reproductive mites [10]. Our results hence support the current recommendation from AGES to use formic acid in summer and oxalic acid in winter [65]. Long-term evaporation should be preferred, as short term may not be as efficient in mite reduction. Short-term evaporation in combination with oxalic acid in winter (Figure 12B,D) and, additionally, the double application of formic acid—long and short term in summer—with oxalic acid—trickling in winter (Figure 12E)—had higher loss rates than the single application of formic acid—long term in summer—and oxalic acid—trickling in winter (Figure 12A). We assume that either the application of both formic acid variants could lead to brood damage or the double application is an emergency measure because of high varroa counts.
The combination of biotechnical methods and short-term formic acid evaporation in summer plus oxalic acid—trickling in winter (Table 2S)—showed one of the lowest loss rates. Care must be taken in interpreting these results, as only 15 participants exercised this combination. Further, the biotechnical methods asked for in our survey could include a wide range of various procedures. To learn more about efficacy of different biotechnical methods, further studies should specify which biotechnical methods are used. Though this would lower sample size, discrepant results with biotechnical methods in combination with other methods could be better understood.
The combination of oxalic acid—sublimation in summer and winter (Table 2F) resulted in low loss rates. This method seems to be efficient to treat mite infestation and sublimation in comparison to trickling in summer is favourable. The sublimation of oxalic acid does not reduce reproductive mites [10,69]. Therefore, the colony must be broodless or sublimation is repeated multiple times in summer. This combination could offer a potential to represent a reliable method but would require a more in depth analysis with field studies on the amount of oxalic acid, on frequency of application, and the different sublimation equipment.
There was only one frequent combination with thymol. Preparations with the essential oil (in summer) and oxalic acid—trickling in summer and winter (Table 2T)—resulted in high loss rates but with a wide confidence interval. In an Australian study on thymol and the beneficial effect on hygienic behaviour, researchers found inconsistent results [70]. They proposed that different factors play a role for this differential outcome, such as environmental or genetic differences. In the loss rates presented here for Austria, thymol was combined with oxalic acid—trickling in summer. As we already discussed that oxalic acid trickling in summer should not be performed, we cannot recommend this treatment combination. This is no general recommendation against thymol usage, as we are lacking reliable data. In this study, we identified some unexpected combinations of varroa control methods applied in Austria. We recommend further research to better understand the motivation of beekeepers behind those and direct them to reasonable and effective treatment plans.
5. Conclusions
The winter 2018/2019 represented an average year in terms of overwinter honey bee colony losses in Austria. Significantly different loss rates were observed among the states, which could be led back to a divergent composition of landscapes or regional differences in weather and varroa pressure [19]. Low colony losses were associated with indicators for advanced beekeeping: migratory beekeeping or keeping a larger number of colonies. The majority of operational decisions that beekeepers can make in Austria, like certified organic beekeeping or having insulated hives in winter, had no effect on winter mortality. The only operational decision leading to lower losses was the self-sustaining operation of wax cycles, again a sign of a certain degree of professionalism. Queen problems during the summer resulted in a higher queen-related loss rate. Young queens showed a beneficial effect on both colony survival and queen-related losses. The observation of a notable number of bees with deformed wings in summer can be interpreted as an alarm signal for beekeepers, as this resulted in high colony losses. Access to various crops or honey flows was confirmed to impact colony survival—the exact drivers behind these need further investigation [17]. Varroa treatment with biotechnical methods in summer had a favourable effect on winter survival. For the first time, we investigated different commonly applied combinations of varroa control methods on winter colony losses. The combination of long-term evaporation of formic acid in summer and oxalic acid usage in winter, the dominant and officially recommended varroa control strategy in Austria, resulted in an average loss rates. The lowest loss rates were observed for biotechnical methods and short-term evaporation of formic acid in summer followed by oxalic acid trickling in winter. The best treatment combination without formic acid was oxalic acid sublimation in summer and winter. It still needs to be considered that the V. destructor population cycle is very complex and that treatment methods do not return the anticipated results each year, which could be led back to weather conditions or other environmental factors. Therefore, a multiple year analysis on treatment combinations is required to provide more reliable insights.
Our study supports how diverse the factors influencing honey bee colony mortality can be and how difficult it is to determine one factor alone to improve colony survival. It is substantial to repeat these studies and to make multi-year and multi-country analyses in order to maintain relevancy in light of current trends in beekeeping practices and climate change. Our goal is to assist beekeepers with statistical analysis and to improve beekeeping and the honey bee population in Austria with empirically gained knowledge. One measure, based on this study, is to increase professionalism in beekeeping to reduce winter colony losses.
Author Contributions
Conceptualization, R.B.; methodology, R.B.; software, H.O.; validation, H.O.; formal analysis, H.O.; investigation, R.B. and H.O.; resources, R.B.; data curation, H.O.; writing—original draft preparation, H.O.; writing—review and editing, H.O. and R.B.; visualization, H.O.; supervision, R.B.; project administration, R.B. All authors have read and agreed to the published version of the manuscript.
Funding
This research was funded by ZUKUNFT BIENE 2 grant number 101295/2.
Acknowledgments
We want to thank all beekeepers that participated in our study or helped with discussions or suggestions to improve the study aims. We also want to thank the monitoring core project of the nonprofit honey bee research association COLOSS (www.coloss.org).
Conflicts of Interest
The authors declare no conflict of interest.
Abbreviations
The following abbreviations are used in this manuscript:
| AGES | the Austrian Agency for Health and Food Safety |
| CI | confidence interval |
| COLOSS | prevention of honey bee COlony LOSSes |
| DWV | deformed wing virus |
| GZLM | generalized linear model |
Appendix A
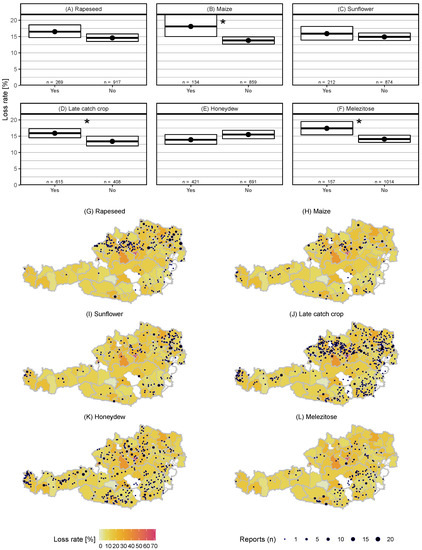
Figure A1.
Six different types of crops (A = oilseed rape—Brassica napus, B = maize—Zea mays, C = sunflower—Helianthus annuus, D = late catch crop, E = honeydew, F = Melezitose) and their winter honey bee colony loss rates (and 95% CI): The maps indicate the rough location of the main wintering apiary of the participants. Multiple crop reports were possible, which means that different crops could apply to the same beekeeper.

Figure A2.
Treatment methods (yes = n > 19) used in spring 2018 (April–May) as single factors to winter honey bee colony loss rates (and 95% CI): To improve sample size, the oxalic mixture was added to oxalic trickling.
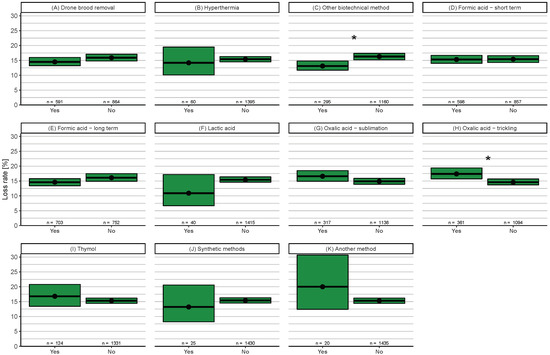
Figure A3.
Treatment methods (yes = n > 19) used in summer 2018 (June–October) as single factors to winter honey bee colony loss rates (and 95% CI): To improve sample size, synthetic methods were grouped together and the oxalic mixture was added to oxalic trickling.

Figure A4.
Treatment methods (yes = n > 19) used in autumn/winter 2018 (November–January) as single factors to winter honey bee colony loss rates (and 95% CI): To improve sample size, the oxalic mixture was added to oxalic trickling.
References
- Gallai, N.; Salles, J.M.; Settele, J.; Vaissière, B.E. Economic valuation of the vulnerability of world agriculture confronted with pollinator decline. Ecol. Econ. 2009, 68, 810–821. [Google Scholar] [CrossRef]
- Steinhauer, N.; Kulhanek, K.; Antúnez, K.; Human, H.; Chantawannakul, P.; Chauzat, M.P.; Van Engelsdorp, D. Drivers of colony losses. Curr. Opin. Insect Sci. 2018, 26, 142–148. [Google Scholar] [CrossRef]
- Belsky, J. Impact of biotic and abiotic stressors on managed and feral bees. Insects 2019, 10, 233. [Google Scholar] [CrossRef]
- Neov, B.; Georgieva, A.; Shumkova, R.; Radoslavov, G.; Hristov, P. Biotic and abiotic factors associated with colonies mortalities of managed honey bee (Apis mellifera). Diversity 2019, 11, 237. [Google Scholar] [CrossRef]
- Brodschneider, R.; Crailsheim, K. Nutrition and health in honey bees. Apidologie 2010, 41, 278–294. [Google Scholar] [CrossRef]
- Van Engelsdorp, D.; Hayes, J.; Underwood, R.M.; Pettis, J. A survey of honey bee colony losses in the U.S., Fall 2007 to Spring 2008. PLoS ONE 2008, 3, e4071. [Google Scholar] [CrossRef]
- Van der Zee, R.; Pisa, L.; Andonov, S.; Brodschneider, R.; Charrière, J.D.; Chlebo, R.; Coffey, M.F.; Crailsheim, K.; Dahle, B.; Gajda, A.; et al. Managed honey bee colony losses in Canada, China, Europe, Israel and Turkey, for the winters of 2008–9 and 2009–10. J. Apic. Res. 2012, 51, 100–114. [Google Scholar] [CrossRef]
- Thoms, C.A.; Nelson, K.C.; Kubas, A.; Steinhauer, N.; Wilson, M.E.; Van Engelsdorp, D. Beekeeper stewardship, colony loss, and Varroa destructor management. Ambio 2019, 48, 1209–1218. [Google Scholar] [CrossRef]
- Underwood, R.M.; Traver, B.E.; López-Uribe, M.M. Beekeeping management practices are associated with operation size and beekeepers’ philosophy towards in-hive chemicals. Insects 2019, 10, 10. [Google Scholar] [CrossRef]
- Rosenkranz, P.; Aumeier, P.; Ziegelmann, B. Biology and control of Varroa destructor. J. Invertebr. Pathol. 2010, 103, S96–S119. [Google Scholar] [CrossRef]
- Genersch, E.; Von der Ohe, W.; Kaatz, H.; Schroeder, A.; Otten, C.; Büchler, R.; Berg, S.; Ritter, W.; Mühlen, W.; Gisder, S.; et al. The German bee monitoring project: A long term study to understand periodically high winter losses of honey bee colonies. Apidologie 2010, 41, 332–352. [Google Scholar] [CrossRef]
- Morawetz, L.; Köglberger, H.; Griesbacher, A.; Derakhshifar, I.; Crailsheim, K.; Brodschneider, R.; Moosbeckhofer, R. Health status of honey bee colonies (Apis mellifera) and disease-related risk factors for colony losses in Austria. PLoS ONE 2019, 14, e0219293. [Google Scholar] [CrossRef] [PubMed]
- Brodschneider, R.; Moosbeckhofer, R.; Crailsheim, K. Surveys as a tool to record winter losses of honey bee colonies: A two year case study in Austria and South Tyrol. J. Apic. Res. 2010, 49, 23–30. [Google Scholar] [CrossRef]
- Neumann, P.; Carreck, N.L. Honey bee colony losses. J. Apic. Res. 2009, 49, 1–6. [Google Scholar] [CrossRef]
- Van der Zee, R.; Gray, A.; Holzmann, C.; Pisa, L.; Brodschneider, R.; Chlebo, R.; Coffey, M.F.; Kence, A.; Kristiansen, P.; Mutinelli, F.; et al. Standard survey methods for estimating colony losses and explanatory risk factors in Apis mellifera. J. Apic. Res. 2013, 52, 1–36. [Google Scholar] [CrossRef]
- Brodschneider, R.; Gray, A.; Adjlane, N.; Ballis, A.; Brusbardis, V.; Charrière, J.D.; Chlebo, R.; Coffey, M.F.; Dahle, B.; De Graaf, D.C.; et al. Multi-country loss rates of honey bee colonies during winter 2016/2017 from the COLOSS survey. J. Apic. Res. 2018, 57, 452–457. [Google Scholar] [CrossRef]
- Gray, A.; Brodschneider, R.; Adjlane, N.; Ballis, A.; Brusbardis, V.; Charrière, J.D.; Chlebo, R.; Coffey, M.F.; Cornelissen, B.; Amaro da Costa, C.; et al. Loss rates of honey bee colonies during winter 2017/18 in 36 countries participating in the COLOSS survey, including effects of forage sources. J. Apic. Res. 2019, 1–7. [Google Scholar] [CrossRef]
- Van der Zee, R.; Brodschneider, R.; Brusbardis, V.; Charrière, J.D.; Chlebo, R.; Coffey, M.F.; Dahle, B.; Drazic, M.M.; Kauko, L.; Kretavicius, J.; et al. Results of international standardised beekeeper surveys of colony losses for winter 2012/2013: Analysis of winter loss rates and mixed effects modelling of risk factors for winter loss. J. Apic. Res. 2014, 53, 19–34. [Google Scholar] [CrossRef]
- Switanek, M.; Crailsheim, K.; Truhetz, H.; Brodschneider, R. Modelling seasonal effects of temperature and precipitation on honey bee winter mortality in a temperate climate. Sci. Total Environ. 2017, 579, 1581–1587. [Google Scholar] [CrossRef]
- Kuchling, S.; Kopacka, I.; Kalcher-Sommersguter, E.; Schwarz, M.; Crailsheim, K.; Brodschneider, R. Investigating the role of landscape composition on honey bee colony winter mortality: A long-term analysis. Sci. Rep. 2018, 8, 12263. [Google Scholar] [CrossRef]
- GeoNames. GeoNames—Geographical Database. Available online: https://www.geonames.org/ (accessed on 1 September 2019).
- R Core Team. R: A Language and Environment for Statistical Computing; R Foundation for Statistical Computing: Vienna, Austria, 2018. [Google Scholar]
- Wickham, H. Ggplot2: Elegant Graphics for Data Analysis; Use R! Springer: New York, NY, USA, 2009; OCLC:ocn382399721. [Google Scholar]
- Oberreiter, H. Codebase: Austria Honey Bee Colony Overwinter Losses 2018/2019; Zenodo: Genève, Switzerland, 2019. [Google Scholar] [CrossRef]
- Nijenhuis, A.; Wilf, H. Combinatorial Algorithms for Computers and Calculators; Academic Press: New York, NY, USA, 1978. [Google Scholar] [CrossRef]
- Brodschneider, R.; Brus, J.; Danihlík, J. Comparison of apiculture and winter mortality of honey bee colonies (Apis mellifera) in Austria and Czechia. Agric. Ecosyst. Environ. 2019, 274, 24–32. [Google Scholar] [CrossRef]
- VanEngelsdorp, D.; Hayes, J.; Underwood, R.M.; Caron, D.; Pettis, J. A survey of managed honey bee colony losses in the USA, fall 2009 to winter 2010. J. Apic. Res. 2010, 50, 1–10. [Google Scholar] [CrossRef]
- Van Esch, L.; De Kok, J.L.; Janssen, L.; Buelens, B.; De Smet, L.; De Graaf, D.C.; Engelen, G. Multivariate landscape analysis of honey bee winter mortality in Wallonia, Belgium. Environ. Model. Assess. 2019. [Google Scholar] [CrossRef]
- Seeley, T.D.; Smith, M.L. Crowding honeybee colonies in apiaries can increase their vulnerability to the deadly ectoparasite Varroa destructor. Apidologie 2015, 46, 716–727. [Google Scholar] [CrossRef]
- Forfert, N.; Natsopoulou, M.E.; Paxton, R.J.; Moritz, R.F. Viral prevalence increases with regional colony abundance in honey bee drones (Apis mellifera L). Infect. Genet. Evol. 2016, 44, 549–554. [Google Scholar] [CrossRef]
- Dynes, T.L.; Berry, J.A.; Delaplane, K.S.; Brosi, B.J.; De Roode, J.C. Reduced density and visually complex apiaries reduce parasite load and promote honey production and overwintering survival in honey bees. PLoS ONE 2019, 14, e0216286. [Google Scholar] [CrossRef]
- Döke, M.A.; Frazier, M.; Grozinger, C.M. Overwintering honey bees: Biology and management. Curr. Opin. Insect Sci. 2015, 10, 185–193. [Google Scholar] [CrossRef]
- Amiri, E.; Strand, M.K.; Rueppell, O.; Tarpy, D.R. Queen quality and the impact of honey bee diseases on queen health: Potential for interactions between two major threats to colony health. Insects 2017, 8, 48. [Google Scholar] [CrossRef]
- VanEngelsdorp, D.; Tarpy, D.R.; Lengerich, E.J.; Pettis, J.S. Idiopathic brood disease syndrome and queen events as precursors of colony mortality in migratory beekeeping operations in the eastern United States. Prev. Vet. Med. 2013, 108, 225–233. [Google Scholar] [CrossRef]
- Williams, G.R.; Troxler, A.; Retschnig, G.; Roth, K.; Yañez, O.; Shutler, D.; Neumann, P.; Gauthier, L. Neonicotinoid pesticides severely affect honey bee queens. Sci. Rep. 2015, 5, 14621. [Google Scholar] [CrossRef]
- Withrow, J.M.; Pettis, J.S.; Tarpy, D.R. Effects of temperature during package transportation on queen establishment and survival in honey bees (Hymenoptera: Apidae). J. Econ. Entomol. 2019, 112, 1043–1049. [Google Scholar] [CrossRef] [PubMed]
- Giacobino, A.; Molineri, A.; Cagnolo, N.B.; Merke, J.; Orellano, E.; Bertozzi, E.; Masciangelo, G.; Pietronave, H.; Pacini, A.; Salto, C.; et al. Queen replacement: The key to prevent winter colony losses in Argentina. J. Apic. Res. 2016, 55, 335–341. [Google Scholar] [CrossRef]
- Ricigliano, V.A.; Mott, B.M.; Floyd, A.S.; Copeland, D.C.; Carroll, M.J.; Anderson, K.E. Honey bees overwintering in a southern climate: Longitudinal effects of nutrition and queen age on colony-level molecular physiology and performance. Sci. Rep. 2018, 8, 1–11. [Google Scholar] [CrossRef] [PubMed]
- Jacques, A.; Laurent, M.; Consortium, E.; Ribière-Chabert, M.; Saussac, M.; Bougeard, S.; Budge, G.E.; Hendrikx, P.; Chauzat, M.P. A pan-European epidemiological study reveals honey bee colony survival depends on beekeeper education and disease control. PLoS ONE 2017, 12, e0172591. [Google Scholar] [CrossRef]
- Crailsheim, K.; Moosbeckhofer, R.; Brodschneider, R. Future of Honey Bees—Basic Research for Project for Honey Bee Health and Bee Protection. Final Report Poject ’Zukunft Biene’ 2014–2018 Austria. 2018. Available online: https://www.ages.at/en/topics/environment/bees/research-projects-on-bees/future-of-honey-bees/ (accessed on 7 February 2020).
- Castilhos, D.; Bergamo, G.C.; Gramacho, K.P.; Gonçalves, L.S. Bee colony losses in Brazil: A 5-year online survey. Apidologie 2019, 50, 263–272. [Google Scholar] [CrossRef]
- Calatayud-Vernich, P.; VanEngelsdorp, D.; Picó, Y. Beeswax cleaning by solvent extraction of pesticides. MethodsX 2019, 6, 980–985. [Google Scholar] [CrossRef]
- Harriet, J.; Campá, J.P.; Grajales, M.; Lhéritier, C.; Gómez Pajuelo, A.; Mendoza-Spina, Y.; Carrasco-Letelier, L. Agricultural pesticides and veterinary substances in Uruguayan beeswax. Chemosphere 2017, 177, 77–83. [Google Scholar] [CrossRef]
- Calatayud-Vernich, P.; Calatayud, F.; Simó, E.; Picó, Y. Pesticide residues in honey bees, pollen and beeswax: Assessing beehive exposure. Environ. Pollut. 2018, 241, 106–114. [Google Scholar] [CrossRef]
- Payne, A.N.; Walsh, E.M.; Rangel, J. Initial exposure of wax foundation to agrochemicals causes negligible effects on the growth and winter survival of incipient honey bee (Apis mellifera) colonies. Insects 2019, 10, 19. [Google Scholar] [CrossRef]
- De Guzman, L.I.; Simone-Finstrom, M.; Frake, A.M.; Tokarz, P. Comb irradiation has limited, interactive effects on colony performance or pathogens in bees, Varroa destructor and wax based on two honey bee stocks. Insects 2019, 10, 15. [Google Scholar] [CrossRef]
- Koenig, J.P.; Boush, G.M.; Erickson, E.H. Effect of type of brood comb on chalk brood disease in honeybee colonies. J. Apic. Res. 1986, 25, 58–62. [Google Scholar] [CrossRef]
- Berry, J.A.; Delaplane, K.S. Effects of comb age on honey bee colony growth and brood survivorship. J. Apic. Res. 2001, 40, 3–8. [Google Scholar] [CrossRef]
- Thrasyvoulou, A.; Broeker, U.; Chrysoula, T.; Vilas-Boas, M.; Wallner, K.; Amsler, T.; Garces, S.; Lodesani, M.; Siceanu, A.; Westerhoff, A.; et al. Improvements to the regulations on organic farming to facilitate the practice of organic beekeeping. Bee World 2015, 91, 58–61. [Google Scholar] [CrossRef]
- Sánchez, V.; Gil, S.; Flores, J.M.; Quiles, F.J.; Ortiz, M.A.; Luna, J.J. Implementation of an electronic system to monitor the thermoregulatory capacity of honeybee colonies in hives with open-screened bottom boards. Comput. Electron. Agric. 2015, 119, 209–216. [Google Scholar] [CrossRef]
- Ibrahim, A.; Reuter, G.S.; Spivak, M. Field trial of honey bee colonies bred for mechanisms of resistance against Varroa destructor. Apidologie 2007, 38, 67–76. [Google Scholar] [CrossRef]
- Haber, A.I.; Steinhauer, N.A.; vanEngelsdorp, D. Use of chemical and nonchemical methods for the control of Varroa destructor (Acari: Varroidae) and associated winter colony losses in U.S. beekeeping operations. J. Econ. Entomol. 2019, 112, 1509–1525. [Google Scholar] [CrossRef]
- Höcherl, N.; Siede, R.; Illies, I.; Gätschenberger, H.; Tautz, J. Evaluation of the nutritive value of maize for honey bees. J. Insect Physiol. 2012, 58, 278–285. [Google Scholar] [CrossRef]
- Urbanowicz, C.; Baert, N.; Bluher, S.E.; Böröczky, K.; Ramos, M.; McArt, S.H. Low maize pollen collection and low pesticide risk to honey bees in heterogeneous agricultural landscapes. Apidologie 2019, 2011. [Google Scholar] [CrossRef]
- Brodschneider, R.; Gratzer, K.; Kalcher-Sommersguter, E.; Heigl, H.; Auer, W.; Moosbeckhofer, R.; Crailsheim, K. A citizen science supported study on seasonal diversity and monoflorality of pollen collected by honey bees in Austria. Sci. Rep. 2019, 9, 16633. [Google Scholar] [CrossRef]
- Schmolke, A.; Kearns, B.; O’Neill, B. Plant guttation water as a potential route for pesticide exposure in honey bees: A review of recent literature. Apidologie 2018, 49, 637–646. [Google Scholar] [CrossRef]
- Di Pasquale, G.; Alaux, C.; Conte, Y.L.; Odoux, J.F.; Pioz, M.; Vaissière, B.E.; Belzunces, L.P.; Decourtye, A. Variations in the availability of pollen resources affect honey bee health. PLoS ONE 2016, 11, e0162818. [Google Scholar] [CrossRef] [PubMed]
- Pechhacker, H.; Praznik, W.; Klaus, J. Untersuchungen über das zuckerspektrum in honigblaseninhalt und honig. Apidologie 1990, 21, 447–455. [Google Scholar] [CrossRef]
- Imdorf, A.; Bogdanov, S.; Kilchenmann, V. Zementhonig im Honig-und Brutraum—Was dann?—Schweizerisches zentrum für bienenforschung. Schweiz. Bienenztg. 1985, 108, 534–544. [Google Scholar]
- Rundlöf, M.; Andersson, G.K.S.; Bommarco, R.; Fries, I.; Hederström, V.; Herbertsson, L.; Jonsson, O.; Klatt, B.K.; Pedersen, T.R.; Yourstone, J.; et al. Seed coating with a neonicotinoid insecticide negatively affects wild bees. Nature 2015, 521, 77–80. [Google Scholar] [CrossRef]
- Goulson, D.; Nicholls, E.; Botías, C.; Rotheray, E.L. Bee declines driven by combined Stress from parasites, pesticides, and lack of flowers. Science 2015, 347, 1255957. [Google Scholar] [CrossRef]
- Rolke, D.; Fuchs, S.; Grünewald, B.; Gao, Z.; Blenau, W. Large-scale monitoring of effects of clothianidin-dressed oilseed rape seeds on pollinating insects in Northern Germany: Effects on honey bees (Apis mellifera). Ecotoxicology 2016, 25, 1648–1665. [Google Scholar] [CrossRef]
- Requier, F.; Odoux, J.F.; Henry, M.; Bretagnolle, V. The carry-over effects of pollen shortage decrease the survival of honeybee colonies in farmlands. J. Appl. Ecol. 2017, 54, 1161–1170. [Google Scholar] [CrossRef]
- Barroso-Arévalo, S.; Fernández-Carrión, E.; Goyache, J.; Molero, F.; Puerta, F.; Sánchez-Vizcaíno, J.M. High load of deformed wing virus and Varroa destructor infestation are related to weakness of honey bee colonies in southern Spain. Front. Microbiol. 2019, 10. [Google Scholar] [CrossRef]
- Moosbeckhofer, R.; Köglberger, H.; Derakhshifar, I.; Morawetz, L.; Boigenzahn, C.; Oberrisser, W. Varroa-Bekämpfung einfach-sicher-erfolgreich. 2. Völlig Neu Bearbeitete Auflage; Biene Österreich, 2015; Available online: https://cdn.netletter.at/imkerbund/media/download/2016.02.09/1455008954025576.pdf?d=VarroabroschuereNeu.pdfdc=1455009208 (accessed on 7 February 2020).
- Calderone, N.W. Evaluation of drone brood removal for management of Varroa destructor (Acari: Varroidae) in colonies of Apis mellifera (Hymenoptera: Apidae) in the northeastern United States. J. Econ. Entomol. 2005, 98, 645–650. [Google Scholar] [CrossRef]
- Lodesani, M.; Franceschetti, S.; Dall’Ollio, R. Evaluation of early spring bio-technical management techniques to control varroosis in Apis mellifera. Apidologie 2019, 50, 131–140. [Google Scholar] [CrossRef]
- Charrière, J.D.; Imdorf, A. Oxalic acid treatment by trickling against Varroa destructor: Recommendations for use in central Europe and under temperate climate conditions. Bee World 2002, 83, 51–60. [Google Scholar] [CrossRef]
- Rademacher, E.; Harz, M. Oxalic acid for the control of varroosis in honey bee colonies—A review. Apidologie 2006, 37, 98–120. [Google Scholar] [CrossRef]
- Colin, T.; Lim, M.Y.; Quarrell, S.R.; Allen, G.R.; Barron, A.B. Effects of thymol on European honey bee hygienic behaviour. Apidologie 2019, 50, 141–152. [Google Scholar] [CrossRef]
© 2020 by the authors. Licensee MDPI, Basel, Switzerland. This article is an open access article distributed under the terms and conditions of the Creative Commons Attribution (CC BY) license (http://creativecommons.org/licenses/by/4.0/).