Transcriptomic Characterization of Bradyrhizobium diazoefficiens Bacteroids Reveals a Post-Symbiotic, Hemibiotrophic-Like Lifestyle of the Bacteria within Senescing Soybean Nodules


Abstract
1. Introduction
2. Results
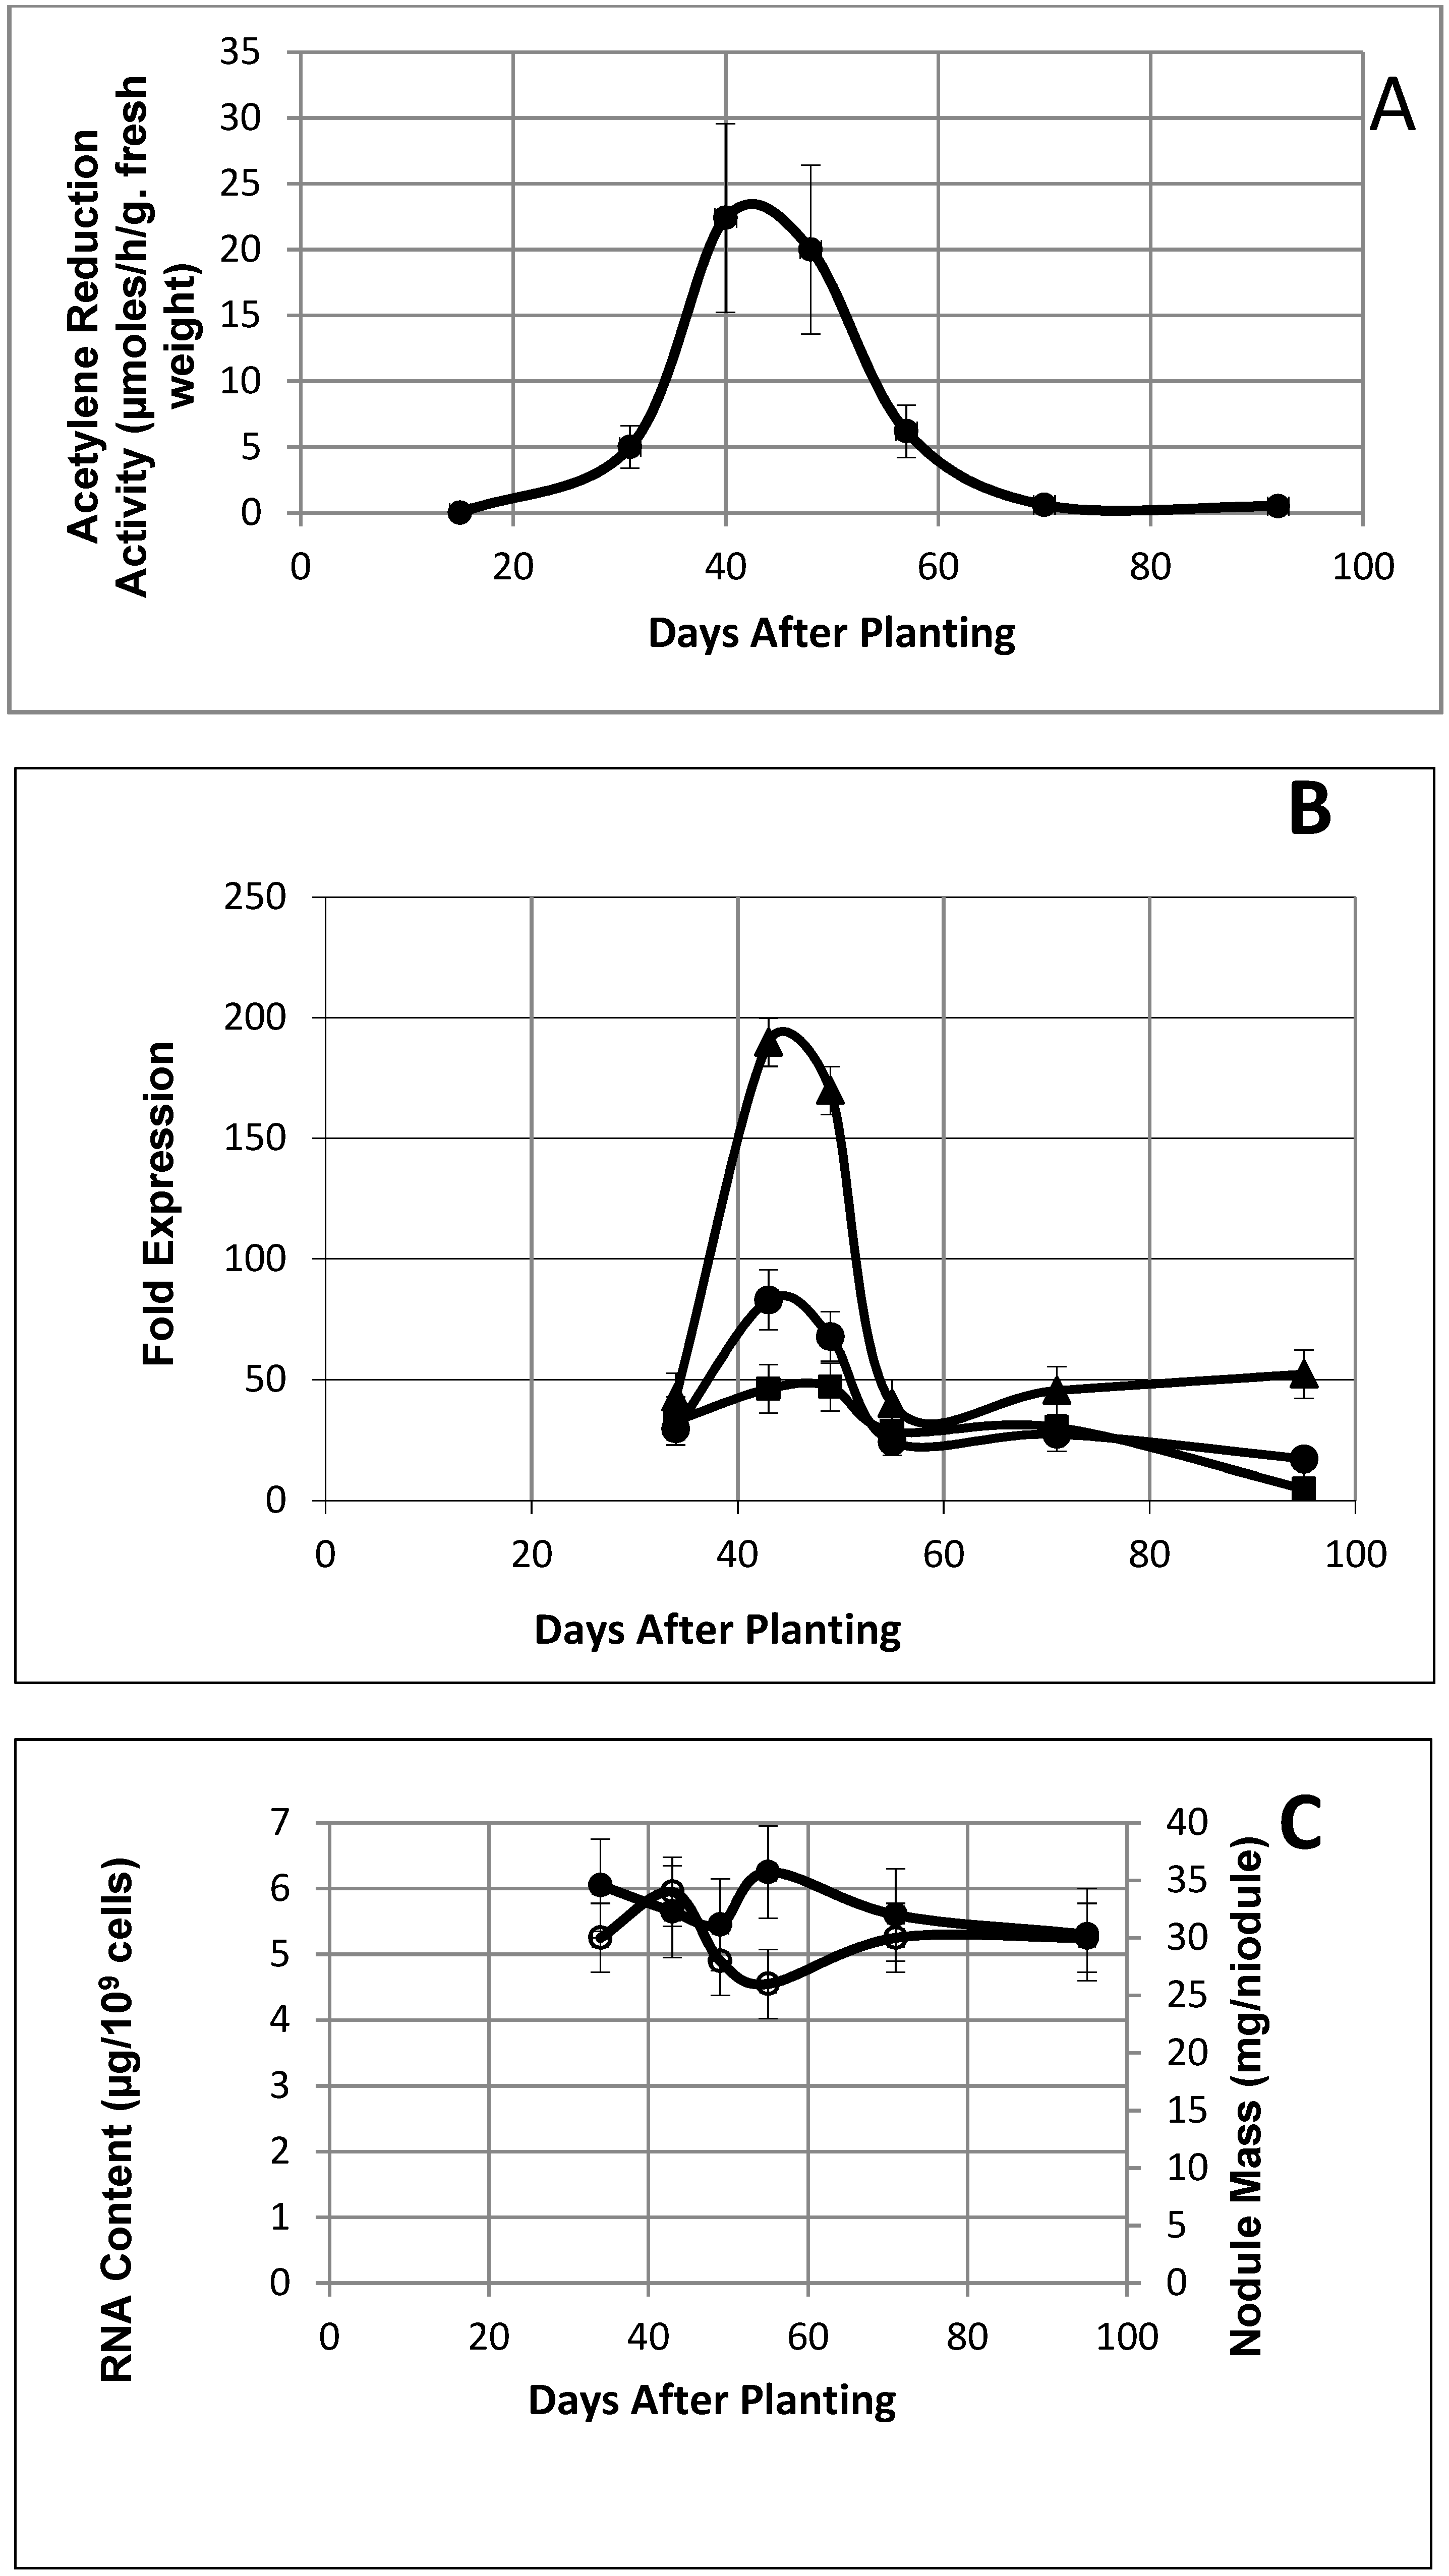
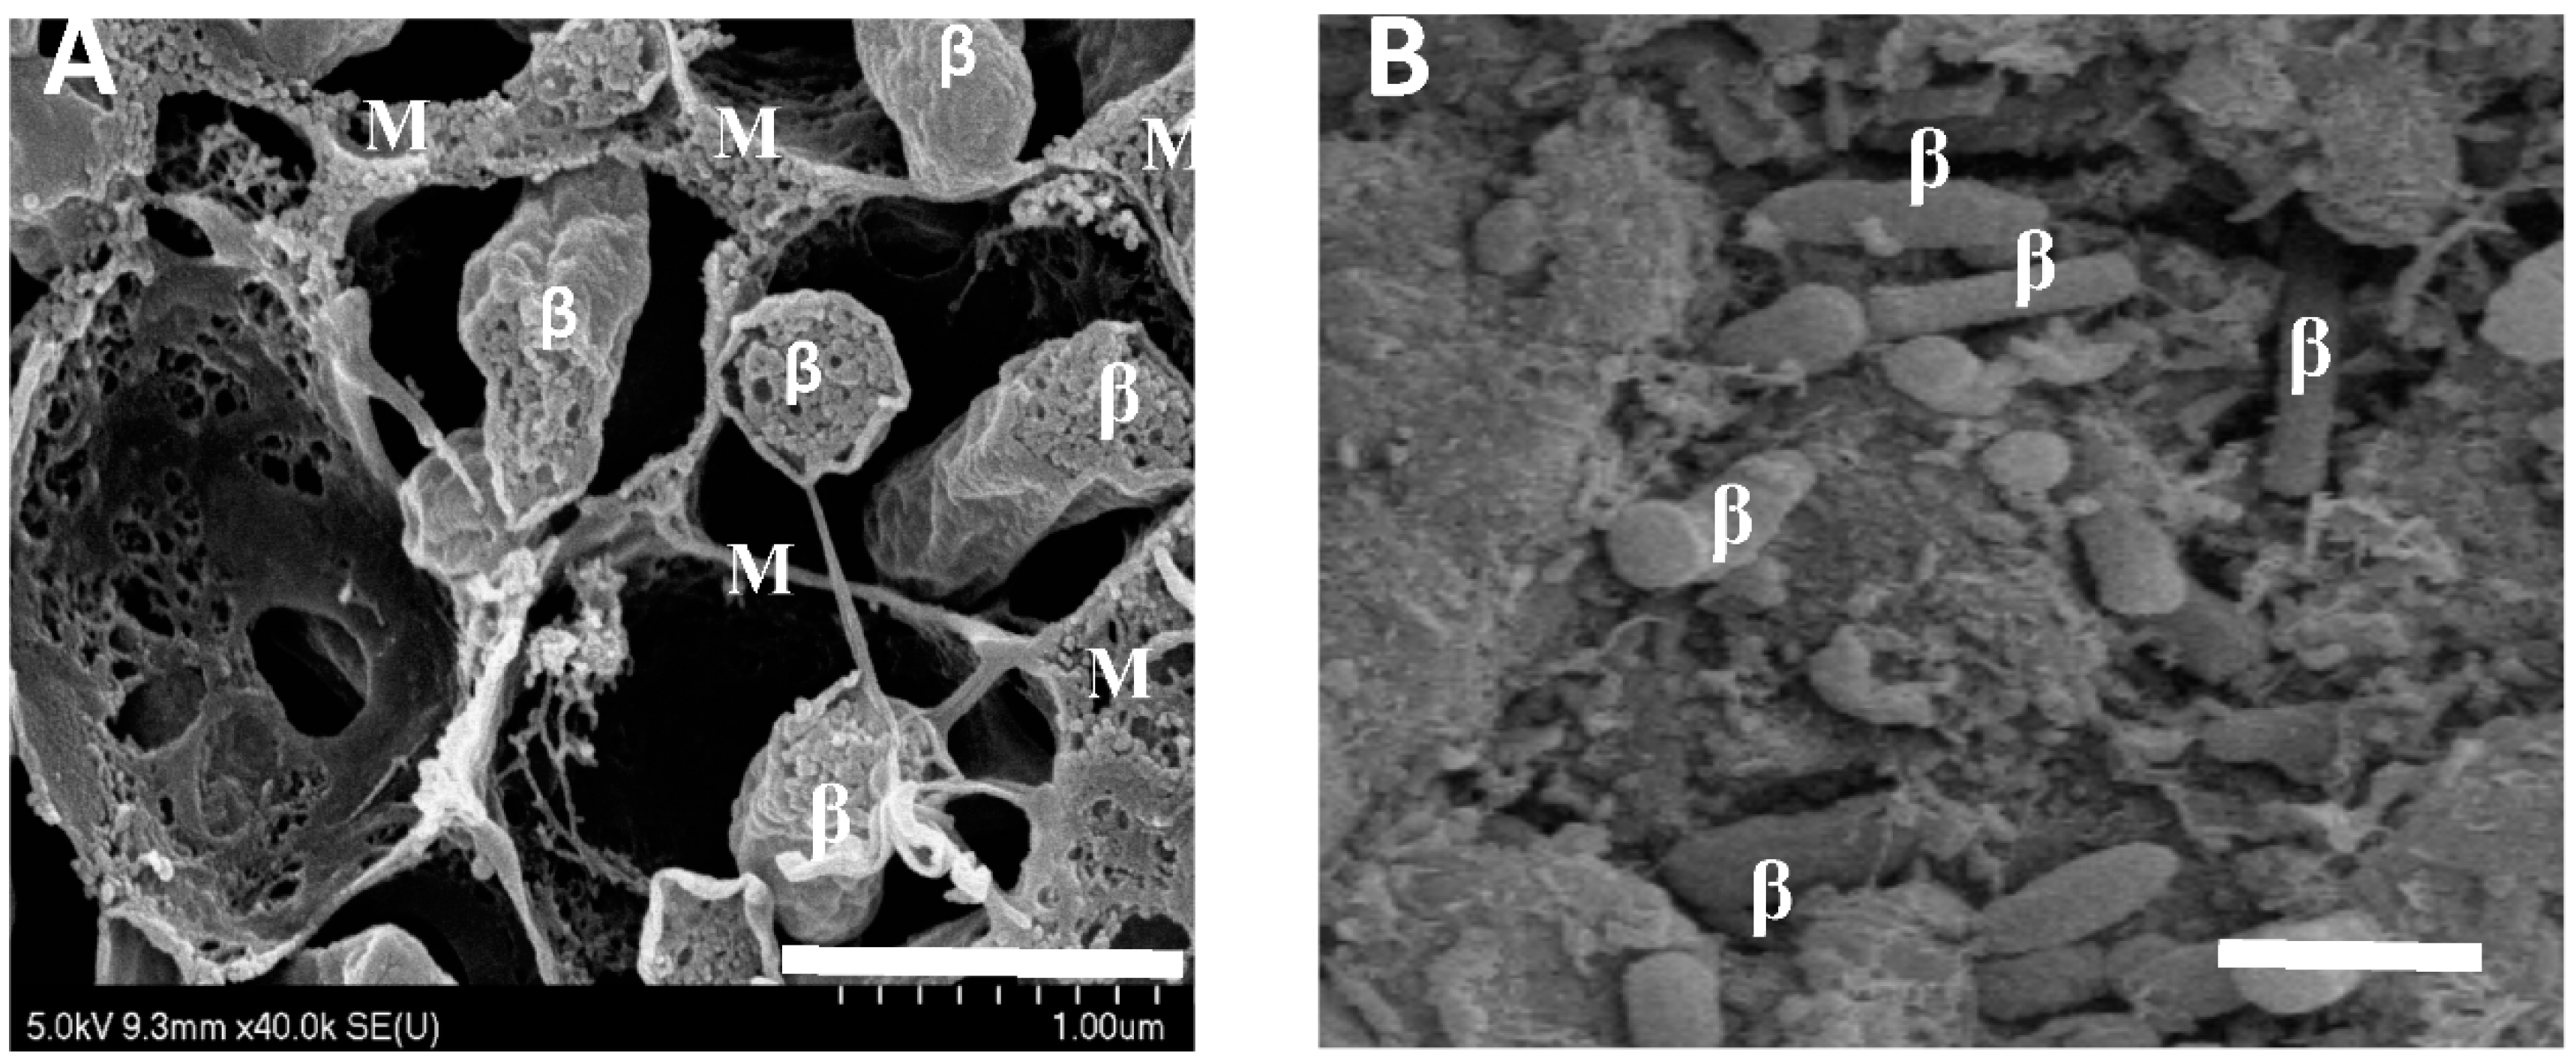
2.1. Biological Parameters of Symbiosis and Senescence
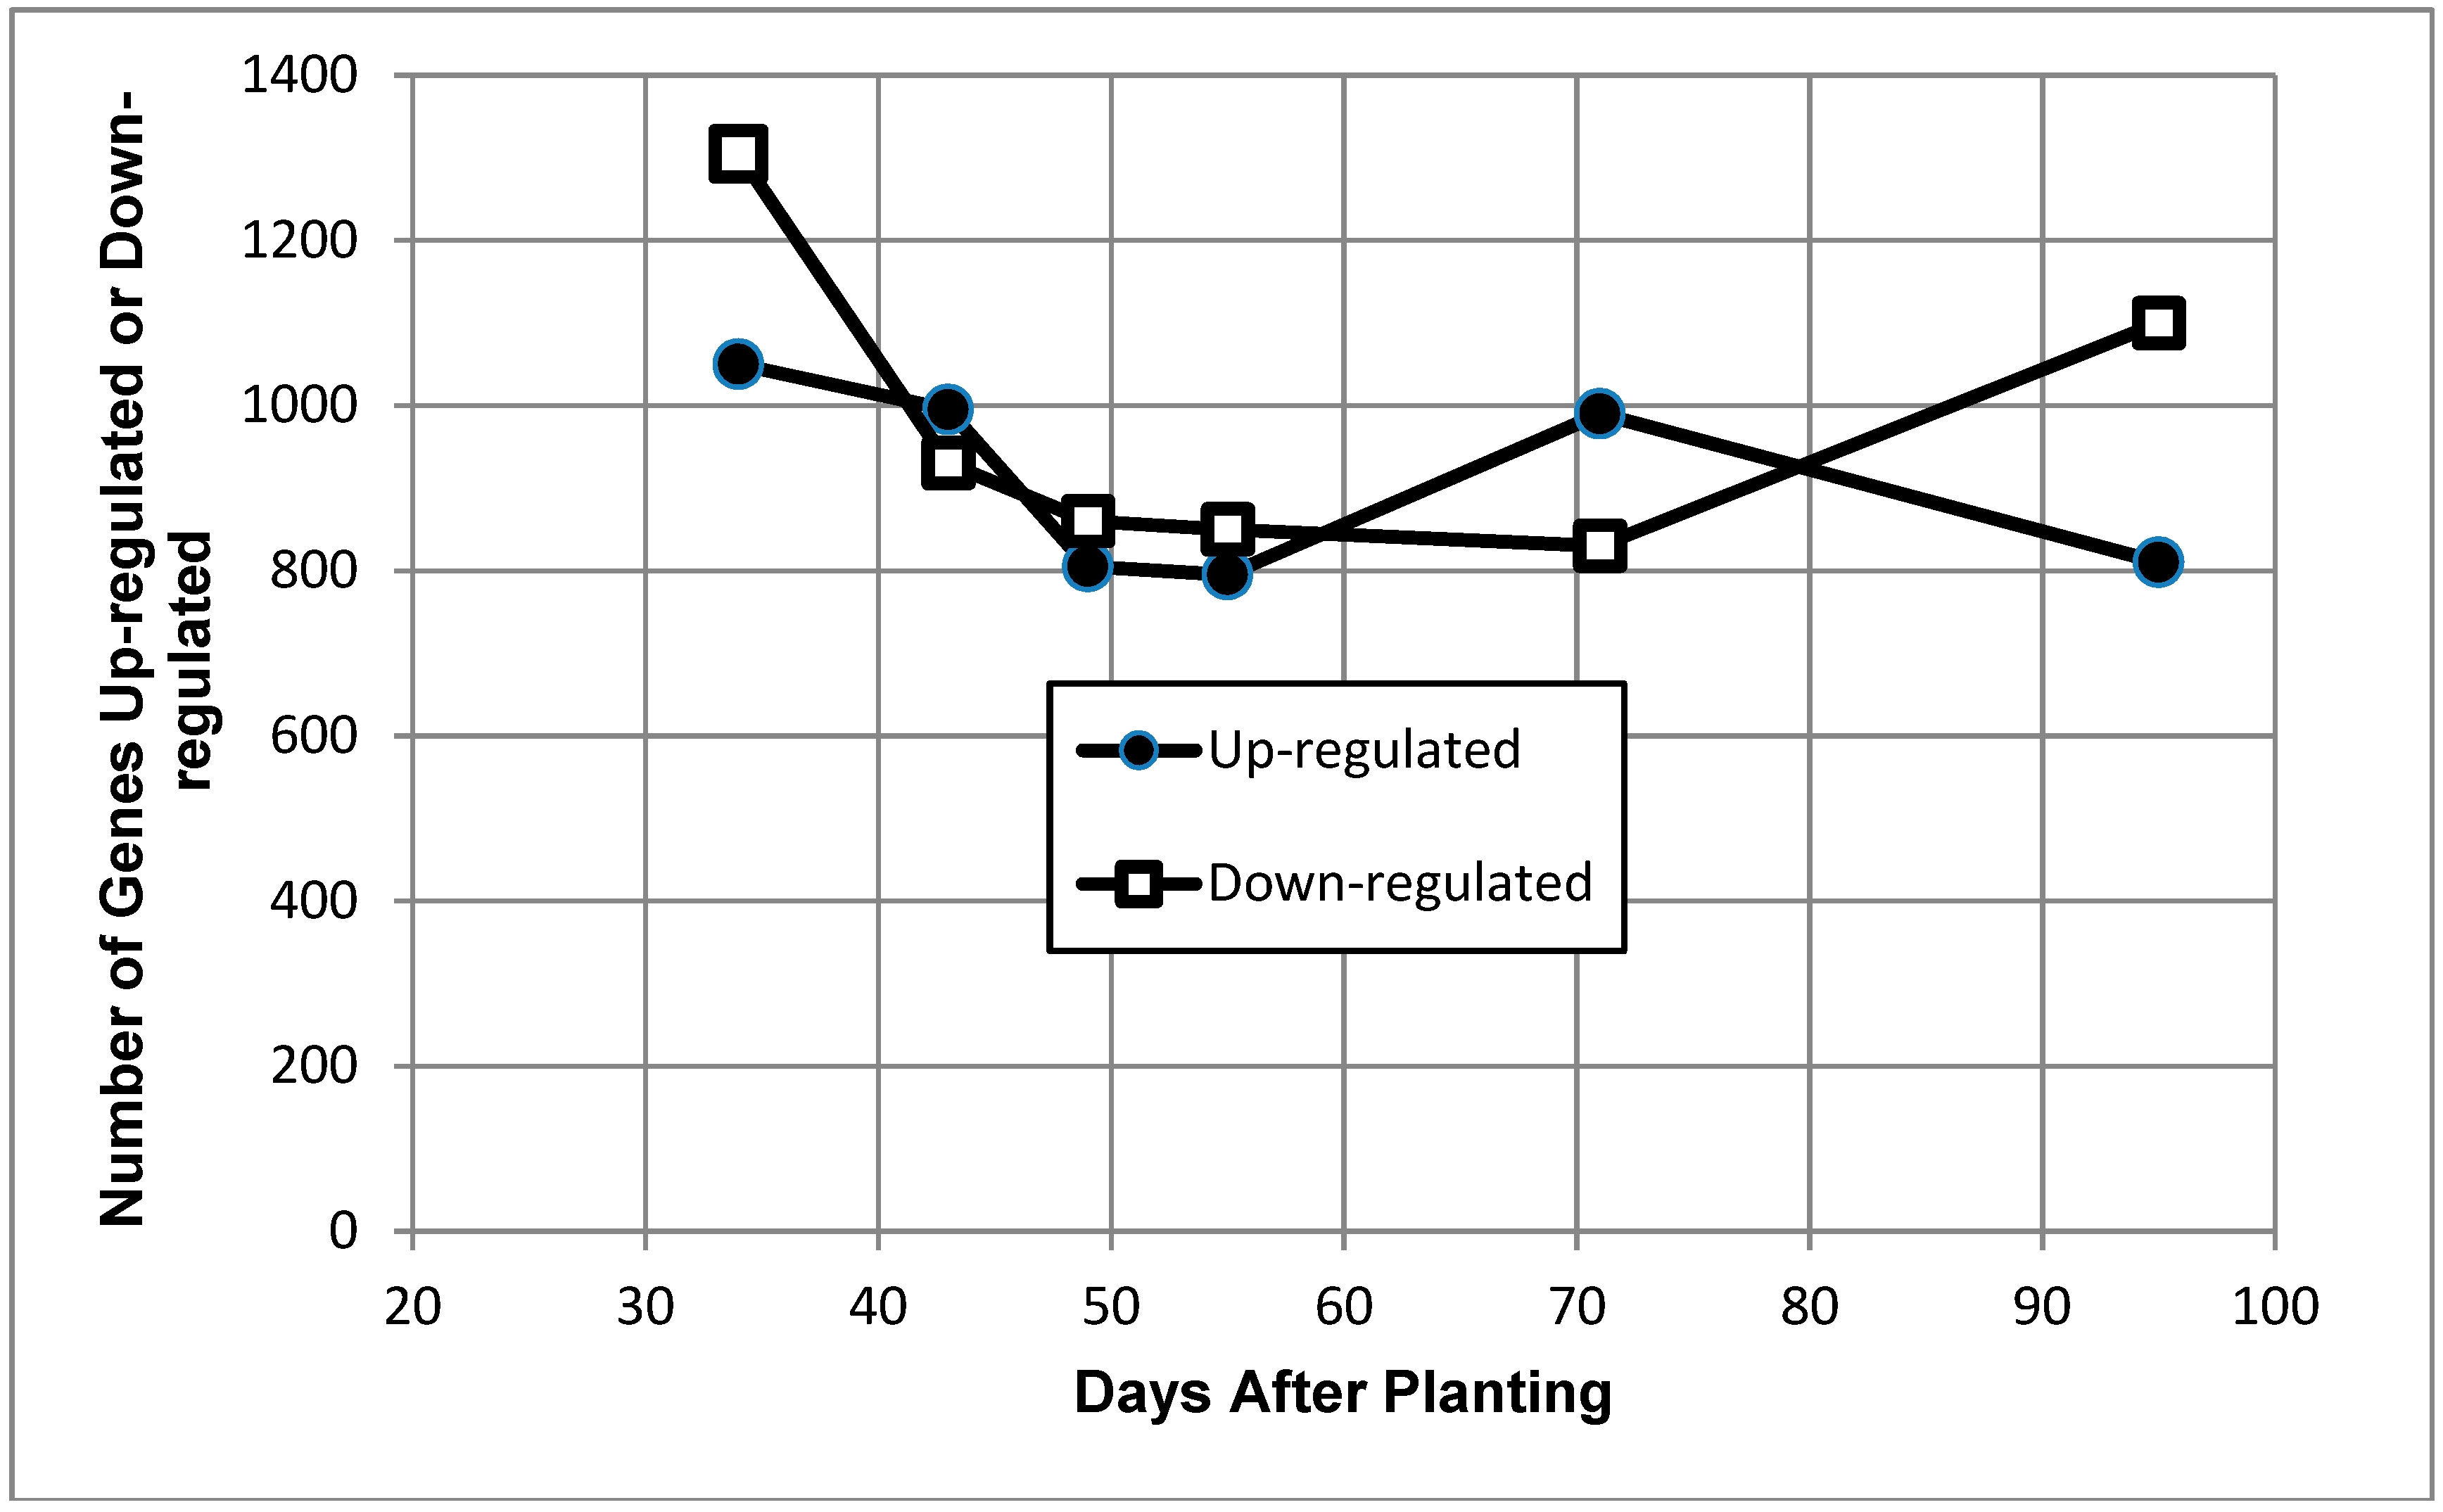
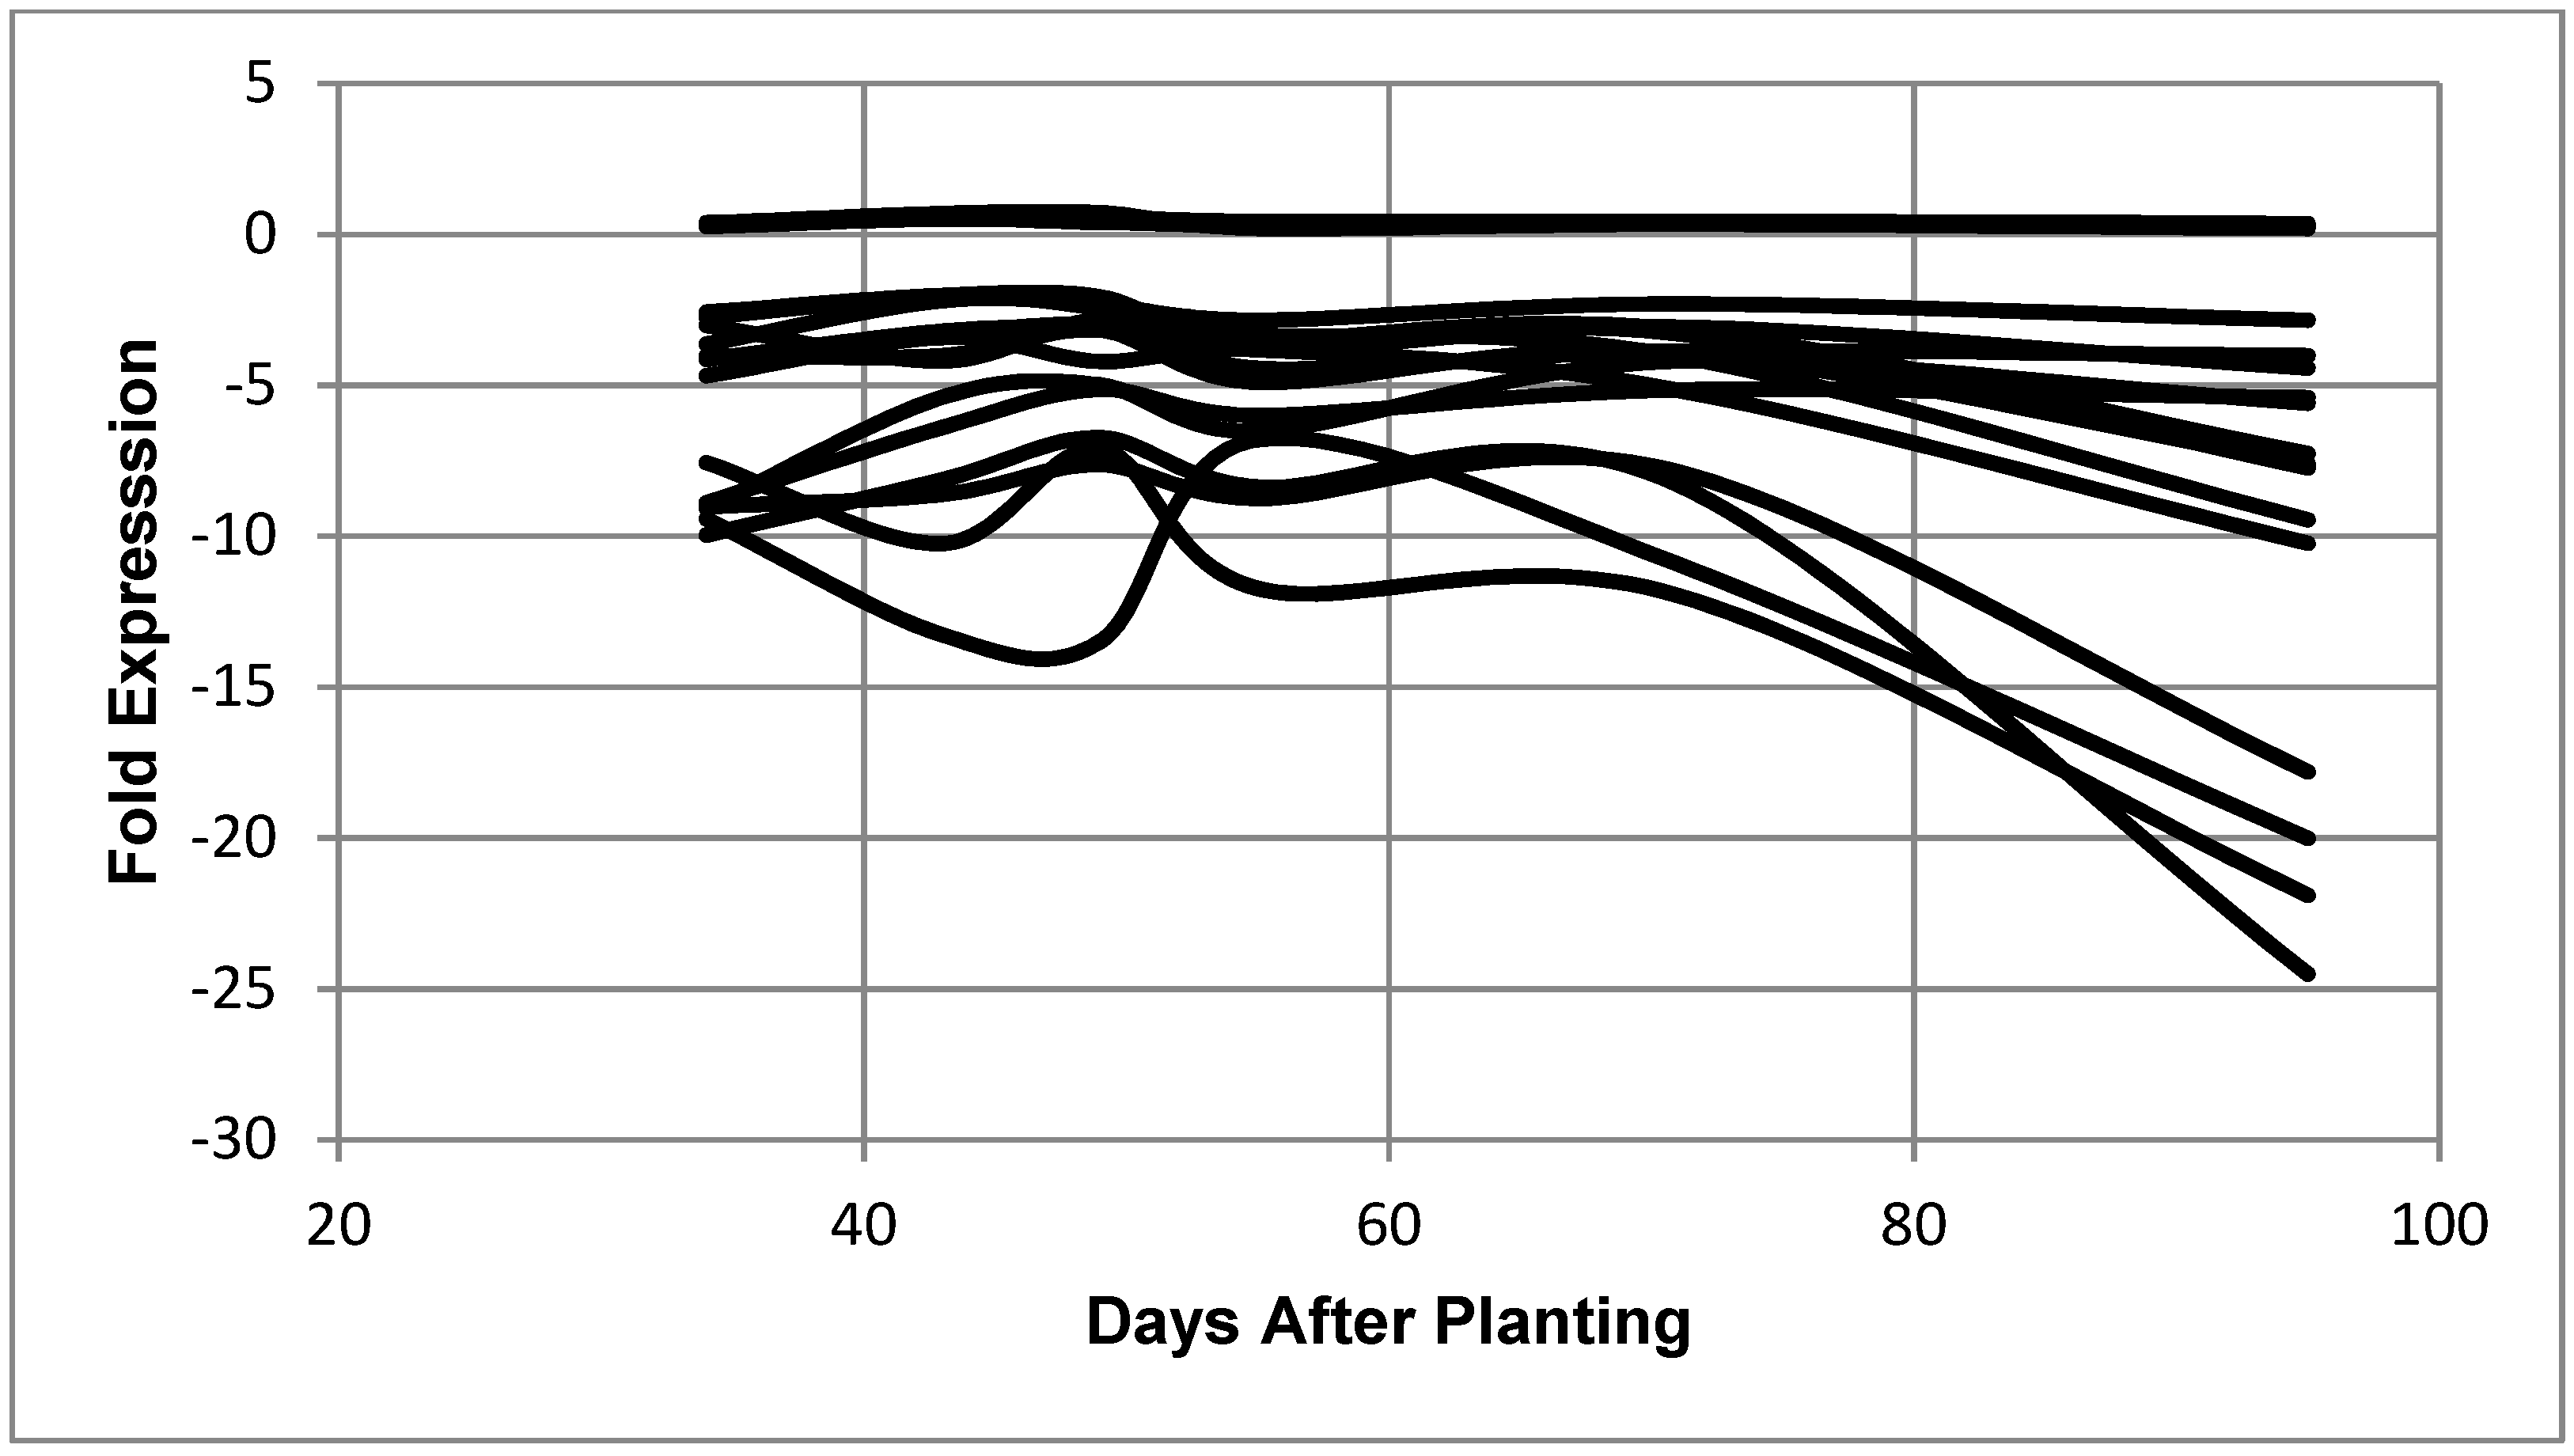
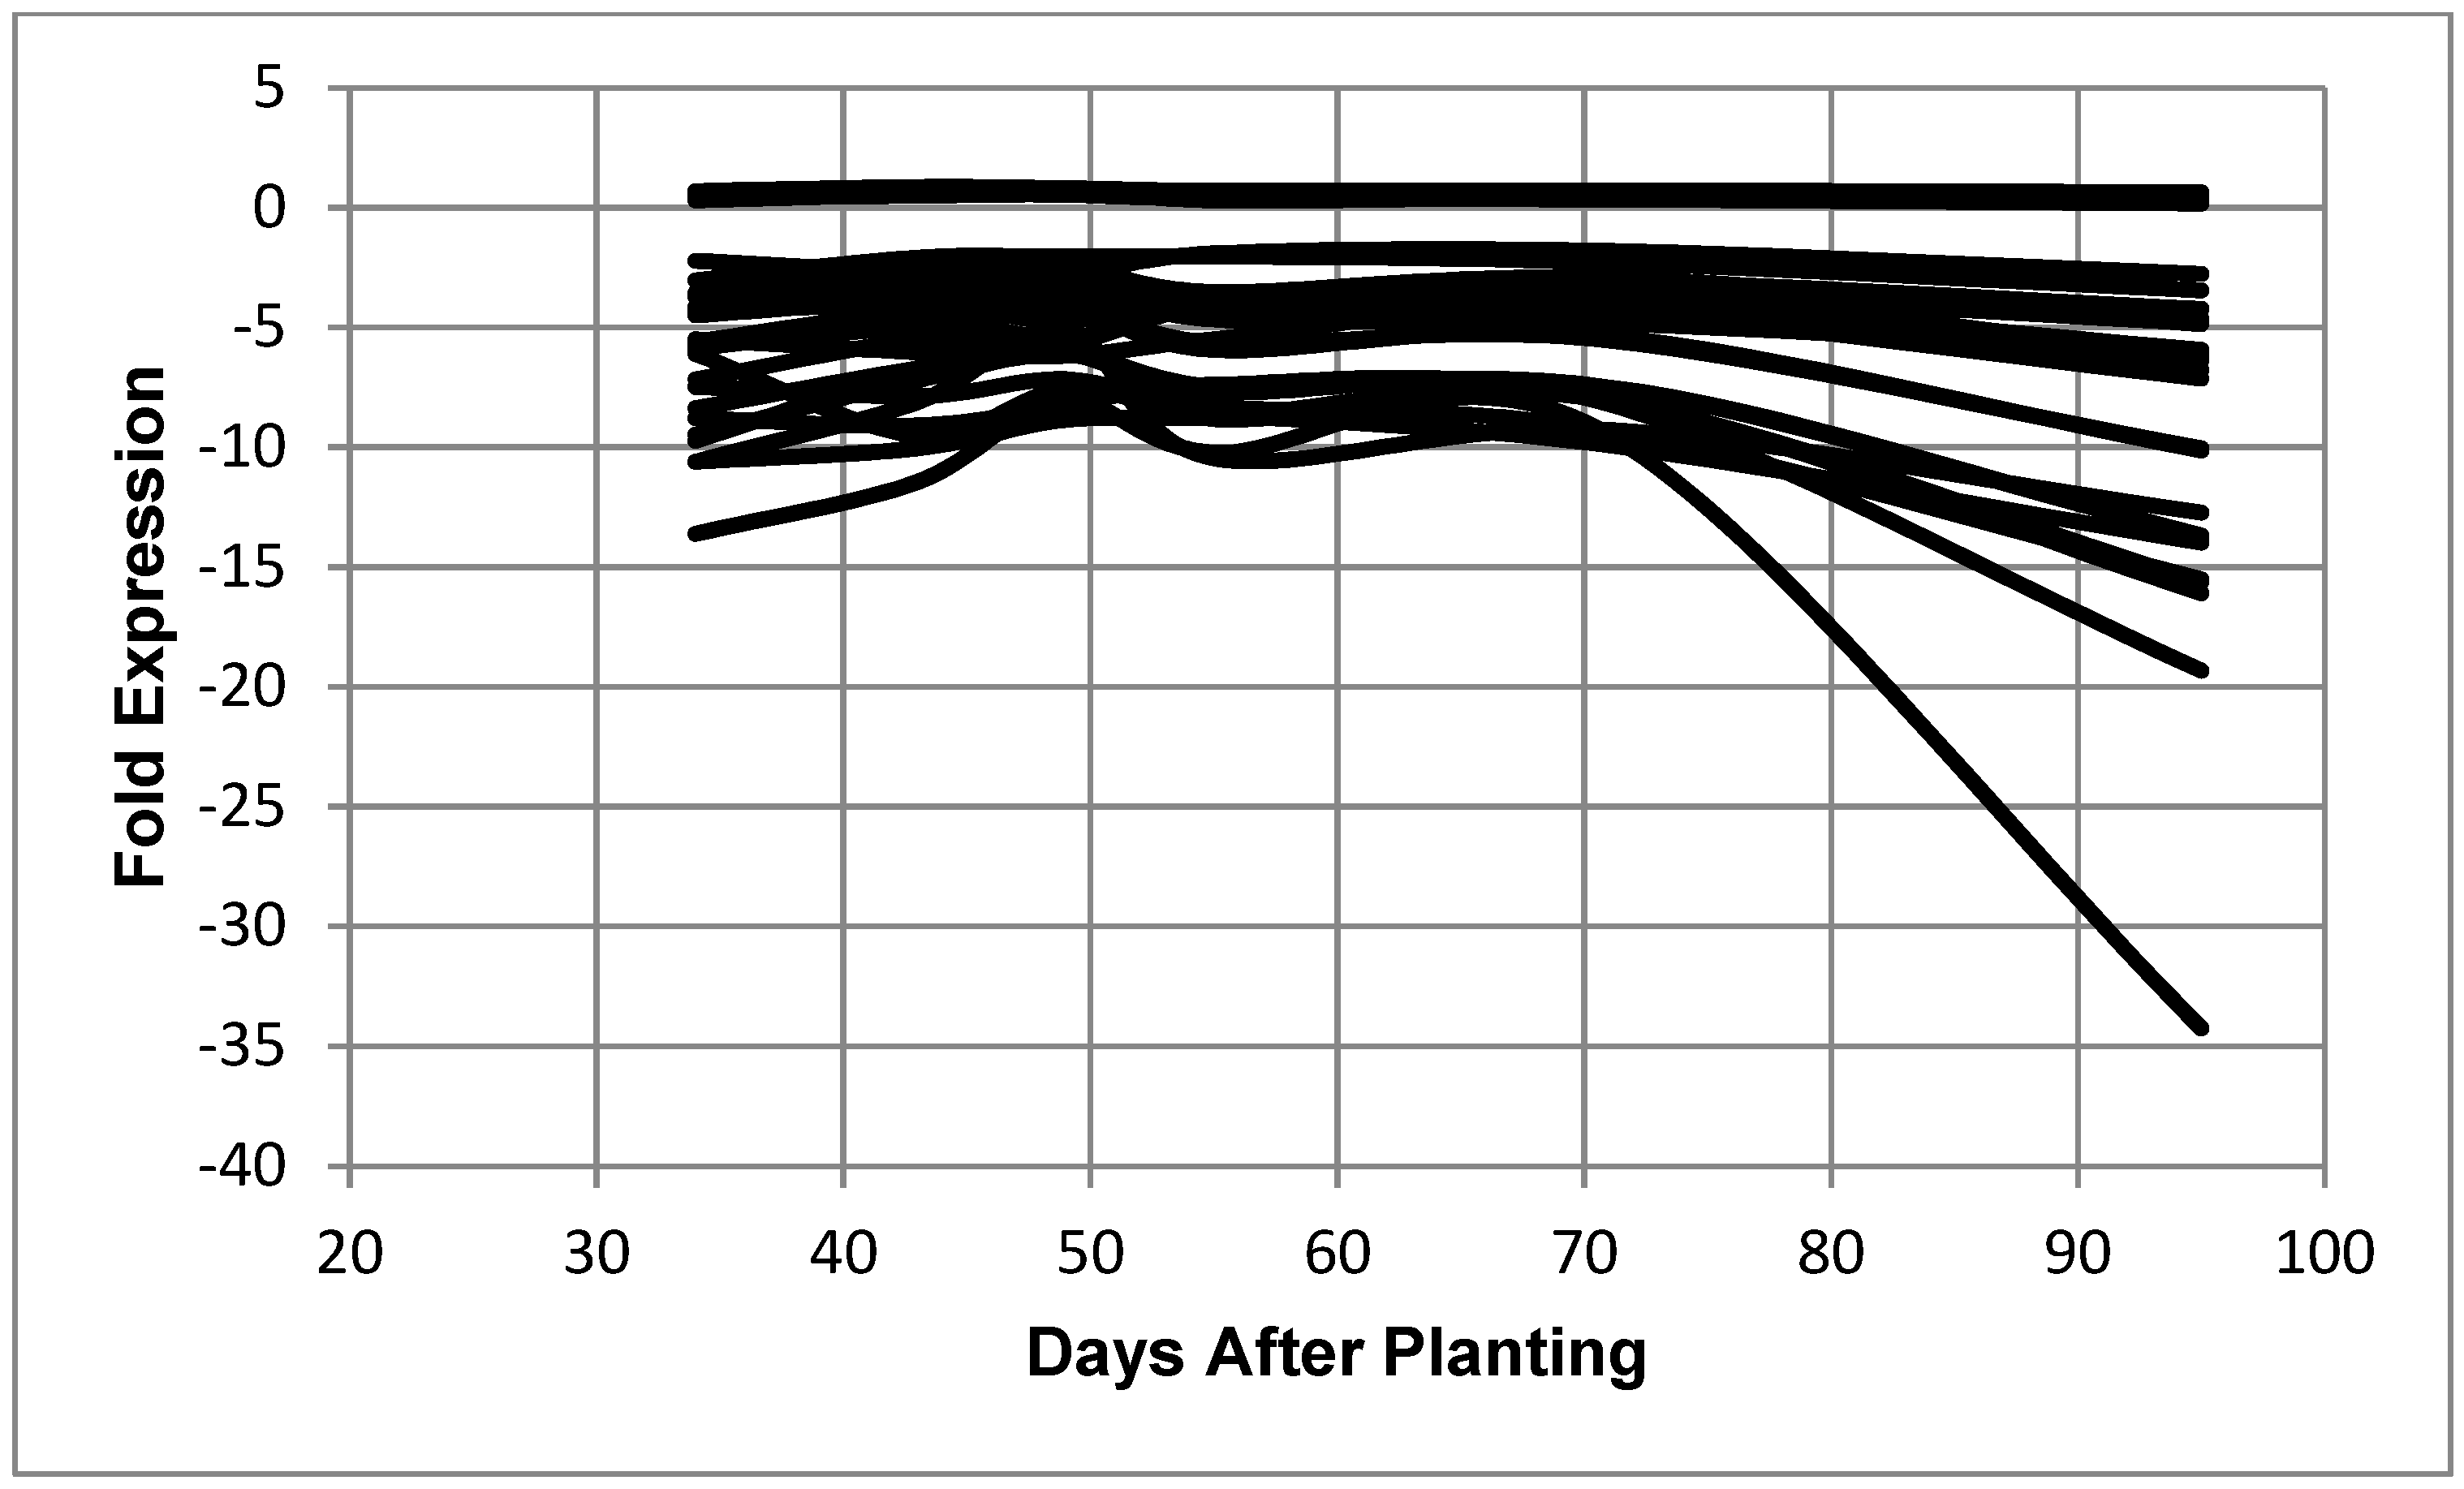
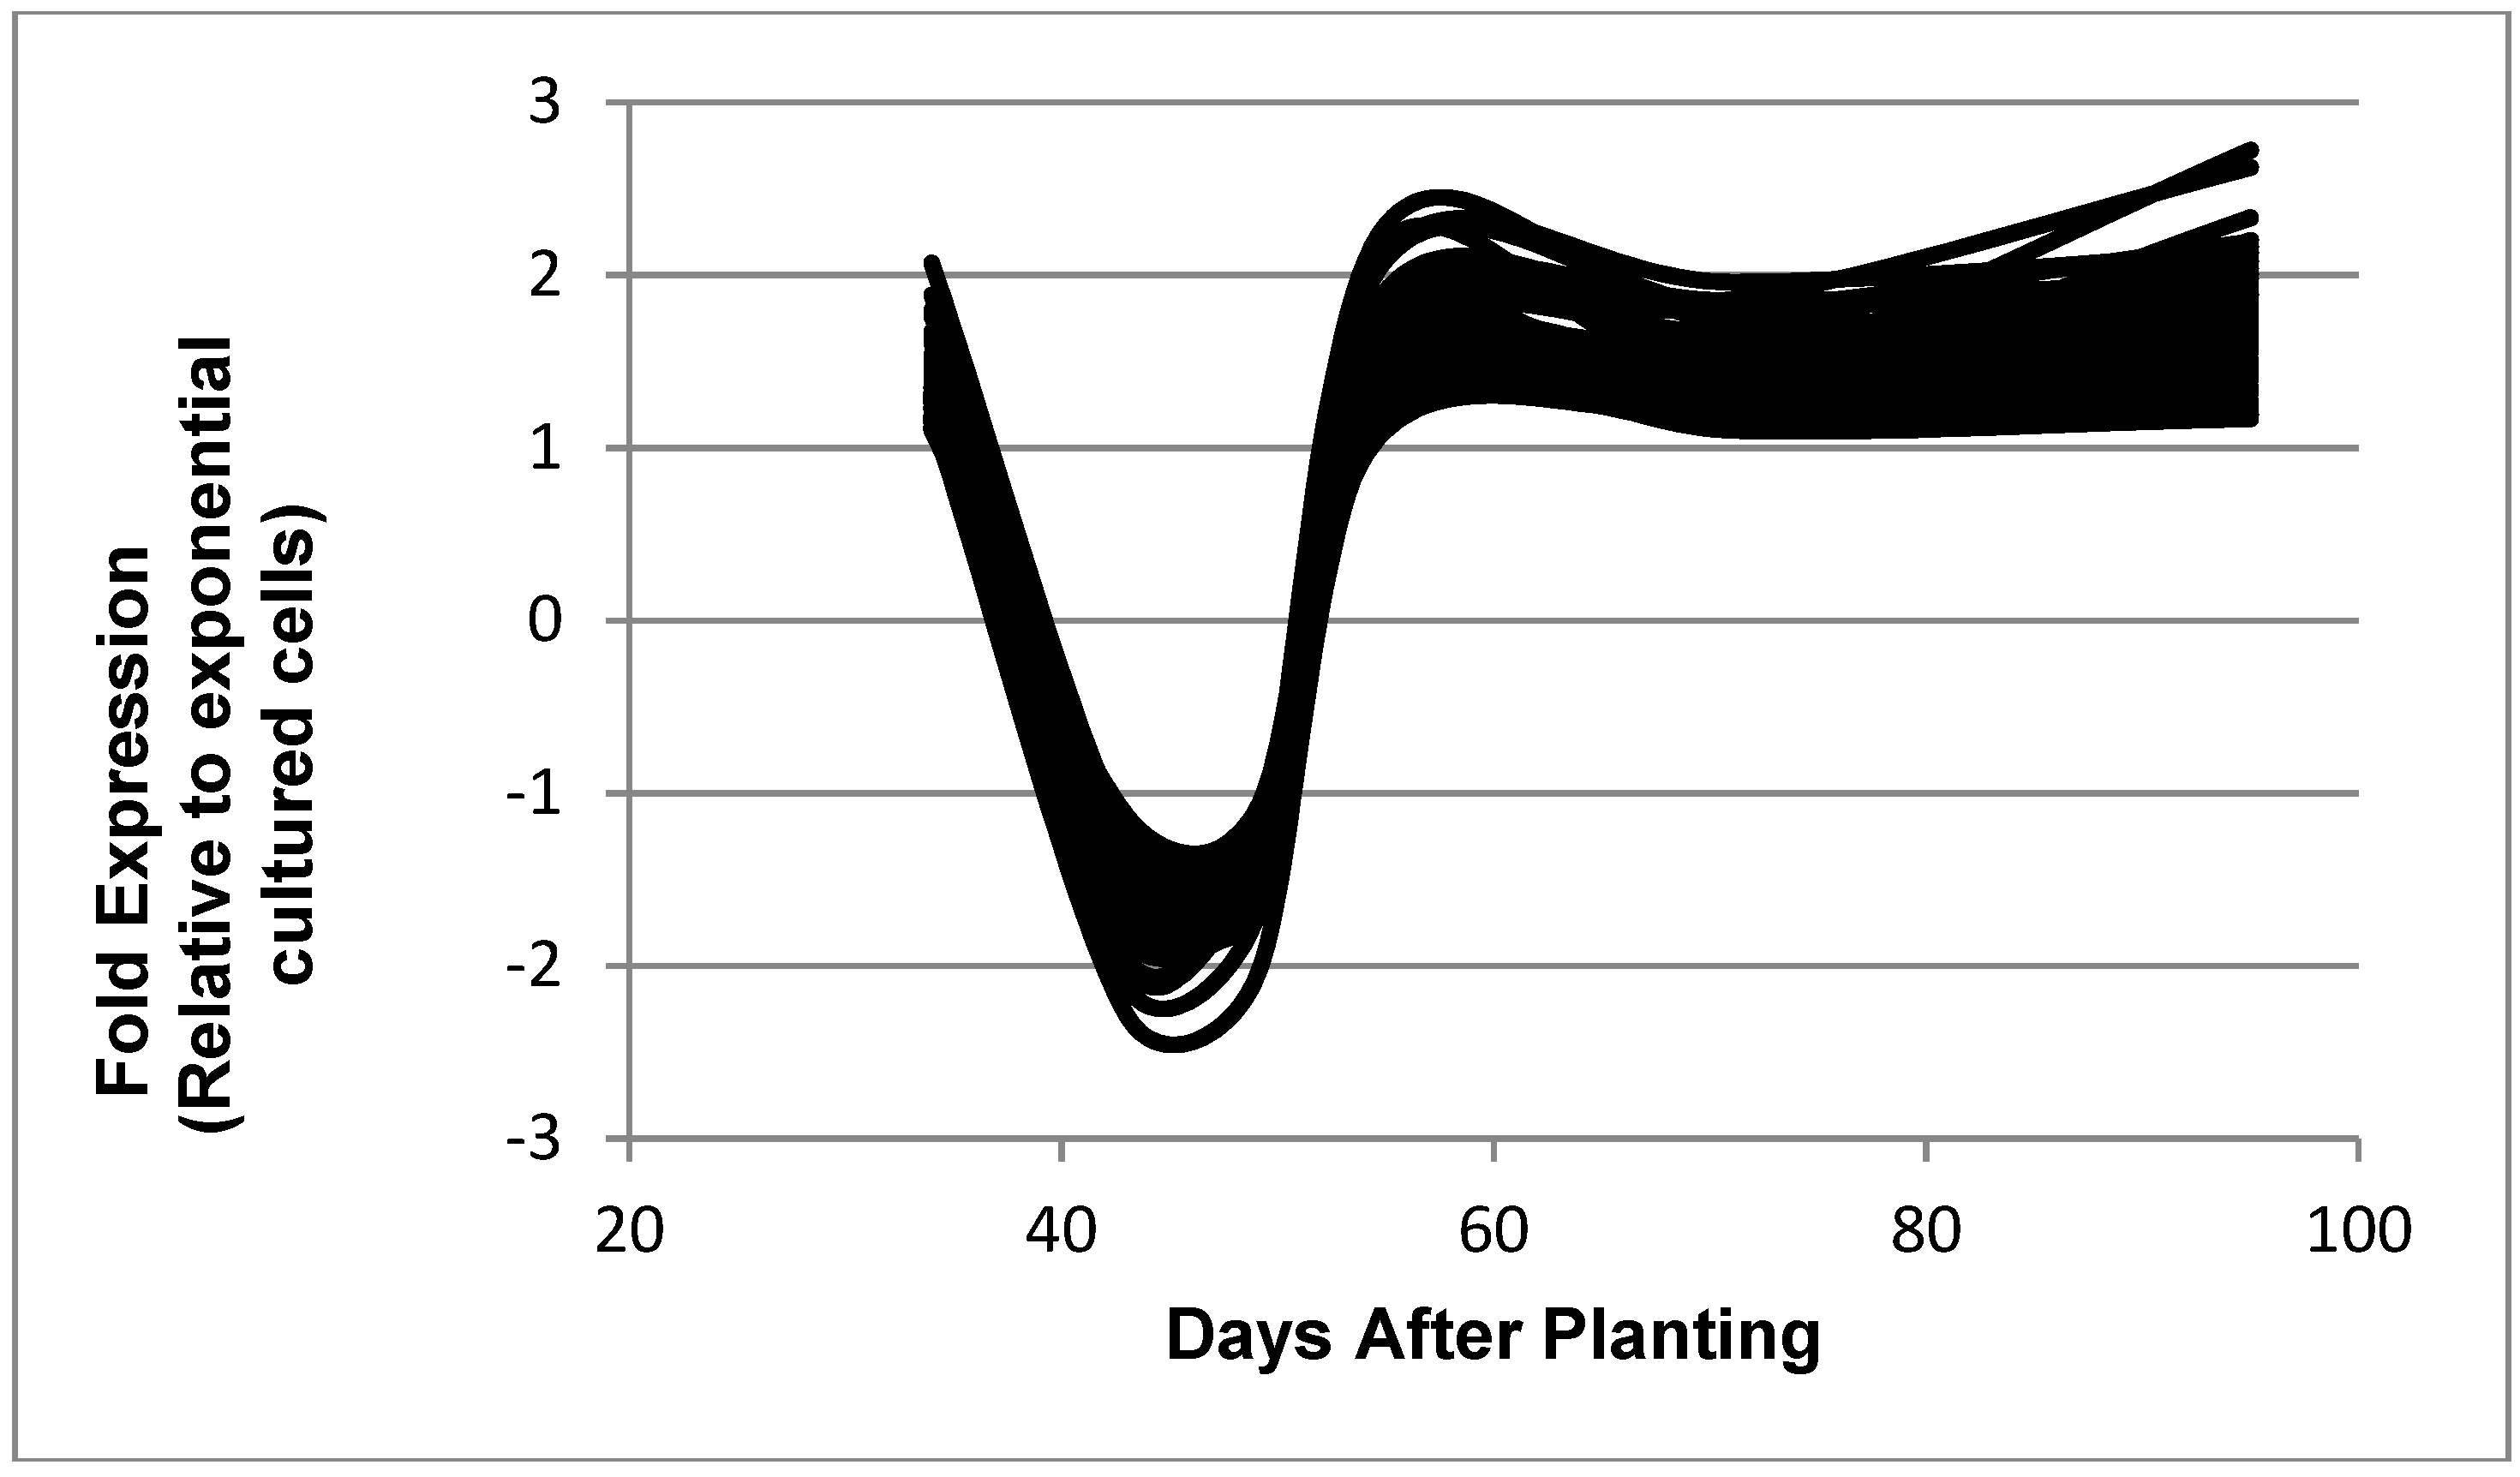
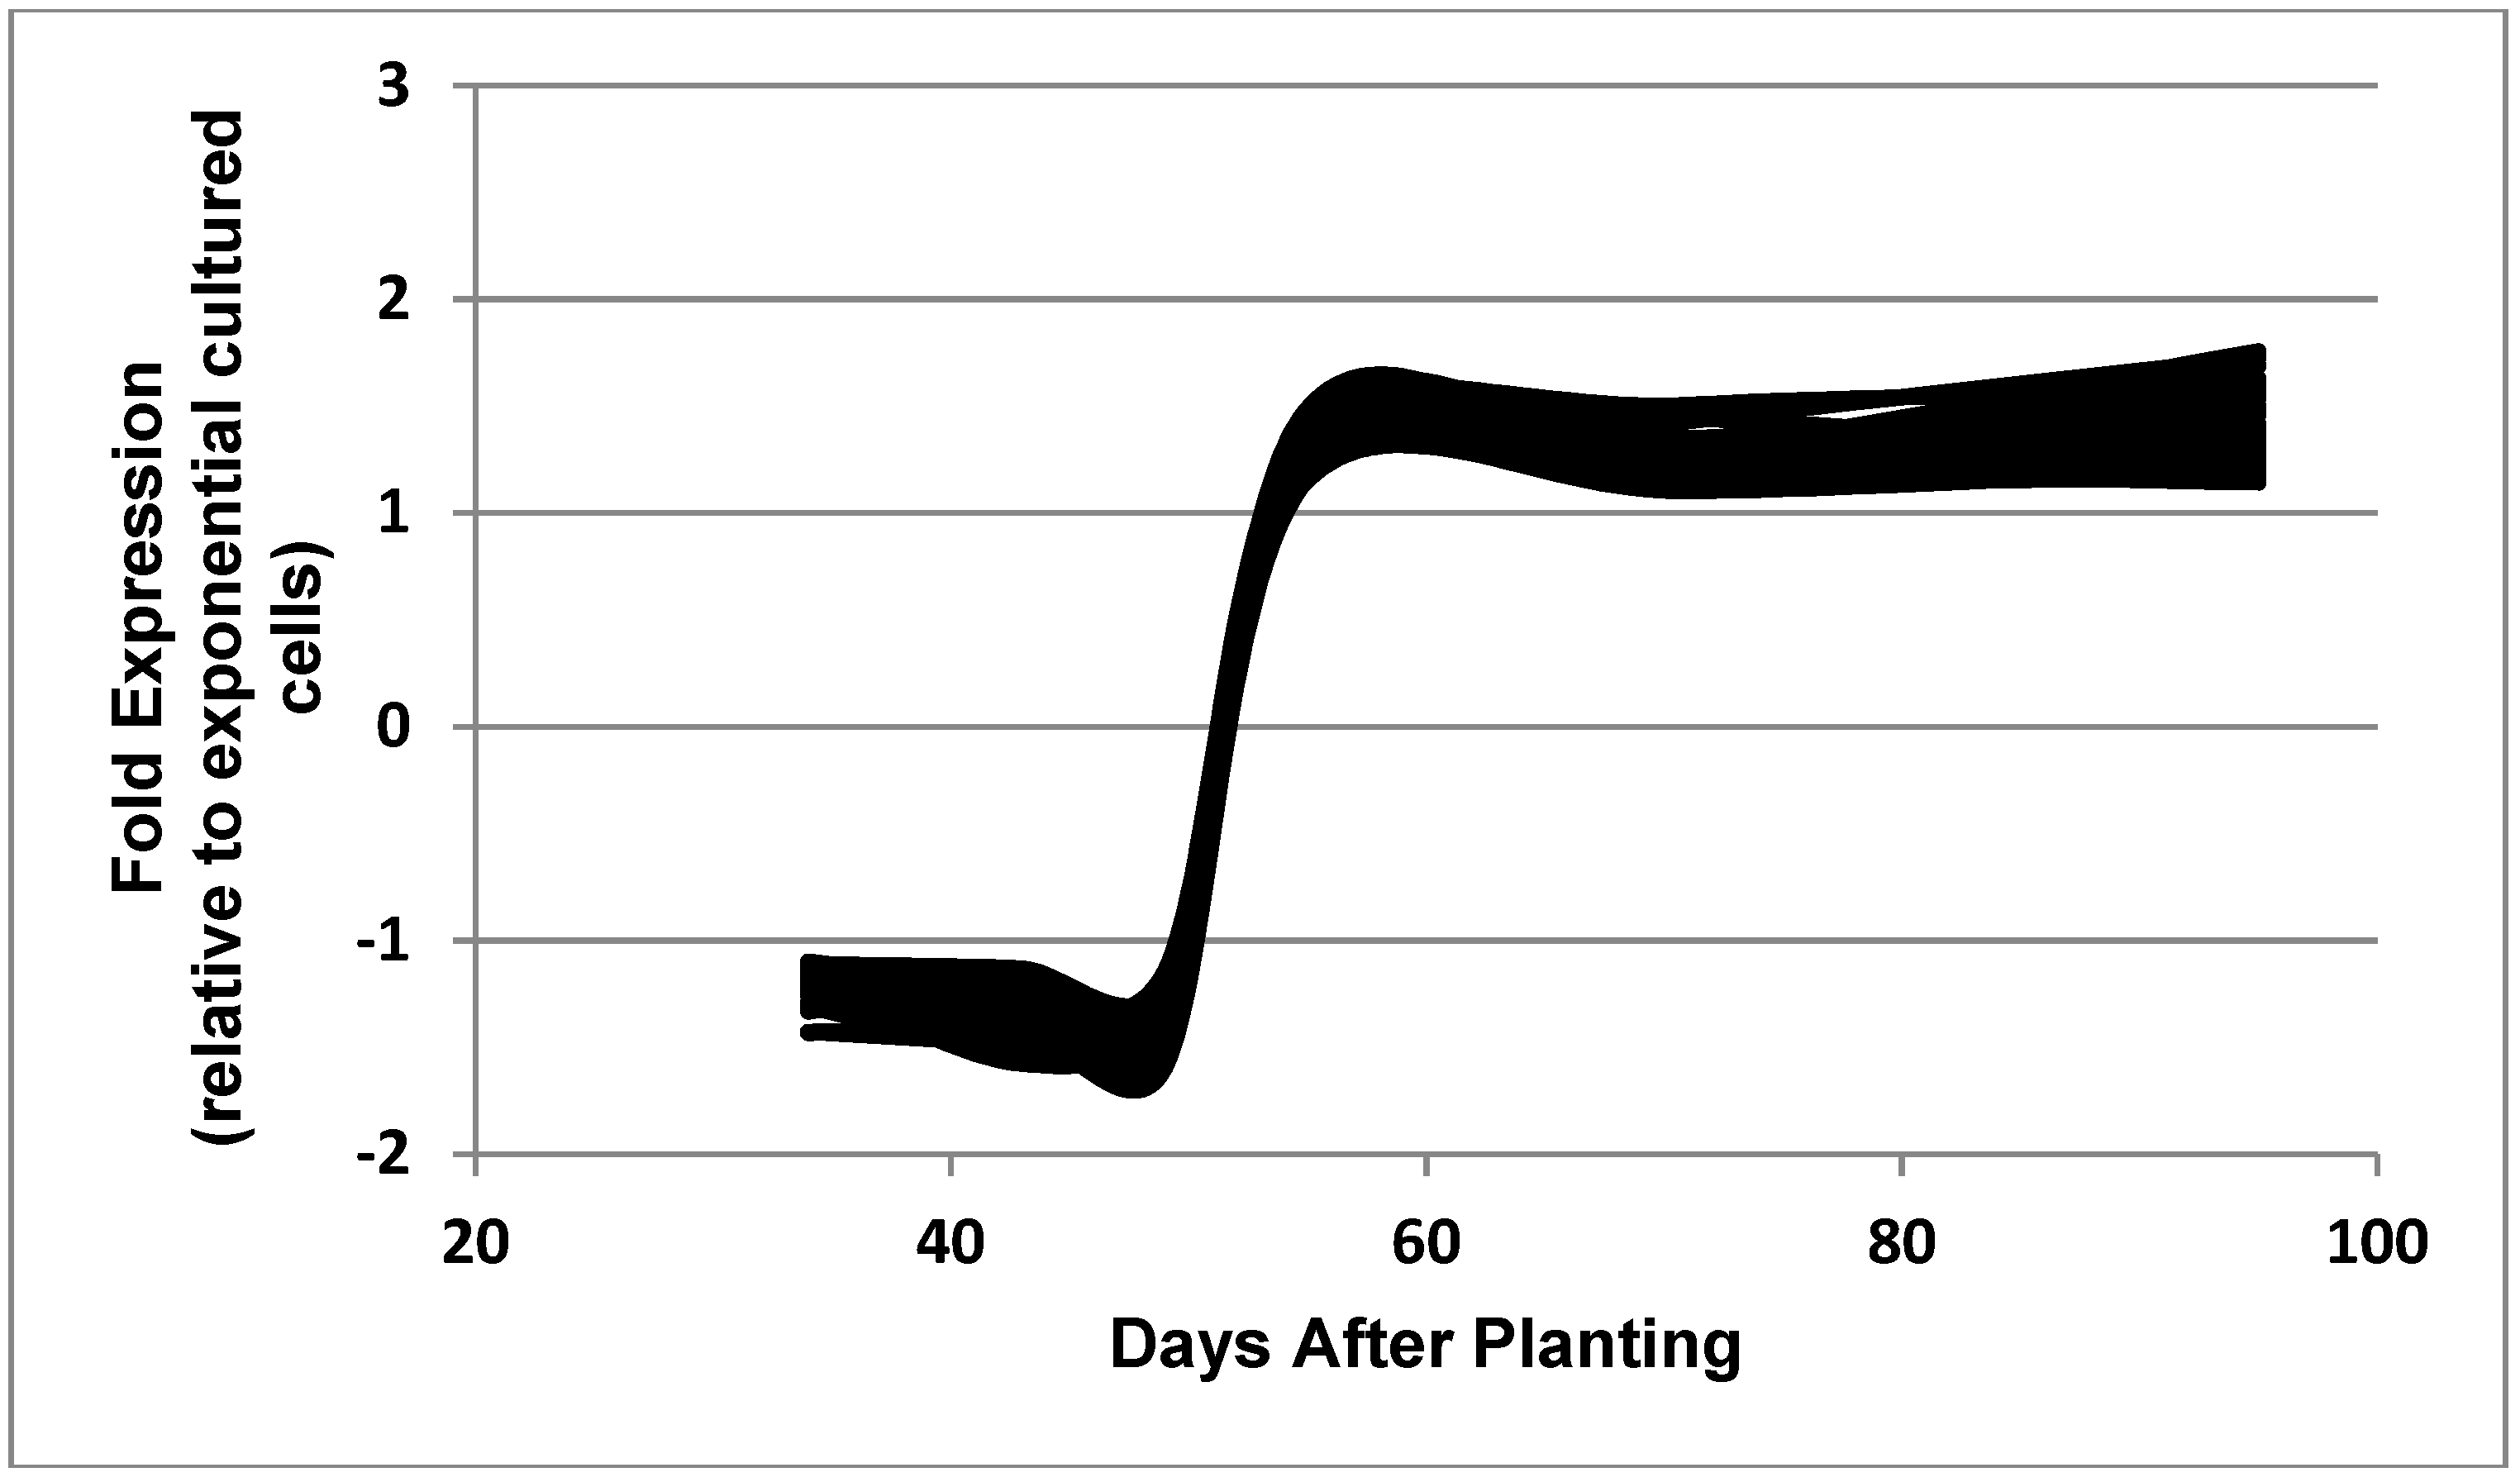
2.2. Global Gene Expression
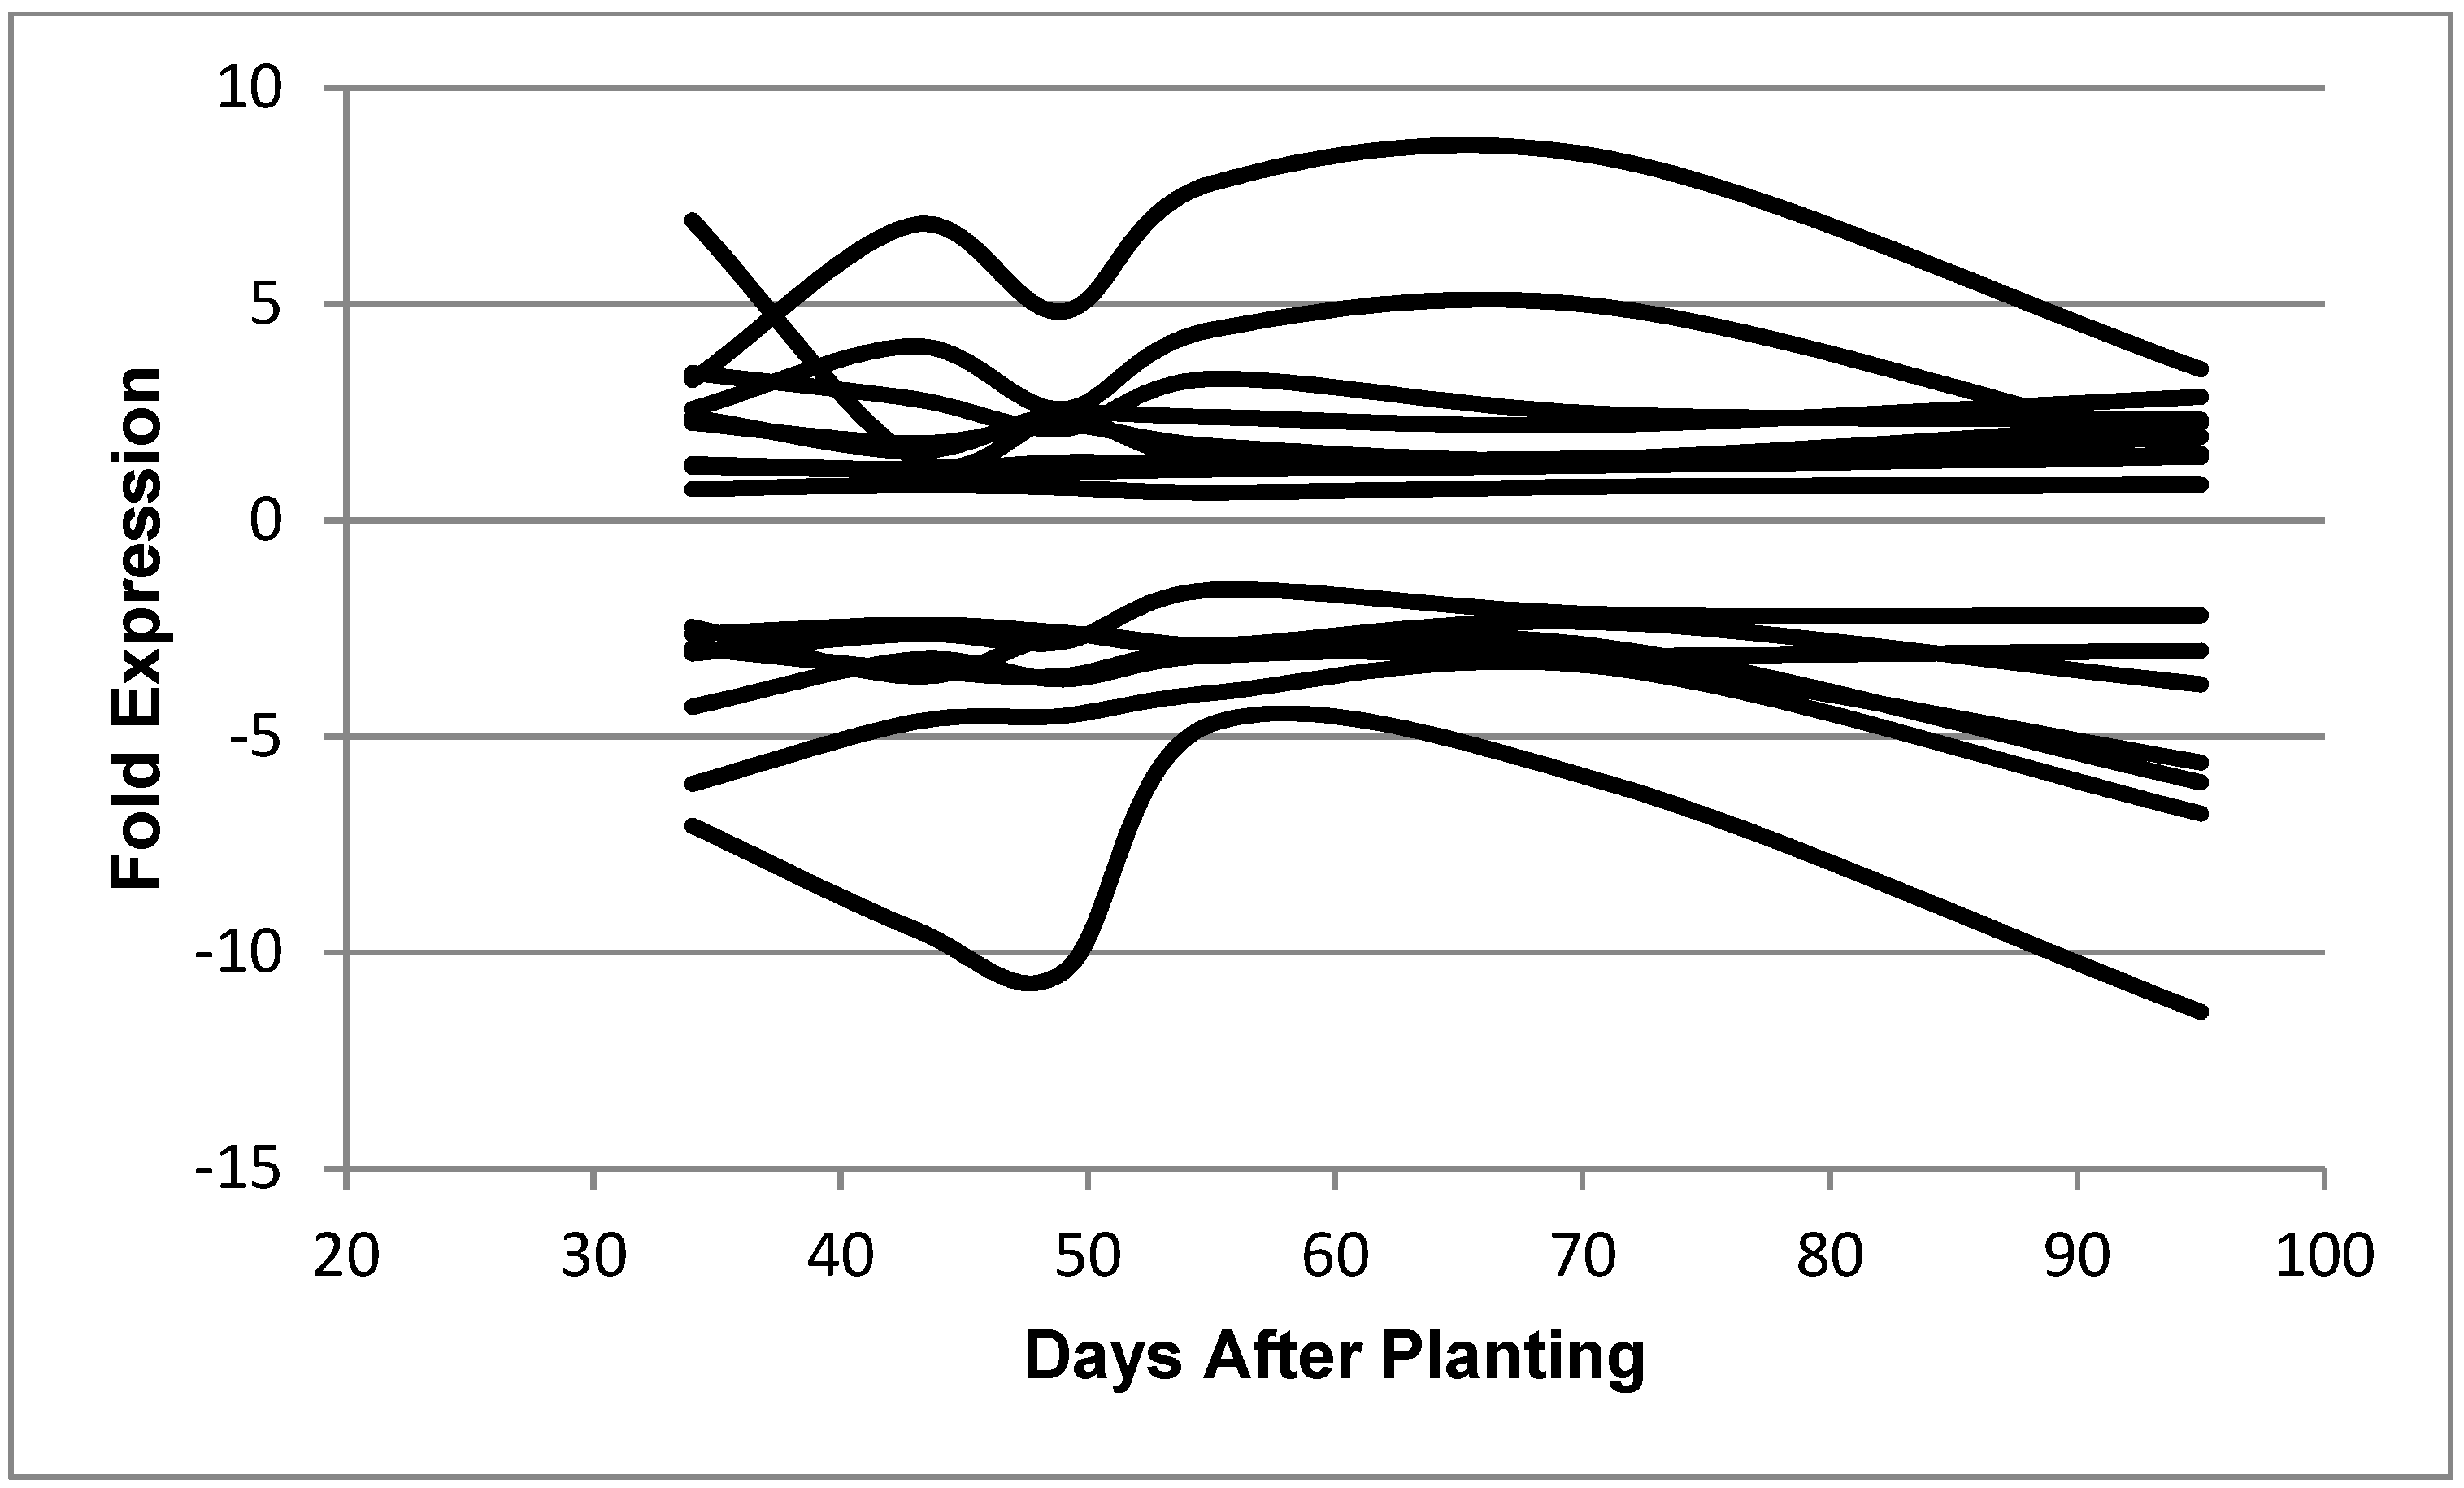
2.3. Expression Patterns: Constitutive
2.4. Expression Patterns: Nitrogen-Fixation-Related
2.5. Molecular Signatures
3. Discussion
4. Materials and Methods
4.1. Fabrication of the Spotted Oligonucleotide Microarray for B. diazoefficiens
4.2. Plant Growth, Acetylene Reduction, Nodule Lignification, and Bacteroid Isolation
4.3. Bacteria Growth and Media
4.4. RNA Isolation
4.5. cDNA Synthesis and Hybridization
4.6. Data Analysis
4.7. Quantitative Reverse Transcription-PCR (qRT-PCR) Analysis
4.8. Electron Microscopy
Author Contributions
Funding
Acknowledgments
Conflicts of Interest
References
- Cermola, M.; Fedorova, E.; Taté, R.; Riccio, A.; Favre, R.; Patriarca, E.J. Nodule invasion and symbiosome differentiation during Rhizobium etli-Phaseolus vulgaris symbiosis. Mol. Plant-Microbe Interact. 2000, 13, 733–741. [Google Scholar] [CrossRef] [PubMed]
- Gage, D.J. Nodule Development in Legumes. In Nitrogen Fixation in Crop Production; Emerich, D.W., Krishnan, H.B., Eds.; American Society of Agronomy: Madison, WI, USA, 2009; pp. 1–12. ISBN 978-0-89118-170-5. [Google Scholar]
- Hirsch, A.M. Developmental biology of legume nodulation. New Phytol. 1992, 122, 211–237. [Google Scholar] [CrossRef]
- Oldroyd, G.E.D.; Murray, J.D.; Poole, P.S.; Downie, J.A. The rules of engagement in the legume-rhizobial symbiosis. Ann. Rev. Genet. 2011, 45, 119–144. [Google Scholar] [CrossRef]
- Vasse, J.; de Billy, F.; Camut, S.; Truchet, G. Correlation between ultrastructural differentiation of bacteroids and nitrogen fixation in alfalfa nodules. J. Bacteriol. 1990, 172, 4295–4306. [Google Scholar] [CrossRef] [PubMed]
- Karr, D.B.; Emerich, D.W. Uniformity of microsymbiont population from soybean nodules with respect to buoyant density. Plant Physiol. 1988, 86, 693–699. [Google Scholar] [CrossRef] [PubMed]
- Karr, D.B.; Suzuki, F.; Waters, J.K.; Emerich, D.W. Further evidence for the uniformity of the microsymbiont population from soybean nodules. J. Plant. Physiol. 1990, 136, 659–663. [Google Scholar] [CrossRef]
- Klucas, R.V. Studies on soybean nodule senescence. Plant Physiol. 1974, 54, 612–616. [Google Scholar] [CrossRef]
- Muller, J.; Wiemken, A.; Boller, T. Redifferentiation of bacteria isolated from Lotus japonicus root nodules colonized by Rhizobium sp. NGR234. J. Exp. Bot. 2001, 52, 2181–2186. [Google Scholar] [CrossRef]
- Pfeiffer, N.E.; Torres, C.M.; Wagner, F.M. Proteolytic activity in soybean root nodules. Activity in host cell cytosol and bacteroids throughout physiological development and senescence. Plant Physiol. 1983, 71, 797–802. [Google Scholar] [CrossRef]
- Puppo, A.; Groten, K.; Bastain, F.; Carzaniga, R.; Soussi, M.; Lucas, M.M.; de Felipe, M.R.; Harrison, J.; Vanacker, H.; Fover, C.H. Legume nodule senescence: Roles for redox and hormone signalling in the orchestration of the natural aging process. New Phytol. 2005, 165, 683–701. [Google Scholar] [CrossRef]
- Van de Velde, W.; Guerra, J.C.P.; De Keyser, A.; De Rycke, R.; Rombauts, S.; Maunoury, N.; Mergaert, P.; Kondorosi, E.; Holsters, M.; Goormachtig, S. Aging in Legume Symbiosis. A Molecular View on Nodule Senescence in Medicago truncatula. Plant Physiol. 2006, 141, 711–720. [Google Scholar] [CrossRef] [PubMed]
- Strodtman, K.N.; Franck, S.; Tindall, R.; Jensen, C.; Sarma, A.D.; Emerich, D.W. Bradyrhizobium japonicum bacteroid appendages expressed in senescing and argon-treated soybean nodules. Symbiosis 2011, 54, 95–100. [Google Scholar] [CrossRef]
- Groten, K.; Dutilleul, C.; van Heerden, P.D.; Vanacker, H.; Bernard, S.; Finkemeier, I.; Dietz, K.J.; Fover, C.H. Redox regulation of peroxiredoxin and proteinases by ascorbate and thiols during pea root nodule senescence. FEBS Lett. 2006, 580, 1269–1276. [Google Scholar] [CrossRef] [PubMed]
- McDermott, T.R.; Graham, P.H.; Brandwein, D.H. Viability of Bradyrhizobium japonicum bacteroids. Arch. Microbiol. 1987, 148, 100–106. [Google Scholar] [CrossRef]
- Tsien, H.C.; Cain, P.S.; Schmidt, E.L. Viability of rhizobium bacteroids. Appl. Environ. Microbiol. 1977, 34, 854–856. [Google Scholar] [PubMed]
- Chang, W.-S.; Frank, W.L.; Cytryn, E.; Jeong, S.; Joshi, T.; Emerich, D.W.; Sadowsky, M.J.; Xu, D.; Stacey, G. An oligonucleotide microarray for transcriptional profiling of Bradyrhizobium japonicum. Mol. Plant-Microbe Interact. 2007, 20, 1298–1307. [Google Scholar] [CrossRef] [PubMed]
- Cytryn, E.J.; Sangurdekar, D.P.; Streeter, J.G.; Franck, W.L.; Chang, W.-S.; Stacey, G.; Emerich, D.W.; Joshi, T.; Xu, D.; Sadowsky, M.J. Transcriptional and physiological responses of Bradyrhizobium japonicum to dessication-induced stress. J. Bacteriol. 2007, 189, 6751–6762. [Google Scholar] [CrossRef] [PubMed]
- Franck, W.L.; Chang, W.-S.; Qiu, J.; Sugawara, M.; Sadowsky, M.J.; Smith, S.A.; Gary Stacey, G. Whole-Genome Transcriptional Profiling of Bradyrhizobium japonicum during Chemoautotrophic Growth. J. Bacteriol. 2008, 190, 6697–6705. [Google Scholar] [CrossRef]
- Franck, S.; Franck, W.L.; Birke, S.R.; Chang, W.-S.; Sangurdekar, D.P.; Cytryn, E.; Joshi, T.; Sadowsky, M.; Stacey, G.; Xu, D.; et al. Comparative transcriptomic analysis of symbiotic Bradyrhizobium japonicum. Symbiosis 2014, 63, 123–135. [Google Scholar] [CrossRef]
- Pessi, G.; Ahrens, C.H.; Rehrauer, H.; Lindemann, A.; Hauser, F.; Fischer, H.-M.; Hennecke, H. Genome-wide transcript analysis of Bradyrhizobium japonicum bacteroids in soybean root nodules. Mol. Plant-Microbe Interact. 2007, 20, 1353–1363. [Google Scholar] [CrossRef]
- Kaneko, T.; Nakamura, Y.; Sato, S.; Minamisawa, K.; Uchiumi, T.; Sasmoto, S.; Watanabe, A.; Idesawa, K.; Iriguchi, M.; Kawashima, K.; et al. Complete genomic sequence of nitrogen fixing symbiotic bacterium Bradyrhizobium japonicum USDA110. DNA Res. 2002, 9, 189–197. [Google Scholar] [CrossRef]
- Berthoumieux, S.; de Jong, H.; Baptist, G.; Pintel, C.; Ranquet, C.; Ropers, D.; Geiselman, J. Shared control of gene expression in bacteria by transcription factors and global physiology of the cell. Mol. Syst. Biol. 2013, 9, 634–648. [Google Scholar] [CrossRef] [PubMed]
- Strodman, K.N.; Frank, S.; Stevenson, S.; Thelen, J.J.; Emerich, D.W. Proteomic Characterization of Bradyrhizobium diazoefficiens Bacteroids Reveals a Post-symbiotic, Hemibiotrophic-like Lifestyle of the Bacteria within Senescing Soybean Nodules. Int. J. Mol. Sci. 2018. Under review. [Google Scholar]
- Lee, S.-J.; Rose, J.K.C. Mediation of the transition from biotrophy to necrotrophy in hemibriotrophic plant pathogens by secreted effector proteins. Plant Signal. Behav. 2010, 5, 769–772. [Google Scholar] [CrossRef] [PubMed]
- Spanu, P.D.; Panstruga, R. Editorial: Biotrophic Plant-Microbe Interactions. Front. Plant Sci. 2017, 8, 192. [Google Scholar] [CrossRef] [PubMed]
- Quax, T.E.F.; Claassens, N.J.; Söll, D.; van der Oost, J. Codon bias as a means to fine-tune gene expression. Mol. Cell. 2015, 59, 149–161. [Google Scholar] [CrossRef] [PubMed]
- Zuckerkandl, E. Polite DNA: Functional density and functional compatibility in genomes. J. Mol. Evol. 1986, 24, 12–27. [Google Scholar] [CrossRef] [PubMed]
- Wang, H.-C.; Hickey, D.A. Evidence for strong selective constraint acting on nucleotide composition of 16S ribosomal RNA genes. Nucleic Acid Res. 2002, 30, 2501–2507. [Google Scholar] [CrossRef] [PubMed]
- Borodovsky, M.; McIninch, J. GENEMARK: Parallel gene recognition for both DNA strands. Comput. Chem. 1993, 17, 123–133. [Google Scholar] [CrossRef]
- Salzberg, S.L.; Delcher, A.L.; Kasif, S.; White, O. Microbial gene identification using interpolated Markov models. Nucleic Acids Res. 1998, 26, 544–548. [Google Scholar] [CrossRef] [PubMed]
- Schwinghamer, E.A.; Evans, H.J.; Dawson, M.D. Evaluation of effectiveness in mutant strains of Rhizobium by acetylene reduction relative to other criterial of N2 fixation. Plant Soil. 1970, 33, 192–212. [Google Scholar] [CrossRef]
- Mitra, P.P.; Loque, D. Histochemical staining of Arabidopsis thaliana secondary cell wall elements. J. Vis. Exp. 2014, 87. [Google Scholar] [CrossRef]
- Green, L.S.; Emerich, D.W. The formation of nitrogen-fixing bacteroids is delayed but not abolished in soybean infected by an α-ketoglutarate dehydrogenase-deficient mutant of Bradyrhizobium japonicum. Plant Physiol. 1997, 114, 1359–1368. [Google Scholar] [CrossRef] [PubMed]
- Cole, M.A.; Elkan, G.H. Transmissible resistance to penicillin G, neomycin, and chloramphenicol in Rhizobium japonicum. Antimicrob. Agents Chemother. 1973, 4, 248–253. [Google Scholar] [CrossRef] [PubMed]
- Aiba, H. Transcription of the Escherichia coli adenylate cyclase gene is negatively regulated by cAMP-cAMP receptor protein. J. Biol. Chem. 1985, 260, 3063–3070. [Google Scholar] [PubMed]
- Duggan, D.J.; Bittner, M.; Chen, Y.; Meltzer, P.; Trent, J.M. Expression cDNA microarrays. Nat. Genet. 1999, 21, 10–14. [Google Scholar] [CrossRef] [PubMed]
- Rosa, G.J.M.; Steibel, J.P.; Tempelman, R.J. Reassessing design and analysis of two-color microarray experiments using mixed effects models. Comp. Funct. Genom. 2005, 6, 123–131. [Google Scholar] [CrossRef]
- Kerr, M.K.; Churchill, G.A. Statistical design and the analysis of gene expression microarray data. Genet. Res. 2001, 77, 123–128. [Google Scholar] [CrossRef]
- Tusher, V.G.; Tibshirani, R.; Chu, G. Significance analysis of microarrays applied to the ionizing radiation response. Proc. Natl. Acad. Sci. USA 2001, 98, 5116–5121. [Google Scholar] [CrossRef]


| Category | Upregulated | Downregulated | Constitutive | Total |
|---|---|---|---|---|
| Amino acid metabolism | 9 (1.4%) | 32 (3.3%) | 17 (1.8%) | 58 |
| Cofactors, prosthetic groups, and carriers | 13 (2.0%) | 20 (2.0%) | 12 (1.3%) | 45 |
| Cell envelope | 4 (0.6%) | 28 (2.9%) | 14 (1.5%) | 46 |
| Cellular processes | 15 (2.3%) | 66 (6.8%) | 60 (6.5%) | 141 |
| Central intermediary metabolism | 40 (6.1%) | 30 (3.1%) | 46 (5.0%) | 116 |
| DNA replication, recombination, and repair | 5 (0.8%) | 11 (1.1%) | 9 (1.0%) | 25 |
| Energy metabolism | 19 (3%) | 54 (5.5%) | 40 (4.3%) | 113 |
| Fatty acid, phospholipid, and sterol metabolism | 6 (0.9%) | 23 (2.4%) | 17 (1.8%) | 46 |
| Purines, pyrimidines, nucleosides, and nucleotides | 2 (0.3%) | 15 (1.5%) | 11 (1.2%) | 28 |
| Regulatory functions | 39 (6.0%) | 56 (5.7%) | 55 (5.9%) | 150 |
| Transcription | 5 (0.8%) | 10 (1.0%) | 11 (1.2%) | 26 |
| Translation | 9 (1.4%) | 65 (6.7%) | 51 (5.5%) | 125 |
| Transport and binding proteins | 46 (7.0%) | 61 (6.3%) | 63 (6.8%) | 170 |
| Other functions | 72 (11.0%) | 81 (8.3%) | 78 (8.4%) | 231 |
| Hypothetical | 369 (56.5%) | 424 (43.4%) | 443 (47.8%) | 1236 |
| Total | 653 | 976 | 927 | 2556 |
| Function | Rhizobase | Accession | Location |
|---|---|---|---|
| ABC transporter substrate-binding protein | Bll4544 | BAC49809 | Periplasm |
| FixK2 protein | Blr2757 | CAA06287 | Cytoplasmic |
| C-4 Dicarboxylate transport protein | Bll1718 | NP_768358 | Cytoplasmic membrane |
| Iron response regulator | Bll0768 | AHY55539 | Cytoplasm |
| Citrate synthase | Blr4839 | NP_771479 | Cytoplasm |
| Aspartate aminotransferase | Blr1686 | NP_768326 | Cytoplasm |
| Divalent cation resistant protein | Blr4935 | NP_771575 | Outer Membrane |
| Alcohol dehydrogenase | Bll4482 | NP_771122 | Unknown |
| Taurine Dioxygenase | Bll2125 | APO50734 | Cytoplasm |
| Β-Lactamase | Bll2252 | AND87779 | Cytoplasm |
| Tripartite tricarboxylate transporter TctB | Bll3050 | AND88496 | Cytoplasmic membrane |
| Tripartite tricarboxylate transporter substrate binding protein | Blr3161 | AWO90155 | Periplasm |
| 3-β hydroxysteroid dehydrogenase | Bll4299 | AND89578 | Cytoplasm |
| C4-Dicarboxylate ABC transporter | Blr5025 | AND90243 | Periplasm |
| (2Fe-2S)-binding protein | Bll6238 | AND91348 | Cytoplasm |
| Hemolysin D | Bll6258 | AND91366 | Cytoplasmic membrane |
| Hemolysin secretion protein D | Blr3031 | AND88479 | Unknown |
| Dienelactone hydrolase | Bll7509 | AWO94311 | Unknown |
| Serine hydrolase | Bll8153 | AWO94832 | Cytoplasmic membrane |
| Asp/Glu/hydantoin racemase | Blr3294 | AND88720 | Unknown |
| Phospholipase | Blr5550 | AWO92367 | Unknown |
| Allophanate hydrolase | Blr3633 | AND88989 | Cytoplasm |
| Anhydro-N-acetylmuramic acid kinase | Blr4331 | AND89607 | Unknown |
| Dolichol-phosphate mannosyltransferase | Blr4442 | NP_771082 | Cytoplasmic membrane |
| ATPase | Blr7361 | AND92326 | Unknown |
| 2-Hydroxyhepta-2,4-diene-1,7-dioate isomerase | Blr7891 | AND92773 | Cytoplasm |
| Function | Rhizobase | Accession | Location |
|---|---|---|---|
| Glutamate synthetase I | Blr4835 | BAC50100 | Cytoplasm |
| Proline iminopeptidase | Bll4403 | BAC49668 | Cytoplasm |
| Pantoate-beta-alanine ligase | Blr6152 | BAC50427 | Cytoplasm |
| β-ketoadipyl CoA thiolase | Blr0925 | BAC46190 | Unknown |
| Glycerate dehydrogenase | Bll2918 | BAC48183 | Cytoplasm |
| Cytochrome C oxidase | Bll3783 | BAC49048 | Cytoplasmic membrane |
| Murein endopeptidase | Blr8158 | BAC53423 | Periplasm |
| Ribose 5-phosphate isomerase | Blr3755 | BAC49020 | Cytoplasm |
| 3-Deoxy-manno-octulosonate cytidylyltransferase | Bll1422 | BAC46687 | Cytoplasm |
| Sugar ABC transporter permease | Bll2675 | BAC47940 | Cytoplasmic membrane |
| Flagellar protein | Bll6868 | BAC52133 | Extracellular |
| 3-Oxoacyl-(acyl-carrier-protein) synthase II | Bll3809 | BAC49074 | Unknown |
| Branched-chain amino acid ABC transporter substrate-binding protein | Bll0979 | BAC46244 | Periplasm |
| Cytochrome O ubiquinol oxidase | Blr2715 | AND93893 | Cytoplasmic membrane |
| Glycosyl hydrolase | Blr6771 | NP_773411 | Cytoplasm |
| Alkylhydroperoxidase | Bl57595 | AND92531 | Unknown |
| 3-Oxoacyl-ACP reductase | Bll4596 | AWO91529 | Periplasm |
| Methyltransferase | Blr2533 | AWO89558 | Cytoplasm |
| Patatin-like phospholipase | Bll7964 | AWO94740 | Extracellular |
| LysE family translocator | Bll6498 | PDT61394 | Cytoplasmic membrane |
| Amidohydrolase | Bll7610 | AWO94407 | Cytoplasm |
| Phosphodiesterase | Bll4141 | AWO91078 | Cytoplasm |
| Pyridoxamine 5′-phosphate oxidase | Blr4155 | AWO91090 | Cytoplasm |
| Peptide ABC transporter permease | Blr0310 | BAC45575 | Cytoplasmic membrane |
| TetR-like transcriptional regulator | Bll7298 | BAC52563 | Unknown |
| enoyl-CoA hydratase | Bll0116 | AWO87220 | Cytoplasm |
| Function | Rhizobase | Accession | Location |
|---|---|---|---|
| Citrate-proton symporter | Bll1864 | WP_06090909 | Cytoplasmic Membrane |
| Ribose 5-phosphate isomerase | Blr3755 | NP_770395 | Cytoplasm |
| Acyltransferase | Blr4337 | AND94080 | Cytoplasmic Membrane |
| Thymydilate kinase | Bll4518 | NP_771158 | Cytoplasm |
| Homoserine O-succinyltransferase | Bll0244 | BAC45509 | Cytoplasm |
| Proline iminopeptidase | Bll4403 | NP_771043 | Cytoplasm |
| 3-Dehydroquinate dehydratase | Bll4292 | NP_770932 | Cytoplasm |
| Epoxide hydrolase | Blr2881 | NP_769521 | Unknown |
| ATP-dependent DNA helicase | Bll0242 | NP_766882 | Cytoplasm |
| Pyridoxamine 5′-phosphate oxidase | Bll7835 | AND92725 | Unknown |
| Beta-ketoadipyl CoA thiolase | Blr0925 | NP_767565 | Cytoplasm |
| Branched chain amino acid ABC transporter permease protein | Blr2923 | NP_769563 | Cytoplasmic Membrane |
| Sugar ABC transporter permease protein | Bll2675 | NP_769315 | Cytoplasmic Membrane |
| 3-Deoxy-manno-octulosonate cytidylyltransferase | Bll1422 | WP_011084239 | Cytoplasm |
| Exoribonuclease | Blr5112 | NP_771752 | Cytoplasm |
| Δ9 acyl-lipid fatty acid desaturase | Bll4594 | WP_011087365 | Cytoplasmic Membrane |
| DNA glycosylase | Blr6661 | NP_773301 | Unknown |
| Outer membrane channel lipoprotein | Bll4321 | NP_770961 | Outer Membrane |
| Cytochrome P450 | Bll0557 | NP_767197 | Unknown |
| Transcriptional regulatory protein IclR family | Blr3939 | NP_770579 | Cytoplasm |
| Purine-binding chemotaxis protein | Blr2193 | NP_768833 | Cytoplasm |
| Patatin-like phospholipases | Bll7964 | AWO94740 | Cytoplasm |
| Branched-chain amino acid ABC transporter substrate-binding protein | Bll0979 | WP_011083799 | Periplasm |
| Phosphoserine aminotransferase | Bll7402 | NP_774042 | Cytoplasm |
| Rubrerythrin | Blr7895 | KOY06556 | Cytoplasmic Membrane |
| Expression Pattern/Function | Rare Codon | |||||||||
|---|---|---|---|---|---|---|---|---|---|---|
| TTA | TCT | TGT | CTA | ATA | ACT | AGT | AGA | GTA | All | |
| Symbiotic | 1.30ABC | 3.01ABCD | 2.20AB | 1.91AB | 2.66A | 4.11ABCD | 3.41ABC | 3.09ABC | 2.80AB | 2.72ABCDEF |
| Post-Symbiotic | 0.43A | 2.31 | 1.33 | 2.23CD | 2.01 | 3.30E | 2.45D | 2.84DEF | 2.91 | 2.20AGHIJ |
| Reciprocal Symbiotic | 1.07 | 2.76 | 1.46 | 2.18 | 1.34 | 3.00F | 2.30E | 2.16G | 2.28 | 2.06BK |
| Constitutive | 0.35B | 1.06A | 0.97 | 0.80AC | 1.05 | 1.65AEF | 1.62AF | 1.48AH | 1.89 | 1.20CGKLMN |
| Transcription | 0.49C | 1.43B | 0.53A | 1.20 | 0.43A | 2.18B | 2.49G | 1.29BDEI | 1.30A | 1.26DHLO |
| 30S Ribosome Genes | 0 * | 1.72C | 0 * | 0 * | 0 * | 2.36C | 1.07B | 0.78 | 0.57B | 0.72EIM |
| 50S Ribosome Genes | 0 * | 1.82D | 0.43B | 0.12BD | 0 * | 2.69D | 0.29CDEFG | 0.14CFGHI | 1.87 | 0.82FJNO |
| Expression Pattern/Function | %GC | %AG | %A | %T | %G | %C |
|---|---|---|---|---|---|---|
| Symbiotic | 63.4AB | 57.92ABCDEF | 18.59AB | 18.19ABCD | 31.40AB | 32.02A |
| Post-Symbiotic | 63.88C | 49.64AG | 18.00ACD | 18.11EFGH | 31.64A | 32.23 |
| Reciprocal Symbiotic | 64.13 | 49.19BHKL | 17.72EFG | 18.14IJK | 31.46 | 32.66 |
| Constitutive | 65.18ACD | 50.39CIK | 18.09BHIJ | 16.77AEILM | 32.31BC | 32.87A |
| Transcription | 64.94BE | 51.12DL | 18.92EHKL | 16.15BFJN | 32.16 | 32.77 |
| 30S Ribosome Proteins | 63.23E | 51.93EJ | 20.97CDFIK | 15.81CGL | 30.96CD | 32.26 |
| 50S Ribosome Proteins | 63.62D | 53.08FGHIJ | 21.30GJL | 15.00DHKMN | 31.77D | 31.92 |
© 2018 by the authors. Licensee MDPI, Basel, Switzerland. This article is an open access article distributed under the terms and conditions of the Creative Commons Attribution (CC BY) license (http://creativecommons.org/licenses/by/4.0/).
Share and Cite
Franck, S.; Strodtman, K.N.; Qiu, J.; Emerich, D.W. Transcriptomic Characterization of Bradyrhizobium diazoefficiens Bacteroids Reveals a Post-Symbiotic, Hemibiotrophic-Like Lifestyle of the Bacteria within Senescing Soybean Nodules. Int. J. Mol. Sci. 2018, 19, 3918. https://doi.org/10.3390/ijms19123918
Franck S, Strodtman KN, Qiu J, Emerich DW. Transcriptomic Characterization of Bradyrhizobium diazoefficiens Bacteroids Reveals a Post-Symbiotic, Hemibiotrophic-Like Lifestyle of the Bacteria within Senescing Soybean Nodules. International Journal of Molecular Sciences. 2018; 19(12):3918. https://doi.org/10.3390/ijms19123918
Chicago/Turabian StyleFranck, Sooyoung, Kent N. Strodtman, Jing Qiu, and David W. Emerich. 2018. "Transcriptomic Characterization of Bradyrhizobium diazoefficiens Bacteroids Reveals a Post-Symbiotic, Hemibiotrophic-Like Lifestyle of the Bacteria within Senescing Soybean Nodules" International Journal of Molecular Sciences 19, no. 12: 3918. https://doi.org/10.3390/ijms19123918
APA StyleFranck, S., Strodtman, K. N., Qiu, J., & Emerich, D. W. (2018). Transcriptomic Characterization of Bradyrhizobium diazoefficiens Bacteroids Reveals a Post-Symbiotic, Hemibiotrophic-Like Lifestyle of the Bacteria within Senescing Soybean Nodules. International Journal of Molecular Sciences, 19(12), 3918. https://doi.org/10.3390/ijms19123918