


Abstract
The increasing atmospheric CO2 concentration is one of the major environmental challenges, necessitating not only emission reduction but also effective carbon utilization. Non-thermal plasma-catalytic CO2 conversion offers an efficient pathway under mild conditions by synergistically combining plasma activation with catalytic surface reactions. In this study, mesoporous ceria catalysts were synthesized by different methods and characterized using N2 adsorption–desorption, SEM, XRD, XPS, CO2-TPD, and XRF techniques. The materials exhibited distinct textural and electronic properties, including variations in surface area, pore structure, and basicity. Plasma-catalytic CO2 dissociation experiments were conducted in a dielectric barrier discharge reactor at near-room temperature. Among the synthesized catalysts, Ce(mp)-4 demonstrated the highest CO2 conversion of 32.3% at a 5 kV input voltage and superior energy efficiency, which can be attributed to its meso-macroporous structure that promotes microdischarge formation and enhances CO2 adsorption–desorption dynamics. CO was the only product obtained, with near-100% selectivity. Catalyst stability testing showed no deactivation while spent catalyst characterization indicated carbon-containing species. The findings in this study highlight the critical role of tailored pore structure and basic-site distribution in optimizing plasma-catalytic CO2 dissociation performance, offering a promising strategy for energy-efficient CO2 utilization.
1. Introduction
The continuous rise in atmospheric CO2 concentrations, primarily driven by fossil fuel combustion and industrial activities, has become one of the defining challenges of the 21st century. Elevated CO2 levels intensify global warming, alter weather patterns, and threaten ecosystems and human well-being. Addressing this issue requires not only strategies to reduce emissions but also technologies capable of converting CO2 into valuable products, thereby closing the carbon cycle and contributing to a sustainable energy future.
Carbon capture, utilization, and storage has emerged as a promising framework to mitigate CO2 emissions [1]. Within this approach, CO2 utilization is particularly attractive, as it transforms waste carbon into fuels, chemicals, and materials, simultaneously reducing environmental burden and generating economic value [2]. However, due to the high thermodynamic stability of the CO2 molecule, conventional thermal catalytic processes demand high energy input and harsh conditions, limiting their efficiency and scalability [3].
Non-thermal plasma technology offers an alternative pathway of CO2 conversion by providing highly energetic electrons and reactive species under near-ambient conditions. These species can effectively activate the CO2 molecule, overcoming the intrinsic energy barrier for dissociation [4]. When combined with suitable catalysts, plasma-based systems benefit from a synergistic effect: plasma facilitates molecular activation, while catalysts enhance adsorption, lower reaction barriers, and steer selectivity towards desired products [5]. This plasma–catalyst interaction enables CO2 conversion at milder operating conditions compared to traditional catalytic processes, offering both energetic and environmental advantages [6,7]. It should be noted that at the current stage of plasma-catalytic CO2 utilization technologies, the cost of the output product and the cost of the overall process are high. For example, the cost of CH3OH produced by the CO2 hydrogenation method in plasma is many times higher than that of CH3OH obtained through conventional processes. The economic feasibility of CO2 utilization using plasma is highly sensitive to the cost of electricity, thus ensuring affordable and reliable energy sources is essential for the economic viability of this method [8]. On the other hand, the impact of plasma enables reaction pathways, which are thermodynamically unfavorable, and the plasma-driven process may be the only way to conduct such processes with a satisfactory conversion of CO2. Thus, plasma-enabled CO2 conversion cannot compete with traditional processes at this moment but has potential to be implemented in the future.
Among the different plasma sources investigated, such as microwave [9], gliding arc [10,11], and dielectric barrier discharge (DBD), DBD reactors are the most widely studied owing to their operational simplicity, low operating temperature, and adaptability for catalyst integration [12]. The choice of catalyst remains a critical factor for efficient plasma-catalytic CO2 dissociation and the development of a suitable catalyst is a task of great importance. For example, transition metal compounds [13,14,15], metal oxides with oxygen vacancies (e.g., CeO2 [16,17,18,19] and In2O3 [20,21]), and basic oxides (MgO and CaO [22,23]) have shown particular promise, as they promote CO2 adsorption and facilitate bond cleavage [24]. Furthermore, combining these oxides in tailored catalytic formulations may enhance performance through the coexistence of basic sites and oxygen vacancy-driven redox activity [25]. Another catalyst property, which is essential in CO2 dissociation, is its porosity. In the recent study, we showed that supporting CeO2 on mesoporous materials such as MCM-41, SBA-15, and MCF affected the performance of CO2 decomposition. When using wide-porous MCF-type material as a support, it was possible to achieve the highest conversion due to enhanced CO2 adsorption in pores and subsequent plasma-catalytic decomposition [26]. It has been shown that CeO2-based porous systems are promising for CO2 dissociation in plasma, but studies on supportless mesoporous CeO2 have not yet been conducted. Mesoporous CeO2 is a particularly promising catalyst for plasma-assisted CO2 conversion due to its combination of high oxygen storage capacity, redox flexibility associated with the Ce4+/Ce3+ couple, and abundant surface basic sites that promote CO2 adsorption and activation and other catalytic applications [27,28]. Unlike supported CeO2 systems, which may suffer from limited active surface exposure or support interference, self-standing mesoporous CeO2 offers direct access to active sites and tunable pore structure. Thus, in the current work, mesoporous CeO2 catalysts without SiO2 or Al2O3 support were synthesized using various techniques and were characterized by physico-chemical methods (N2 adsorption–desorption, SEM, XRD, XPS, CO2-TPD, and XRF).
The aim of the present study was to investigate the influence of mesoporous ceria properties (i.e., porous characteristics, basicity, and surface electron state) on CO2 dissociation efficiency (such as conversion, CO selectivity, and energy efficiency) in non-thermal DBD plasma. Reactions were carried out at near-room temperature in a continuous flow plasma reactor, which has the potential for future scalability.
2. Results and Discussion
2.1. Catalyst Characterization
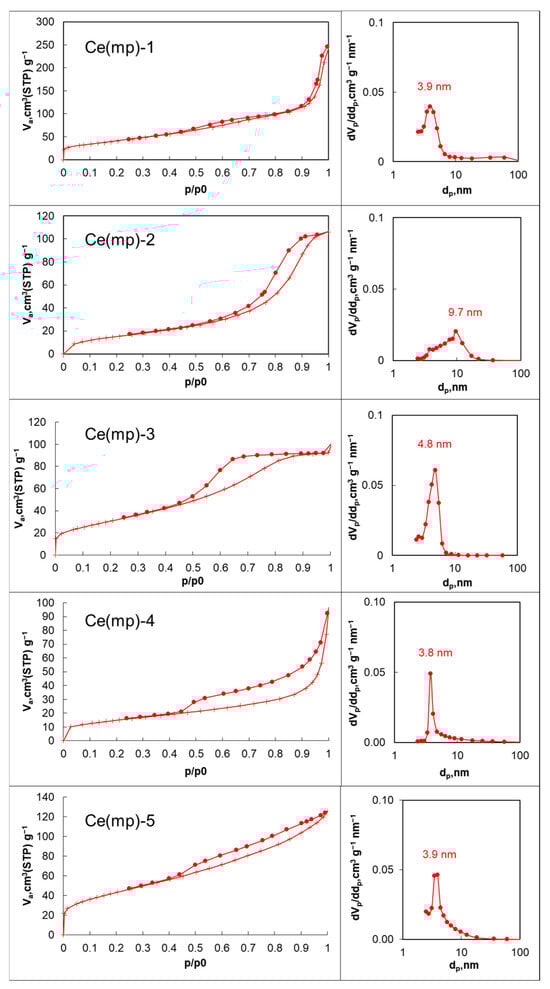
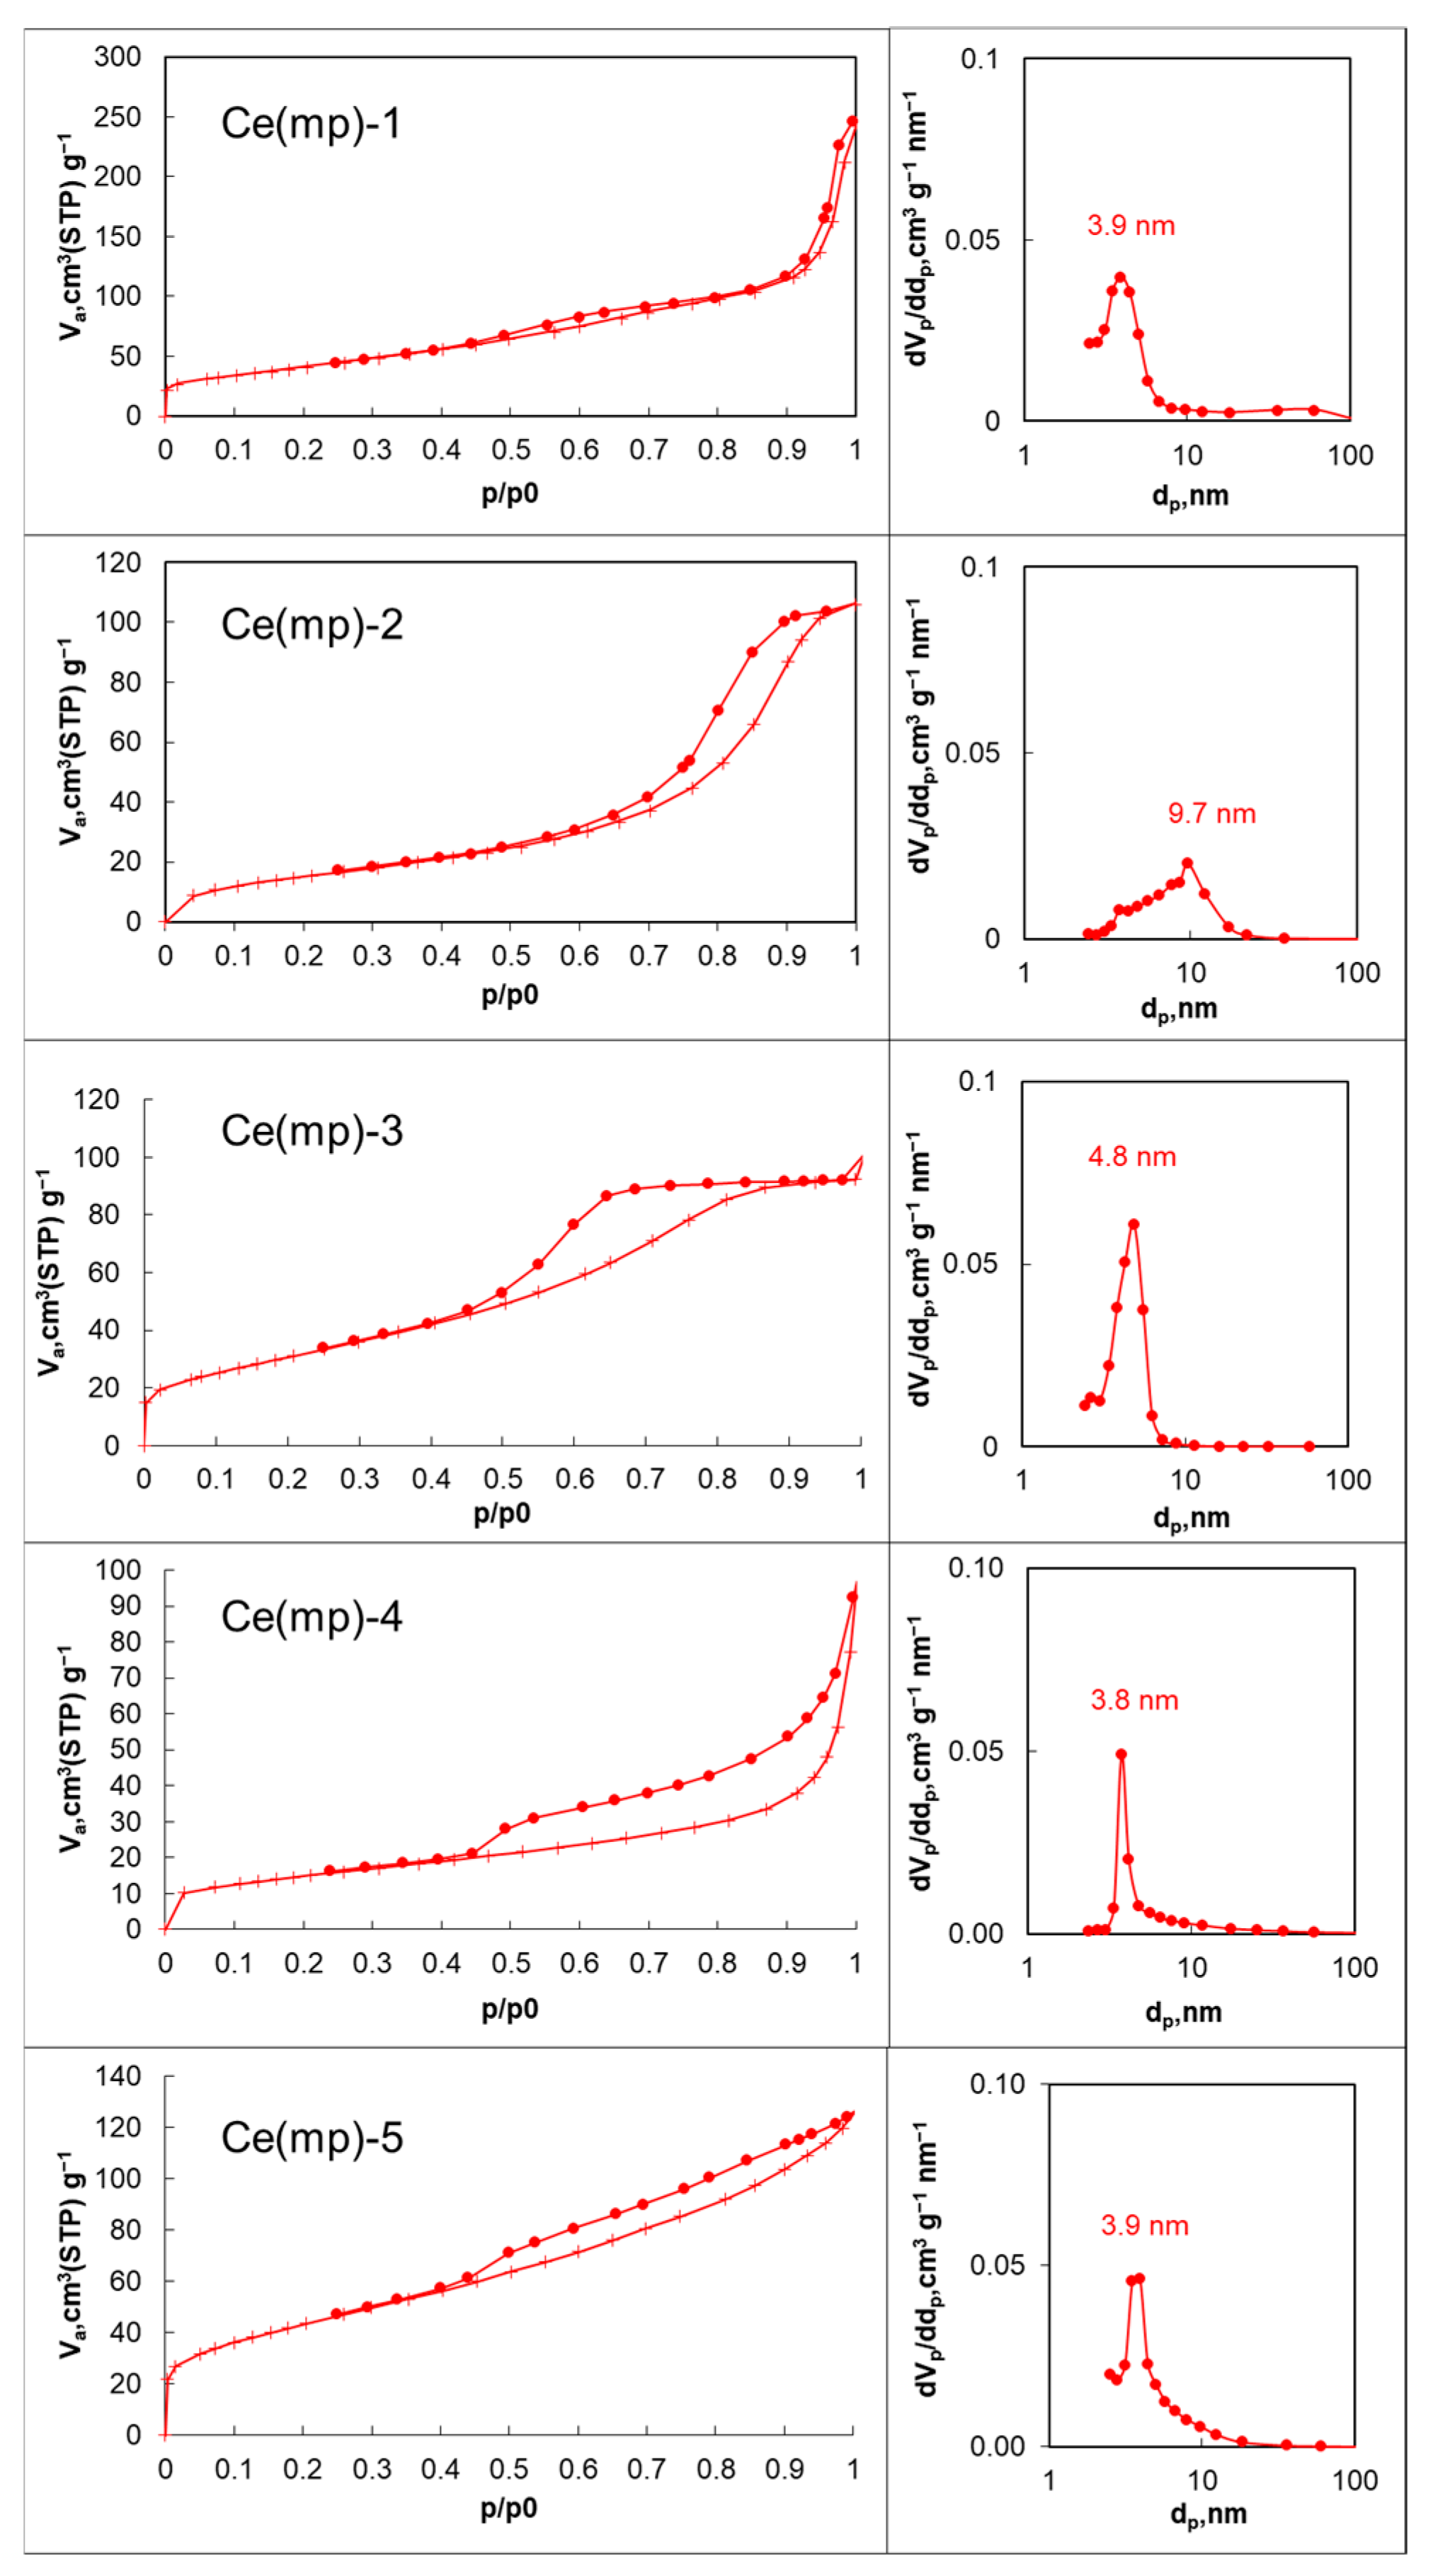
The synthesized catalysts were characterized by a complex of physico-chemical methods. From the low-temperature N2 adsorption–desorption analysis, it was revealed that the synthesized ceria samples exhibited adsorption isotherms of type IV (IUPAC) [29] with hysteresis loops of H3/H4 type [30], confirming the predominance of mesoporosity (Figure 1). However, the total adsorbed volumes and surface area values varied significantly (Table 1). The pore size distributions further indicated that the materials contained mesopores in the range of 4–11 nm, with variations in pore uniformity and total porosity depending on the synthesis conditions. It should be noted that the pore distribution peak at 3.8–3.9 nm (Ce(mp)-1, Ce(mp)-4, and Ce(mp)-5 samples) could not be taken into consideration since it was related to the adsorptive properties and not the actual porous properties of the samples [31]. Thus, it can be concluded that the named samples had rather wide pore size distributions without any actual peaks.
Figure 1.
Adsorption isotherms (left plots) and pore size distributions (right plots) of the Ce(mp)-1-Ce(mp)-5 samples. Dotted line on the left plots represents desorption curve.
Table 1.
Textural characteristics of the synthesized catalysts.
The combination of high surface area and mesoporosity in Ce(mp)-1 and Ce(mp)-5 suggests extensive nanoscale dispersion and interparticle void networks. Lower BET and larger pores in Ce(mp)-2 and Ce(mp)-4 indicate stronger aggregation and a coarser pore structure.
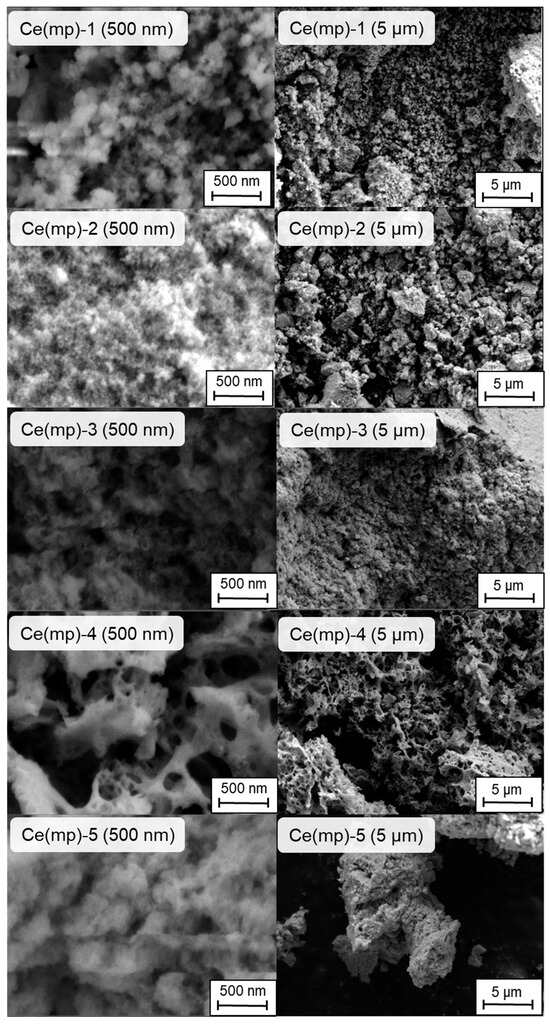
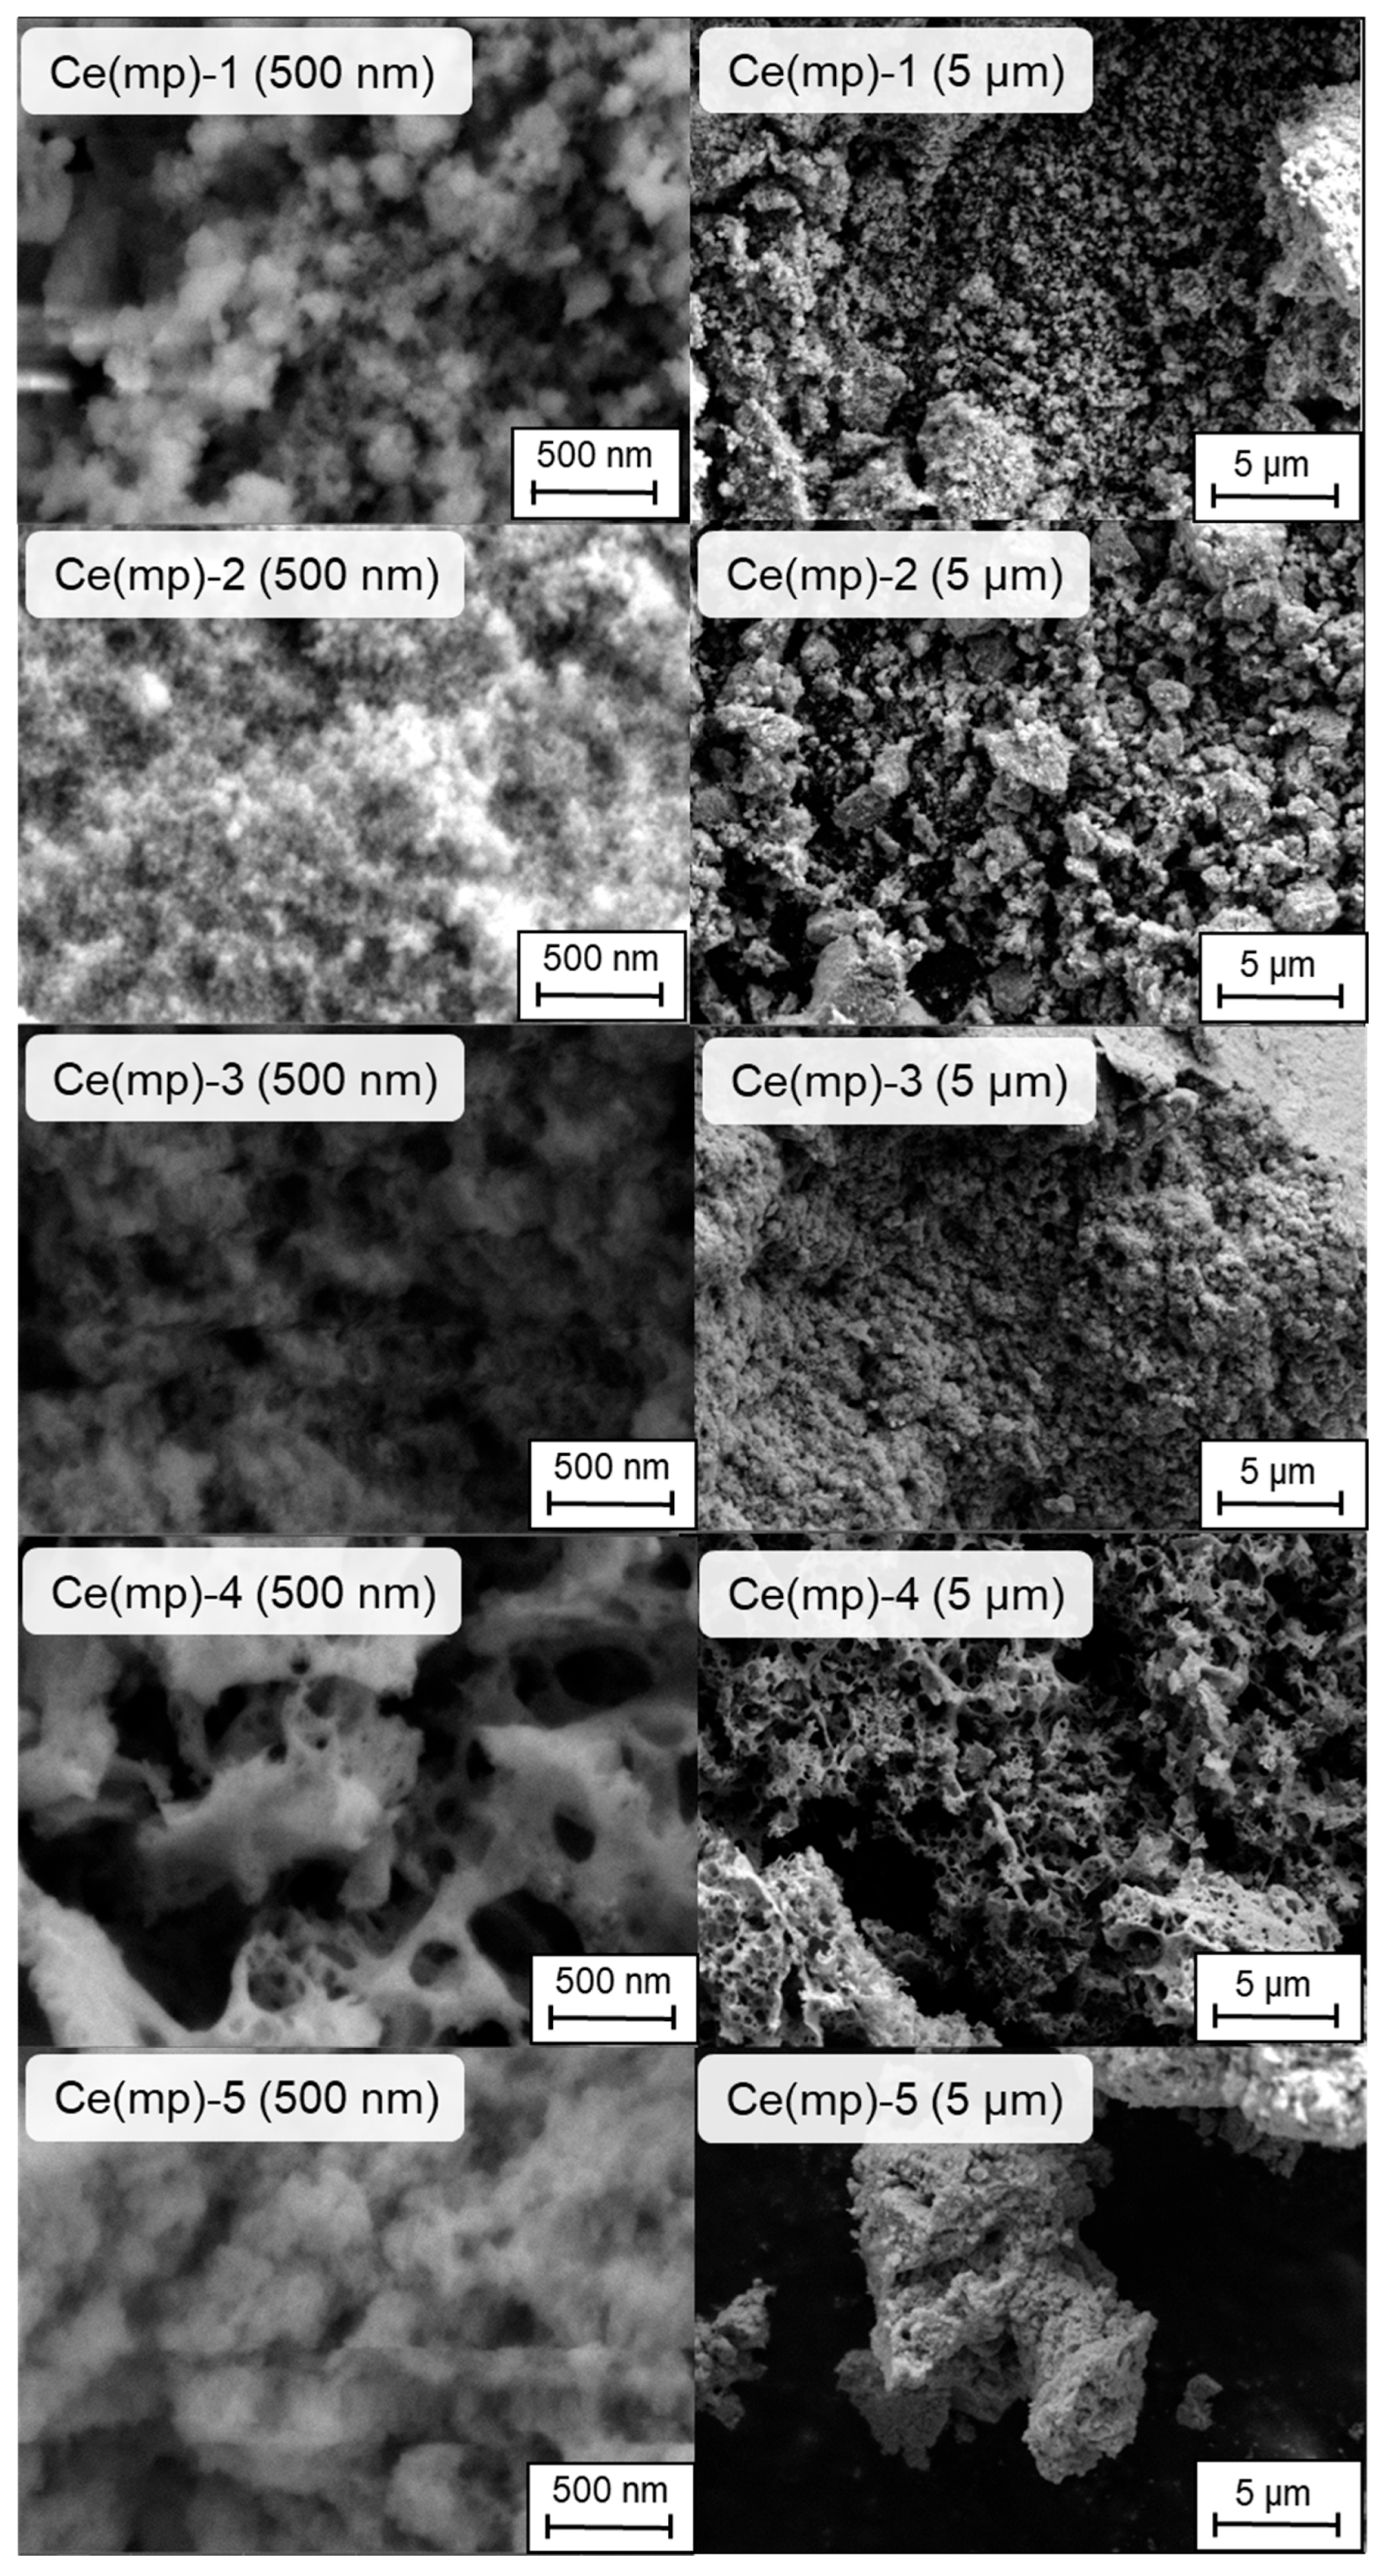
To reveal the morphology of the samples, scanning electron microscopy (SEM) analysis was conducted. The microphotographs in two scales (500 nm and 5 μm) are presented in Figure 2. Ce(mp)-1 sample exhibited fine-grained, highly porous agglomerates and a dense network of connected nano-sized particles. This explained the high surface area of the sample. Ce(mp)-2 appeared as more compact and coarse aggregates, which is consistent with its large modal pore diameter and low surface area. In contrast, the Ce(mp)-3 sample had more fine particles with intermediate inter-particle pores. Ce(mp)-4 shows a notably open, sponge-like morphology with non-uniform macroporous cavities, consistent with low BET but high accessibility to the external environment. The last structure can be considered meso-macroporous, as it contained both mesopores and macropores, which can facilitate CO2 adsorption and its subsequent dissociation in plasma. The morphology of the Ce(mp)-5 sample was “cauliflower-like” but with a large aggregate size (which was seen at a 5 μm scale). Interestingly, the Ce(mp)-5 sample retained a relatively high adsorption capacity despite its dense morphology in SEM, suggesting the presence of internal mesopores which were not resolved at the microscale.
Figure 2.
Scanning electron microscopy images of the synthesized mesoporous ceria.
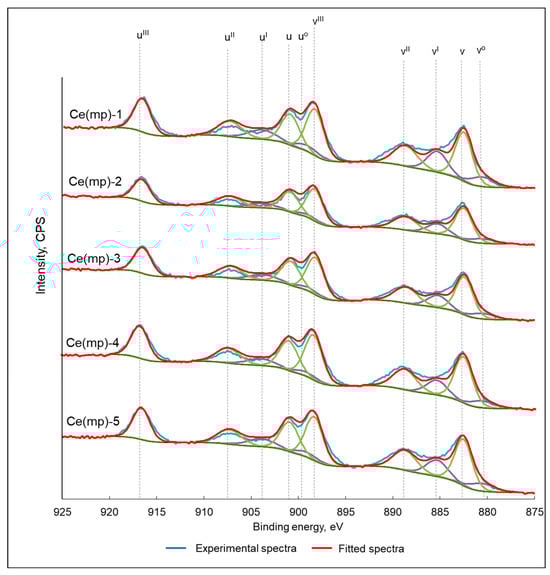
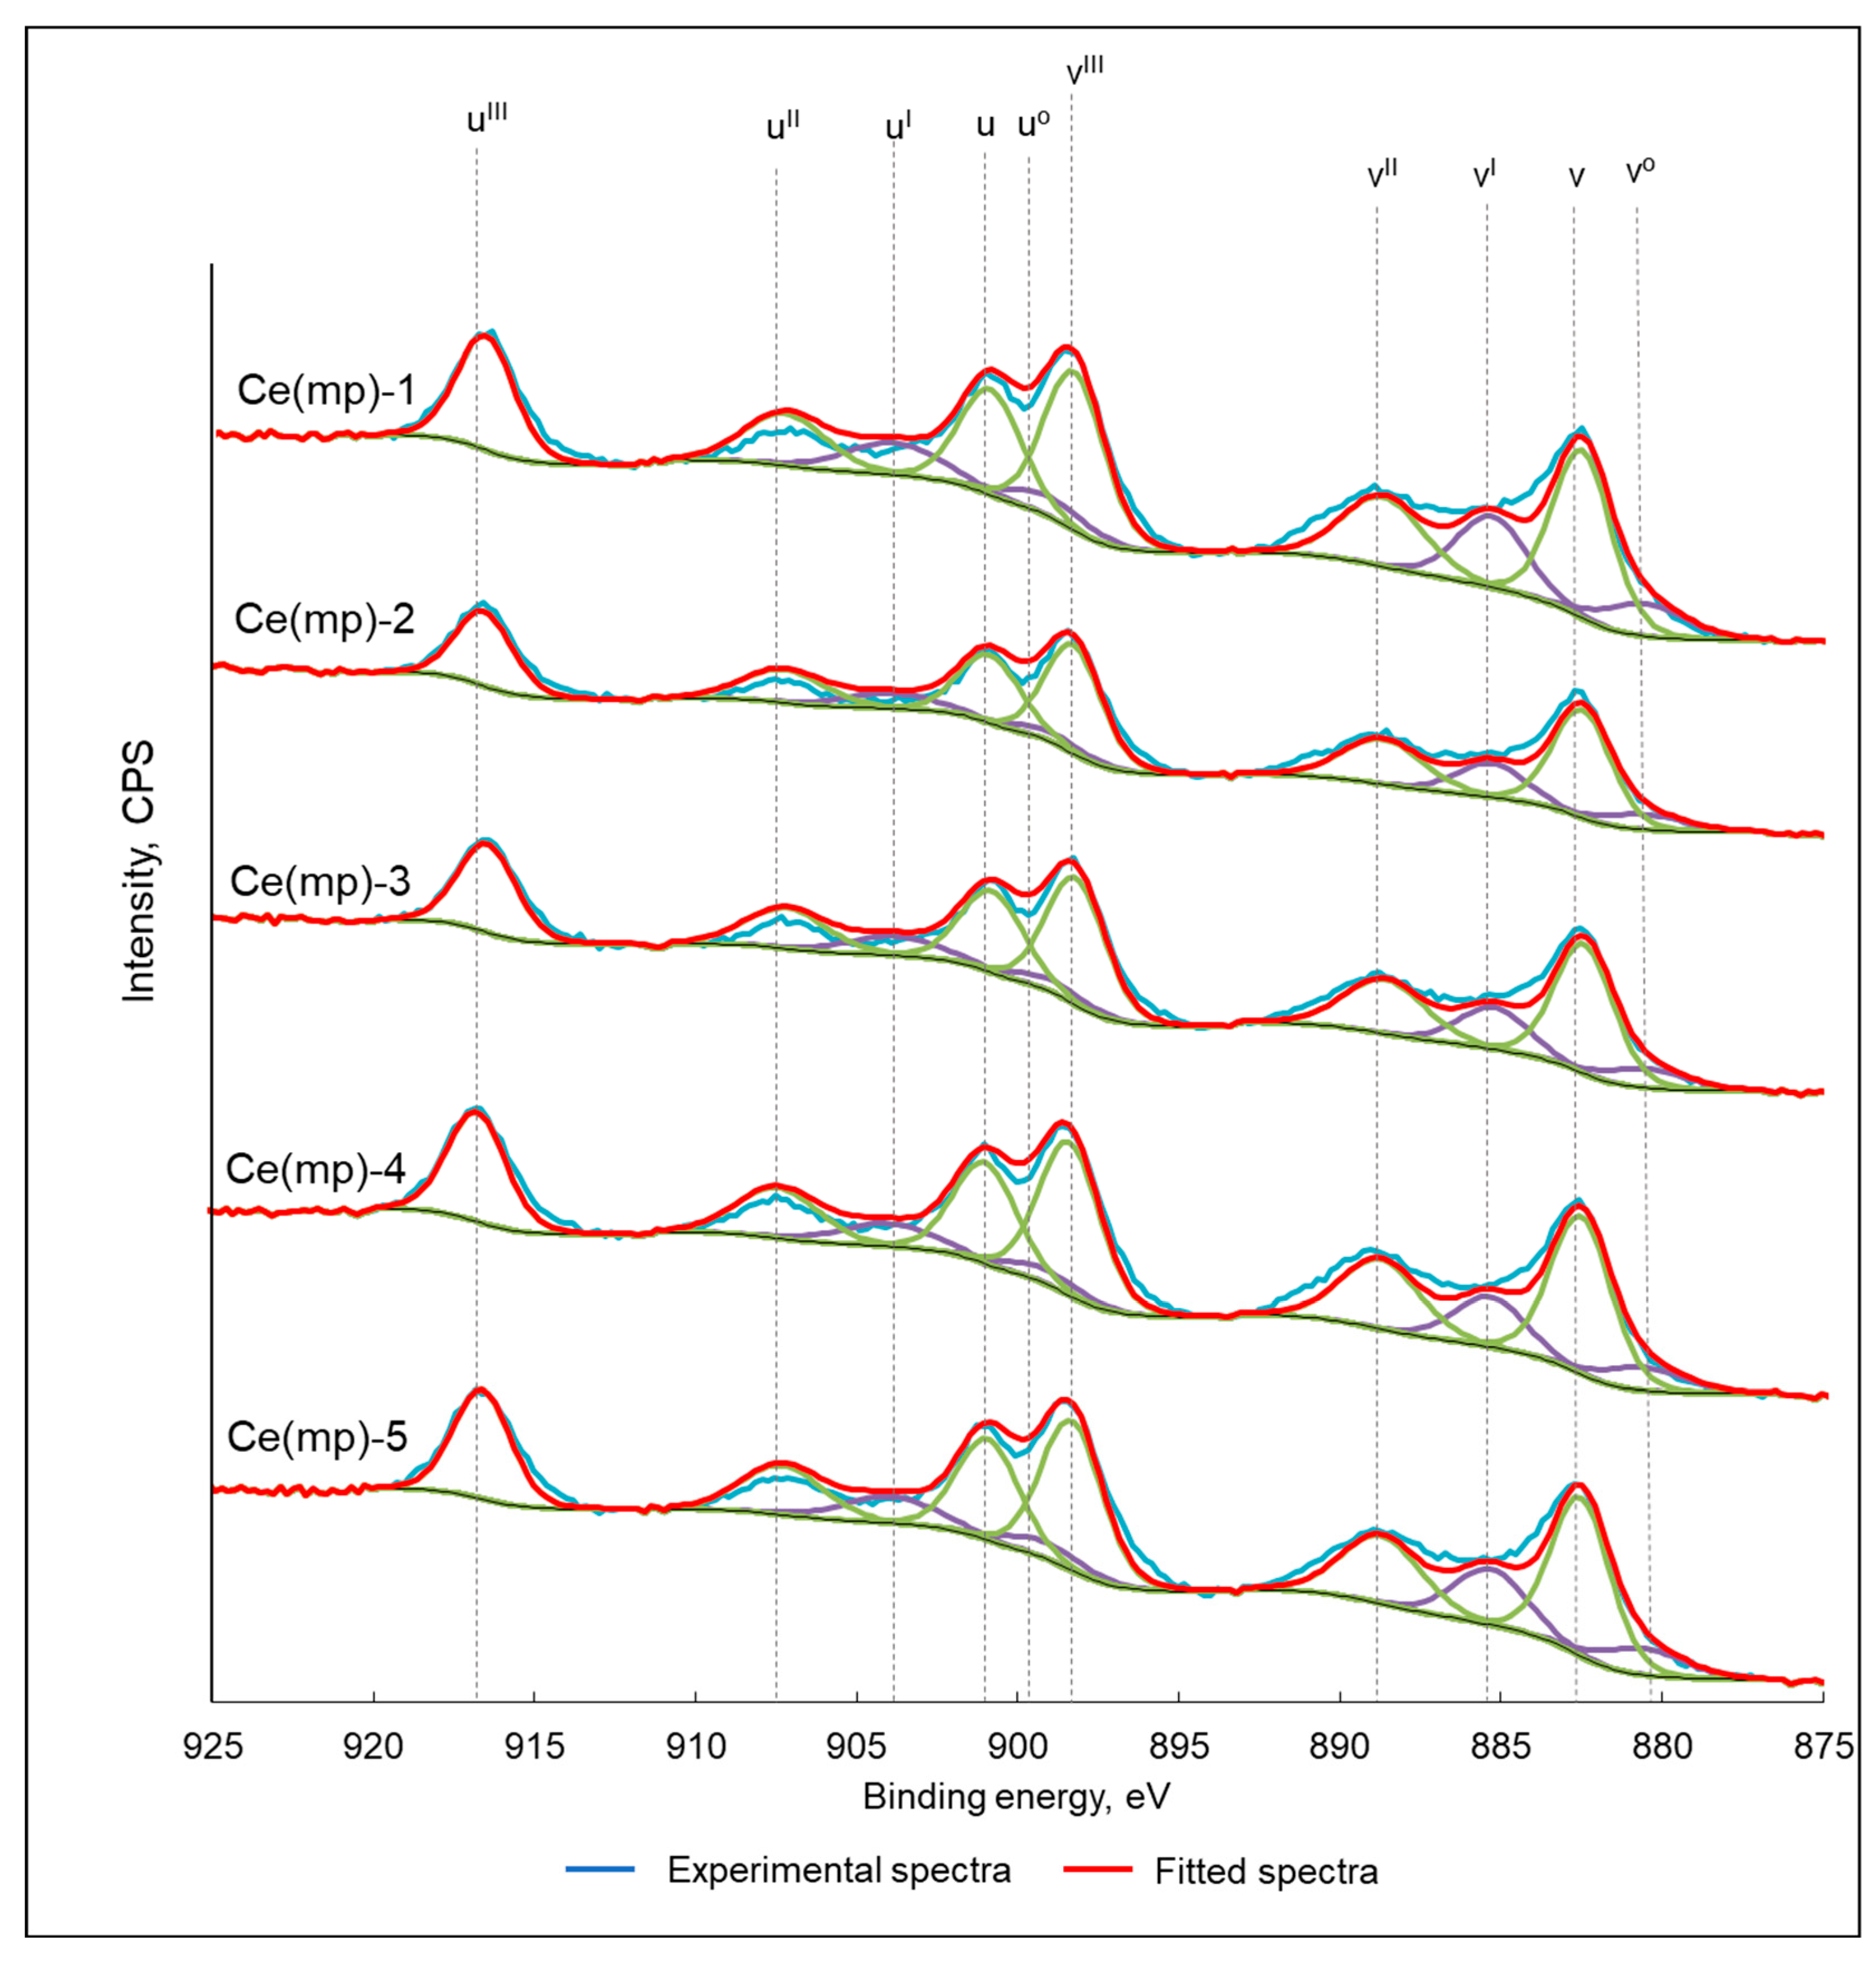
The electron state of the surface was analyzed using X-ray photoelectron spectroscopy (Figure 3). Each experimental spectrum (blue line) was deconvoluted using a series of Gaussian-Lorentzian functions to account for the multiple final states arising from Ce3+ and Ce4+ species. The resulting fitted spectra are shown as red lines, with individual components plotted in various colors (green for Ce4+ and purple for Ce3+). The Ce 3d spectrum was characteristically complex due to the mixed valence nature of cerium oxides, which resulted in the presence of multiple peaks. Ce4+ features are typically assigned six peaks: u’’’ (~917 eV), u’’ (~907 eV), u (~901 eV), v’’’ (~898 eV), v’’(~889 eV), and v (~882 eV) (where “u” and “v” correspond to 3d3/2 and 3d5/2, respectively). Ce3+ features are associated with four peaks: u’ (~904 eV), u0 (~899 eV), v’ (~885 eV), and v0 (~880 eV). The presence of Ce3+ was attributed to oxygen vacancies in the structure of the ceria. From the corresponding peak area, the amount of Ce3+ was calculated for each sample (Table 2). It can be seen that the oxygen-deficient Ce3+ phase was present in all the samples and its content was comparable for most Ce(mp) catalysts. The highest content of Ce3+ was characterized in the Ce(mp)-1 sample (23%), while Ce(mp)-4 had the lowest concentration of the partially reduced phase (17%).
Figure 3.
X-ray photoelectron spectra of the synthesized catalysts. Green peaks represent Ce4+ phase, purple peaks represent Ce3+ phase.
Table 2.
Physico-chemical properties of the samples: basic site concentration, revealed from CO2-TPD analysis; average crystallite size, calculated from XRD analysis; Ce3+ concentration, calculated from XPS data; Ce total content, calculated from XRF analysis.
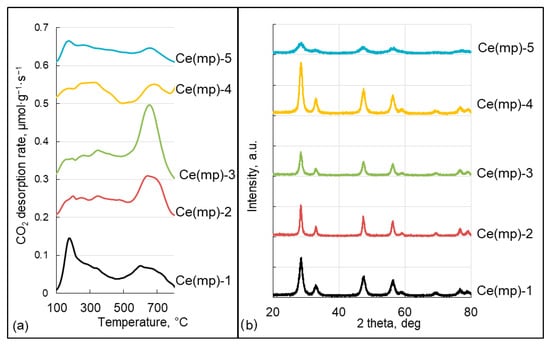
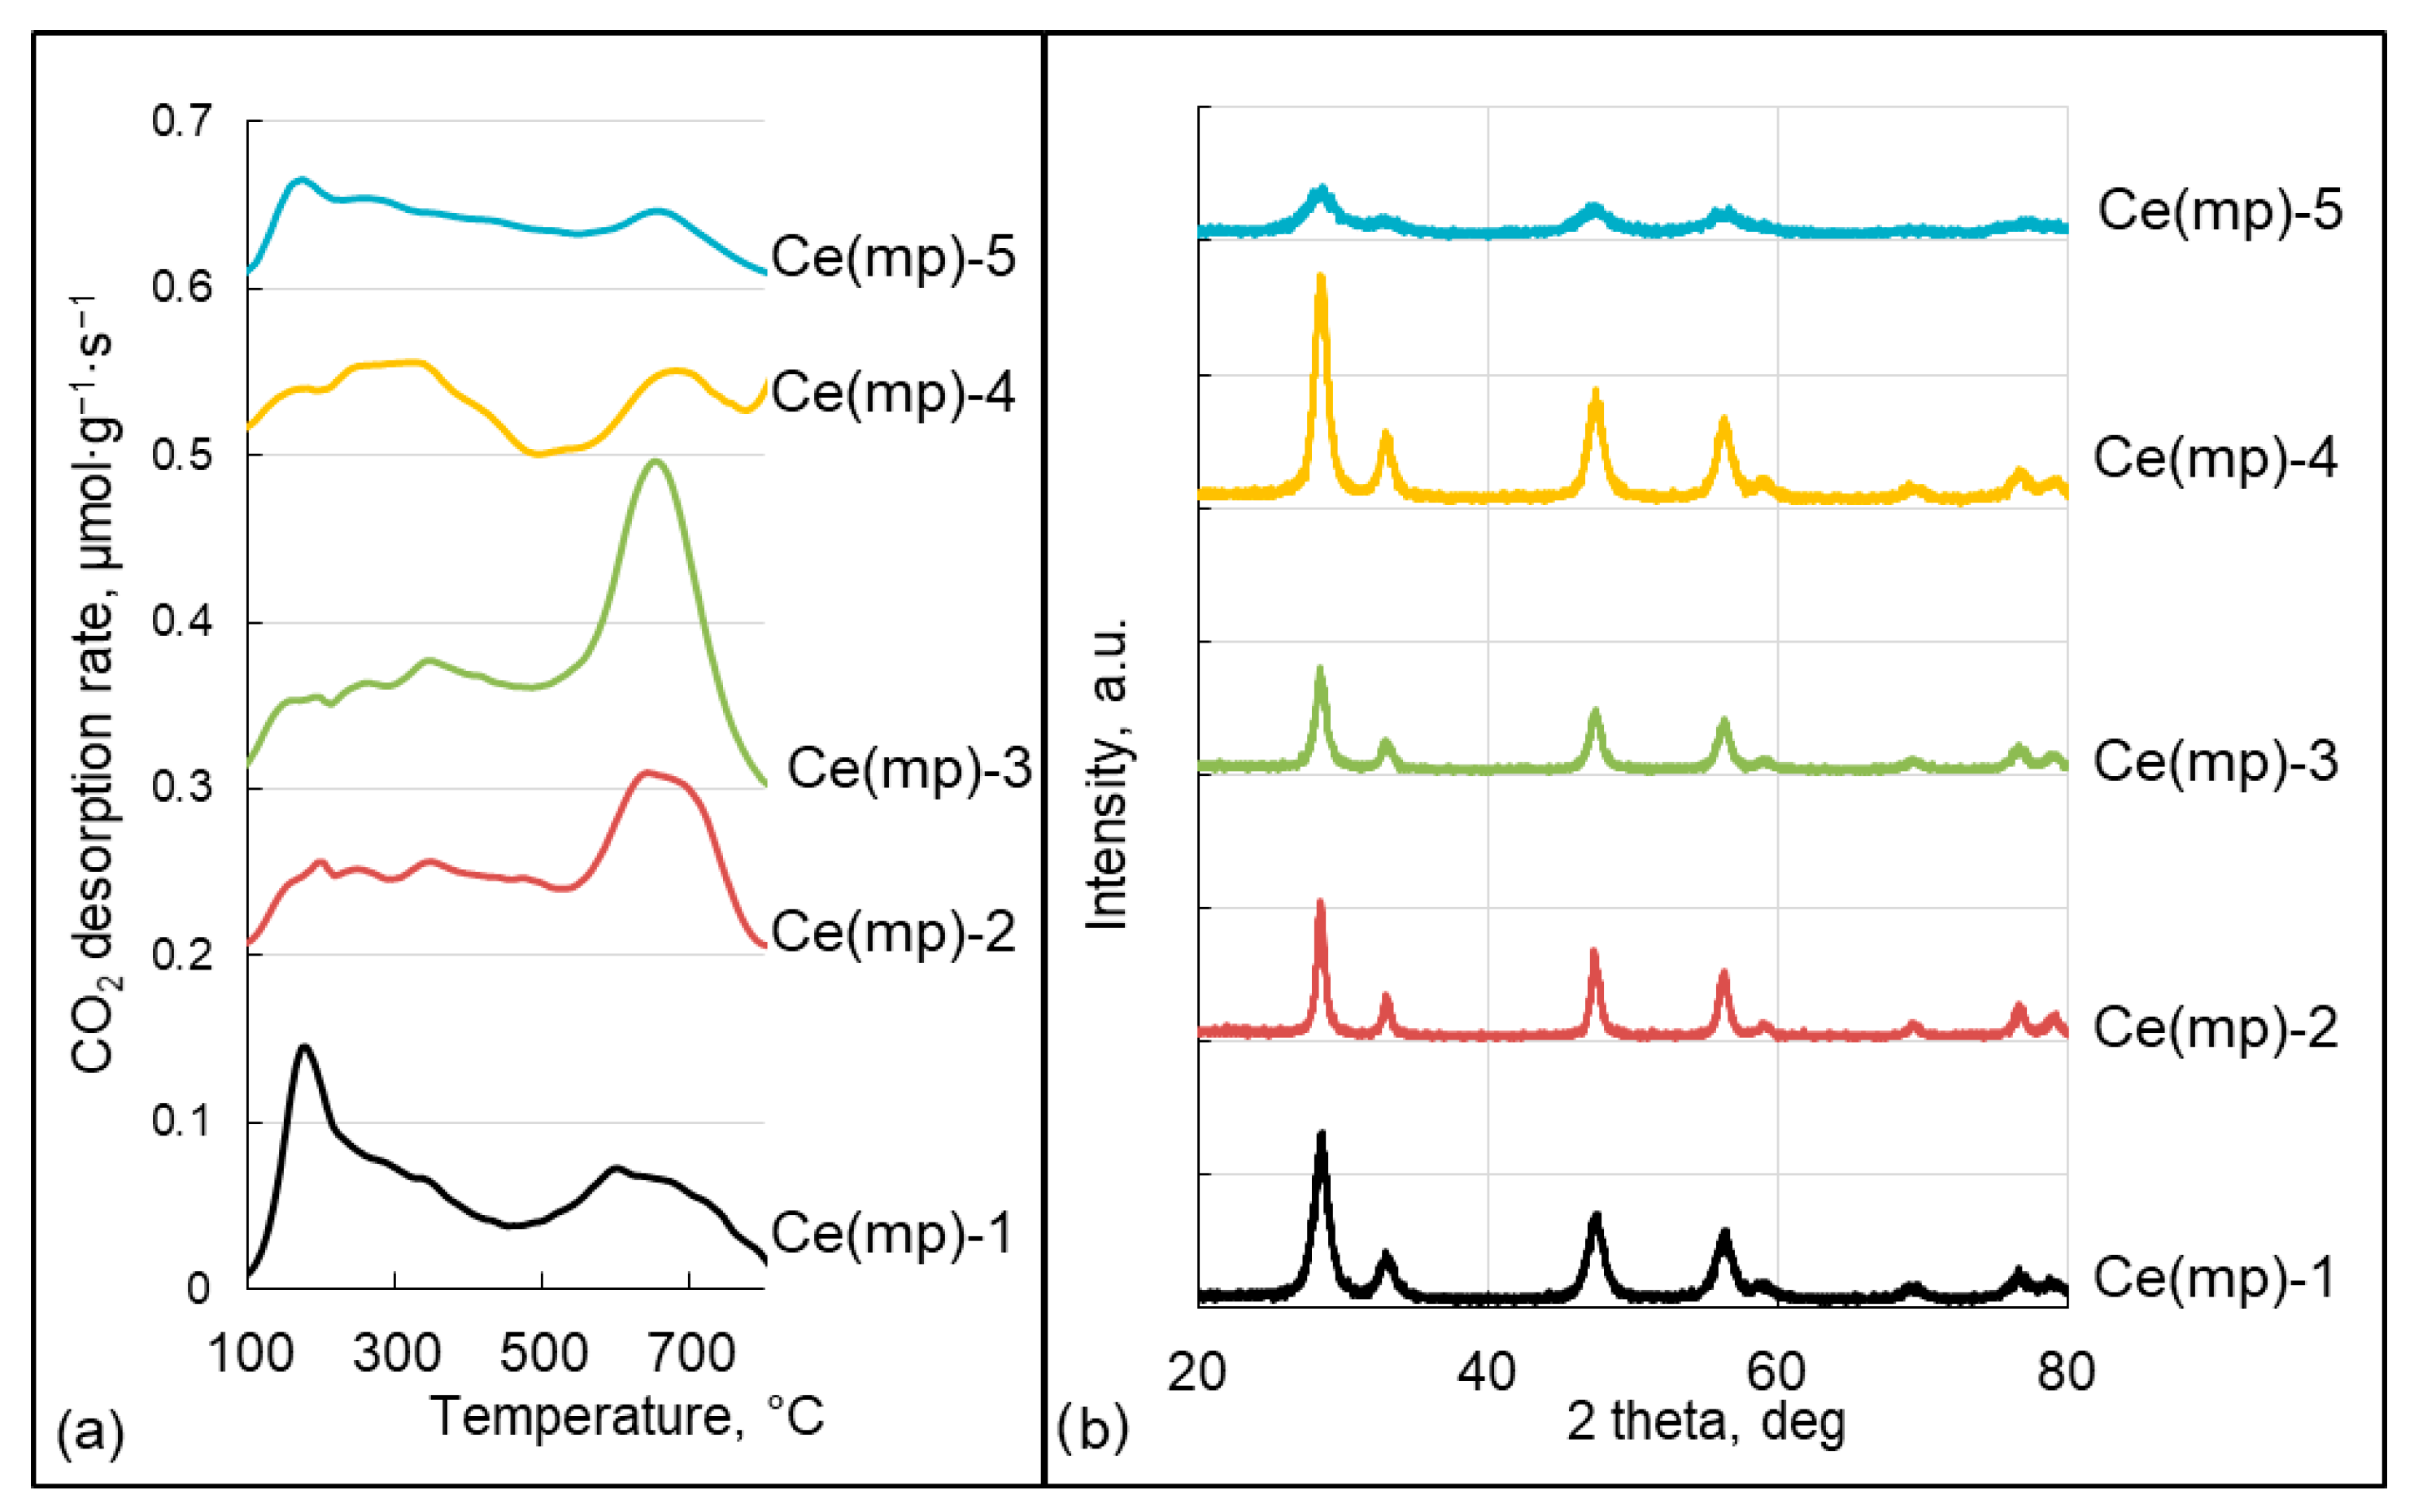
CO2-TPD profiles (Figure 4a) revealed distributions of weak (<250 °C), medium (250–400 °C), and strong (>400 °C) basic sites across the series (Table 2). Ce(mp)-3 possessed the highest total basicity (427 μmol/g) and the largest concentration of strong basic sites (282 μmol/g). Ce(mp)-1 and Ce(mp)-2 also showed substantial high-temperature desorption features (strong sites 145 and 185 μmol/g, respectively), whereas Ce(mp)-4 displayed a markedly lower total basicity (113 μmol/g) and almost no strong basic-site contribution (6 μmol/g).
Figure 4.
Temperature desorption profiles (a) and X-ray diffraction patterns (b) of the synthesized samples.
X-ray diffraction patterns confirmed the presence of the cerianite CeO2 phase (PDF# 43-1002; 2θ = 28.5°, 33.0°, 47.5°, 56.3°, 59.1°, 69.4°, 76.7°, 79.0°) in all materials, but peak width and intensity varied between the samples (Figure 4b). Ce(mp)-1 and Ce(mp)-4 showed relatively sharp reflections indicative of larger coherent domains, while Ce(mp)-2 and Ce(mp)-3 displayed intermediate broadening. Ce(mp)-5 exhibited the most broadened and weak reflections, which indicated either small crystallite size or high dispersion of ceria particles. Crystallite-size analysis with XRD yielded average domain sizes of 3–14 nm (Table 2): Ce(mp)-5 was the least crystalline with the smallest average crystallite size (3 nm), whereas Ce(mp)-2 exhibited the largest coherent domain size (14 nm).
2.2. CO2 Dissociation Experiments
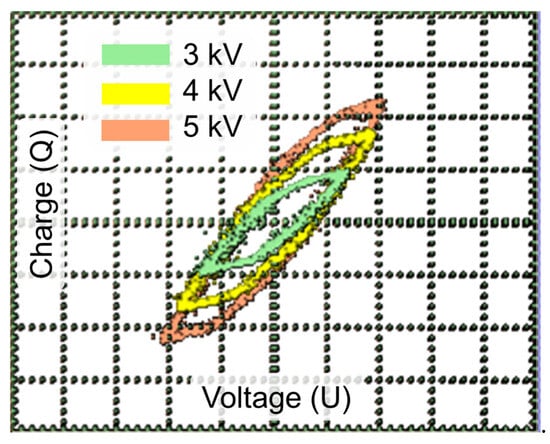
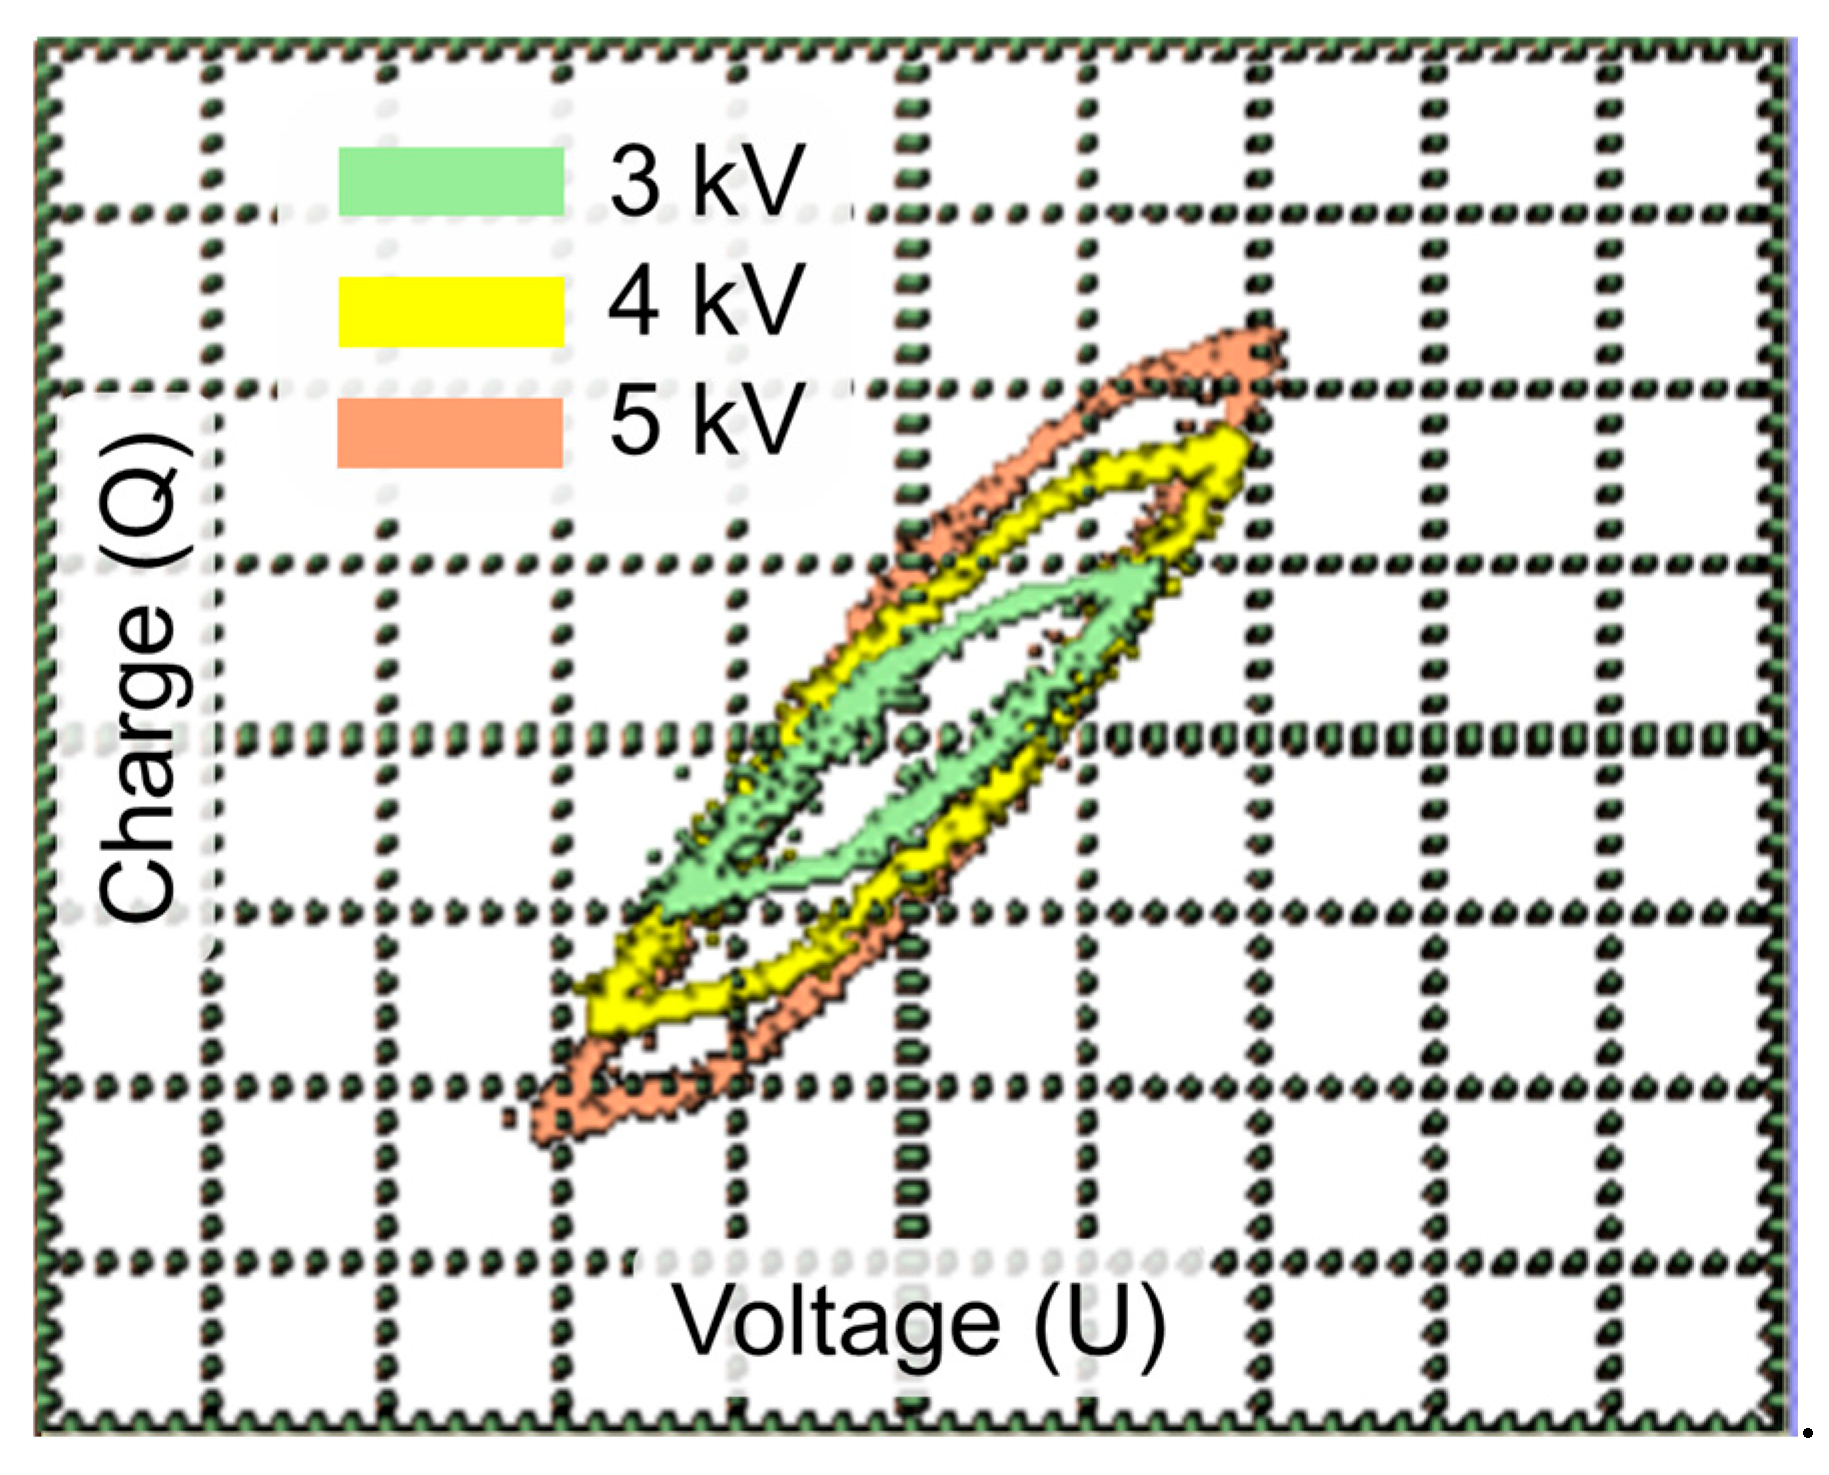
Lissajous figures, which were captured in plasma-only mode, are presented in Figure 5. The shape of the figure is a parallelogram, which is typical for DBD plasma [32,33]. It can be seen that, with increasing input voltage, the shape of the figure is extended along the “Charge” axis, which can be explained by the increase in the current (from ~15 mA to ~34 mA) and thus the increase in absorbed plasma power.
Figure 5.
Lissajous figures captured in plasma-only mode.
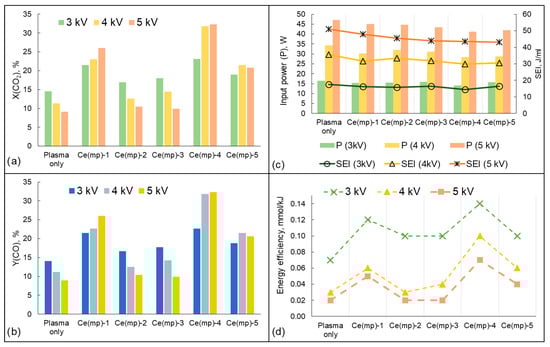
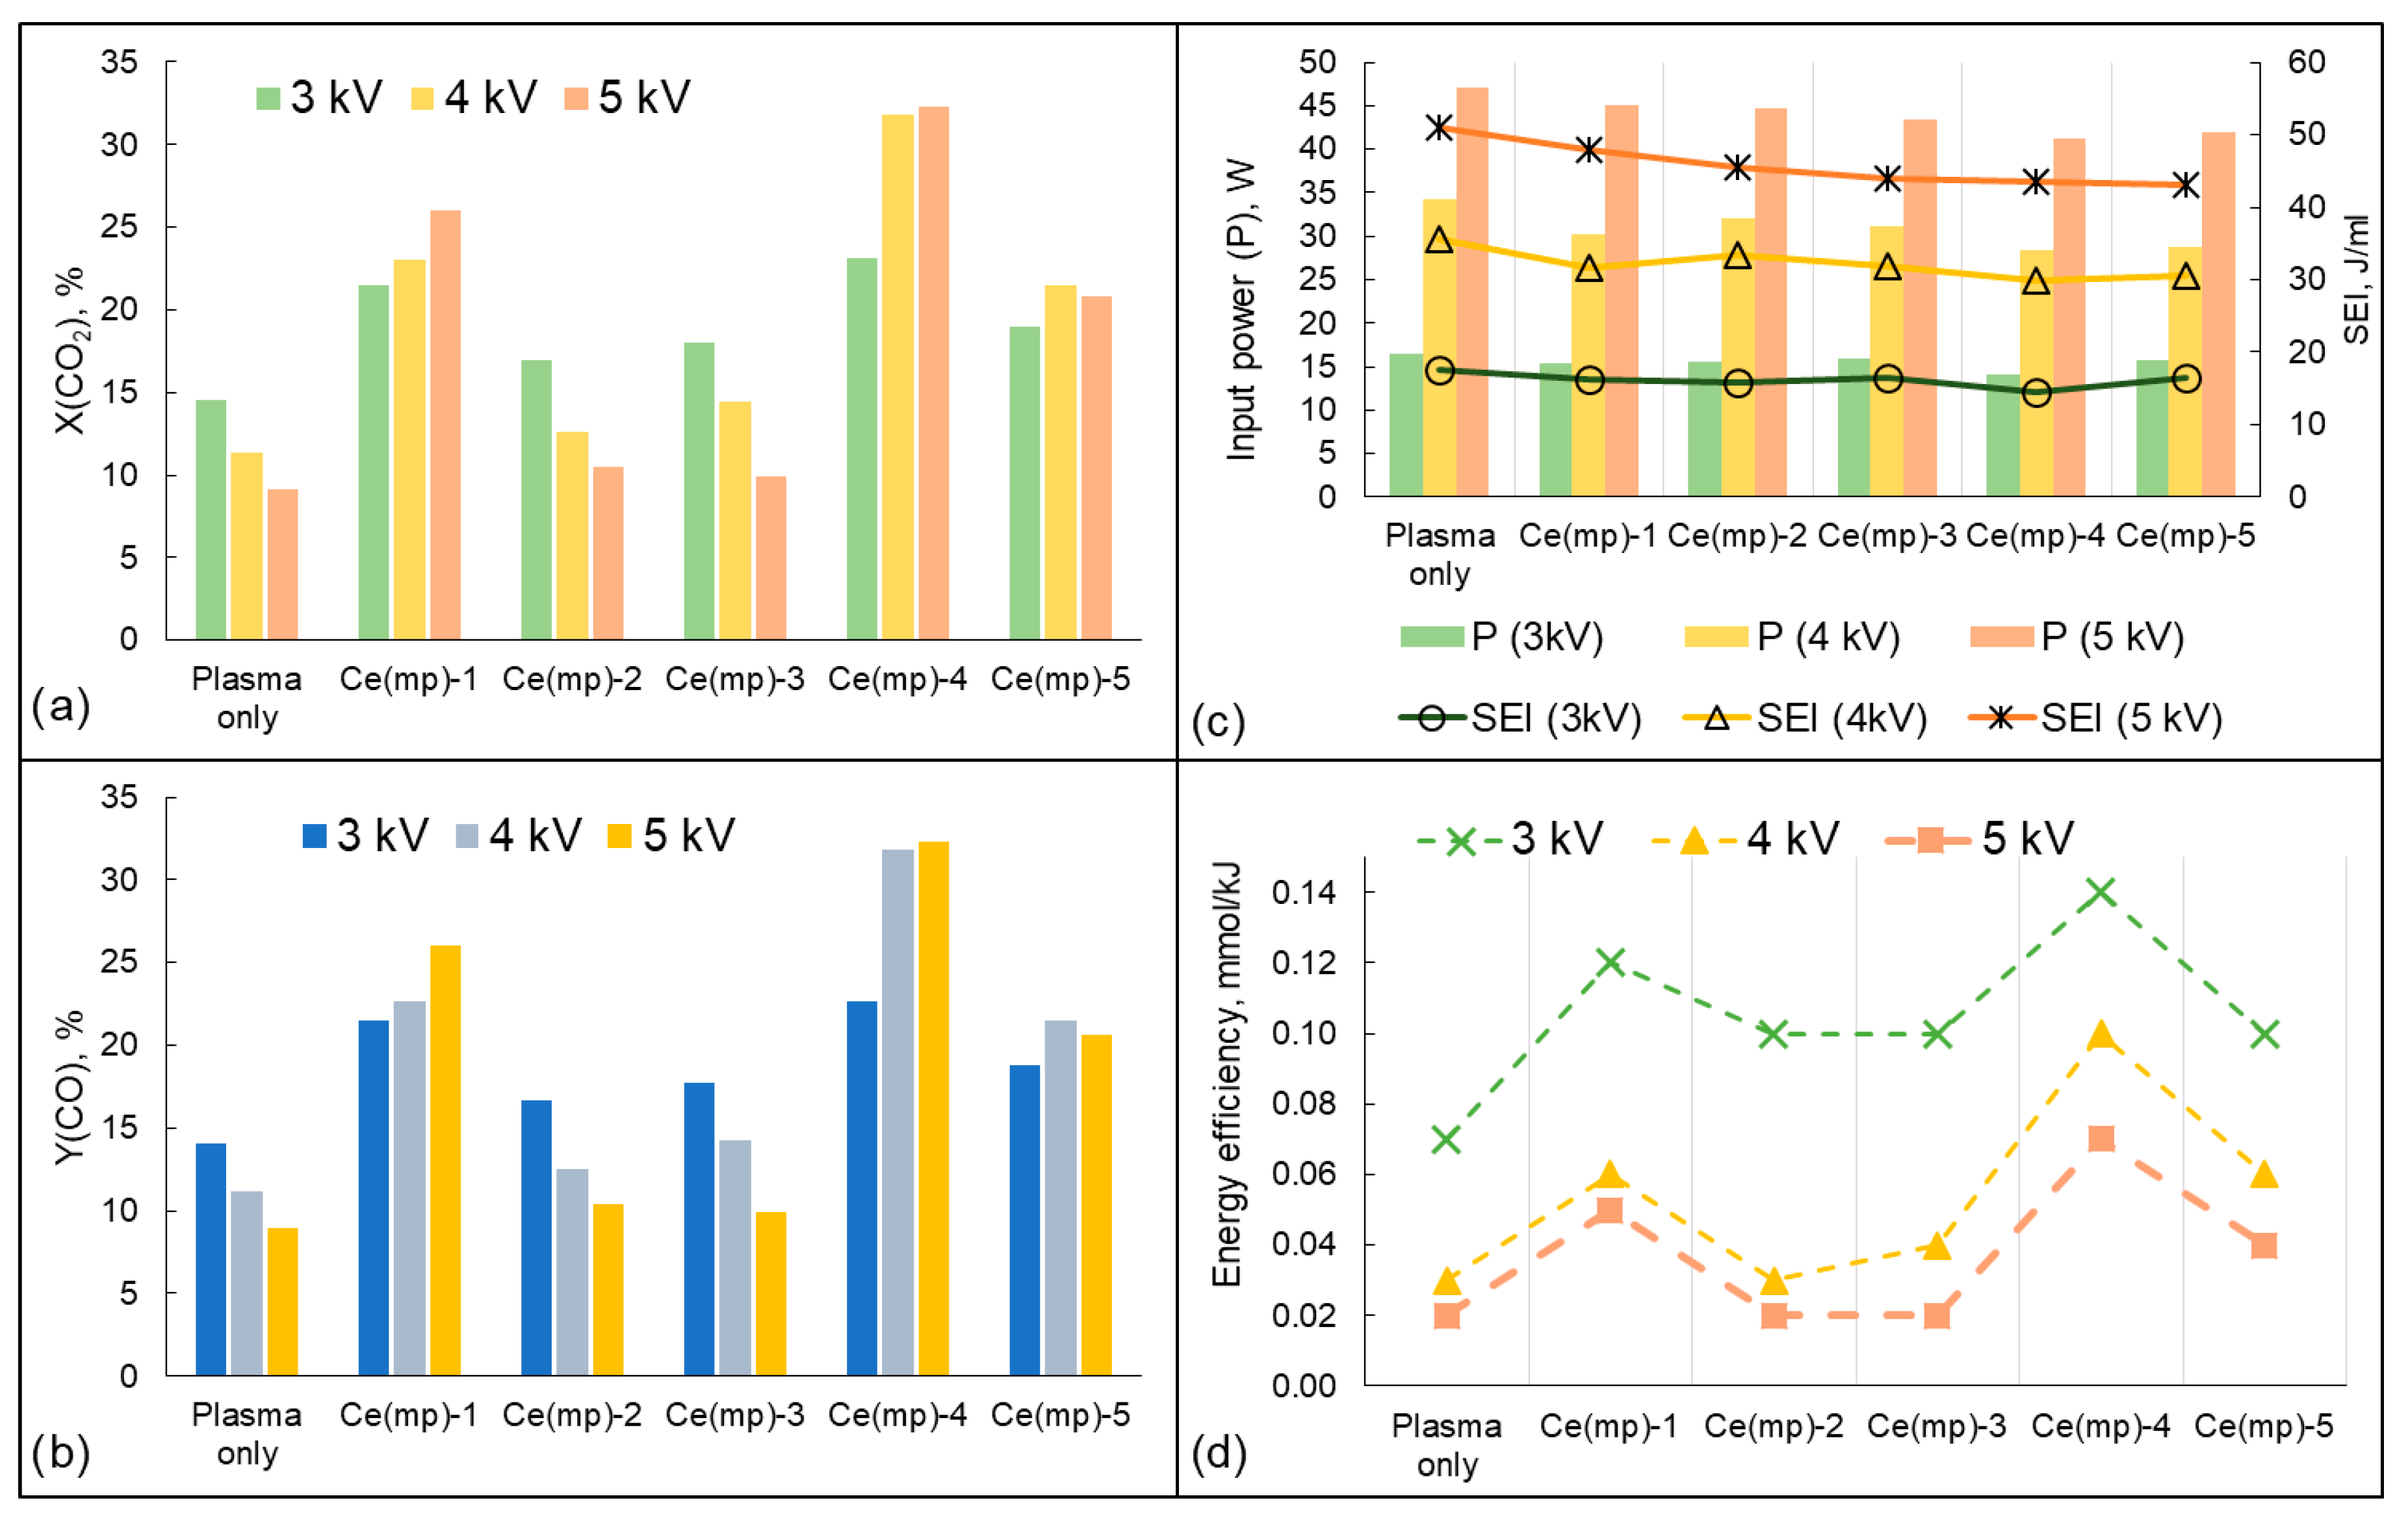
The experiments on plasma-catalytic CO2 dissociation were conducted using obtained CeO2 catalysts (Ce(mp)-1—Ce(mp)-5) and with variations in the input voltage. The results of the experiments are presented in Figure 6.
Figure 6.
The results of plasma-only and plasma-catalytic CO2 dissociation: (a) CO2 conversion; (b) CO yield; (c) input power and specific energy input; (d) energy efficiency.
When conducting plasma-only experiments, it was observed that, with increasing input power, CO2 conversion was lowered. The maximum achieved conversion in the absence of the catalyst was 14.5% at an input power of 15 W (3 kV of the input voltage). When the power was increased up to 34 W (4 kV input voltage), the conversion tended to decrease to 11.5%, with a further decrease to 9.1% at 45 W (5 kV input voltage). The observed trend could be related to the existence of the back reaction (CO + 1/2O2 → CO2), which restricts further conversion of CO2 in the absence of the catalysts. It was noteworthy that a similar CO2 conversion trend was observed in the presence of the Ce(mp)-2 and Ce(mp)-3 catalysts. When these catalysts were loaded into the DBD reactor, the conversion of CO2 was slightly higher than that in the plasma-only reactor at an input voltage of 3 kV and 4 kV, but when a 5 kV voltage was applied, the change in conversion was nonsignificant (compared to the plasma-only mode). Another pattern was observed when the Ce(mp)-1, Ce(mp)-4, and Ce(mp)-5 samples were placed into the reactor. The conversion of CO2 increased with increasing input voltage up to 5 kV. However, the energy efficiency value dropped at 5 kV, as the input power value and specific energy input were enhanced, with a simultaneous decrease or slight increase in the CO2 conversion (Figure 6d). Thus, the 5 kV mode can be considered as the least energy-effective mode for the CO2 dissociation reaction in the studied conditions.
The highest CO2 conversion was achieved using the Ce(mp)-4 catalyst (32.3% at 5 kV), and the energy efficiency of the CO2 dissociation process was also the highest among the samples in the presence of the Ce(mp)-4 sample (Figure 6d). From the results of the experiments, it was observed that CO was the only product of CO2 dissociation and the selectivity of CO was close to 100% in all the experiments. Consequently, the yield of CO was nearly the same as the CO2 conversion (Figure 6b).
In the presence of the samples Ce(mp)-1 and Ce(mp)-5, a similar CO2 conversion was observed at a 4 kV input voltage, which was attributed to their comparable properties. For instance, the specific surface area of the Ce(mp)-1 sample was 150 m2/g, while that of the Ce(mp)-5 sample was 155 m2/g (Table 1). However, due to the higher number of electronic defects on the surface and the greater concentration of weak basic sites (Table 2), a higher degree of CO2 conversion was achieved in the presence of the Ce(mp)-1 sample.
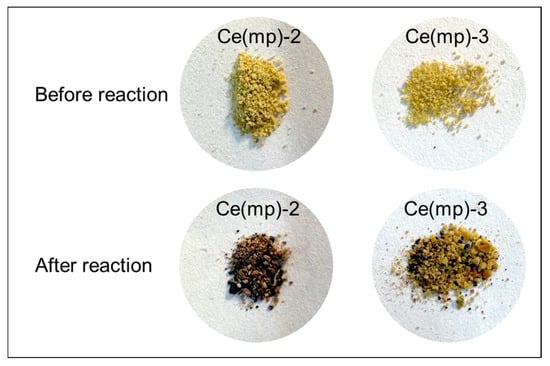
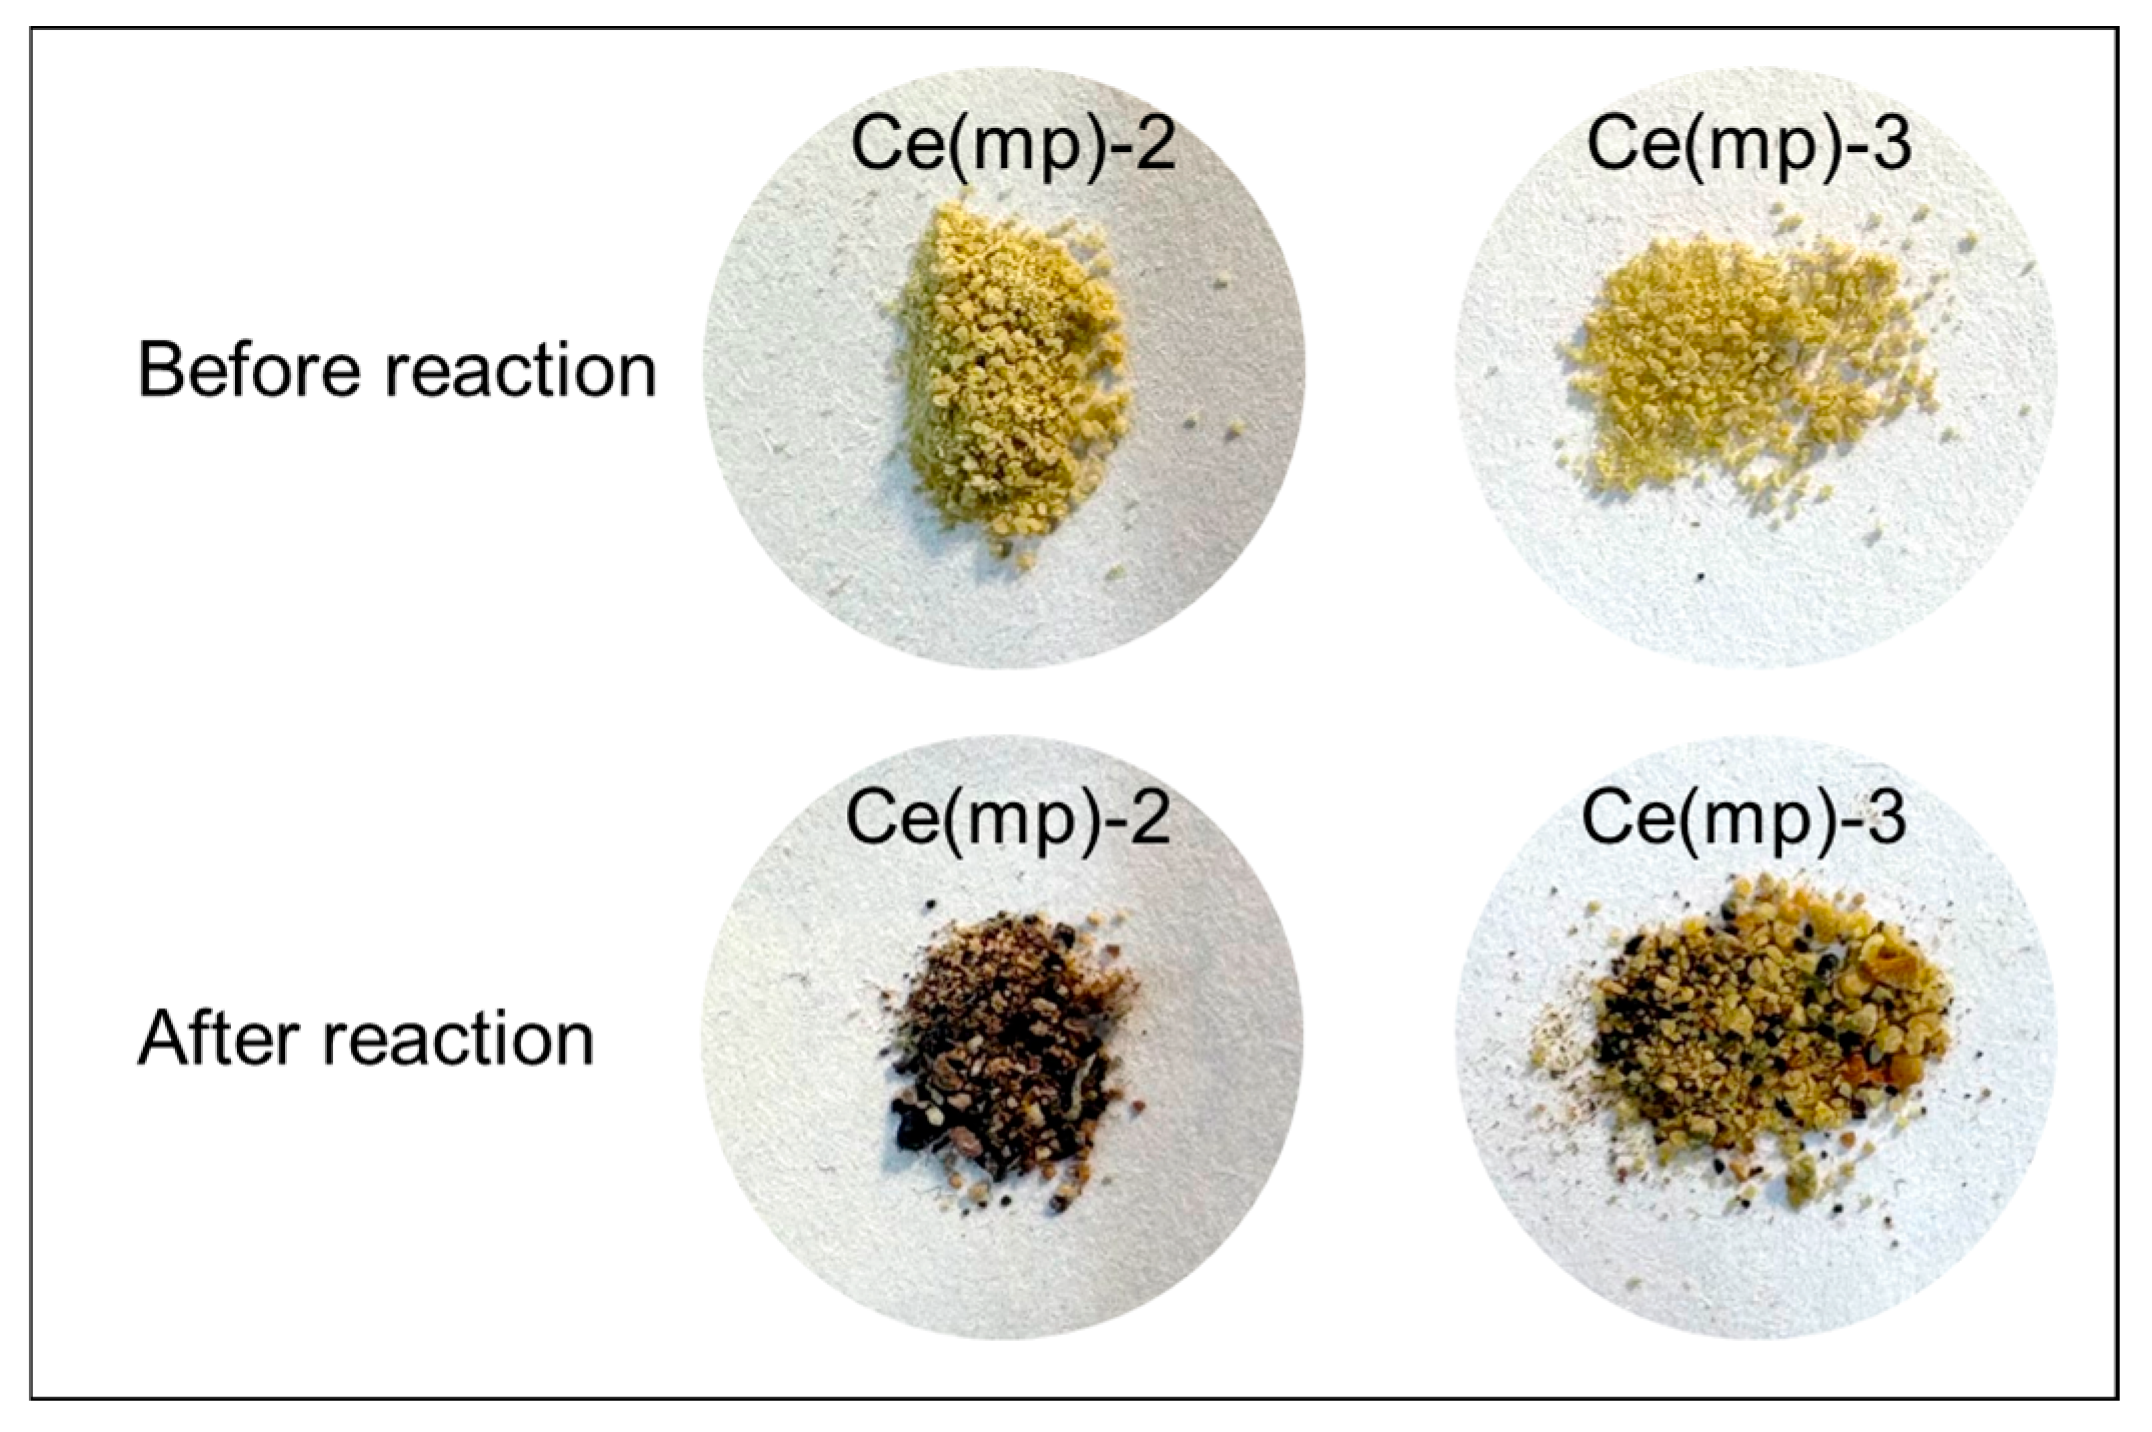
From the results of the plasma-catalytic experiments, it was mentioned that the Ce(mp)-2 and Ce(mp)-3 samples had minor CO2 dissociations, in comparison with other obtained samples. The samples after the experiment changed their color (Figure 7) to a mixture of the initial yellow with dark brown and black particles. Apparently, due to the synthesis procedure (without calcination stage), cetyltrimethyl ammonium bromide was not fully removed from the initial mixture and, in the DBD medium, was partially decomposed, as was shown in [34]. A detailed characterization and discussion of catalysts after the reactions are provided in Section 2.3.
Figure 7.
Photographs of the Ce(mp)-2 and Ce(mp)-3 catalysts before and after the plasma-catalytic reaction.
Furthermore, samples with a high concentration of strong basic sites, such as Ce(mp)-2 and Ce(mp)-3, exhibited limited CO2 conversion despite their overall high basicity. This suggests that excessively strong adsorption can hinder CO2 desorption under plasma conditions, limiting the catalytic turnover. In contrast, Ce(mp)-4, which possesses predominantly medium-strength basic sites and low total basicity, showed superior conversion and energy efficiency. The moderate basicity facilitates sufficient CO2 adsorption while allowing for effective desorption of the reaction products, enabling continuous catalytic activity. Ce(mp)-1 and Ce(mp)-5, with intermediate distributions of weak and medium sites, demonstrated performance between these extremes. Overall, these results highlight that not just the total number of basic sites but also their strength distribution critically determine the efficiency of plasma-catalytic CO2 dissociation. As it was revealed in our previous work [25], the presence of strong basic sites in CO2 dissociation catalysts may play a negative role, as CO2 cannot be desorbed under the reaction conditions. Similar observations were obtained when comparing MgO and CaO samples for CO2 sorption in [35].
To provide a quantitative comparison of the activity of the CeO2 catalysts and clarify the role of surface basicity, the apparent turnover frequencies (TOF) for CO formation were calculated for each sample. The TOF values were calculated from the CO formation rates and the number of surface Ce atoms estimated from the CeO2 (111) surface density (7.9 Ce atoms per nm2 [36,37]), BET surface areas, and Ce3+ concentration obtained from XPS, representing the assumed number of catalytically active sites. The detailed calculation procedure is given in the Supplementary Materials. Despite having the lowest surface area (52 m2/g), the Ce(mp)-4 catalyst exhibited the highest calculated TOF (0.0225 s−1), indicating that its active Ce sites were intrinsically the most efficient (Table 3). CO2-TPD analysis showed that Ce(mp)-4 possessed predominantly weak and medium basic sites with almost no strong sites, whereas samples with higher total basicity or stronger sites (Ce(mp)-1, Ce(mp)-3, Ce(mp)-5) exhibited lower TOFs. This inverse correlation between strong basicity and TOF confirms that moderate basicity yields optimal adsorption–desorption kinetics, providing sufficient CO2 activation without inhibiting CO desorption.
Table 3.
Estimated TOFs for the plasma-catalytic CO2 dissociation at 4 kV in the presence of the mesoporous ceria catalysts.
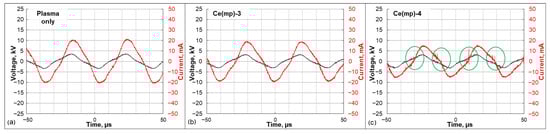
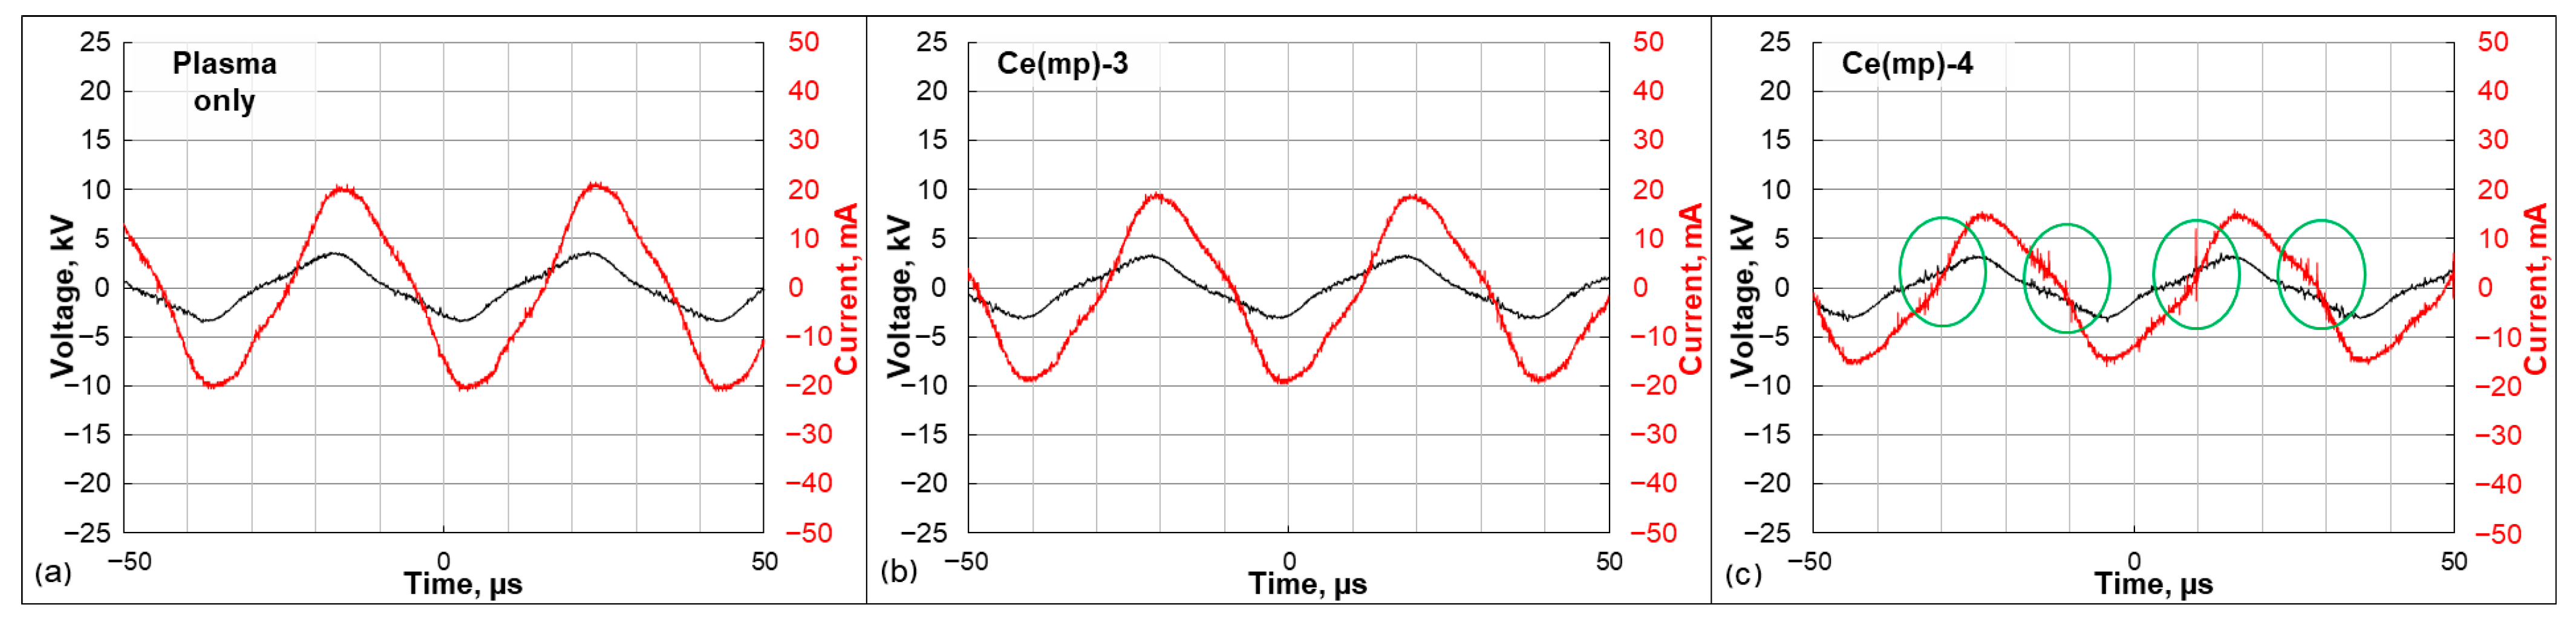
It can be observed that the developed meso-macroporous structure of Ce(mp)-4 was beneficial for the CO2 dissociation reaction in plasma. The alteration of DBD physical characteristics was observed in the presence of the Ce(mp)-4 catalyst. In Figure 8 voltage–current oscillograms are presented for the plasma-only and Ce(mp)-3-and Ce(mp)-4-loaded experiments. It can be seen that the current oscillogram in the plasma-only experiment is relatively smooth without any sharp peaks. When the catalyst was present (Figure 8b), the amplitude of the current oscillogram decreased due to catalyst packing, which reduced the free volume of the reactor. When the Ce(mp)-4 sample was packed into the reactor, the amplitude of the oscillogram also decreased due to the high volumetric density of the sample. Distinguishable peaks are clearly seen on the current oscillogram (marked in green circles, Figure 8c), corresponding to microdischarges, which were likely to appear in the meso-macroporous structure of the Ce(mp)-4 catalyst. It is reported in the literature that the microdischarges that were formed inside of the catalyst pores had a size of 4–100 nm and wider pores with sizes at the μm level [38]. Such microdischarges enhance the local electric field and thus increase the CO2 conversion.
Figure 8.
Voltage and current oscillograms captured during the CO2 plasma-catalytic dissociation at a 4 kV input voltage: (a) plasma-only reactor; (b) reactor packed with the Ce(mp)-3 sample; (c) reactor packed with the Ce(mp)-4 sample.
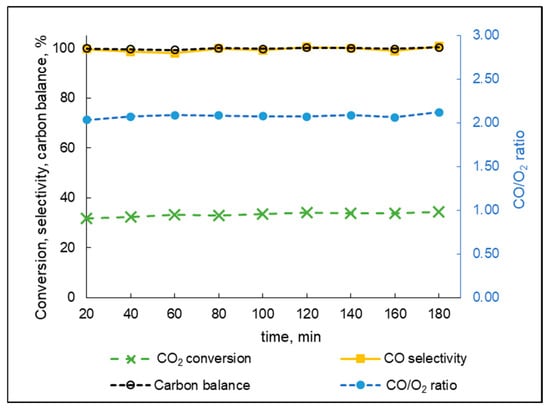
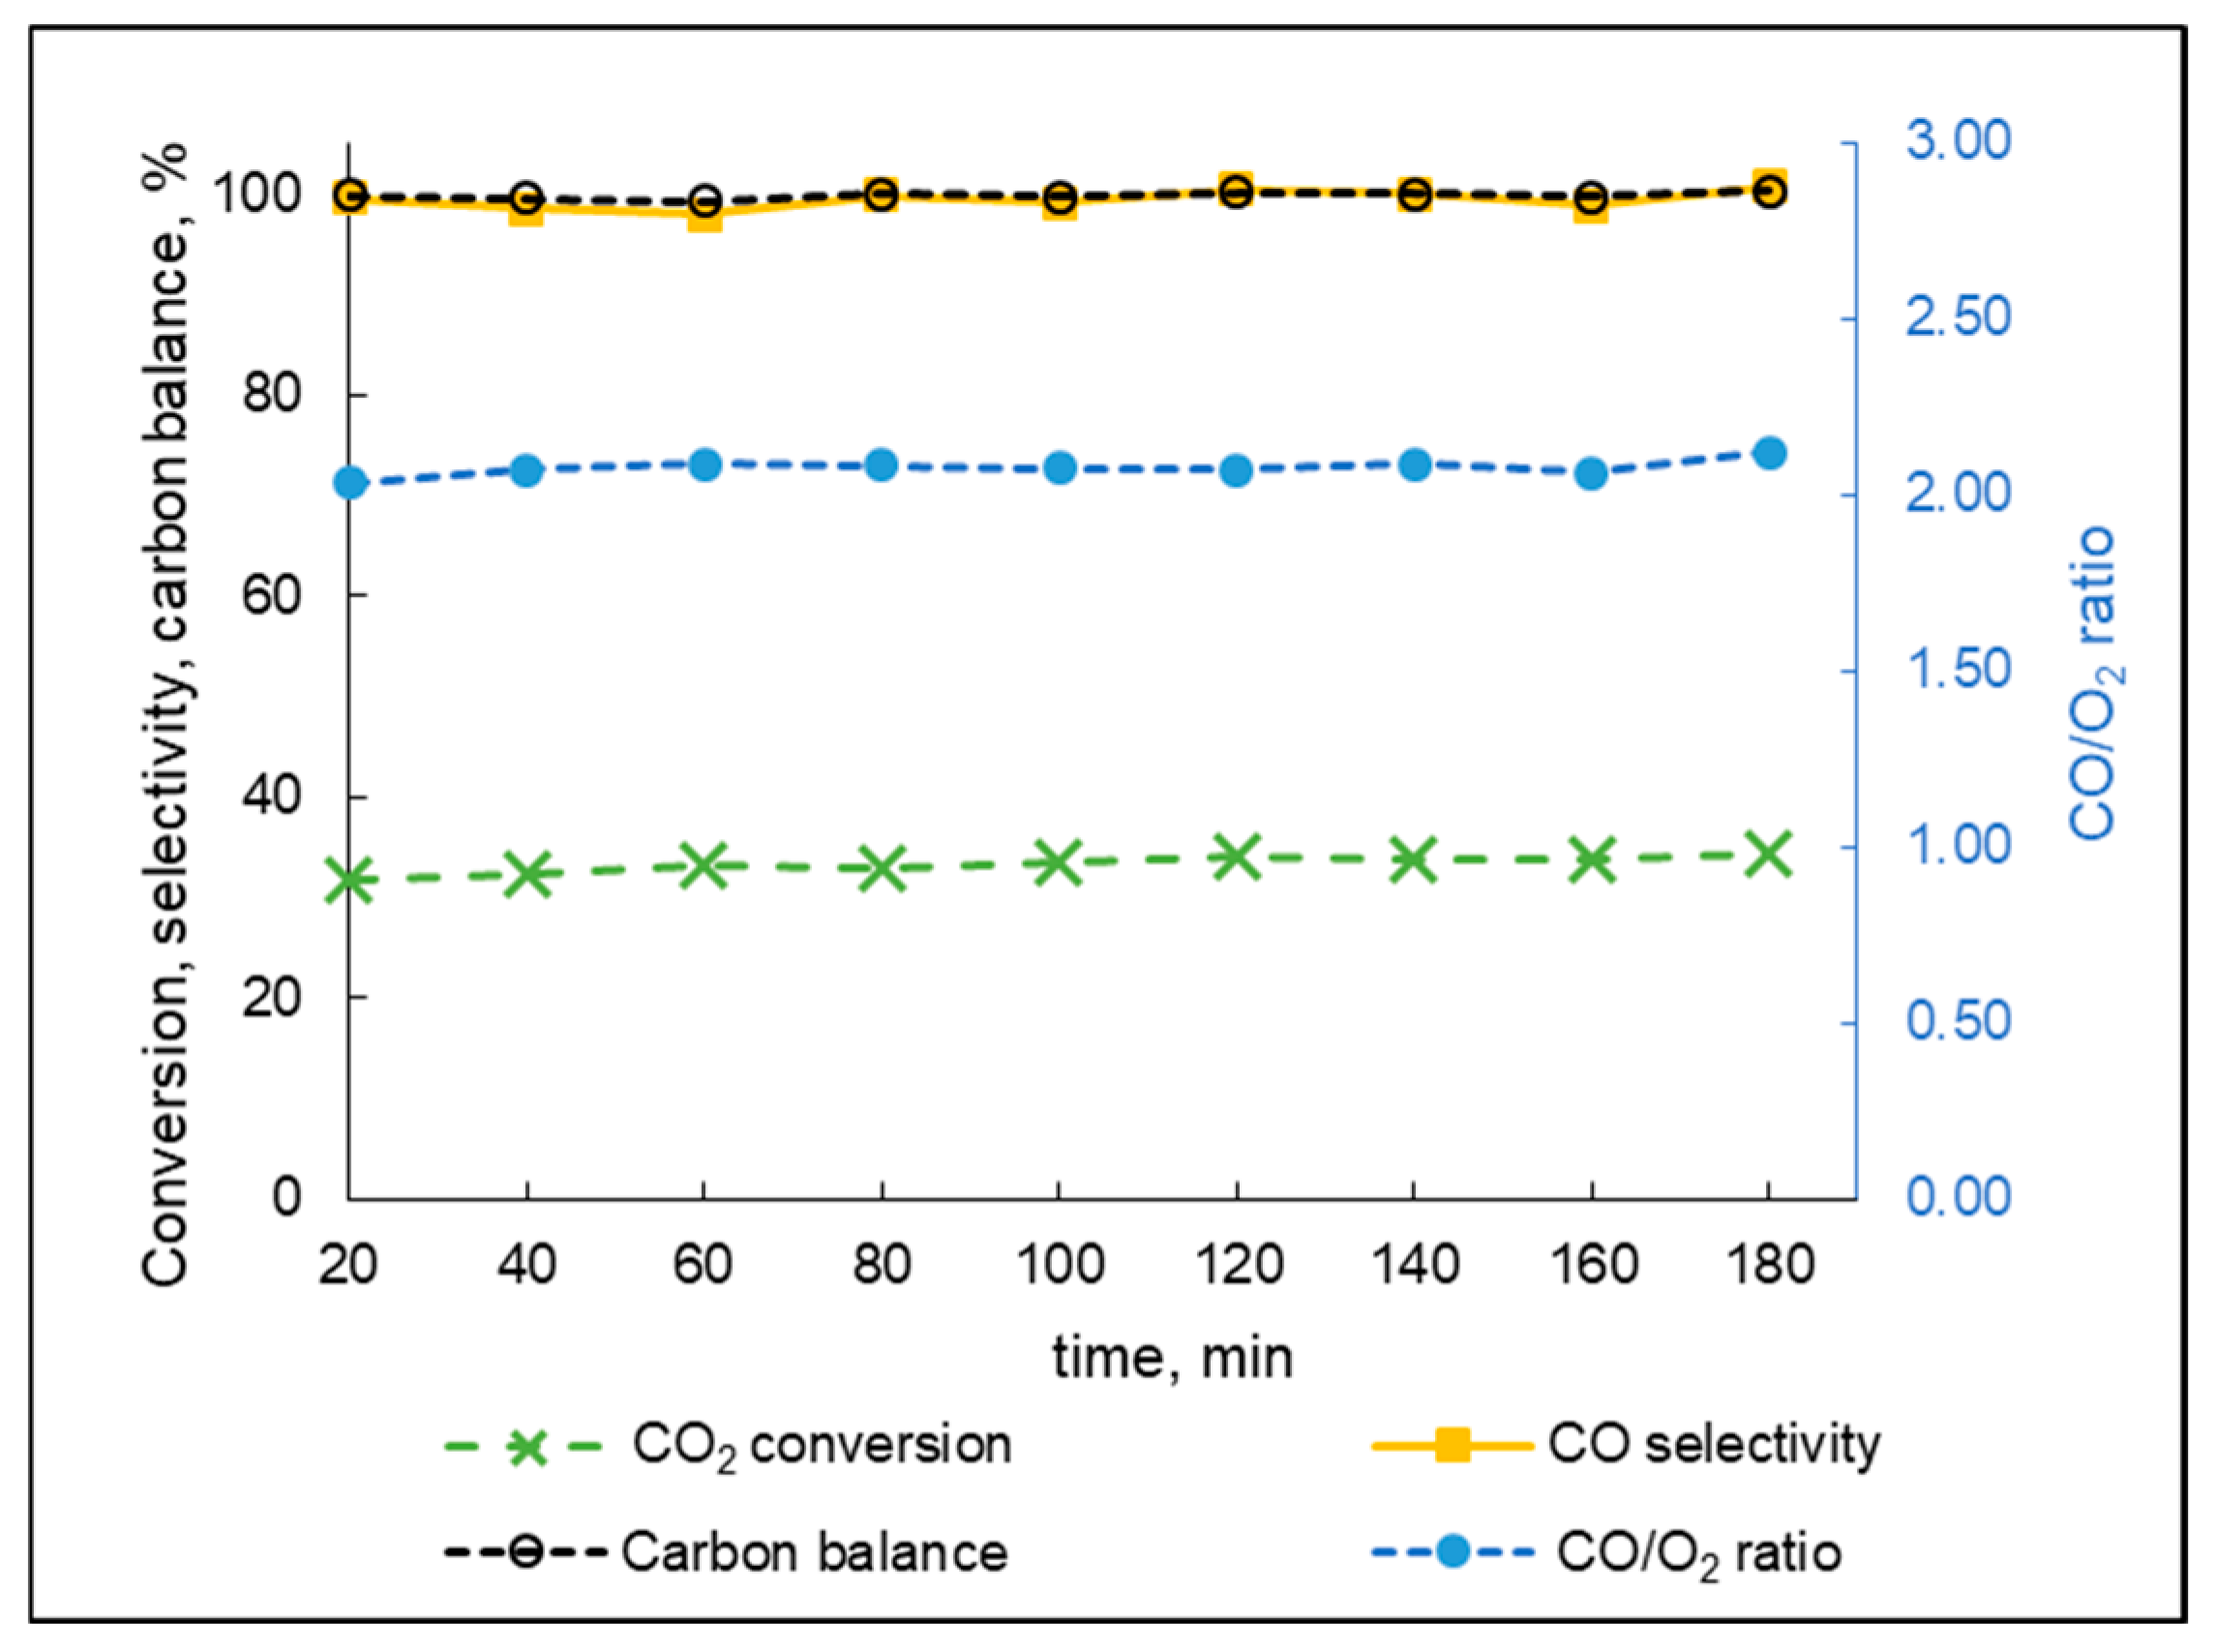
The test on catalyst stability was conducted using the Ce(mp)-4 sample as the most active catalyst within the series. The results of the experiment are presented in Figure 9. Within the measured time, the catalyst did not tend to deactivate, as no drop in conversion was observed. In contrast, an increase in CO2 conversion was recorded from 31.7% (20 min of runtime) to 34.3% (180 min of runtime). Furthermore, CO selectivity and carbon balance values were close to 100% and the CO/O2 ratio was close to 2.0, which suggested that no undesirable products like solid carbon were produced.
Figure 9.
Catalyst stability test during 180 min of constant CO2/Ar flow at 4 kV input voltage.
The obtained results were compared with the recently published ones on plasma-catalytic CO2 dissociation and were summarized in Table 4. Reported CO2 conversions ranged from about 9 to 52%, with energy efficiencies between 0.1 and 1.5 mmol CO per kJ, depending on reactor design and catalyst type. Low-power DBD systems generally achieved higher energy efficiency but lower CO2 conversion, while higher-power configurations led to higher conversion. Cerium-based catalysts consistently showed enhanced performance, likely due to the redox activity of Ce species and the presence of oxygen vacancies, which facilitate CO2 dissociation. However, the operating conditions in the reviewed studies varied significantly in terms of reactor geometry, discharge power, gas composition, and flow rate, which complicates a direct quantitative comparison of the results. It can also be seen that combining the right catalyst choice and special techniques (e.g., electrode cooling) helps increase conversion drastically. Nevertheless, the CeO2 mesoporous catalyst developed in this work shows one of the highest conversions under comparable discharge powers, highlighting the beneficial role of the CeO2 surface and meso-macroporous structure in promoting CO2 splitting efficiency.
Table 4.
Comparison of the plasma-catalytic CO2 decomposition performance with data from the literature.
2.3. Catalyst Characterization After the Reaction
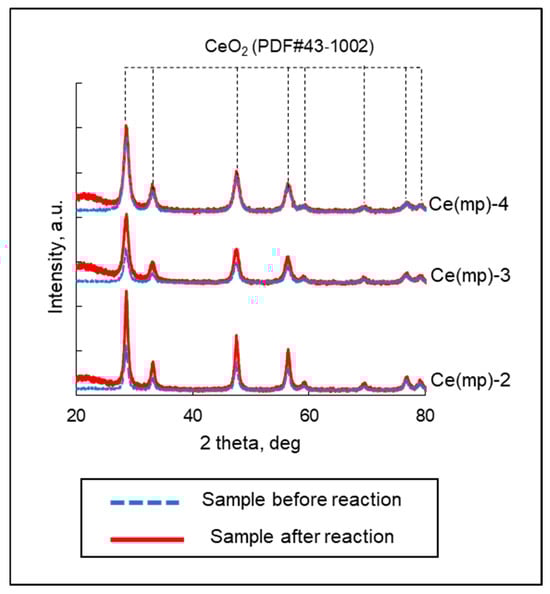
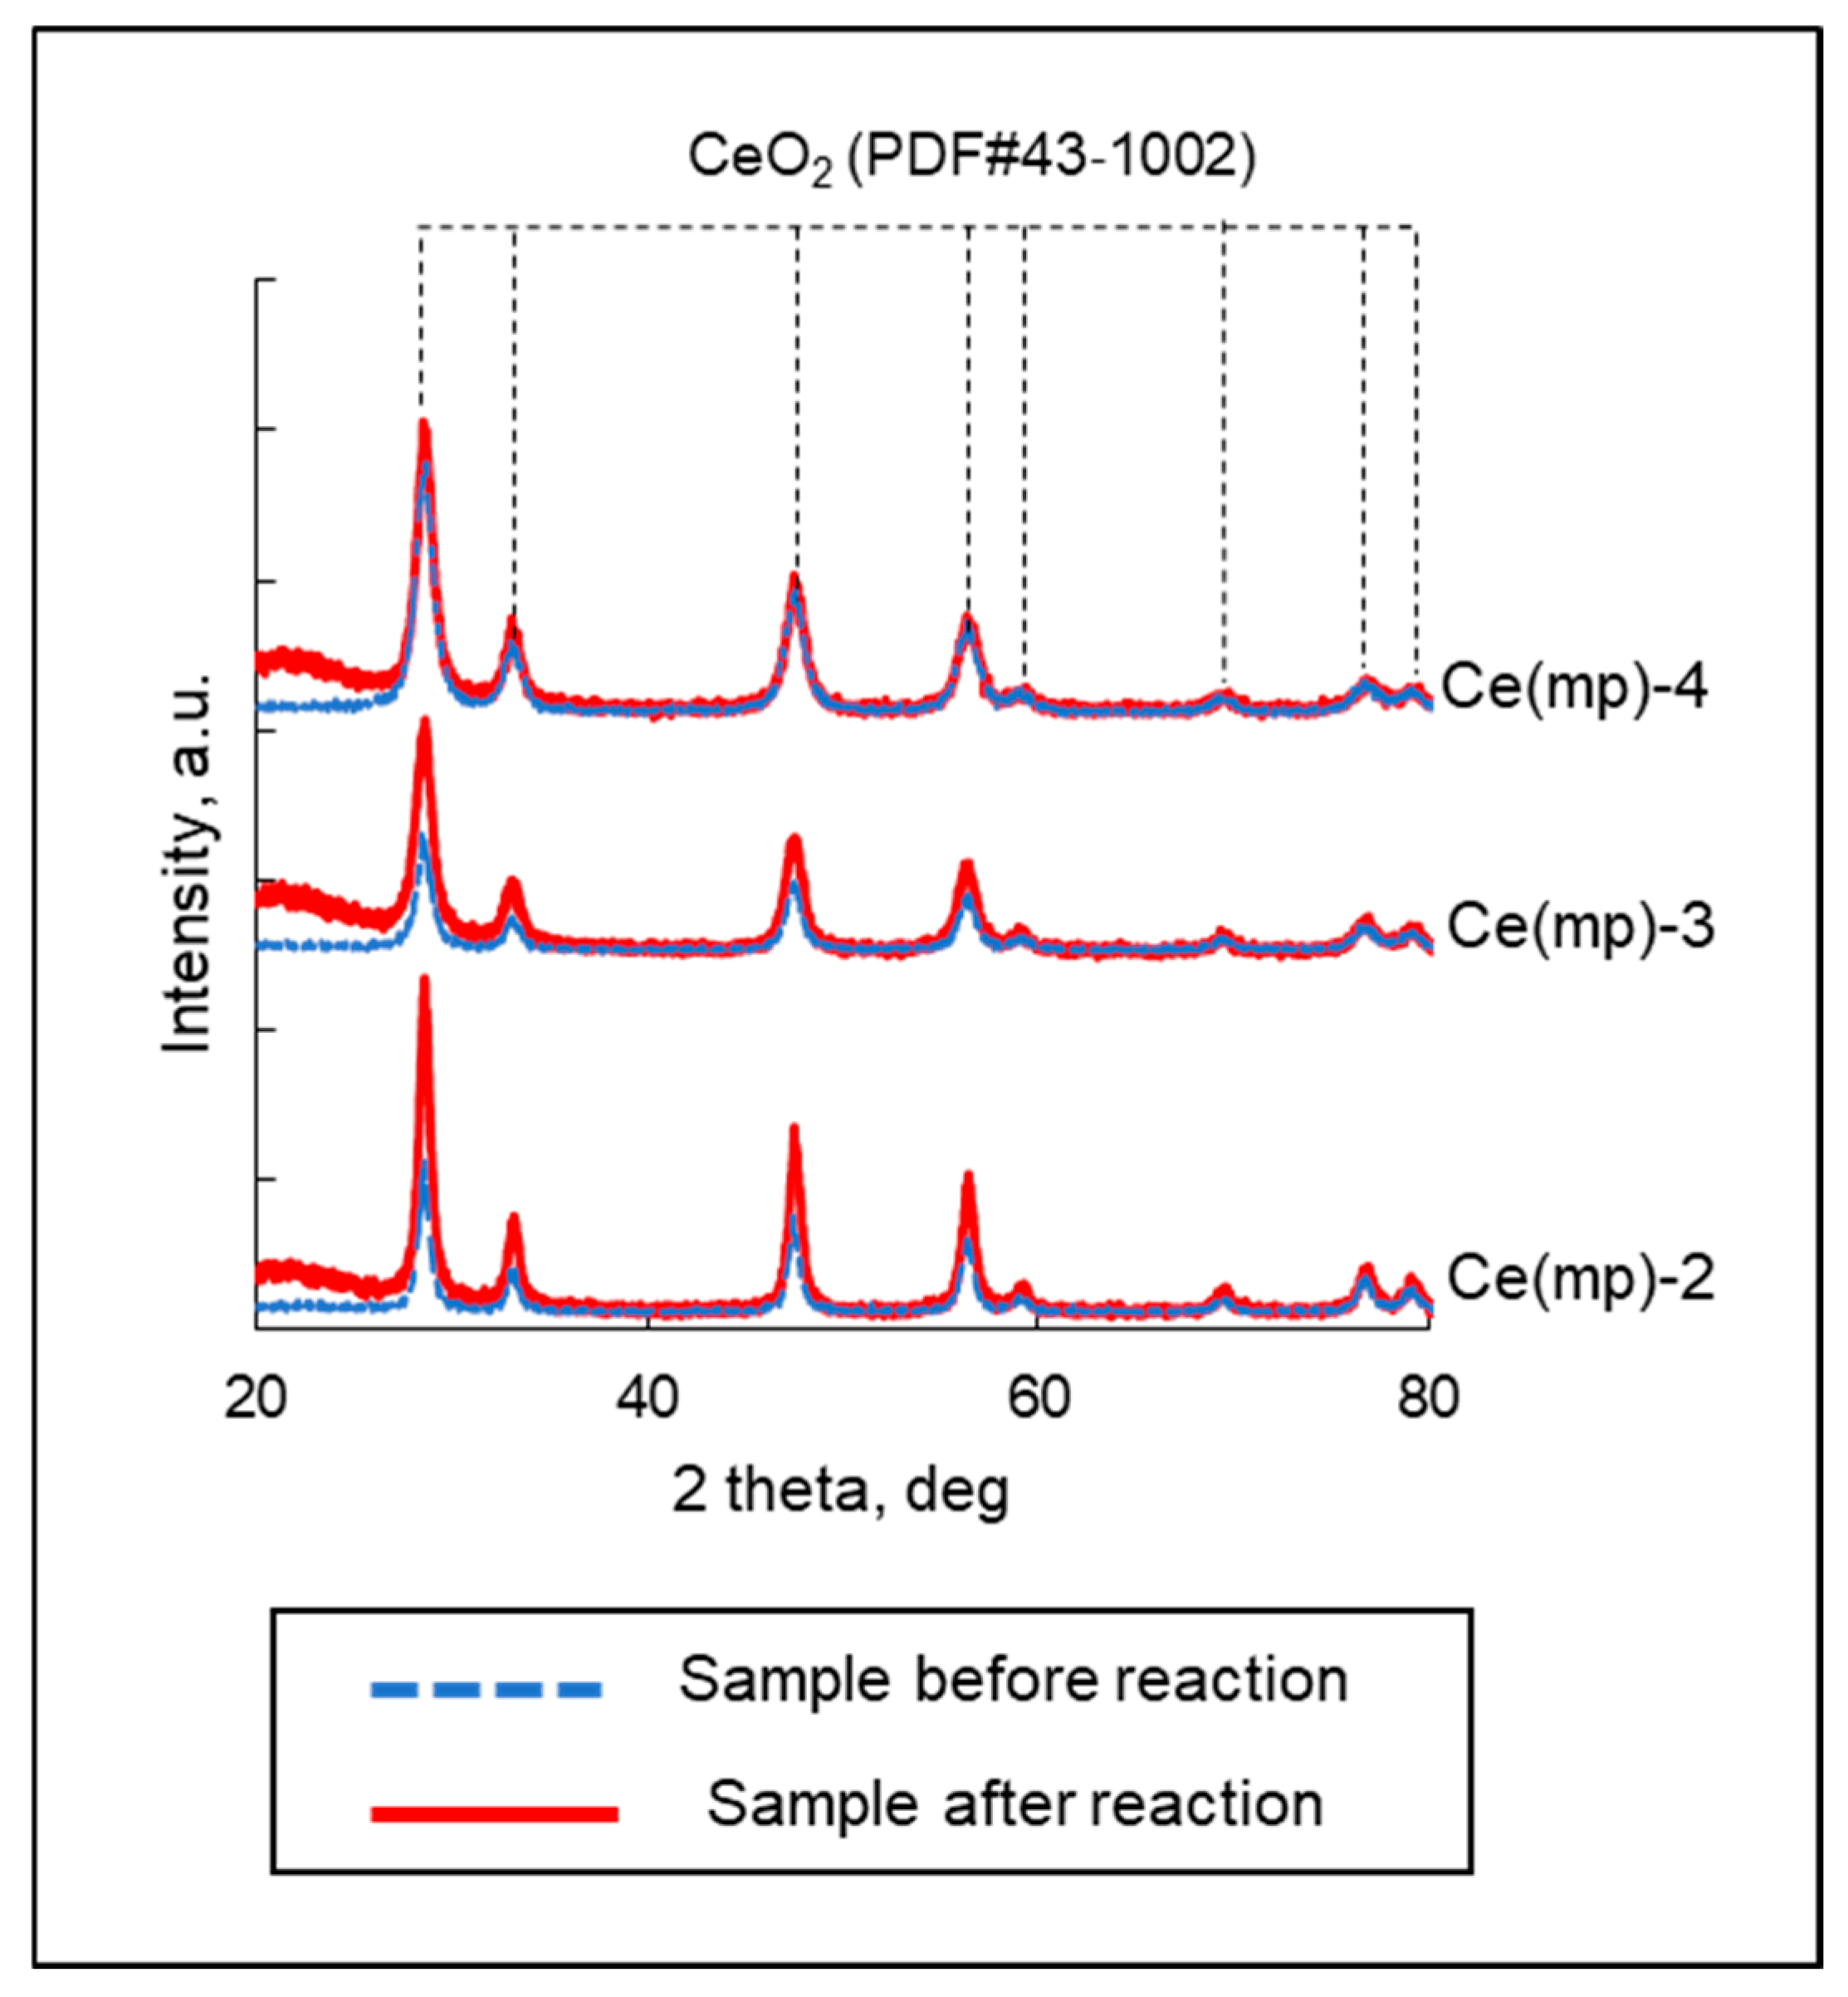
The catalysts (Ce(mp)-2–Ce(mp)-4) were characterized after the reactions to estimate changes in their physico-chemical characteristics. From XRD analysis, it was observed that no additional phases were present on the diffractograms after the reactions (Figure 10). The calculated average size of the crystallites (Table 5) was close to the crystallite size before the reactions for all samples (Table 2). This indicated that the nanostructure of the catalysts remained stable and agglomeration of the crystallites did not occur. From the low-temperature adsorption–desorption analysis, it was seen that the textural properties of the samples remained practically unchanged, and preservation of the mesoporous structure was evident from the adsorption isotherms (Figure S1). Additionally, XPS analysis did not reveal any drastic changes in the surfaces of the spent samples (Figure S2). It can be noted that the Ce3+ content increased (from 18 to 22%) only in the Ce(mp)-2 and Ce(mp)-3 samples, suggesting the redox properties of the ceria slightly changed under plasma conditions.
Figure 10.
XRD analysis of the samples after reaction.
Table 5.
Physico-chemical properties of the Ce(mp)-2–Ce(mp)-4 samples after the reaction: textural characteristics, revealed from N2 adsorption–desorption analysis; average crystallite size, calculated from XRD analysis; Ce3+ concentration, calculated from XPS data; atomic distribution on the surface, calculated from SEM-EDX analysis.
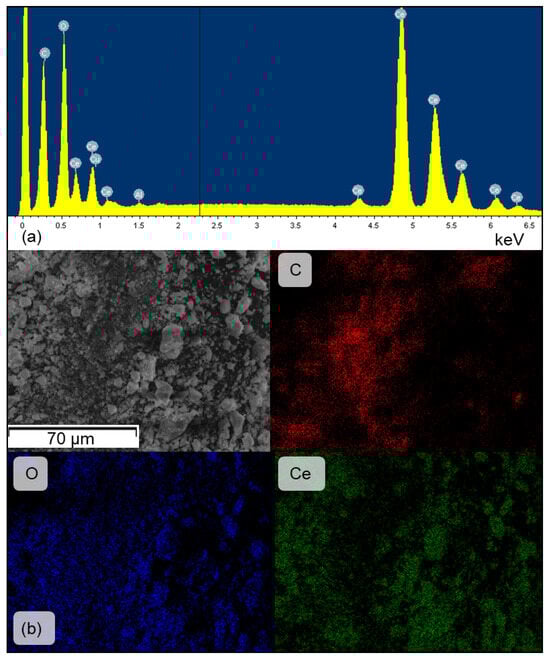
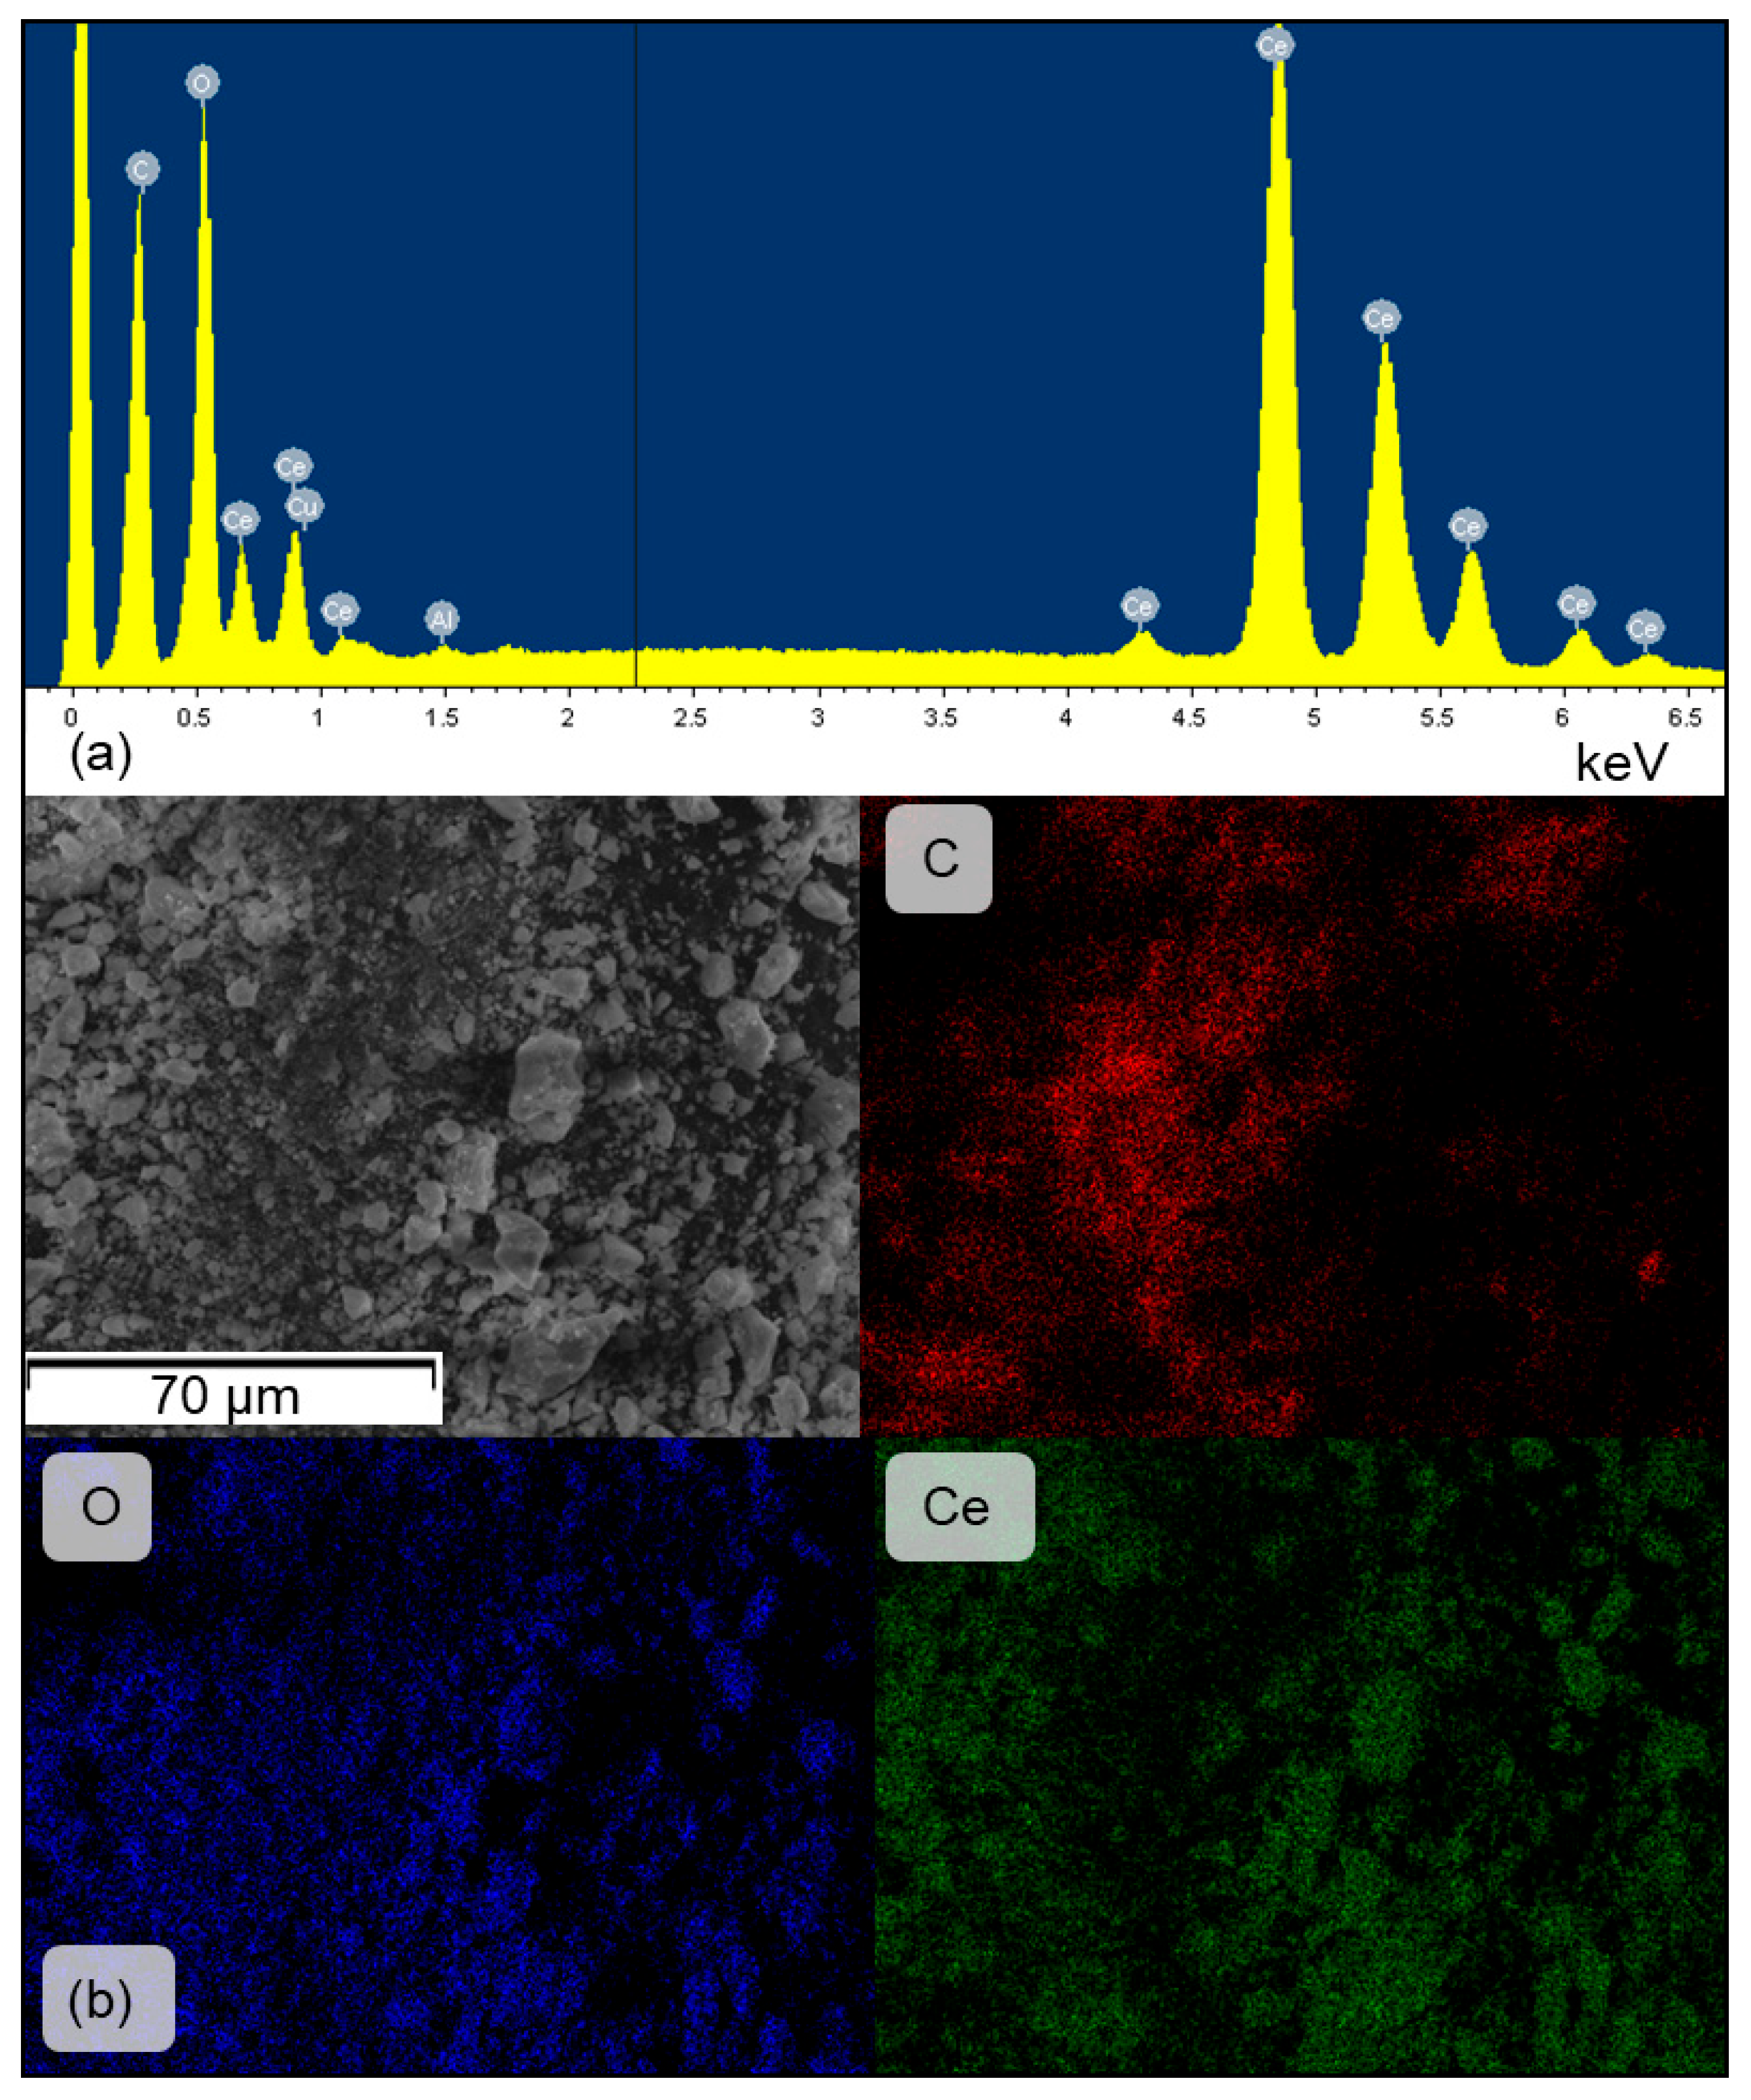
The morphology and composition of the catalyst surface after reaction were additionally analyzed by SEM–EDX and compared with TGA results. As shown in Figure 11, the SEM micrograph reveals aggregates of irregularly shaped CeO2 particles with dimensions in the submicron-to-several-micron range. The morphology remains largely preserved, indicating that plasma exposure did not cause noticeable sintering or fragmentation. The corresponding EDX spectrum shows intense signals from Ce and O, consistent with the presence of CeO2 as the main phase (Figure 11a) with an additional carbon peak. Elemental mapping (Figure 11b) shows a homogeneous distribution of Ce and O and a clear presence of C on the surface of the sample. The localized character of the carbon signal suggests surface deposition rather than bulk incorporation, and its intensity exceeds the level typically attributed to carbon coating or atmospheric contamination. It is also revealed from the EDX analysis that the highest carbon concentration on the sample surface occurred with the Ce(mp)-2 and Ce(mp)-3 samples, which may support the assumption of incomplete CTAB decomposition during the synthesis. However, it can also be seen that Ce(mp)-4 contained carbon surface atoms as well, but to a lesser extent.
Figure 11.
SEM-EDX analysis of the Ce(mp)-2 spent sample: (a) EDX spectrum; (b) elemental mapping.
The pointed findings correlate with the TGA results (Figures S3–S5), which revealed a small mass loss of 2–4% accompanied by a DTG peak at 330–335 °C for all samples. This temperature range coincides with the thermal decomposition of cerium (III) oxalate, which typically decomposes to CeO2 with the release of CO and CO2 in an air atmosphere [43]. Formation of oxalate species, however, has not been reported in the literature for the related conditions but may be explained by the redox behavior of CeO2 under plasma conditions. The plasma environment generates a high density of reactive CO2 fragments (CO, CO2–, and COx radicals) that can interact with reduced Ce3+ surface sites. As previously stated for thermocatalytic and photocatalytic systems [44,45], these interactions promote the coupling of CO2-derived species to form adsorbed carbon–oxygen intermediates, including oxalates. Subsequent thermal oxidation of these intermediates regenerates CeO2 and releases CO and CO2, consistent with the TGA mass-loss observations.
Therefore, while carbon was found by means of SEM-EDX, it cannot have been related to solid carbon deposition from the decomposition of CO2 to C and O2 during the plasma-catalytic reaction. Either the carbon originated from an incomplete precursor decomposition or a newly formed species like oxalate intermediates. The CeO2 lattice remained structurally stable based on the XRD analysis, while surface atoms may have facilitated reversible storage and oxidation of these species during plasma exposure. The latter assumption needs to be carefully checked and confirmed by means of in situ/operando methods.
3. Materials and Methods
3.1. Catalyst Synthesis
For the synthesis of the mesoporous ceria catalysts, various techniques were used. A brief summarization of the obtained ceria samples is presented in Table 6 and a detailed description of the synthesis is given below.
Table 6.
Designation of the catalysts and a brief description of synthesis methods.
The synthesis of the Ce(mp)-1 sample was carried out using the technique [46] as a reference. In a typical synthesis, 5.21 g of Ce(NO3)3·6H2O (99%, LLC “Tsentr Tekhnologii Lantan”, Moscow, Russia) was dissolved in 84 cm3 of distilled water to obtain a clear solution. Then, 3.79 g of NH4HCO3 (pure, LLC “Spektr-Him”, Moscow, Russia) was added to the solution under vigorous stirring and the white precipitate Ce2(CO3)3 was produced. After that, 21 cm3 of H2O2 (37 vol% solution, LLC “Rushim.ru”, Moscow, Russia) was added dropwise to the suspension and the color of the precipitate turned orange. The suspension was stirred for 30 min and subsequently aged for 3 h without stirring. The mixture was transferred into a 150 cm3 stainless steel Teflon-lined autoclave and aged at 200 °C for 24 h. The product was then filtered, washed thoroughly with distilled water, and dried in an oven to obtain the Ce(mp)-1 sample.
The synthesis of the Ce(mp)-2 and Ce(mp)-3 samples was carried out using the technique [47] as a reference. Briefly, 3.9 g of Ce(NO3)3·6H2O and 1.09 g (2.18 g in case of Ce(mp)-3 sample) of cetyltrimethylammonium bromide (CTAB, >99%, HiMedia, Thane, India) were dissolved in 120 cm3 of distilled water. After the dissolution of the reagents, 12 cm3 of aqueous ammonia (NH3·H2O, pure for analysis, LLC “Sigma-Tek”, Khimki, Russia) was added dropwise to the solution, after which it was transferred into a 150 cm3 stainless steel Teflon-lined autoclave and aged at 100 °C for 24 h. The product was then filtered, washed thoroughly with distilled water, and dried in an electric oven.
The synthesis of the Ce(mp)-4 sample was carried out in accordance with the technique [48] using citric acid (JSC “LenReactiv”, Saint-Petersburg, Russia) as a pore-developing agent.
The synthesis of the Ce(mp)-5 sample was carried out using the technique [49] as a reference. In a typical synthesis, 6 g of NaOH (pure for analysis, JSC “LenReactiv”, Saint-Petersburg, Russia) was dissolved in 160 cm3 of distilled water. Simultaneously, 9.76 g of Ce(NO3)3·6H2O was dissolved in 20 cm3 of distilled water and then the solution was added dropwise to the NaOH solution and a purple precipitate was produced. The mixture was stirred for 2 h and then the precipitate was washed with distilled water until it became a neutral medium. The precipitate was dried in air and then in an oven at 60 °C for 9 h.
3.2. Physico-Chemical Methods
X-ray diffraction (XRD). XRD patterns were recorded using the TD-3700 X-ray diffractometer (Tongda Science & Technology Co., Ltd., Dandong City, China). The device was equipped with a copper anode X-ray tube, a Mythen2R 1K linear multichannel semiconductor detector, and a Goebel mirror for parallel beam formation. Data were collected over a 2θ range of 10–90°. Average crystallite size was estimated using Williamson–Hall analysis [50].
N2 adsorption–desorption. The specific surface area (SBET), pore volume (Vpores), and pore diameter (dpores) of the catalysts were measured using the BELSORP MINI X analyzer (Microtrac MRB, Osaka, Japan). Prior to analysis, samples underwent thermal degassing at 300 °C for 8 h under a pressure of 10 Pa. The Brunauer–Emmett–Teller (BET) method was employed to calculate the specific surface area within a relative pressure range (p/p0) of 0.05–0.2.
X-ray photoelectron spectroscopy (XPS). The properties of surface Ce atoms were determined by X-ray photoelectron spectroscopy on a PREVAC EA15 spectrometer (PREVAC, Rogów, Poland) with a high-resolution hemispherical analyzer. Characteristic non-monochromatized Al Kα X-ray emission (hν = 1486.6 eV, 150 W) was applied during the analysis. The binding energy scale was calibrated to the position of the photoelectron lines of the ground levels of gold (Au4f7/2—84.0 eV) and silver (Ag3d5/2—368.3 eV). The spectral data were analyzed using CasaXPS software (Version 2.3.24PR1.0).
Scanning electron microscopy. The surface morphology and elemental analysis of the samples were examined using scanning electron microscopy (SEM) combined with energy dispersive X-ray spectroscopy (EDX) with a NVision 40 (Carl Zeiss, Oberkochen, Germany) microscope equipped with an Oxford Instruments X-Max EDX detector (Oxford Instruments, Carl Zeiss, Oberkochen, Germany) operated at 20 kV.
X-ray fluorescence spectroscopy (XRF). The elemental composition of the catalysts was determined using the ARL PERFORM’X Sequential Spectrometer (Thermo Fisher Scientific, Ecublens, Switzerland) with an X-ray tube power of 2500 W.
CO2-Temperature programmed desorption (CO2-TPD). The basic properties of the catalysts were evaluated using the CO2-TPD method with USGA-101 (LLC “Unisit”, Moscow, Russia) equipment. The catalyst sample was treated at 512 °C for 40 min to remove water and oxygen, and then exposed to CO2 at 60 °C for 24 min. The adsorbed CO2 was subsequently removed at 102 °C and the CO2 desorption was analyzed using a thermal conductivity detector.
Thermogravimetric analysis (TGA) with differential scanning calorimetry was conducted using the TGA/DSC 3+ analyzer (Mettler Toledo, Columbus, OH, USA) at a temperature range of 30–900 °C in an air atmosphere.
3.3. Plasma-Catalytic Experiments
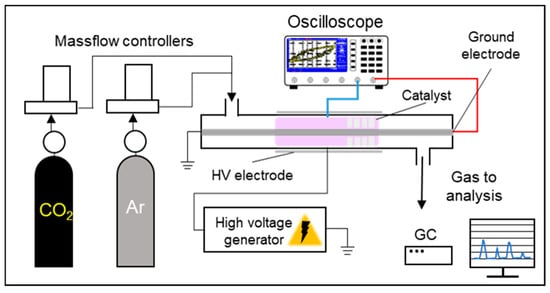
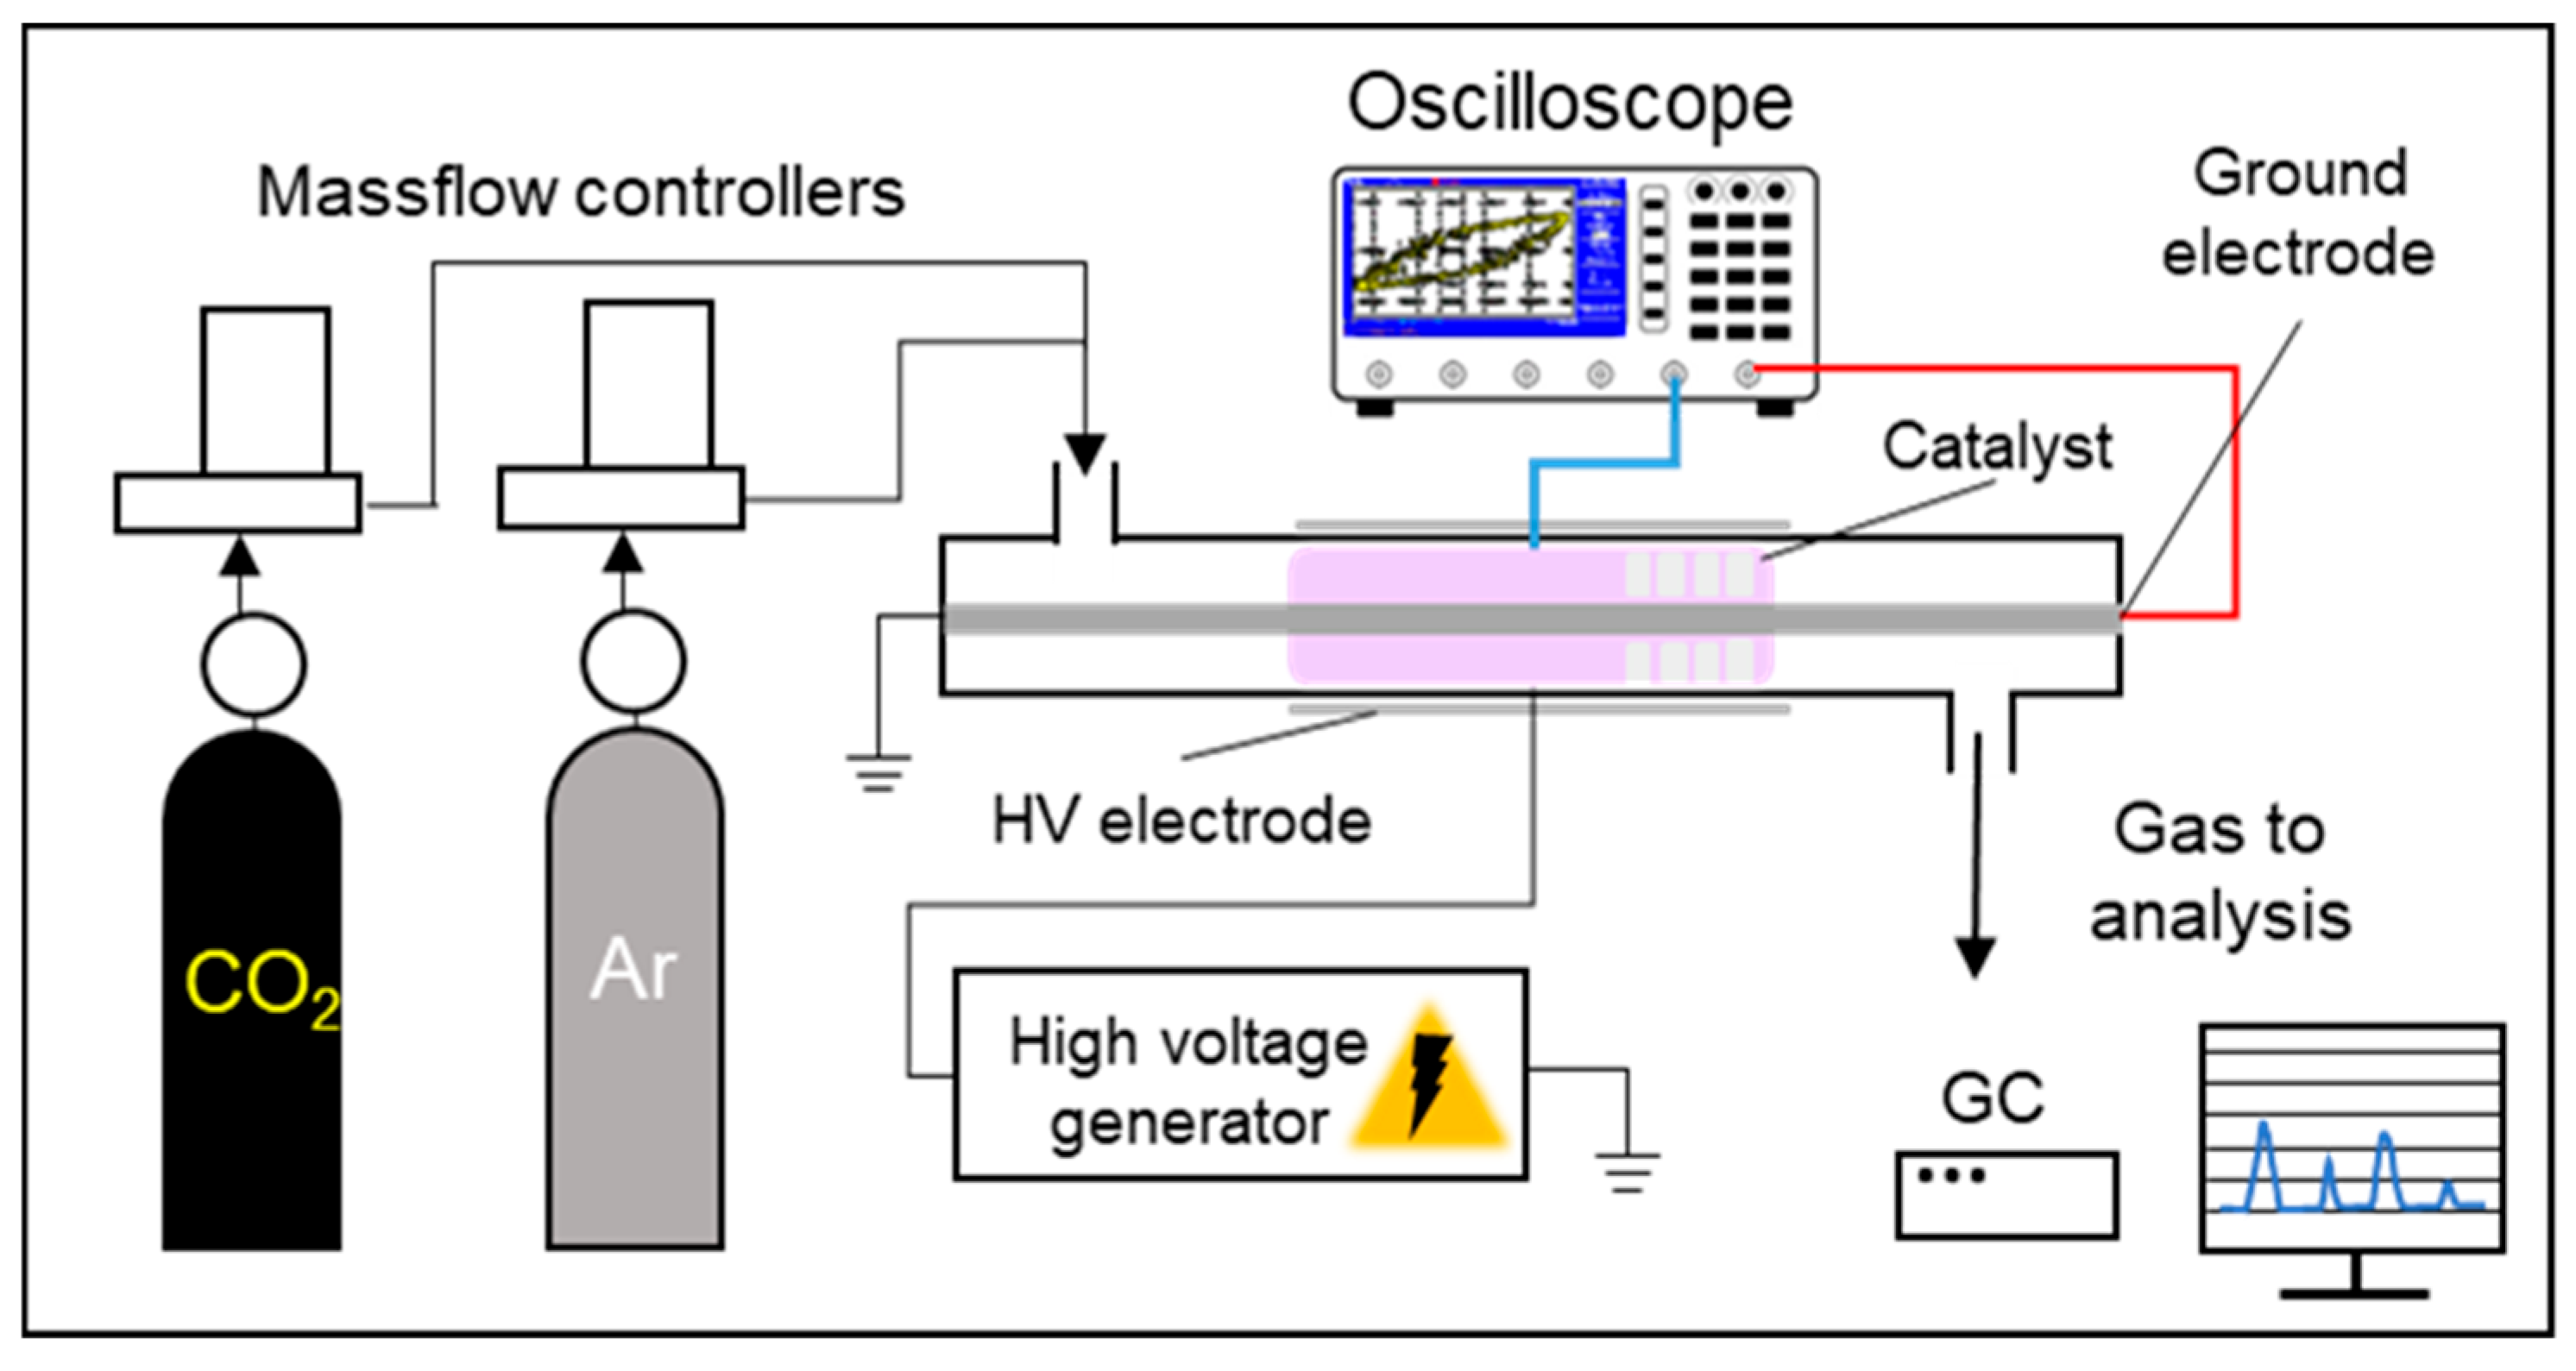
The experiments on CO2 dissociation were performed using a plasma-catalytic setup equipped with a DBD reactor (Figure 12). The system consisted of a gas supply unit, the DBD reactor, a high-voltage power source, and measurement devices. The reactor body, serving also as the dielectric barrier, was a quartz tube (16 mm outer diameter, 2 mm wall thickness, and 160 mm length). A threaded steel rod (8 mm diameter) placed inside the tube acted as the grounded electrode, while a steel mesh (0.2 mm mesh size and 80 mm length) wrapped around the outside functioned as the high-voltage electrode. The discharge gap was 4 mm.
Figure 12.
A scheme of the plasma-catalytic unit for CO2 dissociation.
The catalyst (1 g) was loaded into the reactor and fixed between two layers of quartz wool. The particle size slightly varied depending on the catalyst, but was within the range of 0.1–0.5 mm. A CO2–Ar gas mixture was supplied through mass flow controllers (RRG-20, LLC “Eltochpribor”, Zvenigorod, Russia). For all experiments, the CO2 flow rate was set to 12 mL/min, with a CO2:Ar ratio of 20:80 (vol.%). The high-voltage source provided a sinusoidal signal at 25 kHz. Discharge voltage and current were monitored with a TDS 2012B oscilloscope (Tektronix, Beaverton, OR, USA) using a capacitive voltage divider circuit. Experiments were conducted within an input voltage range of 3–5 kV and a current range of 15–34 mA. Plasma-absorbed power, determined by the Lissajous figure method, varied between ~15 and ~45 W depending on the input voltage.
Reaction products were analyzed using a gas chromatograph PIA (LLC “NPF MEMS”, Samara, Russia) equipped with a thermal conductivity detector, a Hayesep N column (2 m), and a molecular sieve 13 Å column (2 m).
The performance of the process was evaluated using the following equations.
Conversion of CO2 was calculated as
where ν(CO2)inlet is the quantity of CO2 which is put into the reactor (mol), and ν(CO2)outletis the quantity of CO2 flowing out of the reactor (mol).
Yield of CO was calculated as
Selectivity of CO was calculated as
where ν(CO2)conv is the quantity of CO2 which was converted during plasma-catalytic dissociation.
Plasma-absorbed power was calculated from the Volt–Coulomb characteristic (Lissajous figure) of the discharge as follows [51]:
where u(t) is the discharge voltage, i(t) is the discharge current, Cn is the value of the capacitor included in series with the discharge tube, uc(t) is the voltage on the Cn, T is the period of the applied voltage, f is the frequency of the applied voltage, and A is the area of the Lissajous figure.
Energy efficiency of the process was calculated as follows:
Specific energy input (SEI) was calculated as:
Carbon balance was calculated as:
4. Conclusions
Dissociation of CO2 in plasma in the presence of mesoporous ceria catalysts was conducted. This study demonstrates that the physico-chemical properties of mesoporous CeO2 catalysts strongly influence their performance in CO2 dissociation under DBD plasma. Specifically, Ce(mp)-4, characterized by a meso-macroporous structure and moderate basicity, led to the highest CO2 conversion and energy efficiency. Its structure favored microdischarge formation inside the pores, enhancing plasma-catalyst interactions and promoting CO2 activation and desorption. In contrast, catalysts with excessive strong basic sites or dense morphology showed lower activity due to limited CO2 desorption or insufficient plasma-catalyst synergy. The Ce(mp)-4 catalyst also exhibited remarkable stability over extended operation without solid carbon deposition or deactivation. Our findings related to spent catalyst characterization suggest the preservation of the mesoporous structure and bulk phase composition; however, carbon species were found and were related either to incomplete precursor decomposition or to intermediate carbon species (e.g., oxalate) formation in a plasma environment. These results provide insight into the design principles of plasma-catalytic materials and suggest that tailored pore structures and controlled basic-site distribution are key factors for efficient CO2 conversion.
This study contributes to the development of scalable, low-temperature CO2 utilization technologies. Future studies will address the optimization of reaction parameters, including reactor design, plasma power, and CO2 flowrate and their influence on process efficiency. Another important goal will be to decrease the ceria loading while maintaining high CO2 conversion.
Supplementary Materials
The following supporting information can be downloaded at https://www.mdpi.com/article/10.3390/molecules30214312/s1: Figure S1. Adsorption–desorption isotherms of the samples after the reaction. Figure S2. Adsorption–desorption isotherms of the samples after the reaction. Figure S3. TGA data of the Ce(mp)-2 sample after the reaction. Figure S4. TGA data of the Ce(mp)-3 sample after the reaction. Figure S5. TGA data of the Ce(mp)-4 sample after the reaction; TOF calculation procedure.
Author Contributions
Conceptualization, A.L.M. and O.V.G.; methodology, O.V.G. and A.A.S.; validation, O.V.G.; investigation, O.V.G. and A.A.S.; resources, O.V.G. and A.A.S.; writing—original draft preparation, O.V.G.; writing—review and editing, A.L.M.; visualization, O.V.G.; supervision, A.L.M.; project administration, A.L.M. All authors have read and agreed to the published version of the manuscript.
Funding
This work was supported by the grant of the Ministry for Education and Science of the Russian Federation (agreement of 24 April 2024 no. 075-15-2024-547).
Institutional Review Board Statement
Not applicable.
Data Availability Statement
Data are contained within the article.
Acknowledgments
This work was performed using the equipment of the Shared Research Center, the Analytical Center of Deep Oil Processing and Petrochemistry of the A.V. Topchiev Institute of Petrochemical Synthesis, RAS. The SEM measurements were performed using the equipment of the JRC PMR IGIC RAS. The authors thank Levin I.S. for the XRD measurements and Panin A.A. for conducting the N2 adsorption analysis.
Conflicts of Interest
The authors declare no conflicts of interest.
Abbreviations
The following abbreviations are used in this manuscript:
| BET | Brunauer–Emmett–Teller |
| DBD | Dielectric barrier discharge |
| EDX | Energy dispersive X-ray spectroscopy |
| SEM | Scanning electron microscopy |
| TGA | Thermogravimetric analysis |
| TPD | Temperature-programmed desorption |
| XPS | X-ray photoelectron spectroscopy |
| XRD | X-ray diffraction |
| XRF | X-ray fluorescent spectroscopy analysis |
References
- Bhavsar, A.; Hingar, D.; Ostwal, S.; Thakkar, I.; Jadeja, S.; Shah, M. The current scope and stand of carbon capture storage and utilization—A comprehensive review. Case Stud. Chem. Environ. Eng. 2023, 8, 100368. [Google Scholar] [CrossRef] [Scilit]
- Zhu, Q. Developments on CO2-utilization technologies. Clean Energy 2019, 3, 85–100. [Google Scholar] [CrossRef] [Scilit]
- Bahmanpour, A.M.; Signorile, M.; Kröcher, O. Recent progress in syngas production via catalytic CO2 hydrogenation reaction. Appl. Catal. B Environ. 2021, 295, 120319. [Google Scholar] [CrossRef] [Scilit]
- George, A.; Shen, B.; Craven, M.; Wang, Y.; Kang, D.; Wu, C.; Tu, X. A Review of Non-Thermal Plasma Technology: A novel solution for CO2 conversion and utilization. Renew. Sustain. Energy Rev. 2021, 135, 109702. [Google Scholar] [CrossRef] [Scilit]
- Bogaerts, A.; Tu, X.; Whitehead, J.C.; Centi, G.; Lefferts, L.; Guaitella, O.; Azzolina-Jury, F.; Kim, H.H.; Murphy, A.B.; Schneider, W.F.; et al. The 2020 plasma catalysis roadmap. J. Phys. D Appl. Phys. 2020, 53, 443001. [Google Scholar] [CrossRef] [Scilit]
- Chen, G.; Snyders, R.; Britun, N. CO2 conversion using catalyst-free and catalyst-assisted plasma-processes: Recent progress and understanding. J. CO2 Util. 2021, 49, 101557. [Google Scholar] [CrossRef] [Scilit]
- Shah, Y.T.; Verma, J.; Katti, S.S. Plasma activated catalysis for carbon dioxide dissociation: A review. J. Indian Chem. Soc. 2021, 98, 100152. [Google Scholar] [CrossRef] [Scilit]
- De Felice, G.; Eichkorn, S.; Gallucci, F.; Li, S. Techno-economic analysis of plasma-assisted CO2 hydrogenation to methanol: Feasibility and the impact of electricity supply. EES Catal. 2025, 3, 1327–1344. [Google Scholar] [CrossRef] [Scilit]
- Kozák, T.; Bogaerts, A. Splitting of CO2 by vibrational excitation in non-equilibrium plasmas: A reaction kinetics model. Plasma Sources Sci. Technol. 2015, 24, 015024. [Google Scholar] [CrossRef] [Scilit]
- Zhang, H.; Li, L.; Xu, R.; Huang, J.; Wang, N.; Li, X.; Tu, X. Plasma-enhanced catalytic activation of CO2 in a modified gliding arc reactor. Waste Dispos. Sustain. Energy 2020, 2, 139–150. [Google Scholar] [CrossRef] [Scilit]
- Xu, W.; Van Alphen, S.; Galvita, V.V.; Meynen, V.; Bogaerts, A. Effect of gas composition on temperature and CO2 conversion in a gliding arc plasmatron reactor: Insights for post-plasma catalysis from experiments and computation. ChemSusChem 2024, 17, e202400169. [Google Scholar] [CrossRef] [Scilit]
- Ahasan, M.R.; Hossain, M.; Wang, R. Dielectric barrier discharge reactors for plasma-assisted CO2 and CH4 conversion: A comprehensive review of reactor design, performance, and future prospects. Energy Technol. 2024, 13, 2401177. [Google Scholar] [CrossRef] [Scilit]
- Wu, X.; Zhao, J.; Tao, J.; Chi, J.; Zhang, Y.; Wang, Z.; Li, Z.; Zhang, X. The performance of CO2 reduction by dielectric barrier discharge plasma coupled Cu-Ni binary silicon-based composites. J. Environ. Chem. Eng. 2024, 12, 113617. [Google Scholar] [CrossRef] [Scilit]
- Rao, M.U.; Vidyasagar, D.; Ghanty, C.; Iqbal, M.Z.; Bhargavi, K.; Ghosal, P.; Madras, G.; Subrahmanyam, C. Nonthermal plasma-assisted enhanced CO2 conversion over NiOx/γ-Al2O3 catalyst. Ind. Eng. Chem. Res. 2024, 63, 9336–9346. [Google Scholar] [CrossRef] [Scilit]
- Ray, D.; Chawdhury, P.; Bhargavi, K.V.S.S.; Thakonda, S.; Lingaiah, N.; Subrahmanyam, C. Ni and Cu oxide supported γ-Al2O3 packed DBD plasma reactor for CO2 activation. J. CO2 Util. 2020, 44, 101400. [Google Scholar] [CrossRef] [Scilit]
- Wang, L.; Du, X.; Yi, Y.; Wang, H.; Gul, M.; Zhu, Y.; Tu, X. Plasma-enhanced direct conversion of CO2 to CO over oxygen-deficient Mo-doped CeO2. Chem. Commun. 2020, 56, 14801–14804. [Google Scholar] [CrossRef] [Scilit]
- Xia, M.; Ding, W.; Shen, C.; Zhang, Z.; Liu, C.-J. CeO2-enhanced CO2 decomposition via frosted dielectric barrier discharge plasma. Ind. Eng. Chem. Res. 2022, 61, 10455–10460. [Google Scholar] [CrossRef] [Scilit]
- Ji, H.; Lin, L.; Chang, K. Plasma-assisted CO2 decomposition catalyzed by CeO2 of various morphologies. J. CO2 Util. 2023, 68, 102351. [Google Scholar] [CrossRef] [Scilit]
- Li, J.; Zhu, S.; Lu, K.; Ma, C.; Yang, D.; Yu, F. CO2 conversion in a coaxial dielectric barrier discharge plasma reactor in the presence of mixed ZrO2–CeO2. J. Environ. Chem. Eng. 2021, 9, 104654. [Google Scholar] [CrossRef] [Scilit]
- Yang, Y.; Luo, S.; Li, J.; Zhang, Y.; Zhang, L.; Wang, Y.; Wang, L.; Zhang, X.; Liu, Y.; Zhang, Z.; et al. Converting CO2 to CO via a plasma-catalyst coupled pathway with ultrahigh single-pass CO2 conversion and 100% CO selectivity. ACS Catal. 2015, 5, 5666–5676. [Google Scholar] [CrossRef] [Scilit]
- Li, S.; Wang, Y.; Zhang, K.; Zhu, H.; Liao, G.; Li, Q.; Jia, S.; Feng, Q.; Pan, J.; Tan, R.; et al. Engineering In2O3 catalysts using dielectric barrier discharge plasma for selective CO2 conversion to CO. J. Alloys Compd. 2025, 1039, 183304. [Google Scholar] [CrossRef] [Scilit]
- Duan, X.; Hu, Z.; Li, Y.; Wang, B. Effect of dielectric packing materials on the decomposition of carbon dioxide using DBD microplasma reactor. AIChE J. 2015, 61, 898–903. [Google Scholar] [CrossRef] [Scilit]
- Hatami, H.; Khani, M.R.; Razavi Rad, S.A.; Shokri, B. CO2 conversion in a dielectric barrier discharge plasma by argon dilution over MgO/HKUST-1 catalyst using response surface methodology. Heliyon 2024, 10, e26280. [Google Scholar] [CrossRef] [Scilit]
- Zhang, B.; Zuo, H.; Wu, B.; Kamiya, K.; Ma, L.; Kobayashi, N.; Ma, Y.; Jin, T.; Chen, Y. Recent progress in CO2 splitting processes with non-thermal plasma-assisted. J. Environ. Chem. Eng. 2024, 12, 114692. [Google Scholar] [CrossRef] [Scilit]
- Golubev, O.; Maximov, A. Hybrid Plasma-Catalytic CO2 Dissociation over Basic Metal Oxides Combined with CeO2. Processes 2023, 11, 1553. [Google Scholar] [CrossRef] [Scilit]
- Golubev, O.V.; Maximov, A.L. Dielectric barrier discharge plasma combined with Ce-Ni mesoporous catalysts for CO2 splitting to CO. Plasma Chem. Plasma Process. 2024, 44, 2087–2100. [Google Scholar] [CrossRef] [Scilit]
- Yang, C.; Lu, Y.; Zhang, L.; Kong, Z.; Yang, T.; Tao, L.; Zou, Y.; Wang, S. Defect Engineering on CeO2-Based Catalysts for Heterogeneous Catalytic Applications. Small Struct. 2021, 2, 2100058. [Google Scholar] [CrossRef] [Scilit]
- Ye, K.; Li, Y.; Yang, H.; Li, M.; Huang, Y.; Zhang, S.; Ji, H. An ultrathin carbon layer activated CeO2 heterojunction nanorods for photocatalytic degradation of organic pollutants. Appl. Catal. B Environ. 2019, 259, 118085. [Google Scholar] [CrossRef] [Scilit]
- Thommes, M.; Kaneko, K.; Neimark, A.V.; Olivier, J.P.; Rodriguez-Reinoso, F.; Rouquerol, J.; Sing, K.S.W. Physisorption of Gases, with Special Reference to the Evaluation of Surface Area and Pore Size Distribution (IUPAC Technical Report). Pure Appl. Chem. 2015, 87, 1051–1069. [Google Scholar] [CrossRef] [Scilit]
- Schlumberger, C.; Thommes, M. Characterization of Hierarchically Ordered Porous Materials by Physisorption and Mercury Porosimetry—A Tutorial Review. Adv. Mater. Interfaces 2021, 8, 2002181. [Google Scholar] [CrossRef] [Scilit]
- Groen, J.C.; Peffer, L.A.A.; Pérez-Ramírez, J. Pore size determination in modified micro- and mesoporous materials: Pitfalls and limitations in gas adsorption data analysis. Micropor. Mesopor. Mater. 2003, 60, 1–17. [Google Scholar] [CrossRef] [Scilit]
- Biganzoli, I.; Barni, R.; Gurioli, A.; Pertile, R.; Riccardi, C. Experimental investigation of Lissajous figure shapes in planar and surface dielectric barrier discharges. J. Phys. Conf. Ser. 2014, 550, 012039. [Google Scholar] [CrossRef] [Scilit]
- Mei, D.; Zhu, X.; He, Y.-L.; Yan, J.D.; Tu, X. Plasma-assisted conversion of CO2 in a dielectric barrier discharge reactor: Understanding the effect of packing materials. Plasma Sources Sci. Technol. 2015, 24, 015011. [Google Scholar] [CrossRef] [Scilit]
- Reyna-Martínez, R.; Narro-Céspedes, R.I.; Reyes-Acosta, Y.K.; Martínez-Luevanos, A.; Zugasti-Cruz, A.; Neira-Velázquez, M.G.; Sánchez-Valdés, S.; Soria-Arguello, G.; Ibarra-Alonso, M.C. Effect of thermal and argon plasma treatment in SiO2 spheres, assessing the effectiveness in the elimination of organic waste. Rev. Mex. Ing. Química 2020, 19, 1071–1080. [Google Scholar] [CrossRef] [Scilit]
- Yu, H.; Wang, X.; Shu, Z.; Fujii, M.; Song, C. Al2O3 and CeO2-promoted MgO sorbents for CO2 capture at moderate tempera-tures. Front. Chem. Sci. Eng. 2018, 12, 89–93. [Google Scholar] [CrossRef] [Scilit]
- Nelson, N.C.; Wang, Z.; Naik, P.; Manzano, J.S.; Pruski, M.; Slowing, I.I. Phosphate modified ceria as a Brønsted acidic/redox multifunctional catalyst. J. Mater. Chem. A 2017, 5, 4455–4466. [Google Scholar] [CrossRef] [Scilit]
- Madier, Y.; Descorme, C.; Le Govic, A.M.; Duprez, D. Oxygen mobility in CeO2 and CexZr(1−x)O2 compounds: Study by CO transient oxidation and 18O/16O isotopic exchange. J. Phys. Chem. B 1999, 103, 10999–11006. [Google Scholar] [CrossRef] [Scilit]
- Zhang, Y.; Wang, H.-Y.; Zhang, Y.-R.; Bogaerts, A. Formation of microdischarges inside a mesoporous catalyst in dielectric barrier discharge plasmas. Plasma Sources Sci. Technol. 2017, 26, 054002. [Google Scholar] [CrossRef] [Scilit]
- Rao, M.U.; Aduri, P.; Kaushik, A.; Kothari, D.; Baskaran, I. Basic metal oxide integrated DBD packed bed reactor for the decomposition of CO2. Chem. Eng. J. 2023, 468, 143671. [Google Scholar] [CrossRef] [Scilit]
- Ashford, B.; Wang, Y.; Poh, C.K.; Chen, L.; Tu, X. Plasma-catalytic conversion of CO2 to CO over binary metal oxide catalysts at low temperatures. Appl. Catal. B Environ. 2020, 276, 119110. [Google Scholar] [CrossRef] [Scilit]
- Umeojiakor, C.; Toghiani, H.; Xiang, Y. Enhancing CO2 conversion through plasma-catalytic synergy under subcooled conditions. Ind. Eng. Chem. Res. 2025, 64, 14869–14878. [Google Scholar] [CrossRef] [Scilit]
- Shaer, M.E.; Gabr, H.; Zaki, A.; Awad, M.; Ashraf, M.; Mobasher, M.; Phillips, A.; Afify, H. Discharge characteristics and ozone generation during CO2 to CO conversion by dielectric barrier discharge packed with TiO2-coated glass beads. Eur. Phys. J. D 2024, 78, 139. [Google Scholar] [CrossRef] [Scilit]
- Gabal, M.A.; Elroby, S.A.K.; Obaid, A.Y. Synthesis and characterization of nano-sized ceria powder via oxalate decomposition route. Powder Technol. 2012, 229, 112–118. [Google Scholar] [CrossRef] [Scilit]
- Marx, M.; Frauendorf, H.; Spannenberg, A.; Neumann, H.; Beller, M. Revisiting reduction of CO2 to oxalate with first-row transition metals: Irreproducibility, ambiguous analysis, and conflicting reactivity. JACS Au 2022, 2, 731–744. [Google Scholar] [CrossRef] [Scilit]
- Schuler, E.; Demetriou, M.; Shiju, N.R.; Gruter, G.-J. Towards sustainable oxalic acid from CO2 and biomass. ChemSusChem 2021, 14, 3636–3664. [Google Scholar] [CrossRef] [Scilit] [PubMed]
- Xu, Y.; Li, R. Template-free synthesis of mesoporous CeO2 powders by integrating bottom-up and top-down routes for acid orange 7 adsorption. RSC Adv. 2015, 5, 44828–44834. [Google Scholar] [CrossRef] [Scilit]
- Pan, C.; Zhang, D.; Shi, L. CTAB assisted hydrothermal synthesis, controlled conversion, and CO oxidation properties of CeO2 nanoplates, nanotubes, and nanorods. J. Solid State Chem. 2008, 181, 1298–1306. [Google Scholar] [CrossRef] [Scilit]
- Atran, A.A.; Ibrahim, F.A.; Awwad, N.S.; Shkir, M.; Hamdy, M.S. Facial One-Pot Synthesis, Characterization, and Photocatalytic Performance of Porous Ceria. Catalysts 2023, 13, 240. [Google Scholar] [CrossRef] [Scilit]
- Kamimura, Y.; Shimomura, M.; Endo, A. Simple template-free synthesis of high surface area mesoporous ceria and its new use as a potential adsorbent for carbon dioxide capture. J. Colloid Interface Sci. 2014, 436, 52–62. [Google Scholar] [CrossRef] [Scilit]
- Singh, K.; Srivastava, S.; Pandey, N.K.; Awasthi, R.R. Determination of Structural Elements of Hydrothermally Synthesized CeO2 Nanoparticles by Monshi, Williamson–Hall, Halder–Wagner, and Size–Strain Plot Methods, and Effect of Annealing Temperature. Macromol. Symp. 2024, 413, 2400104. [Google Scholar] [CrossRef] [Scilit]
- Holub, M. On the measurement of plasma power in atmospheric pressure DBD plasma reactors. Int. J. Appl. Electromagn. Mech. 2012, 39, 81–87. [Google Scholar] [CrossRef] [Scilit]

Disclaimer/Publisher’s Note: The statements, opinions and data contained in all publications are solely those of the individual author(s) and contributor(s) and not of MDPI and/or the editor(s). MDPI and/or the editor(s) disclaim responsibility for any injury to people or property resulting from any ideas, methods, instructions or products referred to in the content. |
© 2025 by the authors. Licensee MDPI, Basel, Switzerland. This article is an open access article distributed under the terms and conditions of the Creative Commons Attribution (CC BY) license (https://creativecommons.org/licenses/by/4.0/).