


Abstract
The aim of this publication is to present rapid screening methods (visual/colorimetric) that will enable quick identification of the presence of biologically active compounds in aqueous solutions. For this reason, 26 plant extracts obtained by ultrasound-assisted extraction were analysed for the content of these compounds. Higher plants, used as a raw material for extraction, are common in Europe and are easily available. The article proposes a comparison of various protocols for the identification of various compounds, e.g., phenolic compounds (phenols, tannins, anthocyanins, coumarins, flavones, flavonoids), vitamin C, quinones, quinines, resins, glycosides, sugars. Initial characterisation of the composition of plant extracts using fast and inexpensive methods allows you to avoid the use of time-consuming analyses with the use of advanced research equipment. In addition, the antioxidant activity of plant extracts using spectrophotometric methods (DPPH, ABTS, FRAP assay) and quantitative analysis of plant hormones such as abscisic acid, benzoic acid, gibberellic acid, indole acetic acid, jasmonic acid, salicylic acid, zeatin, zeatin riboside, and isipentenyl adenine was performed. The obtained results prove that the applied visual methods show different sensitivity in detecting the sought chemical compounds. Therefore, it is necessary to confirm the presence or absence of bioactive substances and their concentration using modern analytical methods.
1. Introduction
Plants were used as a primary raw material for medical therapies until the invention of synthetic drugs in the 19th century [1,2,3,4,5]. Plants are a notable source of natural chemicals, with various structural and biological features that exhibit multifarious mechanisms of action [6,7,8]. The various plant species contain myriad secondary metabolites (substances produced by cells through the metabolic pathway) that greatly influence their competitiveness in the environment and protection against adverse growth conditions [7,9,10,11]. These substances are also known to exhibit a great value for humans [8,12]. The plant-based bioactive compounds can be classified according to biological pathways and chemical classes, among which main chemical groups can be distinguished, such as: alkaloids, furanocoumarins, glycosides (anthraquinone glycosides, cardiac glycosides, cyanogenic glycosides, glucosinolates, and saponins), lignans, naphthodianthrones, peptides, phenolic compounds (anthocyanins, flavonoids, hydroxycinnamic and phenolic acids, and stilbenes), phenylpropanoids, proteins, tannins (condensed tannins—polymers of flavonoids, hydrolysable tannins—polymers of a monosaccharide core with several catechin derivatives attached), mono-, di-, and sesquiterpenoids, and resins [2,6,9,11,12,13,14,15]. In particular, the development of natural products containing substances isolated from natural origin has increased in recent years due to their high efficacy, safety, and long-term health effects [3,5,12,16,17,18,19]. They have been applied in many fields, including beverages, cosmetics, dyeing, flavouring, fragrances, medicine (e.g., steroids and alkaloids), nutrition and functional foods (e.g., sterols and stanols as cholesterol-lowering ingredients), repellents, smoking, and other industrial purposes [1,8,10,11,12,18,20]. However, to source these valuable components, which can occur in small quantities, it is crucial to employ the appropriate extraction, purification, and separation methods [7,8]. Generally, isolation is carried out in accordance with widely recognised techniques concerning complete extraction (e.g., maceration, steam- or hydro-distillation, pressing, boiling, infusion, percolation, Soxhlet extraction, microwave-assisted extraction (MAE), ultrasound-assisted extraction (UAE), accelerated solvent extraction (ASE), supercritical fluid extraction (SFE), pressurised fluid extraction (PFE), enzyme-assisted extraction (EAE), subcritical water extraction (SWE), ionic liquid extraction (ILE), pulse electric field extraction (PEFE)), preferably with nontoxic solvents (e.g., water, carbon dioxide, ethanol, ionic liquids) [7,8,10,11,12,19,20,21,22]. The biomass extract preparation includes general pre-treatment (e.g., liquid-liquid extraction, solid-phase extraction, gel filtration) and pre-concentration (e.g., gel filtration, solid-phase extraction, molecularly imprinted polymers, microporous absorption resin) [7,23,24]. Depending on the intended application of the obtained extracts, the biological assays (e.g., antibacterial, antifungal) can also be performed [7,25,26]. The activity-oriented separation (off-line: e.g., preparative scale bioguided fractionation, HPLC micro-fractionation; on-line: e.g., HPLC post-column (bio)chemical detection, biochromatography, electrophoretic enzyme assays) could also be considered. The final step to obtain phytocomplex or single molecules is the structure elucidation by means of off-line methods (e.g., UV-DAD, MS, NMR) or hyphenated techniques (e.g., HPLC-UV-DAD, HPLC-MS, GC-MS, HPLC-SPE-NMR, UPLC-DAD-TOF-MS) [7,27,28,29]. The technical and economic viability of any extraction and purification process should be evaluated in order to select production processes, marketing strategies, and remunerativeness [19].
The impressive contribution of plant-based extracts to virtually all aspects of human life has promoted their use to an increasing extent. For this reason, it is crucial to accelerate and reduce the cost of the production of new and innovative bioproducts and solutions. In view of the fact that the extraction process is a crucial first step in the development of new formulations, the research within this article has been designed to present the methods that could be used as a primary screening when no data are available on the chemical composition of examined extracts to evaluate the efficiency of the extraction techniques, to ensure that the active ingredients were not destroyed during preparation, and thus to reduce the time and costs of further purification of the obtained natural products. The choice of our examined plants was based on the ease and economic acquisition of raw materials (plants commonly found in the natural environment) and richness of active compounds that may be found in them. A total of 26 different extracts were tested for the content of phenolic compounds (phenols, tannins, anthocyanins, coumarins, flavones, flavonoids), vitamin C, quinones, quinines, resins, glycosides, sugars, antioxidant activity, and plant hormones. In most of the analyses, basic qualitative methods were used to provide a quick answer regarding the content of specific active compounds. The extracts were produced by means of ultrasound-assisted extraction, which is considered as a more environmentally friendly technique while allowing the extraction of bioactive compounds on a larger scale.
The aim of the publication was a comprehensive characterisation of plant extracts obtained from a number of higher plants. A given compound was determined using a series of methods, due to which it was possible to select visual protocols, the most sensitive ones indicating the presence of the given compound in the extract.
2. Results
The tested methods allowed rapid identification of the presence or absence of bioactives in the extract; however, in order to determine the exact amount of tested compounds, it is necessary to use more sophisticated analytical methods.
Throughout the paper, the following abbreviations were used for the particular extract: Alv L (solution/extract prepared based on aloe leaves), Am Fr (black chokeberry fruits), Arv H (common mugwort herb), Bv R (beetroot roots), Co F (common marigold flowers), Ea H (field horsetail herb), Ep F (purple coneflower flowers), Ep L (purple coneflower leaves), Hp H (St. John’s wort herb), Hr Fr (sea-buckthorn fruits), Lc S (red lentil seeds), Mc F (chamomile flowers), Ob H (basil herb), Pm H (broadleaf plantain herb), Poa H (common knotgrass herb), Ps S (pea seeds), Pta L (common bracken leaves), Sg L (giant goldenrod leaves), So R (comfrey roots), To F (common dandelion flowers), To L (common dandelion leaves), To R (common dandelion roots), Tp F (red clover flowers), Ur L (nettle leaves), Ur R (nettle roots), Vo R (valerian roots). In order to better visualise the obtained effects, the tables also show the tube with the extract before treatment (always the first on the left). The changes were usually observable immediately (up to 5 min) after following the appropriate procedures.
2.1. Phenolic Compounds (Total Phenolic Compounds, Tannins, Anthocyanins, Coumarins, Flavones, Flavonoids)
Several protocols for rapid phytochemical screening can be used to determine the presence of bioactive compounds in the examined samples. According to the literature, to assess the prevalence of phenolic compounds the ferric chloride test can be implemented. Authors who used this method found that these compounds were present after the appearance of a dark green [30,31,32], deep blue [31], violet [33], bluish black [34,35,36], or bluish-green [36] colour. Similar results were presented by other researchers who stated that violet [37], blue or green [38], or deep blue or black colour [39] indicates the presence of phenols. The second method, the lead acetate test, is also widely applied to detect these compounds in samples. Their presence can be confirmed when white precipitate is developed [31,40]. However, it is worth mentioning that the lead acetate test reveals very little helpful information and has the drawback of involving the heavy metal, lead, which creates environmental disposal problems. As a third method, the zinc hydrochloride test can be deployed—the appearance of yellow or orange colour after a few minutes proves the presence of phenols [37]. In another method, the Shinoda test, a yellow or orange colour demonstrates their existence [37]. The total phenolic content can be quantified using the Folin–Ciocalteu test, and when the bluish colour occurs it confirms the presence of phenolic compounds and their concentrations are verified by measuring the absorbance of the solutions [41].
The formation of green-blue [39], violet or blackish red [33,37] colouration in the ferric chloride test [39]; the yellow precipitate in the lead acetate test [31,37,39,42,43]; a red or magenta colour in the zinc hydrochloride test [37]; or a pink scarlet, green to blue, or crimson red colour emerging within minutes in the Shinoda test indicates flavonoids [31,33,36,37,43]. In the alkaline reagent test, the addition of sodium hydroxide solution causes an intense yellow colour which changes to colourless after the addition of hydrochloric acid, which may also suggest their presence [30,34,37]. In the aluminium chloride test, if the addition of aluminium chloride solution induces the light-yellow colour, the existence of flavonoid is observed. The addition of sodium hydroxide and hydrochloric acid makes the solution colourless, which also confirms their presence [32,39]. Among other methods used to identify these compounds, the ammonium test (a yellow colour at the ammonia layer [37,39]), the ammonia and sulphuric acid test (a yellow colour [30]), and the Millon’s test (a white precipitate which turns to red after gentle heating [37]) can be mentioned. Photos of the Millon’s test are presented in our previous article, where we conducted the analyses of proteins [44].
The ferric chloride test is likewise used for the analysis of tannins. Their presence can be confirmed when the formation of a greenish black precipitate [38,39,40,42,43,45] or a green, violet [37], or dark blue [33,38] colour is observed. Other authors have stated that the greater addition of ferric chloride changes the blue or greenish black colour to olive green [46]. The occurrence of a blackish blue colour indicates the presence of gallic tannins and a green-blackish colour shows the presence of catechol tannins [47]. The yellow [34,37,45,48] or white coloured precipitate in the lead acetate test [42,43] or a yellow to red precipitate in the alkaline reagent test may indicate the presence of tannins in the solution [37]. These compounds can also be detected in samples using other tests, among others: gelatin test (the white precipitate [37]), potassium dichromate test (the yellowish brown colour precipitate) [45], HCl test (the red coloured precipitate—phlobatannins [34,38,39,47]), and bromine water test (the buff coloured precipitate—condensed tannins; no precipitate—hydrolysable tannins [49]).
The sodium hydroxide test is employed in the analysis of anthocyanins (a blue-green colour [39]) and coumarins and flavones (a yellow colour [33,34,38,42]). In the sulphuric acid test, the yellowish orange colour indicates flavones [40] or anthocyanins, orange to crimson indicates flavonones, and yellow to orange colour indicates flavones [37].
The bromine water test can be used to detect the presence of glycosides (a yellow precipitate develops [37]) and carbohydrates (the solution discolours (by aldose)) [37]).
In the case of our results, the ferric chloride test clearly identified the presence of phenolic compounds in the following extracts: Am Fr, Ea H, Ep F, Ep L, Hr Fr, Pm H, Poa H, To F, To L, Tp F, Ur L. The colour of the extracts changed into a uniform dark green colour, without precipitation or turbidity of the solution (Table 1). Quantitative analysis of total polyphenol content, with the use of the Folin–Ciocalteu test, confirmed that qualitative methods show different sensitivities—indicating the presence of TPC in extracts that contain a great as well as a low amount of them but do not show their content even although these compounds are present. The highest levels of TPC could be found in Ep F, Pta L, and Ep L (3.2–2.2 mg·mL−1) and the lowest in Ps S, Ur R, Ur L, Lc S, and To R (0.07–0.18 mg·mL−1) (Table 1). The appearance of a white precipitate in the lead acetate test indicates the presence of phenols—Table 2. This was observed with the following extracts: Alv L, Bv R, Mc F, Ob H, Pm H, Ur R. White precipitation can also indicate the presence of tannins. Evident yellow/orange colour of the solution, which is typical for the presence of phenols in the zinc hydrochloride test, was observed in the extract Bv R, Co F, Ep F, Ep L, Sg L, Tp F, Ur L, Ur R, Vo R (Table 2). The results for the Shinoda test in most cases coincide with the results for the zinc hydrochloride test, used to detect phenols in plant extracts (Table 2).
Table 1.
The results of ferric chloride test and Folin–Ciocalteu test (PC—phenolic compounds, TN—tannins, FD—flavonoids).
Table 2.
The results of lead acetate test, zinc hydrochloride test, and Shinoda test (PC—phenolic compounds, TN—tannins, FD—flavonoids).
The ferric chloride test was inconclusive in the determination of flavonoids in the extracts (Table 1). According to literature data, the appearance of a green-blue colour may indicate the presence of flavonoids [39]. No such change was observed for any of the tested extracts. The potential presence of flavonoids in the extract should be confirmed by another method. The Millon’s test (vide Table 4 in the work of Godlewska et al. [44]) revealed that the formation of precipitation, which could be considered as a positive result for the presence of flavonoids, occurred only in tubes with Co F (before boiling (1) an orange-brown precipitation formed, while after boiling (2) a white precipitation formed), EP F ((1) a brown precipitate, (2) a red precipitate), Lc S ((1) a white precipitate, (2) a white precipitate), Ps S ((1) a yellowish precipitate, (2) a white precipitate), So R ((1) a brown precipitate, (2) a brick-red precipitate). Yellow precipitation in the lead acetate test typical to tannins and flavonoids present in extracts was detected for Arv H, Co F, Ea H, Poa H, Pta L, To F, To L, To R, Vo R (Table 2). The colour change of the extract in the zinc hydrochloride test to red/magenta, indicating the presence of flavonoids, performed with the same test, was observed only for the extract Am Fr (Table 2). The presence of flavonoids detected by the Shinoda test was in the following extracts: Am Fr, Bv R, Ep F, Hr Fr, Lc S, Ps S, Tp F. The Shinoda test was more effective in detecting flavonoids in plant extracts than the zinc hydrochloride test (Table 2). The use of the alkaline reagent test did not allow the detection of flavonoids in plant extracts (Table 3). The ammonium test did not give a clear answer as to the content of flavonoids (Table 6). The unequivocal yellow colour, which indicates the presence of flavonoids in plant extracts, was observed only for Hr Fr, Poa H, and To R. A yellow colour, which indicates the presence of flavonoids in extracts using the ammonia and H2SO4 test, was observed for Co F, Ea H, Hr Fr, Mc F, To F, To R, and Tp F. After applying the ammonium chloride test, discoloration of the solution to some degree could be observed in most cases (with the exception of Am Fr).
Table 3.
The results of gelatin test, alkaline reagent test, and bromine water test (TN—tannins, FD—flavonoids, GS—glycosides, SG—sugars).
In the case of tannin identification using the ferric chloride test, in addition to the greenish-black colour, which is typical for phenolic compounds, a precipitate was also observed, especially in the following extracts: Arv H, Bv R, Hp H, Mc F, Ob H, Pta L, Sg L, So R, Vo R (Table 1). In the case of the determination of tannins by the gelatin test, a change in the colour of the extract was mainly observed, and not the formation of a characteristic white precipitate (Table 3). This has been seen with the following extracts: Hp H, Lc S, and Ps S. A yellow to red precipitate indicating the presence of tannins in the plant extracts (alkaline reagent test) was present only in a few extracts: Ea H, Lc S, Pta L, To F, and Ur L (Table 3). Using the bromine water test, no tannins were detected in most botanical extracts (Table 3). The use of the potassium dichromate test did not allow the detection of tannins in plant extracts (Table 4). For this reason, the dichromate test for identifying tannins is not recommended, as it has given all negative results, and additionally dichromate poses a disposal issues. Furthermore, the bromine water test very rarely gave positive outcome for any class of compound and could easily be recommended not to be used. The characteristic yellowish-brown precipitate was not observed. A similar situation occurred in the case of detecting tannins (phlobatannins) with the HCl test. Dark (red) colour precipitate was observed only in the following extracts: So R and Vo R (Table 4).
Table 4.
The results of potassium dichromate test and HCl test (TN—tannins).
Using the NaOH test, the presence of anthocyanins was not detected in the botanical extracts (Table 5). In none of the cases was the colour of the extract blue-green. The appearance of a yellow colour in the extract during this test indicates the presence of coumarins and flavones. Such a colour was unequivocally observed in the extracts Hr Fr, Mc F, Poa H, and To R. The H2SO4 test in many cases did not give a clear answer as to the presence of anthocyanins and flavones in plant extracts. A stable yellowish-orange colour that indicated the presence of flavones and anthocyanins was observed for Alv L, Am Fr, Hp H, Poa H, Pta L, Tp F, Ur L.
Table 5.
The results of NaOH test and H2SO4 test (AC—anthocyanins, CM—coumarins, FL—flavones).
2.2. Vitamin C
In the DNPH test (2,4-dinitrophenylhydrazine), the formation of yellow precipitate indicates the presence of vitamin C [34]. The presence of vitamin C, using the DNPH test, was observed only for Lc S and Ps S extracts (Table 6).
Table 6.
The results of aluminium chloride test, ammonium test, ammonia and H2SO4 test, and DNPH tests (FD—flavonoids, VC—Vitamin C).
2.3. Quinones, Quinines, Resin
The literature shows that the sulphuric acid test (the appearance of red colour) [38,42,43], the hydrochloric acid test (the formation of yellow precipitation) [34,37], and the ammonia test (a pink coloured precipitate) [38] can be applied to detect the presence of quinones/anthraquinones. In the sodium hydroxide test, a deep colouration (e.g., purple, red) can be attributed to the presence of quinine [33]. Furthermore, in the acetone test, a turbid solution implies the presence of resin [33].
The application of the H2SO4 test, HCl test, ammonia test, and NaOH test did not allow the detection of quinones and quinines in plant extracts (Table 7).
Table 7.
The results of H2SO4 test, HCl test, ammonia test, NaOH test (QNO—quinones, QNI—quinines).
The acetone test was used to detect resins in plant extracts. Their presence (turbidity of the solution) was confirmed in the following extracts: Alv L, Am Fr, Arv H, Co F, Ea H, Lc S, Ob H, Pm H, Ps S, Pta L, Sg L, So R, To F, Ur R, and Vo R.
2.4. Glycosides
Glycosides can be found in samples using a number of rapid approaches. Authors who used the Keller–Killiani test showed that the presence of brown [36,38,42,43] or a reddish-brown ring at the junction of two layers [45] indicates the appearance of cardiac glycosides. Other authors stated that cardiac glycosides are present in sample when the colour of the acidic layer above the ring changes to bluish green [37,45] or greenish [36] and the lower layer to reddish brown [37] or violet [36]. In the Baljet test, the yellow to orange colour exhibits the occurrence of cardiac glycosides [37]. In the Borntrager’s tests (1), the anthraquinone glycosides can be found in samples when the ammoniacal (lower) layer shows a rose, pink, or red colour [37,39,42,43,50]. In the modified Borntrager’s tests (2), the pink colour indicates the presence of glycosides [32,38]. In the sulphuric acid test, the appearance of reddish precipitate indicates the presence of glycosides [40]. Photos are available in our previous article, in analyses of protein content (vide Table 4 in the work of Godlewska et al. [44]). The Molisch test can also be used as another method. In this protocol, the formation of a reddish-violet ring at the junction of two layers confirms the presence of glycosides [40]. The next method is Liebermann’s test, in which the appearance of a colour from violet through blue to green suggests the presence of glycosides [34]. Photos are presented in our previous article (vide Table 5 in the work of Godlewska et al. [44]).
No glycosides were detected in most botanical extracts using the bromine water test (Table 3). The use of the Baljet test did not show the presence of cardiac glycosides in most of the extracts tested (Table 8). Molisch’s test can be used to quickly screen extracts for the content of glycosides and sugars. The appearance of a reddish-violet ring at the junction of two liquids was easily visible in many botanical extracts (Table 9). The Borntrager test (2) was not effective in the detection of glycosides as well as sugars, and neither was the Borntrager test (1) in the detection of cyanogenic glycosides in the tested plant extracts. In all tubes subjected to the Liebermann’s test, no violet or blue colour was observed, which could likewise indicate the presence of these compounds. Extracts that may be considered to contain glycosides to some extent due to the greenish colour are Ep L and Mc F.
Table 8.
The presence of cardiac glycosides and resin in botanical extracts—Baljet test and acetone test.
Table 9.
The presence of glycosides in botanical extracts—Keller–Killiani test, Borntrager’s tests (1), Borntrager’s tests (2), Molisch’s test (additionally: sugars) (GS—glycosides, CGS—cardiac glycosides, CYGS—cyanogenic glycosides, SG—sugars).
2.5. Sugars
Various protocols can be used to detect the presence of sugars. One of them is the Fehling’s test. The simple (reducing) sugars are present in samples when first a yellow, then a brick red precipitate is noted [31,33,37,39,42,43,45,47]. The next one is Benedict’s test—when the solution turns green [42,43] or red [31,40], or if the reddish-brown precipitate forms [33] it might suggest the presence of carbohydrates/reducing sugars. In the Molisch’s test, the appearance of a purple or reddish colour [38,47] or purple [30,34,37,40,45] or red brown [31,40,45] coloured ring at the junction of the two liquids shows the occurrence of carbohydrates. Additionally, the Borntrager’s test can also be applied, and when a change in colour of the ammonia layer is observed it indicates the presence of carbohydrates [37]. In the Selwinoff’s test, a red colouration implies fructose content in the solution [37], while in the Barfoed’s test, the formation of red precipitation reveals the presence of monosaccharaides [47].
The deployment of the bromine water test did not allow the determination of sugars in most botanical extracts (Table 3). No yellow/red precipitate was observed after using Fehling’s test, indicating the presence of sugars in the extracts (Table 10). Benedict’s test showed a clear change in the colour of the extract to green and the formation of a red-brown precipitate, which indicated the presence of sugars (reducing sugars) in almost all extracts tested. Selwinoff’s test gives a red coloured compound when linked with resorcinol. The colour of the extracts changed to red for Am Fr, Bv R, and Hp H. The red precipitate is the result of the Barfoed test, which indicates the presence of simple sugars and was observed in the following extracts: Arv H, Pta L, and To R.
Table 10.
The presence of sugars in botanical extracts—Fehling’s test, Benedict’s test, Selwinoff’s test, Barfoed’s test (SG—sugars).
2.6. Antioxidant Activity
Plant-derived extracts possessed varied antioxidant activity (Table 11). The analysis conducted using the DPPH assay showed that the highest radical scavenging potential demonstrated the following extracts: Pta L, Hp H, Ep F, Am Fr, Sg L, To L, and Ob H (9.57–2.48 µM Trolox·mL−1) and the lowest: Lc S, Ur L, Ur R, and Ps S (0.14–0.15 µM Trolox·mL−1). The greatest DPPH inhibition ratio showed extracts based on Pm H, Hr Fr, and Arv H (31.58–28.12%), while the smallest were based on Lc S, Ur L, Ps S, Ur R, and Ep L (2.00–2.37%). On the other hand, the relative ability of the antioxidants present in bioproducts to scavenge the ABTS free radicals was the strongest in Ep L, Ep F, Hp H, Am Fr, To L, Poa H, and Pta L (19.00–6.33 µM Trolox·mL−1), and the weakest in To R, Alv L, Ur L, Ea H, Hr Fr, and Lc S (0.81–1.90 µM Trolox·mL−1). The ABTS inhibition ratio was the highest for Poa H (5.37%) and So R (4.47%) and the lowest for Ob H, Sg L, and Pta L (0.34–0.54%). The most effective scavenging of the FRAP radical exhibited compounds present in extracts Pta L, Ep L, Ep F, Ob H, Sg L, Hp H, and Am Fr (20.25–8.73 µM Trolox·mL−1), while the least were in Lc S, Ps S, Ur R, To R, Ur L, and Alv L (0.40–1.38 µM Trolox·mL−1).
Table 11.
The antioxidant activity of botanical extracts—DPPH assay, ABTS assay, FRAP assay.
2.7. Plant Hormones
Of the seven plant hormones analysed (Table 12), gibberellic acid (GA3) was present in extracts in the highest amounts, especially in Sg L, Ur R, Pm H, To R, Ur L, and Ep F (359–319 μg∙mL−1). The following bioproducts, Arv H, Pta L, Hr Fr, Hp H, and Tp F (29.07–76.90 μg∙mL−1), contained the lowest amounts of GA3. The indole acetic acid (IAA) occurred in high levels in Ps S, Pm H, Ep F, To R, and Hr Fr (2.71–1.93 μg∙mL−1), while there were trace amounts in Arv H and Pta L. However, Arv H along with Hp H, Ob H, Ep F, Tp F, and Mc F (1.0–1.5 μg∙mL−1) contained the highest quantity of abscisic acid (ABA), whereas the amount of ABA in Am Fr, Ea H, Hr Fr, Lc S, Poa H, Ps S, Pta L, Ur L, and Ur R was at levels below detection. The concentration of benzoic acid (BA) was the highest in To R, To L, Ob H, and Pm H (0.48–0.28 μg∙mL−1), while it was present in trace amounts in Co F, Ea H, Hp H, Hr Fr, Poa H, Sg L, Ur L, and Ur R. Jasmonic acid (JA), salicylic acid (SA), and zeatin (Z) were present in trace amounts in most extracts. The quantity of SA was the highest in Lc S, Ea H, and Poa H (0.15–0.11 μg∙mL−1), while Z was highest in To F, So R, and To L (21.0–17.0 μg∙mL−1).
Table 12.
The presence of plant hormones in botanical extracts (μg∙mL−1).
3. Discussion
Phenolic compounds (PCs) have well-documented beneficial effects on human health and exhibit antioxidant, anti-inflammatory, antimicrobial, antiviral, antitumoral, antidiabetic, anti-obesity, antiallergic, anti-lipidemic, antiproliferative, neuroprotective, and cardioprotective activities [51,52]. The main PCs include phenolic acids, flavonoids (flavonols, flavones, flavanones, flavanols, isoflavonoids, anthocyanins), tannins, stilbenes, and lignans [51,52,53,54]. These compounds are used in various industries, including food, nutraceutical, cosmetic, packaging, textile, pharmacy, and medicine [52,55,56,57].
Among the rapid, qualitative methods used to assess the presence of phenolic compounds can be mentioned ferric chloride test, lead acetate test, zinc hydrochloride test, Shinoda test, gelatin test, alkaline reagent test, bromine water test, potassium dichromate test, HCl test, NaOH test, H2SO4 test, aluminium chloride test, ammonium test, ammonia and H2SO4 test. By comparing these results with quantitative analysis data obtained with the use of the Folin–Ciocalteu test, it can be noted that qualitative tests vary significantly in sensitivity in detecting the targeted bioactive compounds. This assay is widely used to assess TPC in foods; however, it is not specific for their determinations and is highly dependent on the composition of the matrix, which can vary in terms of the types phenolics and the amount of particular compounds. For instance, reducing sugars or vitamin C may hamper the accuracy of this assay [58,59]. The Folin–Ciocalteu test showed that all extracts contained phenolic compounds in the range of 0.07 mg·mL−1 (Ps S) to 3.17 mg·mL−1 (Ep F). It can also be seen that the extracts prepared from Lc S and Ps S contained one of the lowest TPC contents despite the content of the vitamin C (the content of reducing sugars was not found). In contrast, the content of reducing sugars in extracts containing the highest amount of TPC, namely Ep L and Pta L, was confirmed in only one or two cases, respectively (the presence of vitamin C was not found). The point-biserial Correlation results for the comparison of methods used to detect phenolic compounds (PC) are included in Table S1. The analysis takes into account quantitative variable (Folin–Ciocalteu test results) and nominal variable (presence and absence of PC marked by plus or minus sign). There are two cases considered, depending on how to define the “−/+” sign: (a) treated as “+” (rpb+), (b) as “−“ (rpb−). The values of the point-biserial correlation coefficient rpb+ show that there is a positive, medium strength correlation for the Ferric chloride test, and a positive, low strength correlation for the Zinc hydrochloride test. When the rpb− coefficient is investigated, the findings indicate a similar pattern, with the difference that the Shinoda test is characterised by a positive, low strength correlation.
The ferric chloride test allowed detection of the presence of PC only in four extracts (Ep F, Ep L, To L, Am Fr) out of nine, with the highest concentration ranging from 3.17 mg·mL−1 to 1.0 mg·mL−1. Meanwhile, this test confirmed their presence in extracts that contained lower levels of them; for example, Ur L (0.13 mg·mL−1), Poa H (0.36 mg·mL−1), and Ea H (0.42 mg·mL−1). This assay was also appropriate for the determination of tannins in the following extracts: Arv H, Bv R, Hp H, Mc F, Ob H, Pta L, Sg L, So R, andVo R, but was ambiguous in the determination of flavonoids. The Acetate test allowed detection of phenols in Alv L, Bv R, Mc F, Ob H, Pm H, andUr R, as well as tannins and flavonoids in Arv H, Co F, Ea H, Poa H, Pta L, To F, To L, To R, and Vo R. The zinc hydrochloride test confirmed the presence of phenols in Bv R, Co F, Ep F, Ep L, Sg L, Tp F, Ur L, Ur R, and Vo R, and flavonoids in Am Fr. The results of the presence of phenols with the use of the Shinoda test in most cases coincide with the results for the zinc hydrochloride test, while the presence of flavonoids was verified in Am Fr, Bv R, Ep F, Hr Fr, Lc S, Ps S, and Tp F. However, the alkaline reagent test did not detect flavonoids in plant extracts. The Millon’s test can also be used to determine flavonoids, and in our extracts they were detected in Co F, EP F, Lc S, Ps S, and So R. The presence of tannins can be indicated using the gelatin test (positive for Hp H, Lc S, and Ps S), the alkaline reagent test (positive for Ea H, Lc S, Pta L, To F, and Ur L), and the HCl test (phlobatannins) (positive for So R and Vo R). However, the use of the bromine water test and the potassium dichromate test did not allow the detection of these compounds.
The NaOH test did not prove to be effective in the determination of anthocyanins, but it enabled the identification of coumarins and flavones (positive for Hr Fr, Mc F, Poa H, and To R). The H2SO4 test in many cases did not give a clear answer as to the presence of anthocyanins and flavones in plant extracts (positive for Alv L, Am Fr, Hp H, Poa H, Pta L, Tp F, and Ur L). Comparing both NaOH and H2SO4 tests for detecting anthocyanins and flavones, the latter seems to be more sensitive, but the presence of these active compounds in plant extracts was confirmed in most cases by both tests. The ammonium test did not give a clear answer as to the content of flavonoids (positive for Hr Fr, Poa H, and To R). The ammonia and H2SO4 test seems to be more precise in the detection of flavonoids in plant extracts than the ammonium test. The ammonia and H2SO4 test indicated the presence of flavonoids in Co F, Ea H, Hr Fr, Mc F, To F, To R, and Tp F. The ammonium chloride test showed that most extracts contained flavonoids (with the exception of Am Fr). The comparison of sensitivity of applied methods for the detection of polyphenolic compounds has been included in Supplementary Materials (Tables S1–S4). Among the examined tests for the presence of phenolic compounds in plant extracts, the most sensitive test was the ferric chloride test. The visual results largely coincide with the total polyphenol content, determined by the Folin–Ciocalteu test (Table S1). Failure to detect phenolic compounds with the ferric chloride test coincided with a very low concentration of these compounds in the extract using the spectrophotometric technique (Folin–Ciocalteu reagent). Phenolic compounds are common in plants and are easily extracted using water as a solvent. Based on the studies carried out, the ferric chloride test can also be recommended for the detection of tannins in plant extracts (Table S2). For the detection of flavonoids in plant extracts, many tests (aluminium chloride test, ammonium test, ammonia and H2SO4 test) gave inconclusive results. To the greatest extent, the results obtained for these tests coincided with the detection of flavonoids using the lead acetate test, which can be used as the first to screen plant extracts for the presence of flavonoids (Table S3). In the case of detecting anthocyanins in plant extracts, the NaOH test turned out to be useless—these compounds were not detected in any of the extracts tested. However, for their initial detection in extracts, the H2SO4 test can be used. The same applies to the screening of extracts for the presence of flavones. The H2SO4 test was more sensitive than the NaOH test (Table S4).
Vitamin C, an omnipresent plant and animal metabolite [60], exhibits multifarious biological and pharmaceutical functions [61]. It is crucial in the prevention of scurvy [60]; helps to lower blood cholesterol [62]; and is necessary for collagen, carnitine, and neurotransmitters biosynthesis [63,64]. It supports detoxification, assists the adequate function of the immune system, and is involved in the primary prevention of commonly encountered diseases, including diabetes, eye diseases, atherosclerosis [63] cardiovascular disease, and cancer [60]. In view of the fact that this vitamin is not synthesized by the human body, it has to be provided with diet [62]. Vitamin C is extensively utilised in the feed, food, and pharmaceutical industry as a nutritional supplement and preservative [61,65]. In our analysis, the DNPH test allowed detection of its presence only in Lc S and Ps S extracts. The study of this molecule is greatly handicapped by its oxidation under exposure to air, light, and heat.
Quinine, a cinchona alkaloid, belongs to the aryl amino alcohol group of drugs. It has played an invaluable role in the treatment of malaria since the 18th century and still plays a key role in the treatment of this disease. In turn, quinones, a class of compounds containing a benzene ring with a carbonyl group [66], are used in industry as oxidants, dehydrating agents [67], and dyes [68]. The analysis using the H2SO4 test, HCl test, ammonia test, and NaOH test did not confirm the presence of the tested compounds in any of the obtained extracts. The comparison of methods used to detect of quinones are presented in Supplementary Materials (Table S5). Among the tests for the detection of quinones in plant extracts (H2SO4 test, HCl test, ammonia test), the HCl test was the most sensitive.
Plant resins are a complex mixture of specialised metabolites; for example, alkaloids, phenols, and terpenes [69,70,71,72] as well as alcohols, aldehydes, esters, and amorphous neutral substances [69]. Due to their diverse biological activities (e.g., antimicrobial, anti-inflammatory, antioxidant, anticancer, antiulcer, haemostatic, immunostimulant) [70,72,73,74,75,76], resins are used as a raw material in the medical and pharmaceutical industry [70,73] but also as fuel additives, paint thinners, rosin, and varnishes as well as components in polishes [69]. One of the fast tests to verify the presence of resins is the Acetone test. This assay confirmed their existence in the following extracts: Alv L, Am Fr, Arv H, Co F, Ea H, Lc S, Ob H, Pm H, Ps S, Pta L, Sg L, So R, To F, Ur R, and Vo R.
Another group of compounds examined as a part of this study were glycosides, which can be sourced from plant or animal origin [77,78]. Various types of glycosides can be distinguished: among others, triterpene, β-sitosterol, flavonoid, iridoid, phenylpropanoid, anthraquinone, kaempferol, and saponin. The biological activity is strongly related to their stereochemistry [77,79]. Glycosides have been recognized and utilised as alternative drugs in the treatment of various cancers and have other notable therapeutic potential and clinical utility [77,79,80]. For instance, flavonoid glycosides possess antioxidant, anti-inflammatory, anti-allergic, anti-microbial, and anti-cancer activities and thus find use in the prevention and management of diseases [78,79]. Cardiac glycosides are used for the treatment of cardiac arrhythmia, congestive heart failure, and atrial fibrillation; exhibit strong anticancer activity; and evoke cell proliferation or activation of cell death by apoptosis or autophagy [77,78,81,82]. Visualisation of the presence of glycosides can be conducted with the use of various methods. The Molisch’s test proved to be the most sensitive in detecting these compounds (positive for Alv L, Arv H, Co F, Ea H, Lc S, Mc F, Ob H, Poa H, Ps S, Sg L, So R, Tp F, Ur L, and Ur R). However, the Borntrager test (1), the Borntrager test (2), the Keller–Killiani test, the Baljet test, and the bromine water test did not provide reliable confirmation of the presence of glycosides in plant extracts. The use of the Liebermann’s test also did not assure a full clarity of their appearance. The extracts which could be to some extent considered as a glycoside containing are Ep L and Mc F. The summary of protocols used for the confirmation of the presence of glycosides can be found in Supplementary Materials (Table S6). For the detection of glycosides in plant extracts, Molisch’s test is undoubtedly recommended.
The principal source of sugars, the main products of photosynthesis [83,84,85], are beet and cane sugar, while other sources may include honey, corn syrup, fruits, and vegetables [86]. The most abundant free sugars found in plants are disaccharides (sucrose and maltose) and monosaccharides (glucose and fructose) [83,87]. These compounds are used in food products to provide sweetness and energy, but also play a key role in preservation, fermentation, colour, flavour, and texture [86,88,89]. The highest sensitivity in determining the presence of sugars showed the Benedict’s test (all extracts with the exception of Lc S and Ps S) and Molisch’s test (positive for Alv L, Arv H, Co F, Ea H, Lc S, Mc F, Ob H, Poa H, Ps S, Sg L, So R, Tp F, Ur L, and Ur R). Selwinoff’s test (positive for Am Fr, Bv R, and Hp H) and the Barfoed test (positive for Arv H, Pta L, and To R) proved to be less effective in the identification of carbohydrates. The use of Fehling’s test, the Borntrager test (2), and the bromine water test were not sensitive in the detection of sugars. The comparison of methods used for the detection of sugars has been included in Supplementary Materials (Table S7). Both Molisch’s test and Benedict’s test were effective in detecting sugars in the tested plant extracts.
Antioxidants, compounds able to prevent/inhibit/reduce oxidation processes [90,91], can be sourced from microorganisms, plants, and animal tissues [92]. The industry has utilised them to prevent metal corrosion and oxidative degradation of polymers (e.g., rubbers, plastics, and adhesives), but they have also found use as food preservatives (enrichment and inhibition of disruption, sourness, and colour change) [90,91,92,93], and as stabilisers in fuels and lubricants [91,93], but also in pharmacology, cosmetics, and medicine [92] (in the prevention of degenerative illnesses, e.g., cancers, cardiovascular, and neurological diseases, cataracts and oxidative stress dysfunctions) [93]. In recent years, due to their numerous biological activities (e.g., anti-aging and anti-inflammatory), the interest in the utilisation of antioxidants is rapidly growing [92]. The measurements of antioxidant activity with the use of three examined assays (DPPH, ABTS, and FRAP assays) revealed that Pta L, Hp H, Ep F, and Am Fr had the highest reducing power. Additionally, the greatest antioxidant activity was also noted for Sg L, Ob H (DPPH assay and FRAP assay), To L (DPPH assay and ABTS assay), and Ep L (ABTS assay and FRAP assay). The extract Poa H was characterised by one of the highest activities in the ABTS test, while in the DPPH test and FRAP test it was characterised by one of the lowest. The lowest reducing power was observed for Vo R, Ea H, Poa H, To R, Alv L, Ur R, Ps S, Ur L, and Lc S (all three assays) as well as for Ur R and Ps S (DPPH assay and FRAP assay). Therefore, it can be seen that despite the differences between these tests, the results obtained are relatively comparable.
Plant hormones, which can be found in plants, algae, and plant-associated bacteria and fungi, play a vital role in plant growth and development (e.g., promote fruit ripening and leaf drop, stimulate seed germination and gemmation, increase yield and resistance to adverse environmental conditions) [94,95,96,97]. The use of these compounds in agriculture and horticulture is of great importance, and since their first discovery and commercial availability, farmers have incorporated them into the crop production to improve numerous aspects of the cultivation processes [96,98,99]. The conducted studies proved that the obtained extracts could constitute a source of plant hormones, especially gibberellic acid (e.g., Ep F, Pm H, Sg L, To R, Ur L, Ur R).
4. Materials and Methods
4.1. Chemicals and Reagents
The following chemicals were used in this study: sodium carbonate (Sigma Aldrich, St. Louis, MI, USA), sodium hydroxide (Avantor, Radnor Township, PA, USA), sulphuric acid (Avantor), ammonium hydroxide (Supelco, Bellefonte, PA, USA), acetone (Stanlab, Lagos, Nigeria), chloroform (Avantor), acetic acid (Supelco), glacial acetic acid (Supelco), hydrochloric acid (Avantor), iron chloride (Sigma Aldrich), lead acetate (Sigma Aldrich), zinc dust (Roth), magnesium turnings (Sigma Aldrich), Folin–Ciocalteu’s phenol reagent (Sigma Aldrich), sodium carbonate (Sigma Aldrich), gelatin (Sigma Aldrich), sodium chloride (Sigma Aldrich), bromine water (Carlo Erba, Milan, Italy), potassium dichromate (Sigma Aldrich), aluminium chloride (Sigma Aldrich), 2,4-dinitrophenylhydrazine (PanReac AppliChem, Darmstadt, Germany), sodium picrate (Merck, Rahway, NJ, USA), Trolox (Sigma Aldrich), gallic acid (Sigma Aldrich), diphenyl−2-picrylhydrazyl (DPPH) (Sigma Aldrich), azino-bis−3-ethylbenzthiazoline6-sulphonic acid (ABTS) (Sigma Aldrich), tripyridyl-S-triazine (TPTZ) (Sigma Aldrich), ethanol (TH.GEYER, Höxter, Germany), methanol (TH.GEYER), mercuric nitrate (Sigma Aldrich), mercurous nitrate (Alfa Aesar, Haverhill, MA, USA), nitric acid (Merck), ammonia solution 25% (Supelco), α-naphthol (Carlo Erba), copper (II) sulphate (Sigma Aldrich), potassium tartrate (Sigma Aldrich), trisodium citrate dihydrate (Alfa Aesar), resorcinol (Sigma Aldrich), copper acetate (Roth), phytohormone standards Z, BA, JA, SA, ABA (Sigma-Aldrich), GA3, IAA (OlChemIm Ltd., Olomouc, Czech Republic), methanol (HPLC quality, Merck), acetonitrile (HPLC quality, Merck), and acetic acid (HPLC quality, Merck).
4.2. Plant Materials Used for the Production of Extracts
The main factors in the selection of raw materials were their prevalence in Europe, ease, and low cost of acquisition, as well as the content of biologically active compounds [44]. The biomasses were purchased (FLOS, Herbisarium) or collected from the natural environment (Wrocław, Poland). The harvesting time was adjusted to the level of biologically active components in the plants (based on literature data). The list of plants (with abbreviations) being used, included aloe leaves, black chokeberry fruits, common mugwort herb, beetroot roots, common marigold flowers, field horsetail herb, purple coneflower flowers, purple coneflower leaves, St. John’s wort herb, sea-buckthorn fruits, red lentil seeds, chamomile flowers, basil herb, broadleaf plantain herb, common knotgrass herb, pea seeds, common bracken leaves, giant goldenrod leaves, comfrey roots, common dandelion flowers, common dandelion leaves, common dandelion roots, red clover flowers, nettle leaves, nettle roots, and valerian roots.
4.3. Extraction
Plant-based extracts were produced through ultrasound-assisted extraction (UAE) with the use of a UP 50 H homogeniser (Hielscher Ultrasonics GmbH, Brandenburg, Germany). Raw materials (dried, 500 μm mesh size) were macerated with deionised water (ratio 1:20 w/v) at room temperature. After 30 min, the mixtures were sonicated (30 min) and centrifuged (4500 rpm, 10 min, Heraeus Megafuge 40, rotor TX-750, Thermo Scientific, Waltham, MA, USA). The analyses of bioactive compounds and antioxidant activity were performed in the obtained supernatants [44].
4.4. Analyses of Extracts
4.4.1. Phenolic Compounds
Total Phenolic Compounds
Ferric chloride test—to each extract (3 mL), neutral ferric chloride solution (5%, 5 drops) was added [30].
Lead acetate test—to each extract (2.5 mL), a lead acetate solution (10%, 1.5 mL) was added [40].
Zinc hydrochloride test—to each extract (3 mL), a pinch of zinc dust and concentrated HCl were added (5 drops) [37].
Shinoda test—to each extract (3 mL), few turnings of magnesium and concentrated HCl (5 drops) were added [37].
Folin–Ciocalteu test—to the extracts (0.1 mL), Folin–Ciocalteu’s phenol reagent (0.2 mL) and distilled water (2.0 mL) were added, and the solution was incubated (room temperature, 3 min). Then, Na2CO3 (20 mg·mL−1, 1.0 mL) was added, and the mixtures were incubated in the dark (1 h). The absorbance was determined at 765 nm using a spectrophotometer (Varian Cary 50 Conc. Instrument, Victoria, Australia). The results were expressed as gallic acid equivalents (GAE) [100].
Tannins
Gelatin test—to the extracts (3 mL), 1% gelatin solution containing 10% sodium chloride (15 drops) was added [37].
Alkaline reagent test—to the extracts (3 mL), NaOH (20%, 10 drops) was added [37].
Bromine water test—to the extract solution (2 mL), bromine water (0.2 mL) was added [49].
Ferric chloride test—to each extract (3 mL), neutral ferric chloride solution (5%, 5 drops) was added [39].
Lead acetate test—to each extract (2.5 mL), lead acetate solution (10%, 1.5 mL) was added [45].
Potassium dichromate test—to each extract (5 mL), potassium dichromate solution (10%, 1 mL) was added [45].
HCl test (phlobatannins)—to each extract (2 mL), HCl (1%, 2 mL) was added [38], then the mixture was boiled (5 min) [34,39].
Anthocyanins
NaOH test—each extract was treated with NaOH (10%, 2 mL) [39].
H2SO4 test—extracts (3 mL) were treated with H2SO4 (15 drops) [37].
Coumarins
NaOH test—each extract was treated with NaOH (10%, 2 mL) [34,42].
Flavones
NaOH test—each extract was treated with NaOH (10%, 2 mL) [40].
H2SO4 test—extracts (3 mL) were treated with H2SO4 (15 drops) [37].
Flavonoids
Alkaline reagent test—to the extracts (3 mL), NaOH (20%, 10 drops) and HCl (20%, 10 drops) were added [37].
Aluminium chloride test—extracts (2 mL) were shaken with AlCl3 solution (1%, 0.5 mL). Next, NaOH (20%, 0.5 mL) and HCl (20%, 0.5 mL) were added [39].
Ammonium test—extracts (1 mL) were treated with NH3(aq) (10%, 2 mL) and H2SO4 (5 drops) [39].
Ammonia and H2SO4 test—to each extract (1 mL), ammonia solution (10%, 2 mL) and concentrated H2SO4 (5 drops) were added [30].
Ferric chloride test—to each extract (3 mL), neutral ferric chloride solution (5%, 5 drops) was added [39].
Lead acetate test—to each extract (2.5 mL), lead acetate solution (10%, 1.5 mL) was added [37].
Millon’s test—extracts (2 mL) were mixed with Millon’s reagent (2 mL) and boiled (5 min) (Ramya et al., 2019). Methodology similar to the methodology of proteins described in our previous article [44].
Shinoda test—to each extract (3 mL), a few turnings of magnesium and concentrated HCl (5 drops) were added [37].
Zinc hydrochloride test—to each extract (3 mL), a pinch of zinc dust and concentrated HCl were added (5 drops) [37].
4.4.2. Vitamin C
DNPH test—2 mL of the test solution was treated with 2,4-dinitrophenyl hydrazine dissolved in conc. H2SO4 [34].
4.4.3. Quinones
H2SO4 test—extracts (2 mL) were shaken (5 min) with conc. H2SO4 (2 mL) [43].
HCl test—extracts (2 mL) were treated with HCl (5 mL) [34].
Ammonia test (anthraquinones)—to each extract (2 mL), NH3(aq) (10%, 15 drops) was added [38].
4.4.4. Quinines
NaOH test—extracts (1 mL) were mixed with NaOH (5%, 1 mL) [33].
4.4.5. Resin
Acetone test—extracts (1 mL) were treated with acetone (1 mL) [33].
4.4.6. Glycosides
Borntrager test (cardiac glycosides)—extracts (5 mL) were treated with conc. H2SO4 (1 mL), glacial acetic acid (2 mL) and FeCl3 solutions (5%, 3 drops) [42].
Baljet test (cardiac glycosides)—extract (2 mL) were mixed with a solution of sodium picrate (5 drops) [37].
Bromine water test (cardiac glycosides)—to the extract solution (2 mL), bromine water (0.2 mL) was added [37].
Borntrager’s tests (1) (cyanogenic glycosides)—diluted H2SO4 (2 mL) was added to each extract (2 mL). Solution was boiled (10 min) and filtered. The filtrate (1 mL) was shaken with chloroform (1 mL), then the separated chloroform layer (lower part) was shaken with NH3 solution (10%, 0.5%) [39].
Borntrager’s tests (2)—extracts (2 mL) were mixed with chloroform (2 mL) and NH3 solution (2 mL) [32,38].
H2SO4 test (glycosides)—extracts (3 mL) were treated with H2SO4 (1 mL) (Shetty and V 2012). Methodology similar to the methodology of proteins described in our previous article [44].
Molisch’s test—to each extract (2 mL), Molisch’s reagent (2 drops, ethanolic solution of α-naphthol (5%)) was added and mixed well. Next, conc. H2SO4 (1 mL) was added and allowed to stand for a few minutes [40].
Liebermann’s test—methodology similar to previously described analyses of steroids (vide: Liebermann–Burchard test for steroids, [44]). Extracts (1 mL) were mixed with chloroform (1 mL) and acetic acid (2 mL). Then, conc. H2SO4 (2 drops) was added [34].
4.4.7. Sugars
Fehling’s test—Fehling’s A solution (aqueous solution of copper (II) sulphate) (1 mL) and Fehling’s B solution (solution of potassium tartrate) (1 mL) were mixed and boiled (1 min). Next, extracts (2 mL) were added to the above mixture and boiling continued (water bath, 5 min) [42].
Benedict’s test—Benedict’s reagent (2 mL) and extracts (2 mL) were mixed and heated (boiling water bath, 5 min) [42]. Benedict’s solution consisted of 17.0 g of trisodium citrate dihydrate, 10.0 g of anhydrous sodium carbonate, 1.74 g of copper (II) sulphate, and 100 mL of water.
Molisch’s test—to each extract (2 mL), Molisch’s reagent (2 drops, ethanolic solution of α-naphthol (5%)) was added and mixed well. Next, conc. H2SO4 (1 mL) was added and allowed to stand for few minutes [34].
Bromine water test—to the extract solution (2 mL) 0.2 mL of bromine water [37] was added.
Borntrager’s test—extracts (2 mL) were mixed with chloroform (2 mL) and NH3 solution (2 mL) [37].
Selwinoff’s test—to the extracts (3 mL), Selwinoff’s reagent (1 mL) was added and boiled (10 min) [37]. Selwinoff’s solution was prepared by dissolving 110 mg of resorcinol in 220 mL of 3N HCl.
Barfoed’s test—extracts (2 mL) were mixed with Barfoed’s reagent (1 mL) and heated (water bath, 2 min) [47]. Barfoed’s solution was prepared by dissolving 13.3 g of copper acetate in 200 mL of water and then 1.8 mL of glacial acetic acid was added.
4.4.8. Antioxidant Activity
DPPH assay—extracts (0.5 mL, diluted 100 or 1000 times) were mixed with ethanol (1.5 mL) and DPPH solution (0.5 mL), vigorously shaken, and left in the dark (10 min). The absorbance was measured at 517 nm [100].
ABTS assay—extracts (30 µL) were mixed with ABTS solution (3 mL) and left in the dark (6 min). The absorbance was measured at 734 nm [100].
FRAP assay—extracts (1 mL) were mixed with FRAP solution (3 mL) and after 10 min the absorbance at 593 nm was measured [100].
The percentage of DPPH and ABTS scavenging effects were calculated by the following equation:
where Acontrol is the absorbance of the addition of ethanol and Asample is the absorbance of tested extracts.
4.4.9. Plant Hormones
HPLC—qualitative and quantitative HPLC chromatographic analysis of plant hormones were performed in the reverse phase system, using a LaChrom-Merck liquid chromatograph with a DAD diode detector (L-7450), a pump (L-7100), a degasser (L-7612), a 20 µL dosing loop with a thermostat (L-7360), a Rheodyne dispenser, and a steel column LiChrocart C18 250 mm × 4.6 mm filled with a stationary phase with a grain diameter of dp = 5 µm. The samples were analysed at 30 °C. Separation of standard substances was performed using an isocratic elution in 1% aqueous solution of acetic acid and acetonitrile (75:25, v/v) at pH 4.0. Mobile phases for the determination of hormones in the plant samples consisted of 40% acetonitrile—0.1% acetic acid in water (eluent A) and 0.1% acetic acid in methanol (eluent B). The following gradient was used: 0–18 min, 100% A; 18–25 min, linear gradient up to 100% B; 25–35 min 100% B; 35–40 min, linear gradient to 100% A. Post-run time was 15 min. Elution was performed with a solvent flow rate of 0.8 mL·min−1 and an injection size of 20 µL. Detection was carried out at a wavelength of λ = 230 to 287 nm. Hormones were identified by comparing their retention times (tR) with the standards. Abscisic acid (ABA), benzoic acid (BA), gibberellic acid (GA3), indole acetic acid (IAA), jasmonic acid (JA), salicylic acid (SA), zeatin (Z), zeatin riboside (RZ), and isipentenyl adenine (IP) in the tested extracts was calculated on the basis of a calibration curve determined for each identified hormone. All samples were filtered through 0.22 µm membrane filters before injection into HPLC [101,102].
5. Conclusions
The current study represents the systematic screening of bioactive compounds extracted from twenty-six biomasses. The detailed phytochemical study of the content of phenolic compounds (phenols, tannins, anthocyanins, coumarins, flavones, flavonoids), vitamin C, quinones, quinines, resins, glycosides, and sugars, as well as antioxidant activity and the content of plant hormones, have been reported. The applied protocols are accessible, inexpensive, and provide a quick answer regarding the presence or absence of bioactive compounds. Several methods could be used for rapid screening, while modern analytical methods are necessary for the final confirmation of the concentration of bioactive compounds.
Supplementary Materials
The following supporting information can be downloaded at: https://www.mdpi.com/article/10.3390/molecules28145572/s1, Table S1: The comparison of methods used to detect phenolic compounds (PC); Table S2: The comparison of methods used to detect tannins (TN); Table S3: The comparison of methods used to detect flavonoids (FD); Table S4: The comparison of methods used to detect anthocyanins (AC), and flavones (FL); Table S5: The comparison of methods used to detect quinones (QNO); Table S6: The comparison of methods used to detect glycosides; Table S7: The comparison of methods used to detect sugars.
Author Contributions
Conceptualisation, K.G.; methodology, K.G. and A.N.; formal analysis, K.G., P.P. and I.M.; investigation, K.G. and A.N.; resources, K.G.; writing—original draft preparation, K.G., P.P. and I.M.; supervision, K.G. and I.M.; funding acquisition, K.G. All authors have read and agreed to the published version of the manuscript.
Funding
This work was financed in the framework of the grant entitled Mechanism of Action of Novel Plant-Derived Extracts and Their Impact on Stress Resilience of Arabidopsis thaliana (2018/29/N/NZ9/02430) attributed by The National Science Centre in Poland. The APC is co-financed by Wrocław University of Environmental and Life Sciences.
Institutional Review Board Statement
Not applicable.
Informed Consent Statement
Not applicable.
Data Availability Statement
Not applicable.
Conflicts of Interest
The authors declare no conflict of interest.
Sample Availability
Not applicable.
References
- Djeridane, A.; Yousfi, M.; Nadjemi, B.; Boutassouna, D.; Stocker, P.; Vidal, N. Antioxidant activity of some algerian medicinal plants extracts containing phenolic compounds. Food Chem. 2006, 97, 654–660. [Google Scholar] [CrossRef] [Scilit]
- Amaral, S.; Mira, L.; Nogueira, J.M.F.; da Silva, A.P.; Florêncio, M.H. Plant extracts with anti-inflammatory properties—A new approach for characterization of their bioactive compounds and establishment of structure-antioxidant activity relationships. Bioorg. Med. Chem. 2009, 17, 1876–1883. [Google Scholar] [CrossRef] [Scilit]
- Saeed, N.; Khan, M.R.; Shabbir, M. Antioxidant activity, total phenolic and total flavonoid contents of whole plant extracts Torilis leptophylla L. BMC Complement. Altern. Med. 2012, 12, 221. [Google Scholar] [CrossRef] [Scilit]
- Gul, K.; Singh, A.K.; Jabeen, R. Nutraceuticals and functional foods: The foods for the future forld. Crit. Rev. Food Sci. Nutr. 2016, 56, 2617–2627. [Google Scholar] [CrossRef] [Scilit] [PubMed]
- Mustafa, G.; Arif, R.; Atta, A.; Sharif, S.; Jamil, A. Bioactive compounds from medicinal plants and their importance in drug discovery in Pakistan. Matrix Sci. Pharma 2017, 1, 17–26. [Google Scholar] [CrossRef] [Scilit]
- Kim, I.S.; Yang, M.; Lee, O.H.; Kang, S.N. The antioxidant activity and the bioactive compound content of Stevia rebaudiana water extracts. LWT 2011, 44, 1328–1332. [Google Scholar] [CrossRef] [Scilit]
- Brusotti, G.; Cesari, I.; Dentamaro, A.; Caccialanza, G.; Massolini, G. Isolation and characterization of bioactive compounds from plant resources: The role of analysis in the ethnopharmacological approach. J. Pharm. Biomed. Anal. 2014, 87, 218–228. [Google Scholar] [CrossRef] [Scilit]
- Marathe, S.J.; Jadhav, S.B.; Bankar, S.B.; Kumari Dubey, K.; Singhal, R.S. Improvements in the extraction of bioactive compounds by enzymes. Curr. Opin. Food Sci. 2019, 25, 62–72. [Google Scholar] [CrossRef] [Scilit]
- Benhammou, N.; Bekkara, F.A.; Kadifkova Panovska, T. Antioxidant activity of methanolic extracts and some bioactive compounds of Atriplex halimus. Comptes Rendus Chim. 2009, 12, 1259–1266. [Google Scholar] [CrossRef] [Scilit]
- Azmir, J.; Zaidul, I.S.M.; Rahman, M.M.; Sharif, K.M.; Mohamed, A.; Sahena, F.; Jahurul, M.H.A.; Ghafoor, K.; Norulaini, N.A.N.; Omar, A.K.M. Techniques for extraction of bioactive compounds from plant materials: A review. J. Food Eng. 2013, 117, 426–436. [Google Scholar] [CrossRef] [Scilit]
- Cvjetko Bubalo, M.; Vidović, S.; Radojčić Redovniković, I.; Jokić, S. New perspective in extraction of plant biologically active compounds by green solvents. Food Bioprod. Process. 2018, 109, 52–73. [Google Scholar] [CrossRef] [Scilit]
- Yahya, N.A.; Attan, N.; Wahab, R.A. An overview of cosmeceutically relevant plant extracts and strategies for extraction of plant-based bioactive compounds. Food Bioprod. Process. 2018, 112, 69–85. [Google Scholar] [CrossRef] [Scilit]
- Arabshahi-Delouee, S.; Vishalakshi Devi, D.; Urooj, A. Evaluation of antioxidant activity of some plant extracts and their heat, pH and storage stability. Food Chem. 2007, 100, 1100–1105. [Google Scholar] [CrossRef] [Scilit]
- Banerjee, E.R. Nutraceuticals—Prophylactic and therapeutic role of functional food in health. In Perspectives in Translational Research in Life Sciences and Biomedicine; Translational Outcomes Research in Life Sciences and Translational Medicine; Springer Nature: Singapore, 2017; pp. 1–132. ISBN 9789811058707. [Google Scholar]
- Mgbeahuruike, E.E.; Yrjönen, T.; Vuorela, H.; Holm, Y. Bioactive compounds from medicinal plants: Focus on Piper species. S. Afr. J. Bot. 2017, 112, 54–69. [Google Scholar] [CrossRef] [Scilit]
- Mansour, E.H.; Khalil, A.H. Evaluation of antioxidant activity of some plant extracts and their application to ground beef patties. Food Chem. 2000, 69, 135–141. [Google Scholar] [CrossRef] [Scilit]
- Lee, S.E.; Hwang, H.J.; Ha, J.S.; Jeong, H.S.; Kim, J.H. Screening of medicinal plant extracts for antioxidant activity. Life Sci. 2003, 73, 167–179. [Google Scholar] [CrossRef] [Scilit] [PubMed]
- Christaki, E.; Bonos, E.; Giannenas, I.; Florou-Paneri, P. Aromatic plants as a source of bioactive compounds. Agriculture 2012, 2, 228–243. [Google Scholar] [CrossRef] [Scilit]
- Banerjee, J.; Singh, R.; Vijayaraghavan, R.; MacFarlane, D.; Patti, A.F.; Arora, A. Bioactives from fruit processing wastes: Green approaches to valuable chemicals. Food Chem. 2017, 225, 10–22. [Google Scholar] [CrossRef] [Scilit] [PubMed]
- Arun, K.B.; Madhavan, A.; Sindhu, R.; Binod, P.; Pandey, A.; Reshmi, R.; Sirohi, R. Remodeling agro-industrial and food wastes into value-added bioactives and biopolymers. Ind. Crops Prod. 2020, 154, 112621. [Google Scholar] [CrossRef] [Scilit]
- Tang, B.; Bi, W.; Tian, M.; Row, K.H. Application of ionic liquid for extraction and separation of bioactive compounds from plants. J. Chromatogr. B Anal. Technol. Biomed. Life Sci. 2012, 904, 1–21. [Google Scholar] [CrossRef] [Scilit]
- Lefebvre, T.; Destandau, E.; Lesellier, E. Selective extraction of bioactive compounds from plants using recent extraction techniques: A review. J. Chromatogr. A 2021, 1635, 461770. [Google Scholar] [CrossRef] [Scilit] [PubMed]
- Chirila, E.; Draghici, C.; Brasov, U.T.; Dobrinas, S. Chemicals as Intentional and Accidental Global Environmental Threats; Springer: Dordrecht, The Netherlands, 2006. [Google Scholar] [CrossRef] [Scilit]
- Hagarová, I.; Nemček, L.; Šebesta, M.; Zvěřina, O.; Kasak, P.; Urík, M. Preconcentration and separation of gold nanoparticles from environmental waters using extraction techniques followed by spectrometric quantification. Int. J. Mol. Sci. 2022, 23, 11465. [Google Scholar] [CrossRef] [Scilit] [PubMed]
- Suleiman, M.M.; McGaw, L.J.; Naidoo, V.; Eloff, J.N. Detection of antimicrobial compounds by bioautography of different extracts of leaves of selected south african tree species. Afr. J. Tradit. Complement. Altern. Med. 2010, 7, 64–78. [Google Scholar] [CrossRef] [Scilit] [PubMed]
- Rahman, M.; Mukta, J.A.; Sabir, A.A.; Gupta, D.R.; Mohi-Ud-Din, M.; Hasanuzzaman, M.; Miah, M.G.; Rahman, M.; Islam, M.T. Chitosan biopolymer promotes yield and stimulates accumulation of antioxidants in strawberry fruit. PLoS ONE 2018, 13, e0203769. [Google Scholar] [CrossRef] [Scilit]
- Patel, K.; Patel, J.; Patel, M.; Rajput, G.; Patel, H. Introduction to hyphenated techniques and their applications in pharmacy. Pharm. Methods 2010, 1, 2. [Google Scholar] [CrossRef]
- Panda, M.; Sandhya, T.; Sameera Bhanu, M.; Vasudha, D.; Varaprasadrao, K. Advances within the hyphenation of flow analysis techniques. World J. Pharm. Res. 2021, 10, 676–685. [Google Scholar]
- Navaziya, M. HPLC hyphenations in advanced analytical world. J. Phys. Chem. Biophys. 2022, 12, 328. [Google Scholar]
- Azalea Berenguer-Rivas, C.; Mas-Ortiz, M.; Batista-Corbal, P.L.; Costa-Acosta, J.; Julio César Escalona-Arranz, C. Chemical composition and in vitro antioxidant activity of extracts of Adelia ricinella L. Rev. Cuba. Quim. 2018, 30, 191–209. [Google Scholar]
- Kumar, S.; Singh, B.B.; Kumar, N. Physico-chemical and phytochemical investigation of plant Sesbania sesban. Res. J. Pharm. Biol. Chem. Sci. 2014, 5, 110–117. [Google Scholar]
- Abdalla, A.A.; Mustafa, M.I.; Makhawi, A.M. Phytochemical screening and antimicrobial activities studies of Acacia nilotica fruit cover. bioRxiv 2020. 2020.02.11.943456. [Google Scholar]
- Samarawickrama, A.G.; Kumari, C. Alcoholic extraction and phyto-chemical evaluation of chakramarda seeds (Cassia tora Linn.). Int. J. Res. Ayurveda Pharm. 2017, 8, 157–161. [Google Scholar] [CrossRef] [Scilit]
- Jothi, M.M.; Lakshman, K. Preliminary studies of phytochemical investigation on coastal medicinal plants of boloor, Mangalore. Indo Am. J. Pharm. Sci. 2018, 5, 1309–1315. [Google Scholar]
- Sahu, V.K.; Raghuveer, I.; Alok, S.; Gurjar, H. Phytochemical investigation and chromatographic evaluation of the extract of whole plant extract of Dendrophthoe falcata (L.F) Ettingsh. Int. J. Pharm. Sci. Res. 2010, 1, 39–45. [Google Scholar]
- Tan, K.K.; Khoo, T.J.; Wiart, C. Phytochemical screening of Artabotrys crassifolius Hook. F. & Thomson (Anninaceae Juss.). Innovare J. Ayurvedic Sci. 2013, 1, 14–17. [Google Scholar]
- Ramya, G.L.P.; Vasanth, P.M.; Prasad, P.V.; Sarath Babu, V. Qualitative phytochemical screening tests of Alpinia. World J. Pharm. Res. 2019, 8, 1064. [Google Scholar]
- Jayapriya, G.; Gricilda Shoba, F. Screening for phytochemical activity of Urechites lutea plant. Pelagia Res. Libr. Asian J. Plant Sci. Res. 2014, 4, 20–24. [Google Scholar]
- Le BaoDuy, N.; Trang, D.T.D.; Trang, N.P.M. Preliminary phytochemical analysis of leaf extracts of Thuja orientalis (L.) Endl. Int. J. Res. Sci. Manag. 2015, 2, 21–25. [Google Scholar]
- Shetty, S.; Vijayalaxmi, K.K. Phytochemical investigation of extract/solvent fractions of Piper nigrum Linn. seeds and Piper betle Linn. leaves. Int. J. Pharma Bio Sci. 2012, 3, 344–349. [Google Scholar]
- Godlewska, K.; Pacyga, P.; Michalak, I.; Biesiada, A.; Szumny, A.; Pachura, N.; Piszcz, U. Effect of botanical extracts on the growth and nutritional quality of field-grown white head cabbage (Brassica oleracea var. capitata). Molecules 2021, 26, 1992. [Google Scholar] [CrossRef] [Scilit]
- Rufai, Y.; Isah, Y.; Isyaka, M.S. Comparative phyto-constituents analysis from the root bark and root core extractives of Cassia ferruginea (Schrad D. C) Plant. Sch. J. Agric. Vet. Sci. 2016, 3, 275–283. [Google Scholar] [CrossRef] [Scilit]
- Kakpure, M.R.; Rothe, S.P.; Shivaji, S. Phytochemical screening of Alectra Parasitica A. Rich—A rare medicinal parasitic plant. Adv. Res. Pharm. Biol. 2012, 2, 103–111. [Google Scholar]
- Godlewska, K.; Pacyga, P.; Szumny, A.; Szymczycha-Madeja, A.; Wełna, M.; Michalak, I. Methods for rapid screening of biologically active compounds present in plant-based extracts. Molecules 2022, 27, 7094. [Google Scholar] [CrossRef] [Scilit] [PubMed]
- Shukla, S.; Mehta, A.; Bajpai, V.K. Phytochemical screening and anthelmintic and antifungal activities of leaf extracts of Stevia rebaudiana. J. Biol. Act. Prod. Nat. 2013, 3, 56–63. [Google Scholar] [CrossRef] [Scilit]
- Yusuf, A.Z.; Zakir, A.; Shemau, Z.; Abdullahi, M.; Halima, S.A. Phytochemical analysis of the methanol leaves extract of Paullinia pinnata Linn. J. Pharmacogn. Phyther. 2014, 6, 10–16. [Google Scholar] [CrossRef] [Scilit]
- Auwal, M.S.; Saka, S.; Mairiga, I.A.; Sanda, K.A.; Shuaibu, A.; Ibrahim, A. Preliminary phytochemical and elemental analysis of aqueous and fractionated pod extracts of Acacia nilotica (Thorn mimosa). Vet. Res. Forum Int. Q. J. 2014, 5, 95–100. [Google Scholar]
- Shah, M.D.; Hossain, M.A. Total flavonoids content and biochemical screening of the leaves of tropical endemic medicinal plant Merremia borneensis. Arab. J. Chem. 2014, 7, 1034–1038. [Google Scholar] [CrossRef] [Scilit]
- Evans, W.C. Pharmacognosy, 15th ed.; Saunders: Philadelphia, PA, USA, 2002; ISBN 9780702029332. [Google Scholar]
- Sasidharan, S.; Chen, Y.; Saravanan, D.; Sundram, K.M.; Yoga Latha, L. Extraction, isolation and characterization of bioactive compounds from plants’ extracts. Afr. J. Tradit. Complement. Altern. Med. 2011, 8, 1–10. [Google Scholar] [CrossRef] [Scilit]
- Costa, D.C.; Costa, H.S.; Albuquerque, T.G.; Ramos, F.; Castilho, M.C.; Sanches-Silva, A. Advances in phenolic compounds analysis of aromatic plants and their potential applications. Trends Food Sci. Technol. 2015, 45, 336–354. [Google Scholar] [CrossRef] [Scilit]
- Albuquerque, B.R.; Heleno, S.A.; Oliveira, M.B.P.P.; Barros, L.; Ferreira, I.C.F.R. Phenolic compounds: Current industrial applications, limitations and future challenges. Food Funct. 2021, 12, 14–29. [Google Scholar] [CrossRef] [Scilit]
- Lorenzo, J.M.; Munekata, P.E.S. Phenolic compounds of green tea: Health benefits and technological application in food. Asian Pac. J. Trop. Biomed. 2016, 6, 709–719. [Google Scholar] [CrossRef] [Scilit]
- Kalogianni, A.I.; Lazou, T.; Bossis, I.; Gelasakis, A.I. Natural phenolic compounds for the control of oxidation, bacterial spoilage, and foodborne pathogens in meat. Foods 2020, 9, 794. [Google Scholar] [CrossRef] [Scilit]
- Araújo, M.; Pimentel, F.B.; Alves, R.C.; Oliveira, M.B.P.P. Phenolic compounds from olive mill wastes: Health effects, analytical approach and application as food antioxidants. Trends Food Sci. Technol. 2015, 45, 200–211. [Google Scholar] [CrossRef] [Scilit]
- Tungmunnithum, D.; Thongboonyou, A.; Pholboon, A.; Yangsabai, A. Flavonoids and other phenolic compounds from medicinal plants for pharmaceutical and medical aspects: An overview. Medicines 2018, 5, 93. [Google Scholar] [CrossRef] [Scilit] [PubMed]
- Bondam, A.F.; Diolinda da Silveira, D.; Pozzada dos Santos, J.; Hoffmann, J.F. Phenolic compounds from coffee by-products: Extraction and application in the food and pharmaceutical industries. Trends Food Sci. Technol. 2022, 123, 172–186. [Google Scholar] [CrossRef] [Scilit]
- Sánchez-Rangel, J.C.; Benavides, J.; Heredia, J.B.; Cisneros-Zevallos, L.; Jacobo-Velázquez, D.A. The Folin-Ciocalteu assay revisited: Improvement of its specificity for total phenolic content determination. Anal. Methods 2013, 5, 5990–5999. [Google Scholar] [CrossRef] [Scilit]
- Martins, G.R.; Monteiro, A.F.; do Amaral, F.R.L.; da Silva, A.S. A validated Folin-Ciocalteu method for total phenolics quantification of condensed tannin-rich açaí (Euterpe oleracea Mart.) seeds extract. J. Food Sci. Technol. 2021, 58, 4693–4702. [Google Scholar] [CrossRef] [Scilit]
- Granger, M.; Eck, P. Dietary vitamin C in human health. Adv. Food Nutr. Res. 2018, 83, 281–310. [Google Scholar] [CrossRef] [Scilit]
- Estevinho, B.N.; Carlan, I.; Blaga, A.; Rocha, F. Soluble vitamins (vitamin B12 and vitamin C) microencapsulated with different biopolymers by a spray drying process. Powder Technol. 2016, 289, 71–78. [Google Scholar] [CrossRef] [Scilit]
- Iqbal, K.; Khan, A.; Khattak, M.M.A.K. Biological significance of ascorbic acid (vitamin C) in human health—A review. Pak. J. Nutr. 2003, 3, 5–13. [Google Scholar] [CrossRef] [Scilit]
- Naidu, K.A. Extensive next-generation sequencing analysis in chronic lymphocytic leukemia at diagnosis: Clinical and biological correlations. J. Hematol. Oncol. 2016, 9, 88, Erratum in J. Hematol. Oncol. 2016, 9, 103. [Google Scholar] [CrossRef] [Scilit]
- Walingo, D.M.K. Role of vitamin C (ascorbic acid) on human health—A review. Food Agric. Nutr. Dev. 2005, 5, 1–11. [Google Scholar] [CrossRef] [Scilit]
- Pappenberger, G.; Hohmann, H.P. Industrial production of L-Ascorbic acid (vitamin C) and D-isoascorbic acid. Adv. Biochem. Eng. Biotechnol. 2013, 143, 143–188. [Google Scholar] [CrossRef] [Scilit]
- Miroshnikov, M.; Divya, K.P.; Babu, G.; Meiyazhagan, A.; Reddy Arava, L.M.; Ajayan, P.M.; John, G. Power from nature: Designing green battery materials from electroactive quinone derivatives and organic polymers. J. Mater. Chem. A 2016, 4, 12370–12386. [Google Scholar] [CrossRef] [Scilit]
- Fomin, V.M.; Galkina, M.S.; Klyuchevskii, K.V.; Arsen’ev, M.V.; Poddel’skii, A.I. The reactivity of ferrocene and its derivatives in the reaction with quinines. Russ. J. Gen. Chem. 2018, 88, 2089–2095. [Google Scholar] [CrossRef] [Scilit]
- Park, J.H.; Gatewood, B.M.; Ramaswamy, G.N. Naturally occurring quinones and flavonoid dyes for wool: Insect feeding deterrents. J. Appl. Polym. Sci. 2005, 98, 322–328. [Google Scholar] [CrossRef] [Scilit]
- Langenheim, J.H. Plant resins. Am. Sci. 1990, 78, 16–24. [Google Scholar]
- Dimkić, I.; Ristivojević, P.; Janakiev, T.; Berić, T.; Trifković, J.; Milojković-Opsenica, D.; Stanković, S. Phenolic profiles and antimicrobial activity of various plant resins as potential botanical sources of Serbian propolis. Ind. Crops Prod. 2016, 94, 856–871. [Google Scholar] [CrossRef] [Scilit]
- Seyfullah, L.J.; Beimforde, C.; Dal Corso, J.; Perrichot, V.; Rikkinen, J.; Schmidt, A.R. Production and preservation of resins—Past and present. Biol. Rev. 2018, 93, 1684–1714. [Google Scholar] [CrossRef] [Scilit]
- Salomé-Abarca, L.F.; van der Pas, J.; Kim, H.K.; van Uffelen, G.A.; Klinkhamer, P.G.L.; Choi, Y.H. Metabolic discrimination of pine resins using multiple analytical platforms. Phytochemistry 2018, 155, 37–44. [Google Scholar] [CrossRef] [Scilit]
- Duwiejua, M.; Zeitlin, I.J.; Waterman, P.G.; Chapman, J.; Mhango, G.J.; Provan, G.J. Anti-inflammatory activity of resins from some species of the plant family burseraceae. Planta Med. 1993, 59, 12–16. [Google Scholar] [CrossRef] [Scilit]
- Haas, G.J.; Barsoumian, R. Antimicrobial activity of hop resins. J. Food Prot. 1994, 57, 59–61. [Google Scholar] [CrossRef] [Scilit]
- Assimopoulou, A.N.; Zlatanos, S.N.; Papageorgiou, V.P. Antioxidant activity of natural resins and bioactive triterpenes in oil substrates. Food Chem. 2005, 92, 721–727. [Google Scholar] [CrossRef] [Scilit]
- Wilson, M.B.; Spivak, M.; Hegeman, A.D.; Rendahl, A.; Cohen, J.D. Metabolomics reveals the origins of antimicrobial plant resins collected by honey bees. PLoS ONE 2013, 8, e77512. [Google Scholar] [CrossRef] [Scilit] [PubMed]
- Khan, S.; Yu, H.; Li, Q.; Gao, Y.; Sallam, B.N.; Wang, H.; Liu, P.; Jiang, W. Exogenous application of amino acids improves the growth and yield of lettuce by enhancing photosynthetic assimilation and nutrient availability. Agronomy 2019, 9, 266. [Google Scholar] [CrossRef] [Scilit]
- Kytidou, K.; Artola, M.; Overkleeft, H.S.; Aerts, J.M.F.G. Plant glycosides and glycosidases: A treasure-trove for therapeutics. Front. Plant Sci. 2020, 11, 357. [Google Scholar] [CrossRef] [Scilit]
- Okoye, F.B.C.; Sawadogo, W.R.; Sendker, J.; Aly, A.H.; Quandt, B.; Wray, V.; Hensel, A.; Esimone, C.O.; Debbab, A.; Diederich, M.; et al. Flavonoid glycosides from Olax mannii: Structure elucidation and effect on the nuclear factor kappa B pathway. J. Ethnopharmacol. 2015, 176, 27–34. [Google Scholar] [CrossRef] [Scilit] [PubMed]
- Chen, J.C.; Chiu, M.H.; Nie, R.L.; Cordel, G.A.; Qiuz, S.X. Cucurbitacins and cucurbitane glycosides: Structures and biological activities. Nat. Prod. Rep. 2005, 22, 386–399. [Google Scholar] [CrossRef] [Scilit]
- Manunta, P.; Ferrandi, M. Cardiac glycosides and cardiomyopathy. Hypertension 2006, 47, 343–344. [Google Scholar] [CrossRef] [Scilit] [PubMed]
- Prassas, I.; Diamandis, E.P. Novel therapeutic applications of cardiac glycosides. Nat. Rev. Drug Discov. 2008, 7, 926–935. [Google Scholar] [CrossRef] [Scilit]
- Halford, N.G.; Curtis, T.Y.; Muttucumaru, N.; Postles, J.; Mottram, D.S. Sugars in crop plants. Ann. Appl. Biol. 2011, 158, 1–25. [Google Scholar] [CrossRef] [Scilit]
- Moghaddam, M.R.B.; Van Den Ende, W. Sugars and plant innate immunity. J. Exp. Bot. 2012, 63, 3989–3998. [Google Scholar] [CrossRef] [Scilit] [PubMed]
- Ciereszko, I. Regulatory roles of sugars in plant growth and development. Acta Soc. Bot. Pol. 2018, 87, 3583. [Google Scholar] [CrossRef] [Scilit]
- Ghanem, M.; Harphoush, S.; Zaitoun, M. Sugars: Types and their functional properties in food and human health. Int. J. Public Health Res. 2018, 6, 93–99. [Google Scholar]
- Glyad, V.M. Determination of monosaccharides, disaccharides, and oligosaccharides in the same plant sample by high-performance liquid chromatography. Russ. J. Plant Physiol. 2002, 49, 277–282. [Google Scholar] [CrossRef] [Scilit]
- Clemens, R.A.; Jones, J.M.; Kern, M.; Lee, S.Y.; Mayhew, E.J.; Slavin, J.L.; Zivanovic, S. Functionality of sugars in foods and health. Compr. Rev. Food Sci. Food Saf. 2016, 15, 433–470. [Google Scholar] [CrossRef] [Scilit]
- Arshad, S.; Rehman, T.; Saif, S.; Rajoka, M.S.R.; Ranjha, M.M.A.N.; Hassoun, A.; Cropotova, J.; Trif, M.; Younas, A.; Aadil, R.M. Replacement of refined sugar by natural sweeteners: Focus on potential health benefits. Heliyon 2022, 8, e10711. [Google Scholar] [CrossRef] [Scilit]
- Finley, J.W.; Kong, A.N.; Hintze, K.J.; Jeffery, E.H.; Ji, L.L.; Lei, X.G. Antioxidants in foods: State of the science important to the food industry. J. Agric. Food Chem. 2011, 59, 6837–6846. [Google Scholar] [CrossRef] [Scilit]
- Kotha, R.R.; Tareq, F.S.; Yildiz, E.; Luthria, D.L. Oxidative stress and antioxidants—A critical review on in vitro antioxidant assays. Antioxidants 2022, 11, 2388. [Google Scholar] [CrossRef] [Scilit]
- Zehiroglu, C.; Ozturk Sarikaya, S.B. The importance of antioxidants and place in today’s scientific and technological studies. J. Food Sci. Technol. 2019, 56, 4757–4774. [Google Scholar] [CrossRef] [Scilit]
- Kebede, M.; Admassu, S. Application of antioxidants in food processing industry: Options to improve the extraction yields and market value of natural products. Adv. Food Technol. Nutr. Sci. Open J. 2019, 5, 38–49. [Google Scholar] [CrossRef] [Scilit]
- Gaspar, T.; Kevers, C.; Faivre-Rampant, O.; Crèvecoeur, M.; Penel, C.; Greppin, H.; Dommes, J. Changing concepts in plant hormone action. Vitr. Cell. Dev. Biol.-Plant 2003, 39, 85–106. [Google Scholar] [CrossRef] [Scilit]
- Shi, T.Q.; Peng, H.; Zeng, S.Y.; Ji, R.Y.; Shi, K.; Huang, H.; Ji, X.J. Microbial production of plant hormones: Opportunities and challenges. Bioengineered 2017, 8, 124–128. [Google Scholar] [CrossRef] [Scilit] [PubMed]
- Mohanta, T.K.; Mohanta, Y.K.; Yadav, D.; Hashem, A.; Abd Allah, E.; Al-Harrasi, A. Global trends in phytohormone research: Google trends analysis revealed African countries have higher demand for phytohormone information. Plants 2020, 9, 1248. [Google Scholar] [CrossRef] [Scilit] [PubMed]
- Yu, Z.; Duan, X.; Luo, L.; Dai, S.; Ding, Z.; Xia, G. How plant hormones mediate salt stress responses. Trends Plant Sci. 2020, 25, 1117–1130. [Google Scholar] [CrossRef] [Scilit]
- Prins, C.L.; Vieira, I.J.C.; Freitas, S.P. Growth regulators and essential oil production. Braz. J. Plant Physiol. 2010, 22, 91–102. [Google Scholar] [CrossRef] [Scilit]
- Nazli, F.; Mustafa, A.; Ahmad, M.; Hussain, A.; Jamil, M.; Wang, X.; Shakeel, Q.; Imtiaz, M.; El-Esawi, M.A. A review on practical application and potentials of phytohormone-producing plant growth-promoting rhizobacteria for inducing heavy metal tolerance in crops. Sustainability 2020, 12, 9056. [Google Scholar] [CrossRef] [Scilit]
- Godlewska, K.; Biesiada, A.; Michalak, I.; Pacyga, P. The effect of plant-derived biostimulants on white head cabbage seedlings grown under controlled conditions. Sustainability 2019, 11, 5317. [Google Scholar] [CrossRef] [Scilit]
- Zhang, Y.W.; Fan, W.W.; Li, H.; Ni, H.; Han, H.B.; Li, H.H. Simultaneous column chromatographic extraction and purification of abscisic acid in peanut plants for direct HPLC analysis. J. Chromatogr. B Anal. Technol. Biomed. Life Sci. 2015, 1002, 277–284. [Google Scholar] [CrossRef] [Scilit]
- Li, M.Y.; Feng, K.; Hou, X.L.; Jiang, Q.; Xu, Z.S.; Wang, G.L.; Liu, J.X.; Wang, F.; Xiong, A.S. The genome sequence of celery (Apium graveolens L.), an important leaf vegetable crop rich in apigenin in the Apiaceae family. Hortic. Res. 2020, 7, 9. [Google Scholar] [CrossRef] [Scilit]

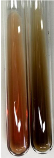
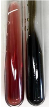
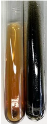
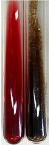
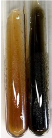
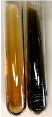
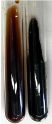
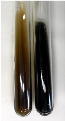
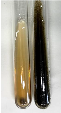

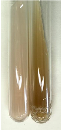
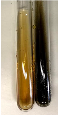
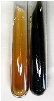
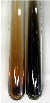

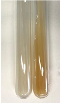
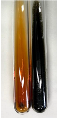
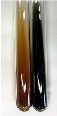
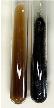
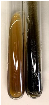
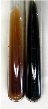

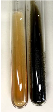
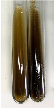

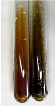
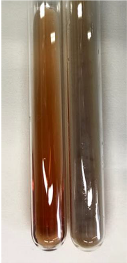
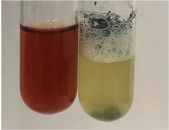
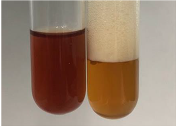
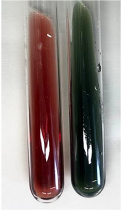
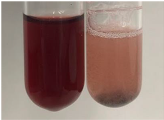
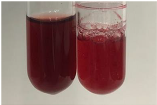
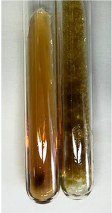
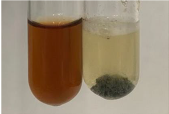
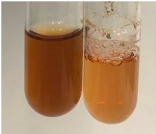
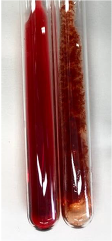
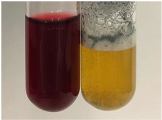
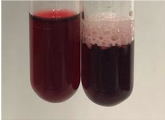
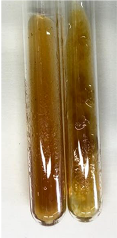
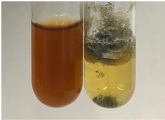
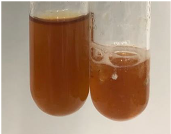
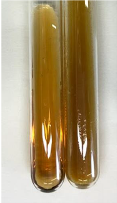
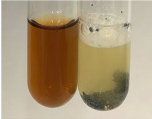
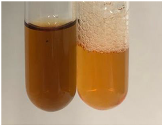
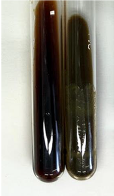
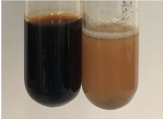
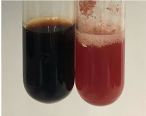
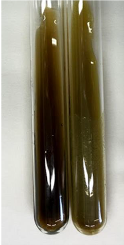
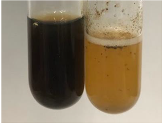
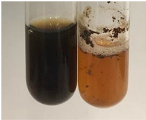
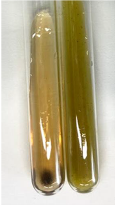
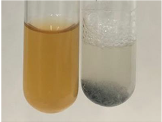
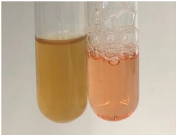
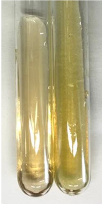
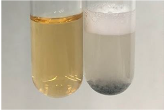
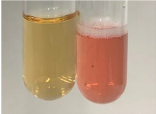
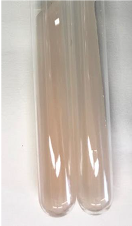
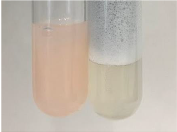
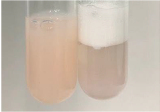
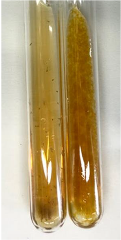
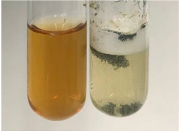
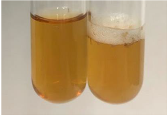
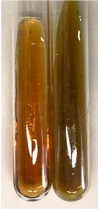
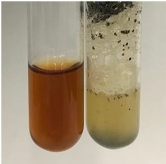
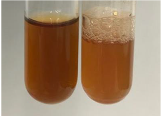
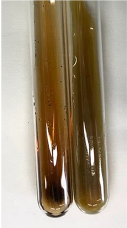
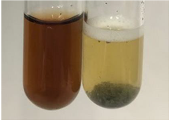
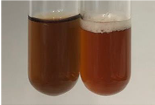
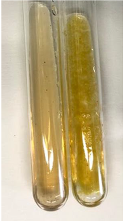
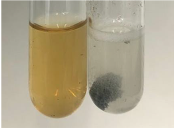
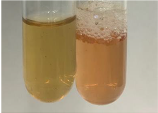
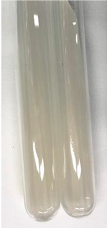
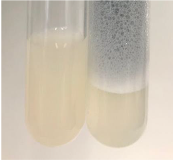
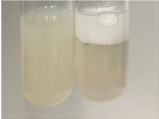
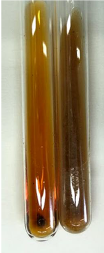
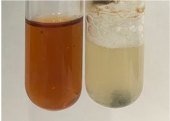
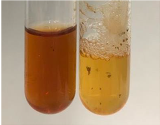
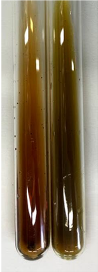
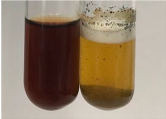
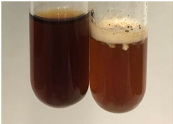
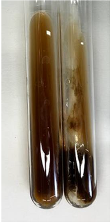
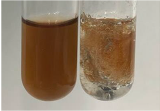
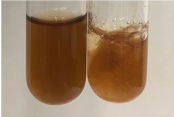
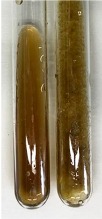
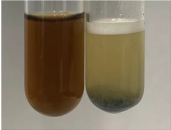
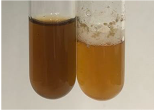
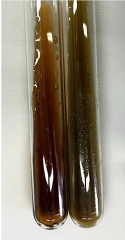
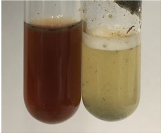
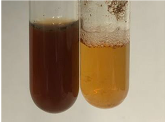
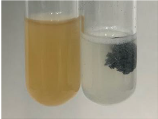
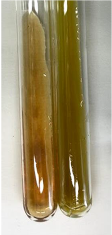
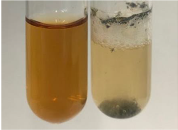
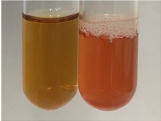
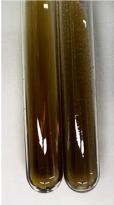
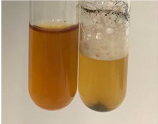
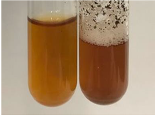
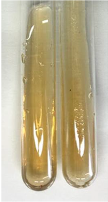
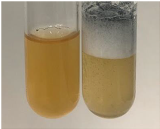
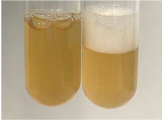
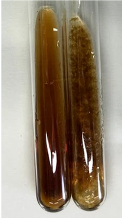
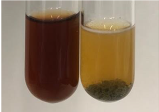
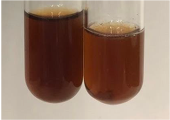
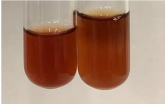
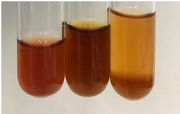
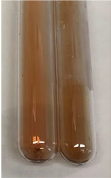
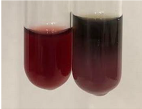
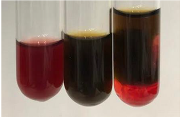
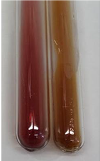
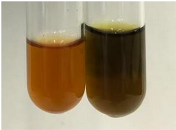
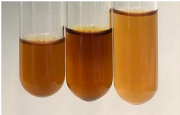
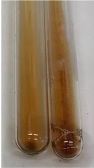
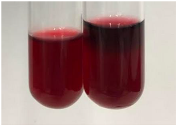
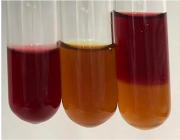
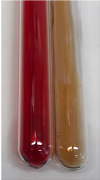
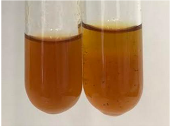
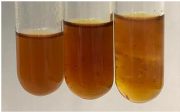
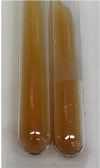
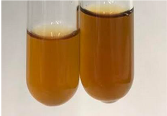
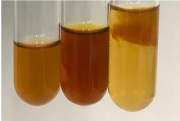
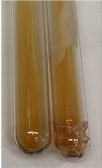
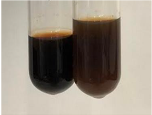
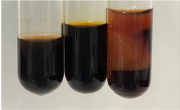
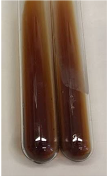
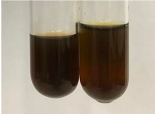
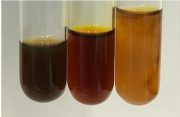
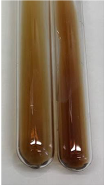
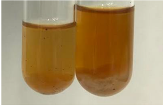
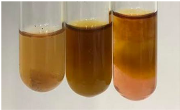
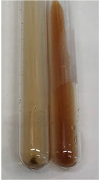
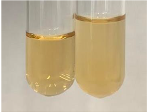
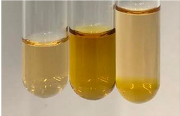
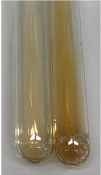
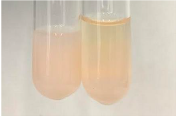
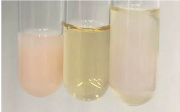
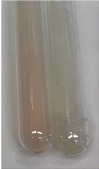
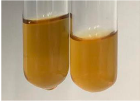
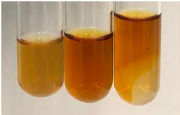

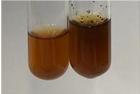
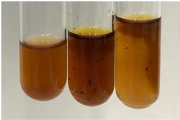
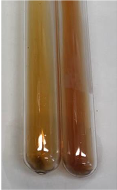
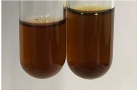
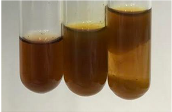
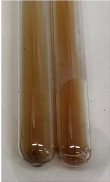
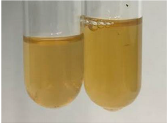
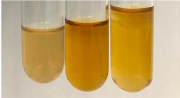
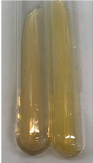
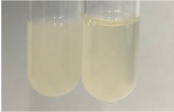
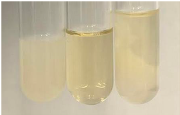
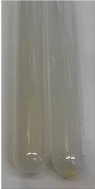
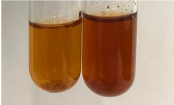
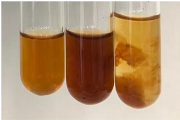
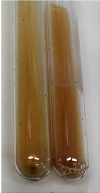
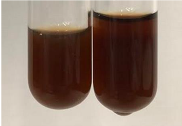
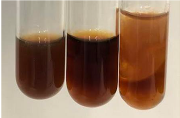
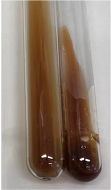
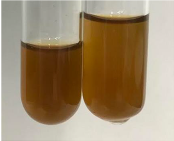
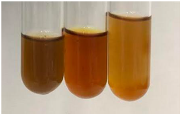
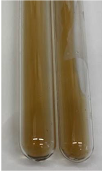
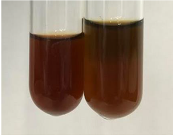
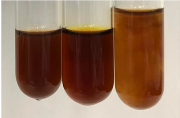
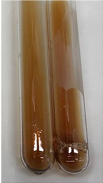
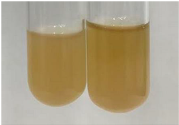
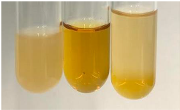
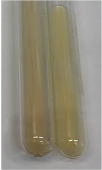
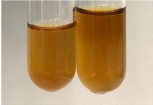
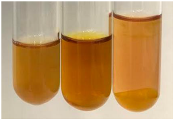
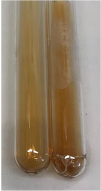
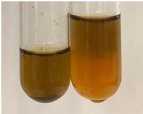
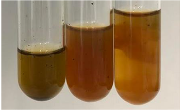
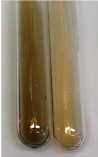
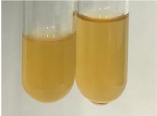
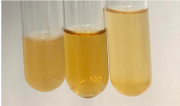
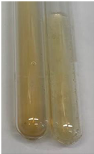
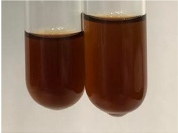
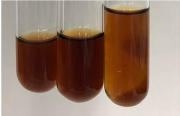
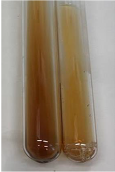
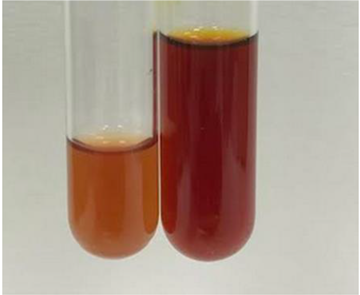
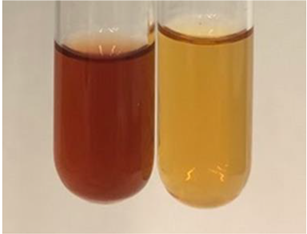
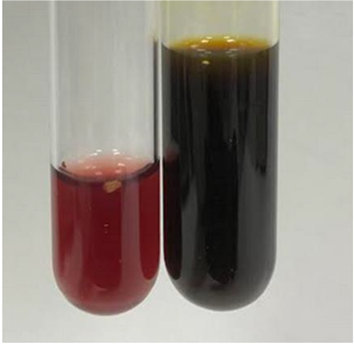
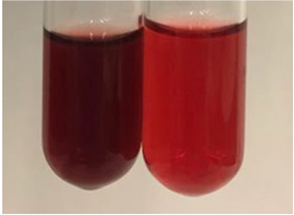
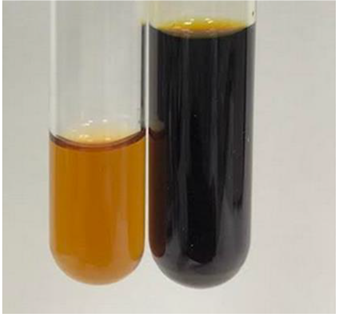
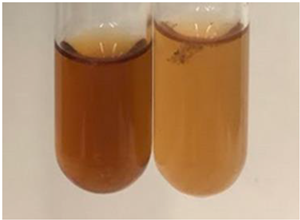
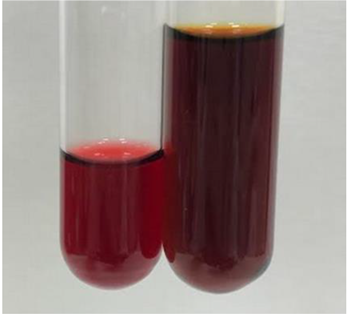
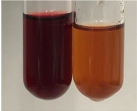
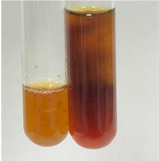
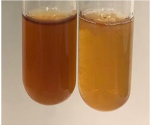
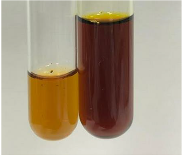
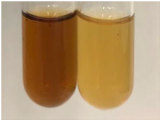
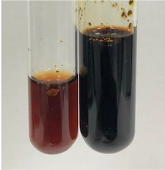
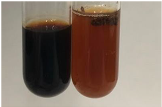
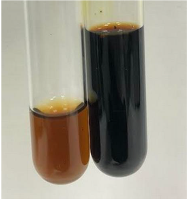
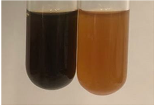
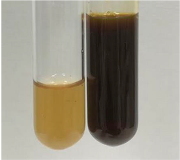
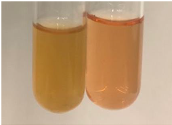
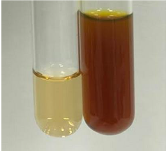
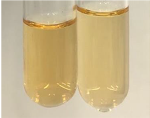
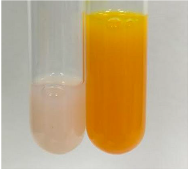
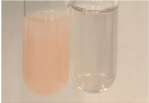
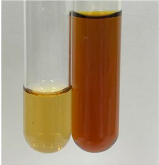
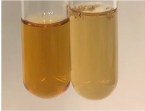
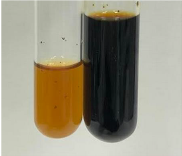
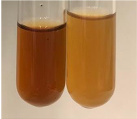
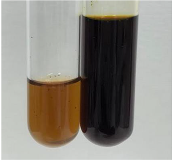
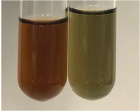
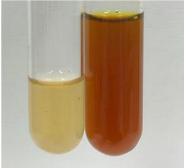
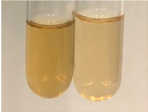
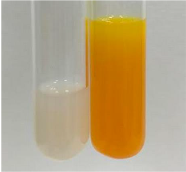
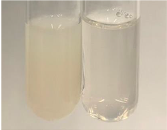
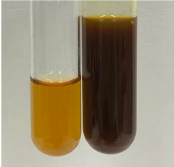
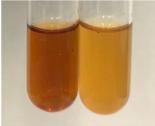
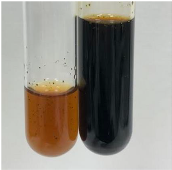
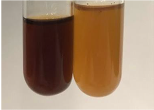
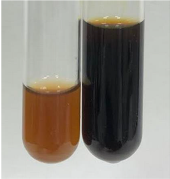
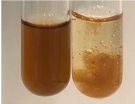
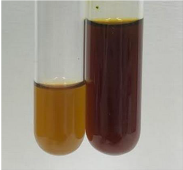
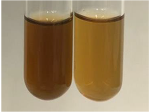
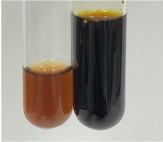
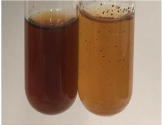
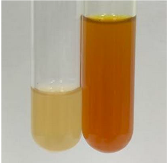
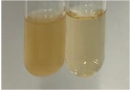
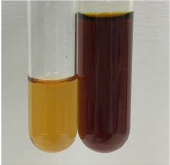
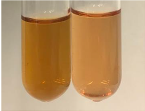
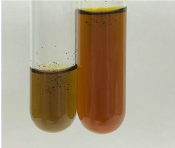
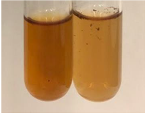
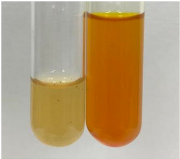
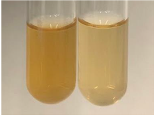
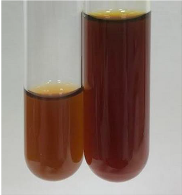
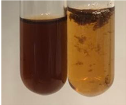
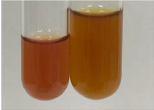
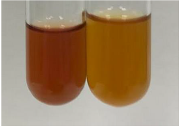
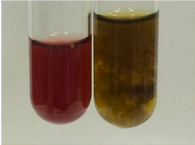
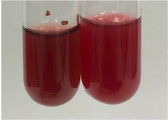
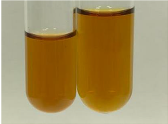
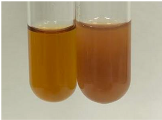
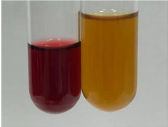
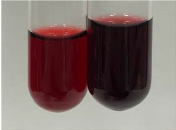
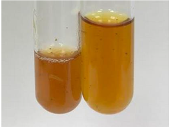
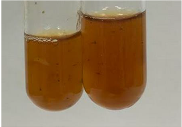
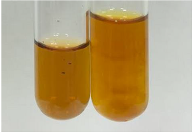
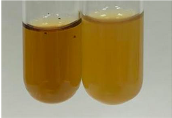
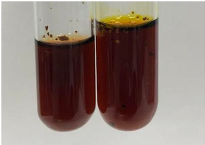
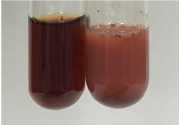
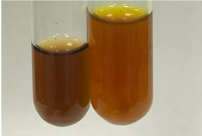
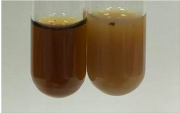
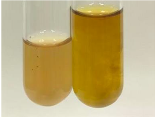
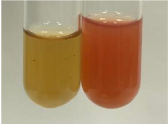
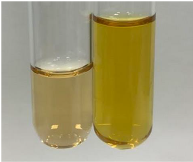
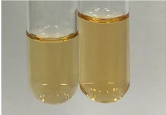
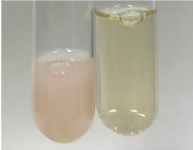
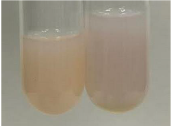
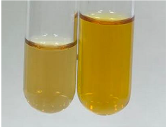
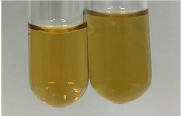
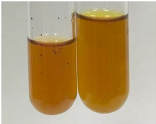
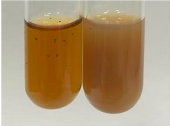
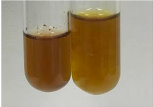
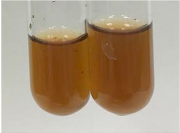
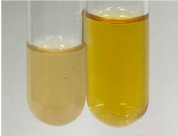
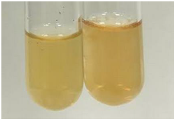
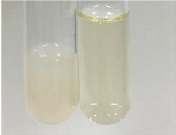
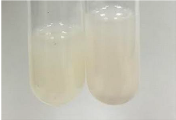
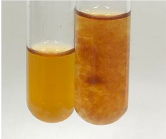
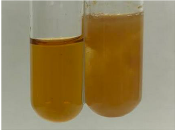
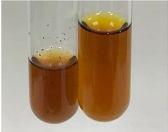
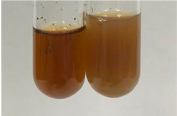
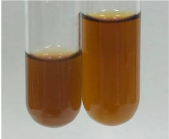
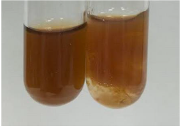
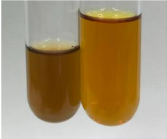
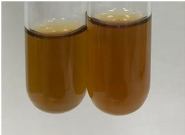
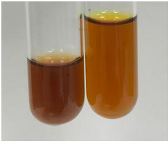
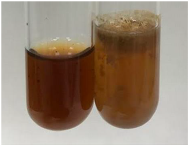
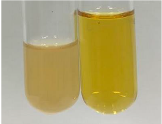
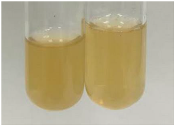
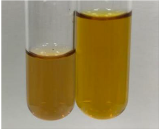
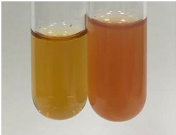
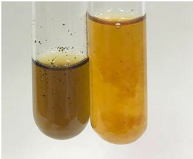
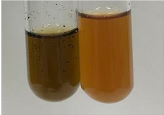
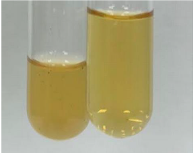
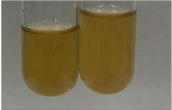
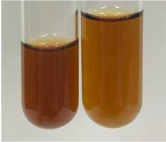
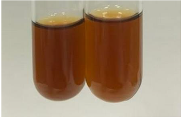
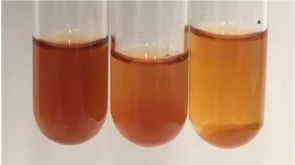
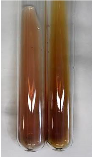
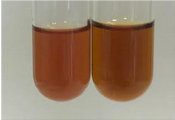
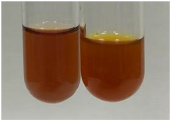
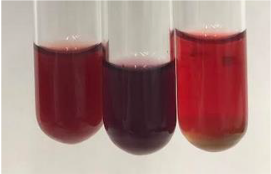
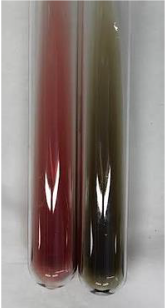
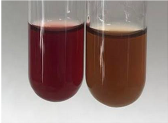
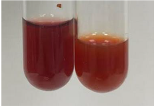
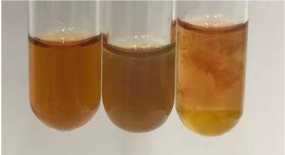
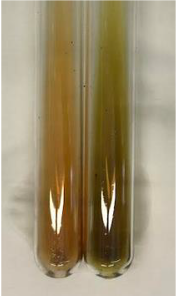
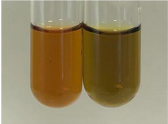
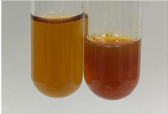
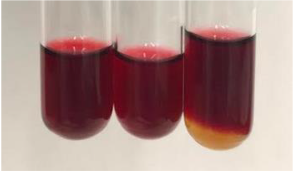
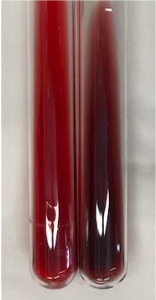
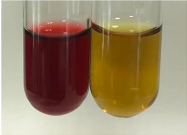
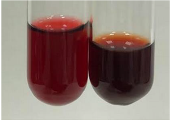
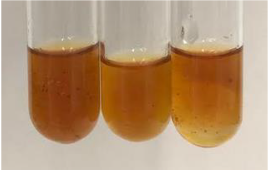
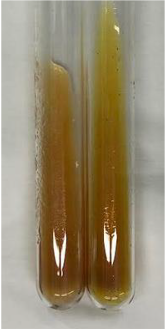
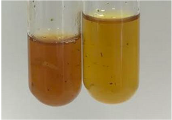
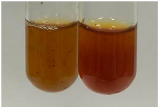
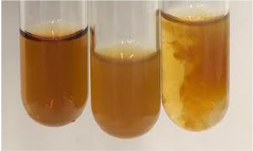
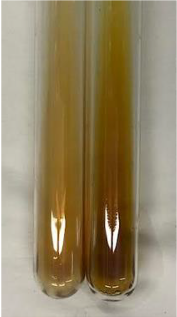
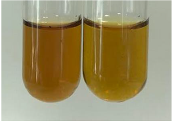
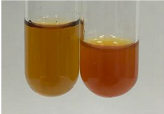
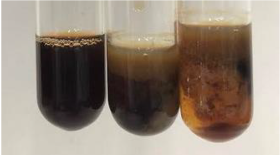
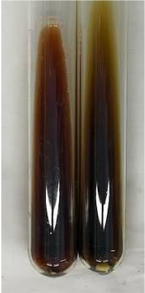
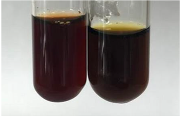
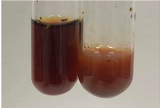
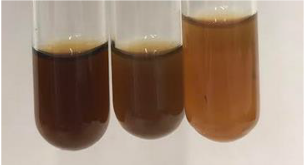
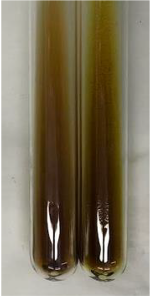
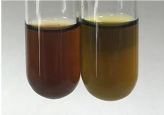
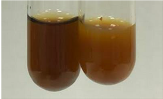
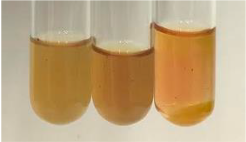
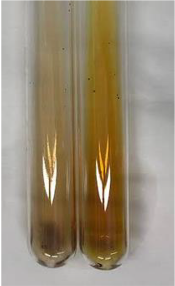
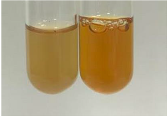
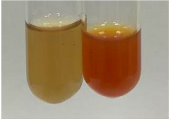
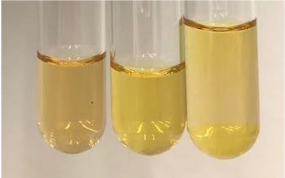
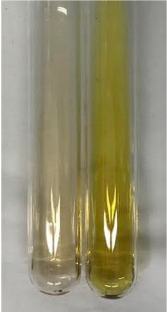
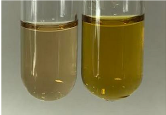
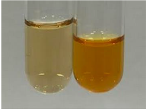
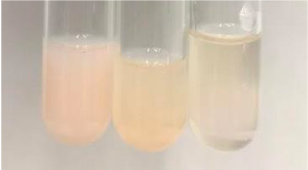
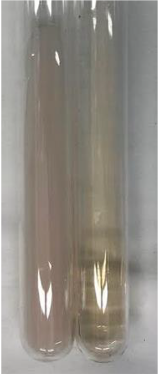
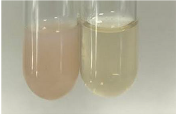
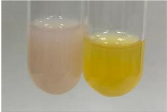
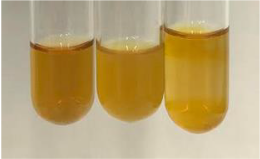
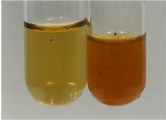
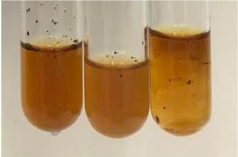
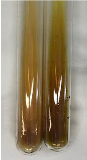
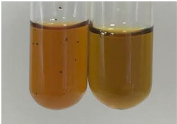
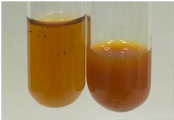
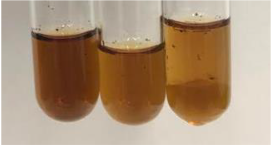
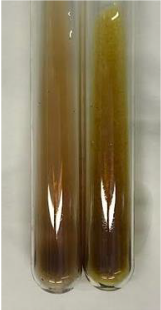
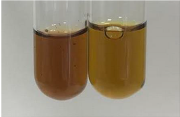
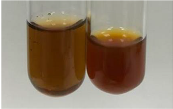
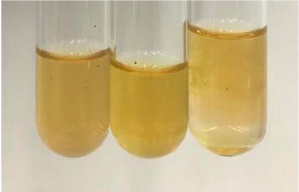
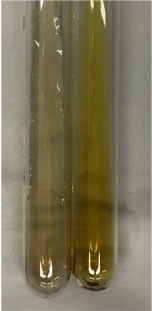
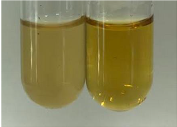
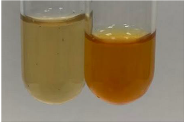
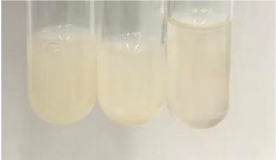
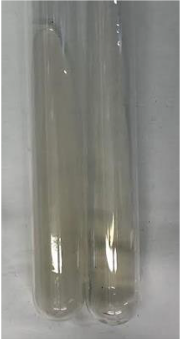
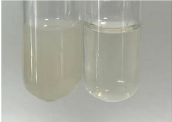
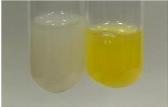
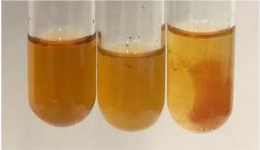
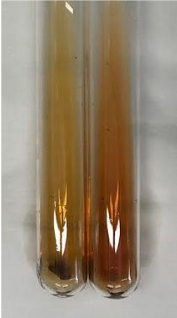
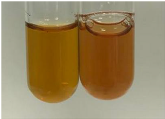
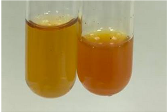
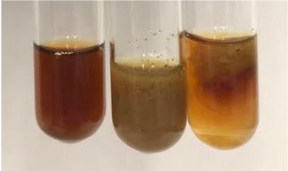
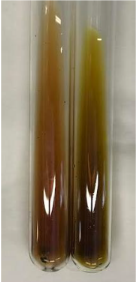
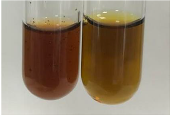
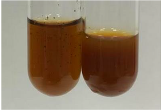
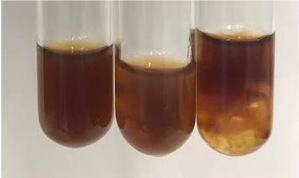
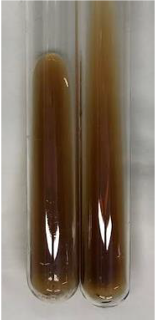
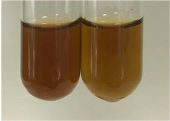
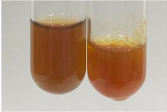
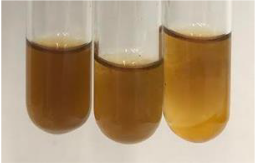
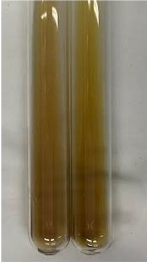
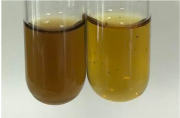
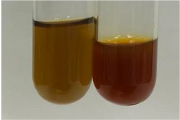
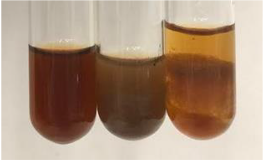
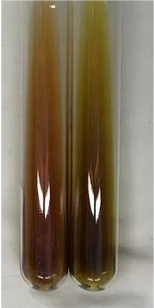
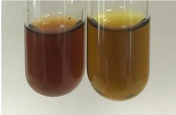
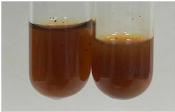
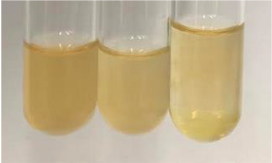
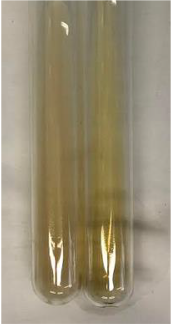
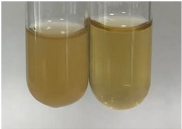
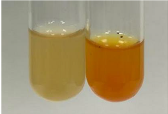
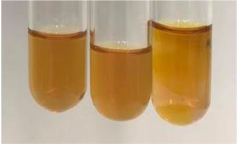
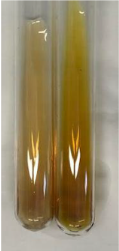
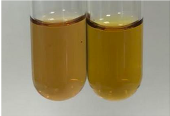
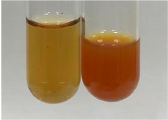
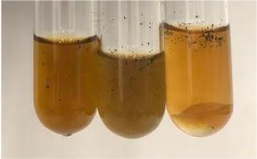
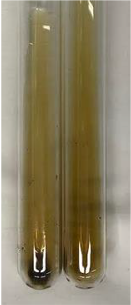
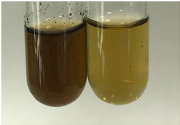
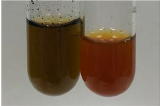
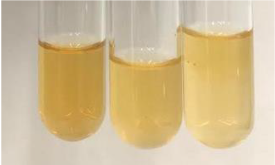
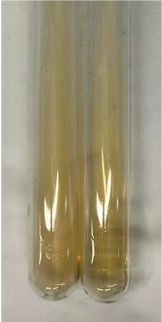
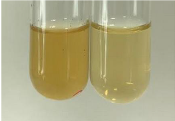
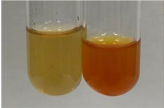
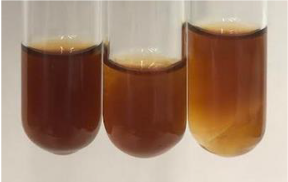
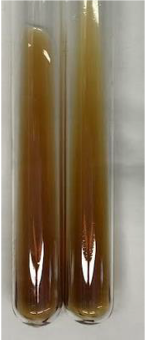
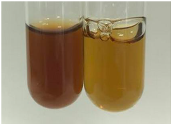
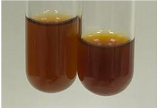
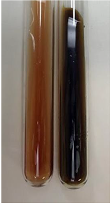
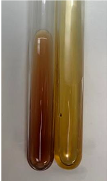
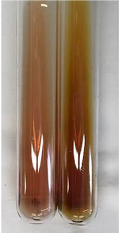
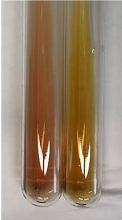
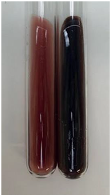
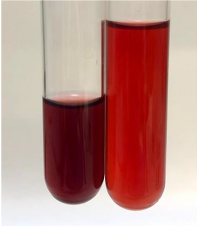
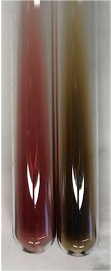
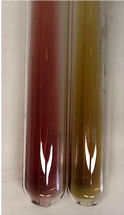
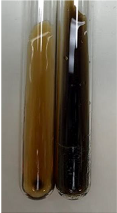
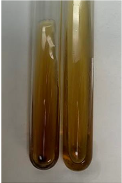
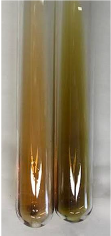
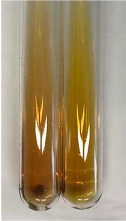
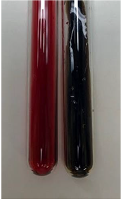
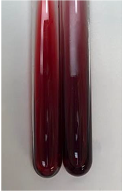
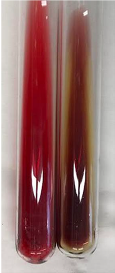
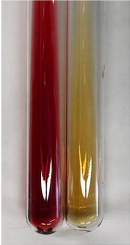
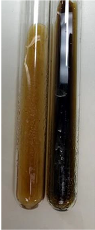
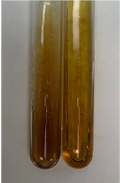
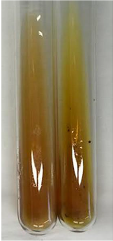
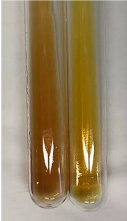
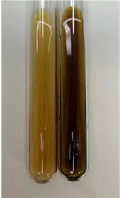
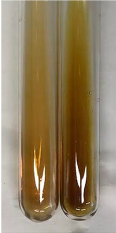
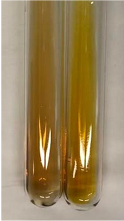
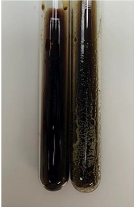
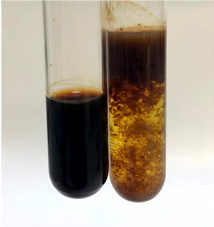
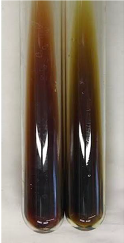
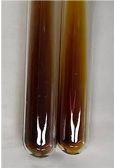
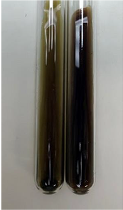
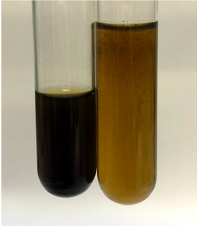
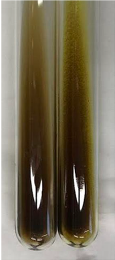
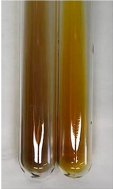
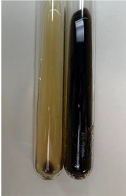
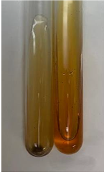
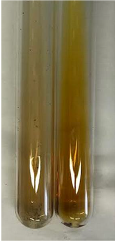
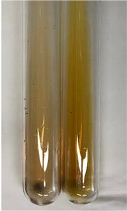
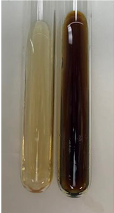
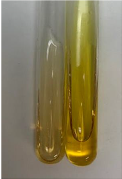
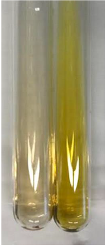
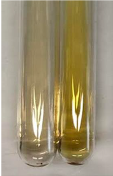
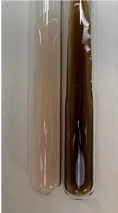
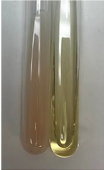
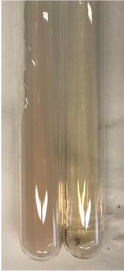
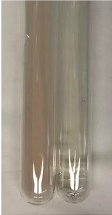
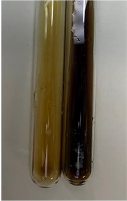
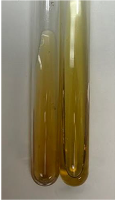
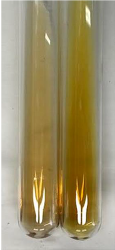
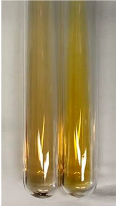
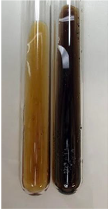
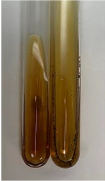
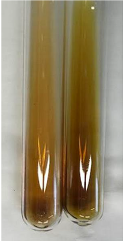
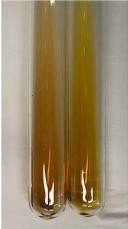
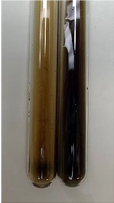
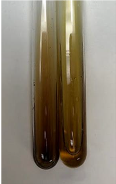
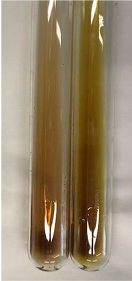
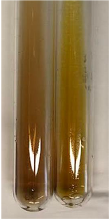
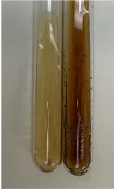
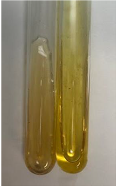
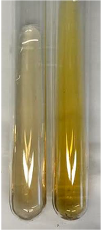
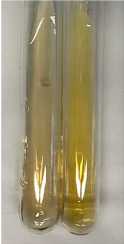
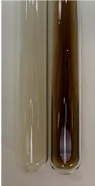
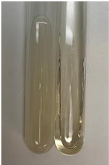
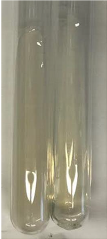
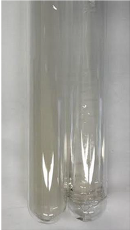
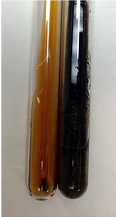
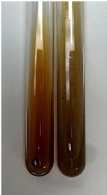
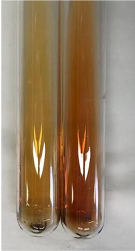
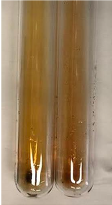
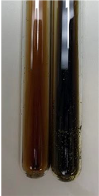
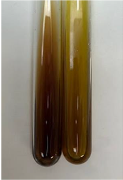
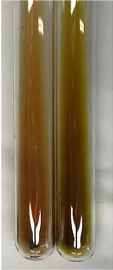
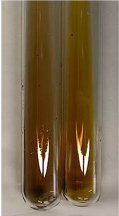
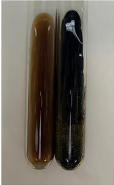
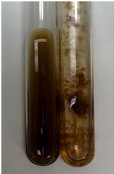
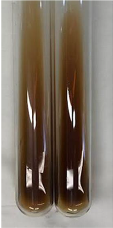
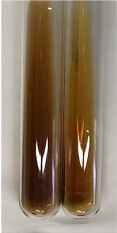
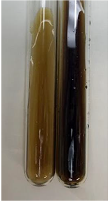
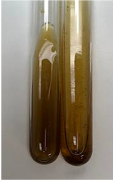
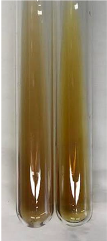
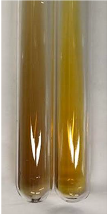
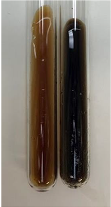
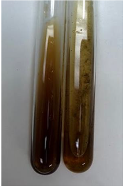
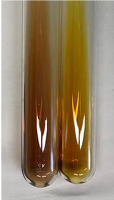
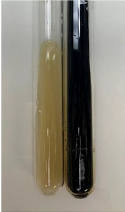
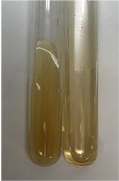
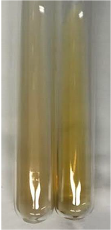
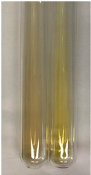
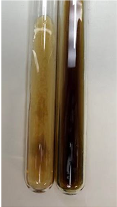
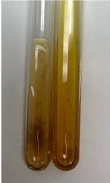
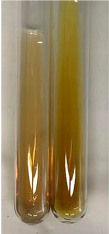
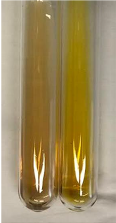
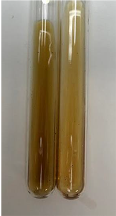
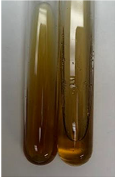
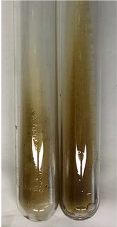
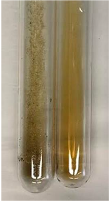
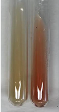

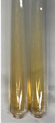
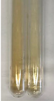


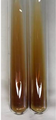
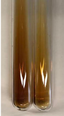
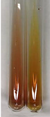

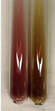
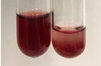
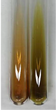
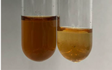
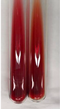

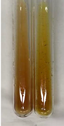

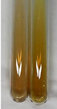

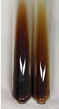
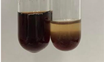
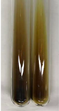

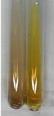

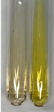

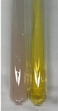

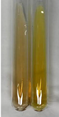

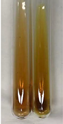

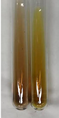

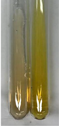

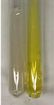

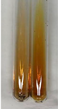

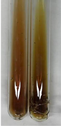

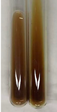

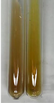

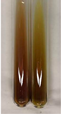

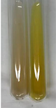

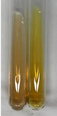

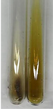

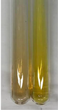

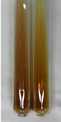


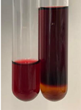


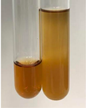

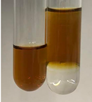

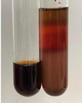

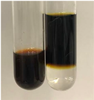

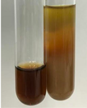


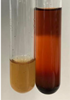


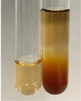


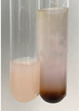


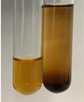


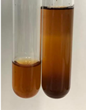


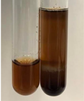


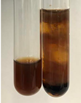


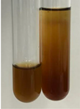


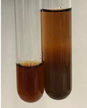


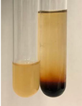


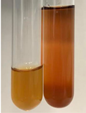


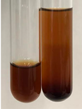


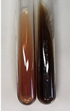

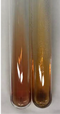

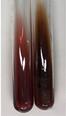

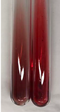


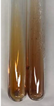

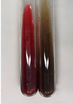

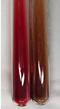

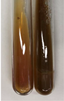

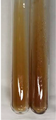


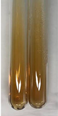

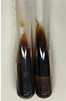

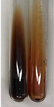

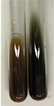

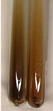

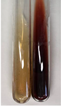

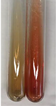

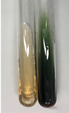





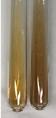

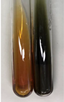

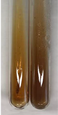

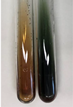

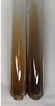

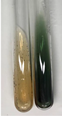

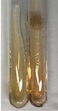

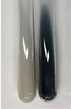

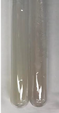

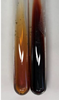

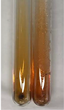

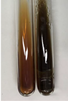

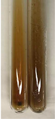


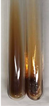

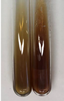

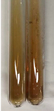

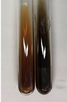

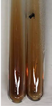

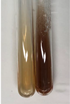

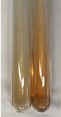

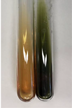

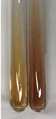

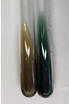

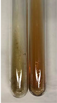

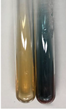




Disclaimer/Publisher’s Note: The statements, opinions and data contained in all publications are solely those of the individual author(s) and contributor(s) and not of MDPI and/or the editor(s). MDPI and/or the editor(s) disclaim responsibility for any injury to people or property resulting from any ideas, methods, instructions or products referred to in the content. |
© 2023 by the authors. Licensee MDPI, Basel, Switzerland. This article is an open access article distributed under the terms and conditions of the Creative Commons Attribution (CC BY) license (https://creativecommons.org/licenses/by/4.0/).