
Structural Dynamics, Phonon Spectra and Thermal Transport in the Silicon Clathrates


Abstract
1. Introduction
2. Computational Modelling
3. Results and Discussion
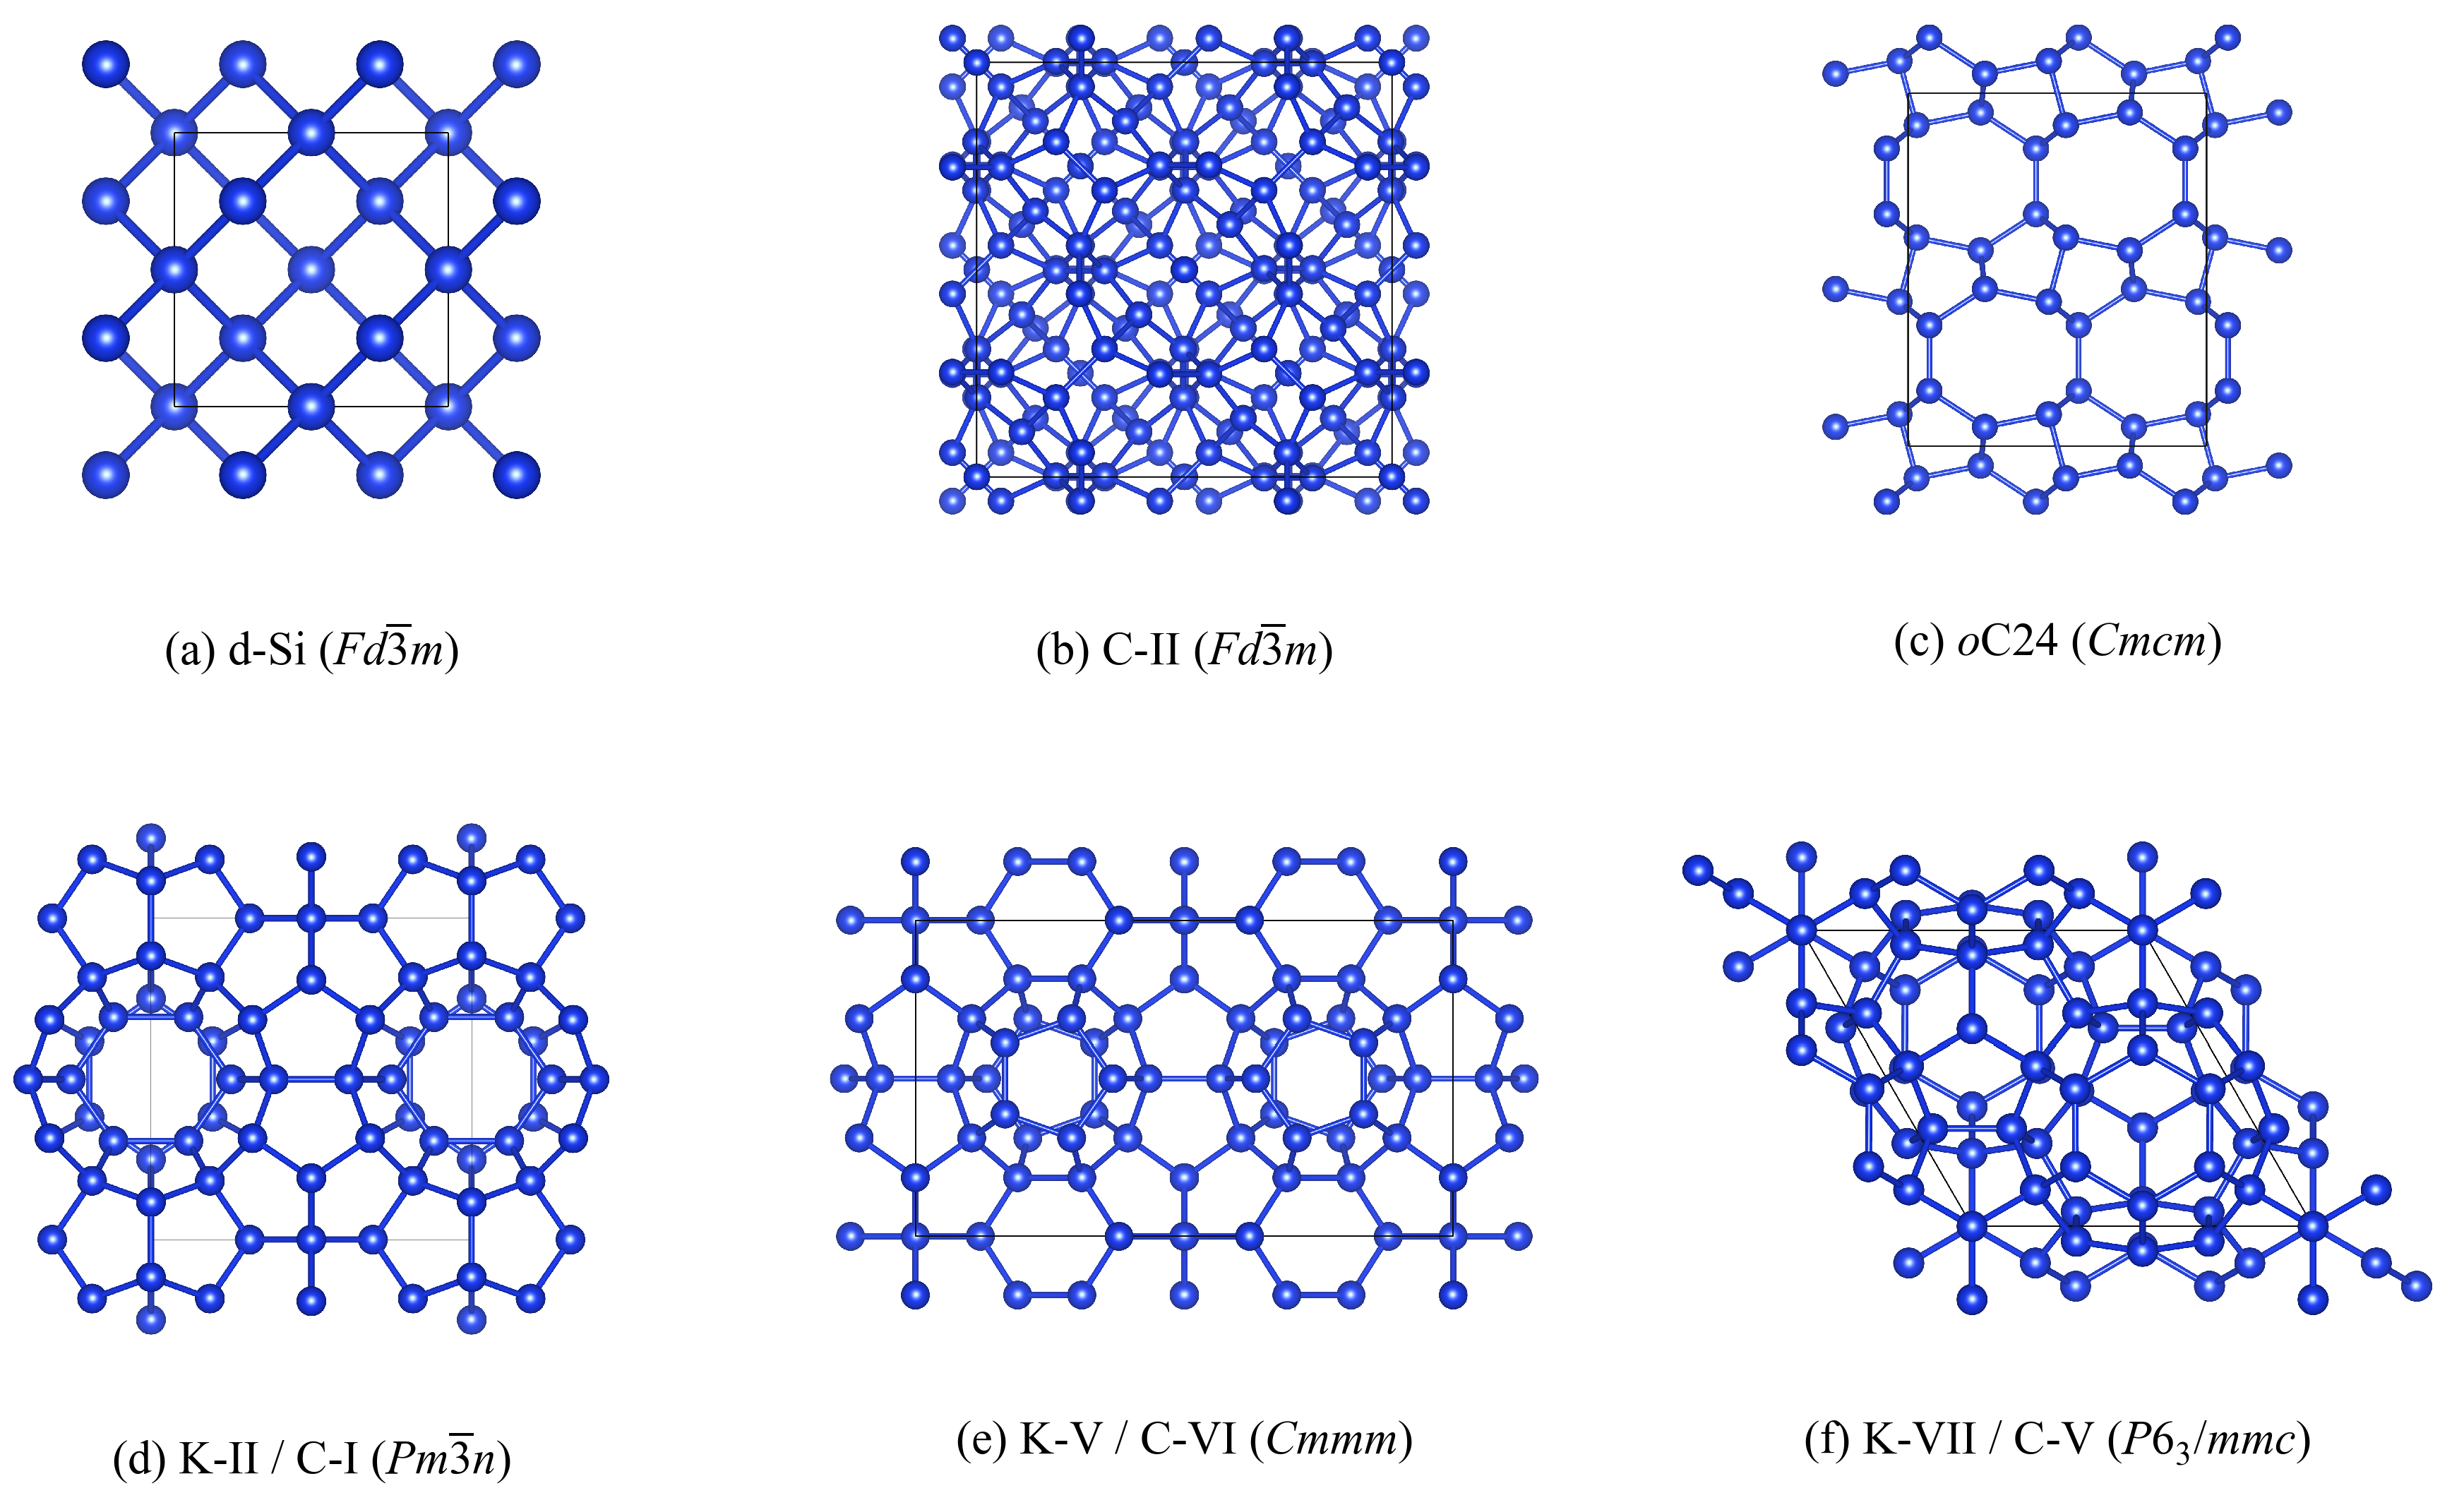
3.1. Selection of Framework Structures
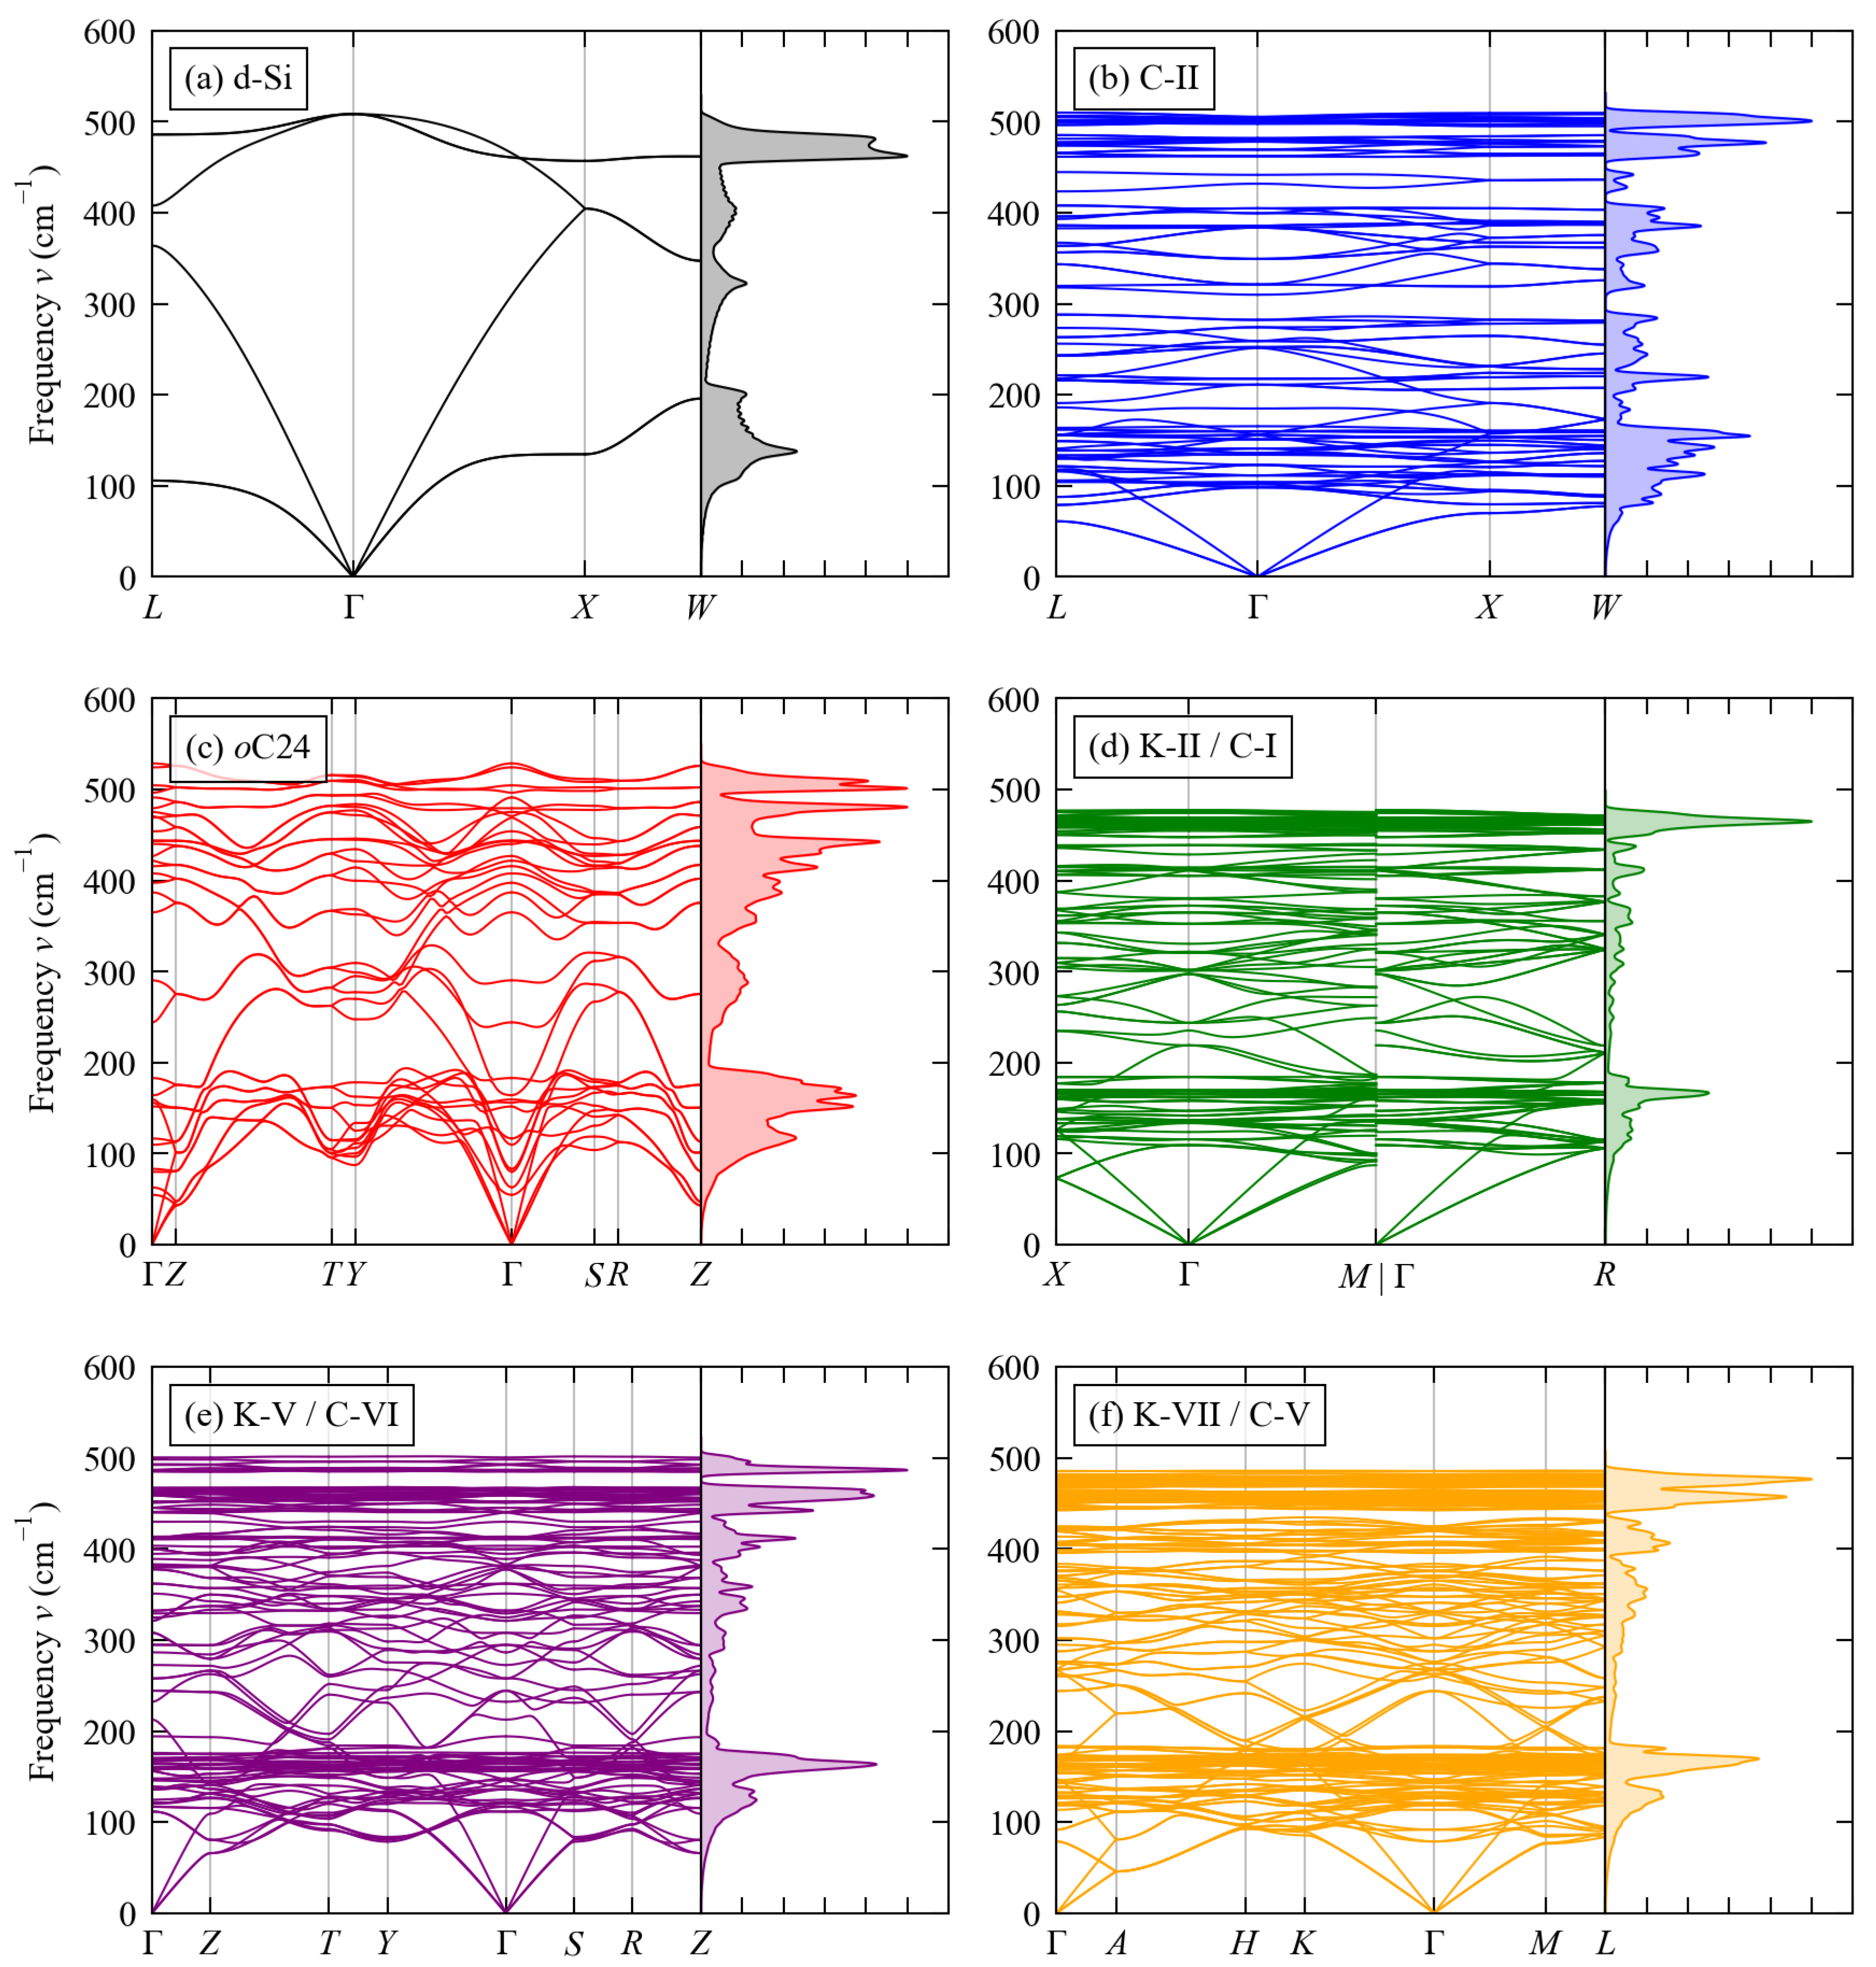
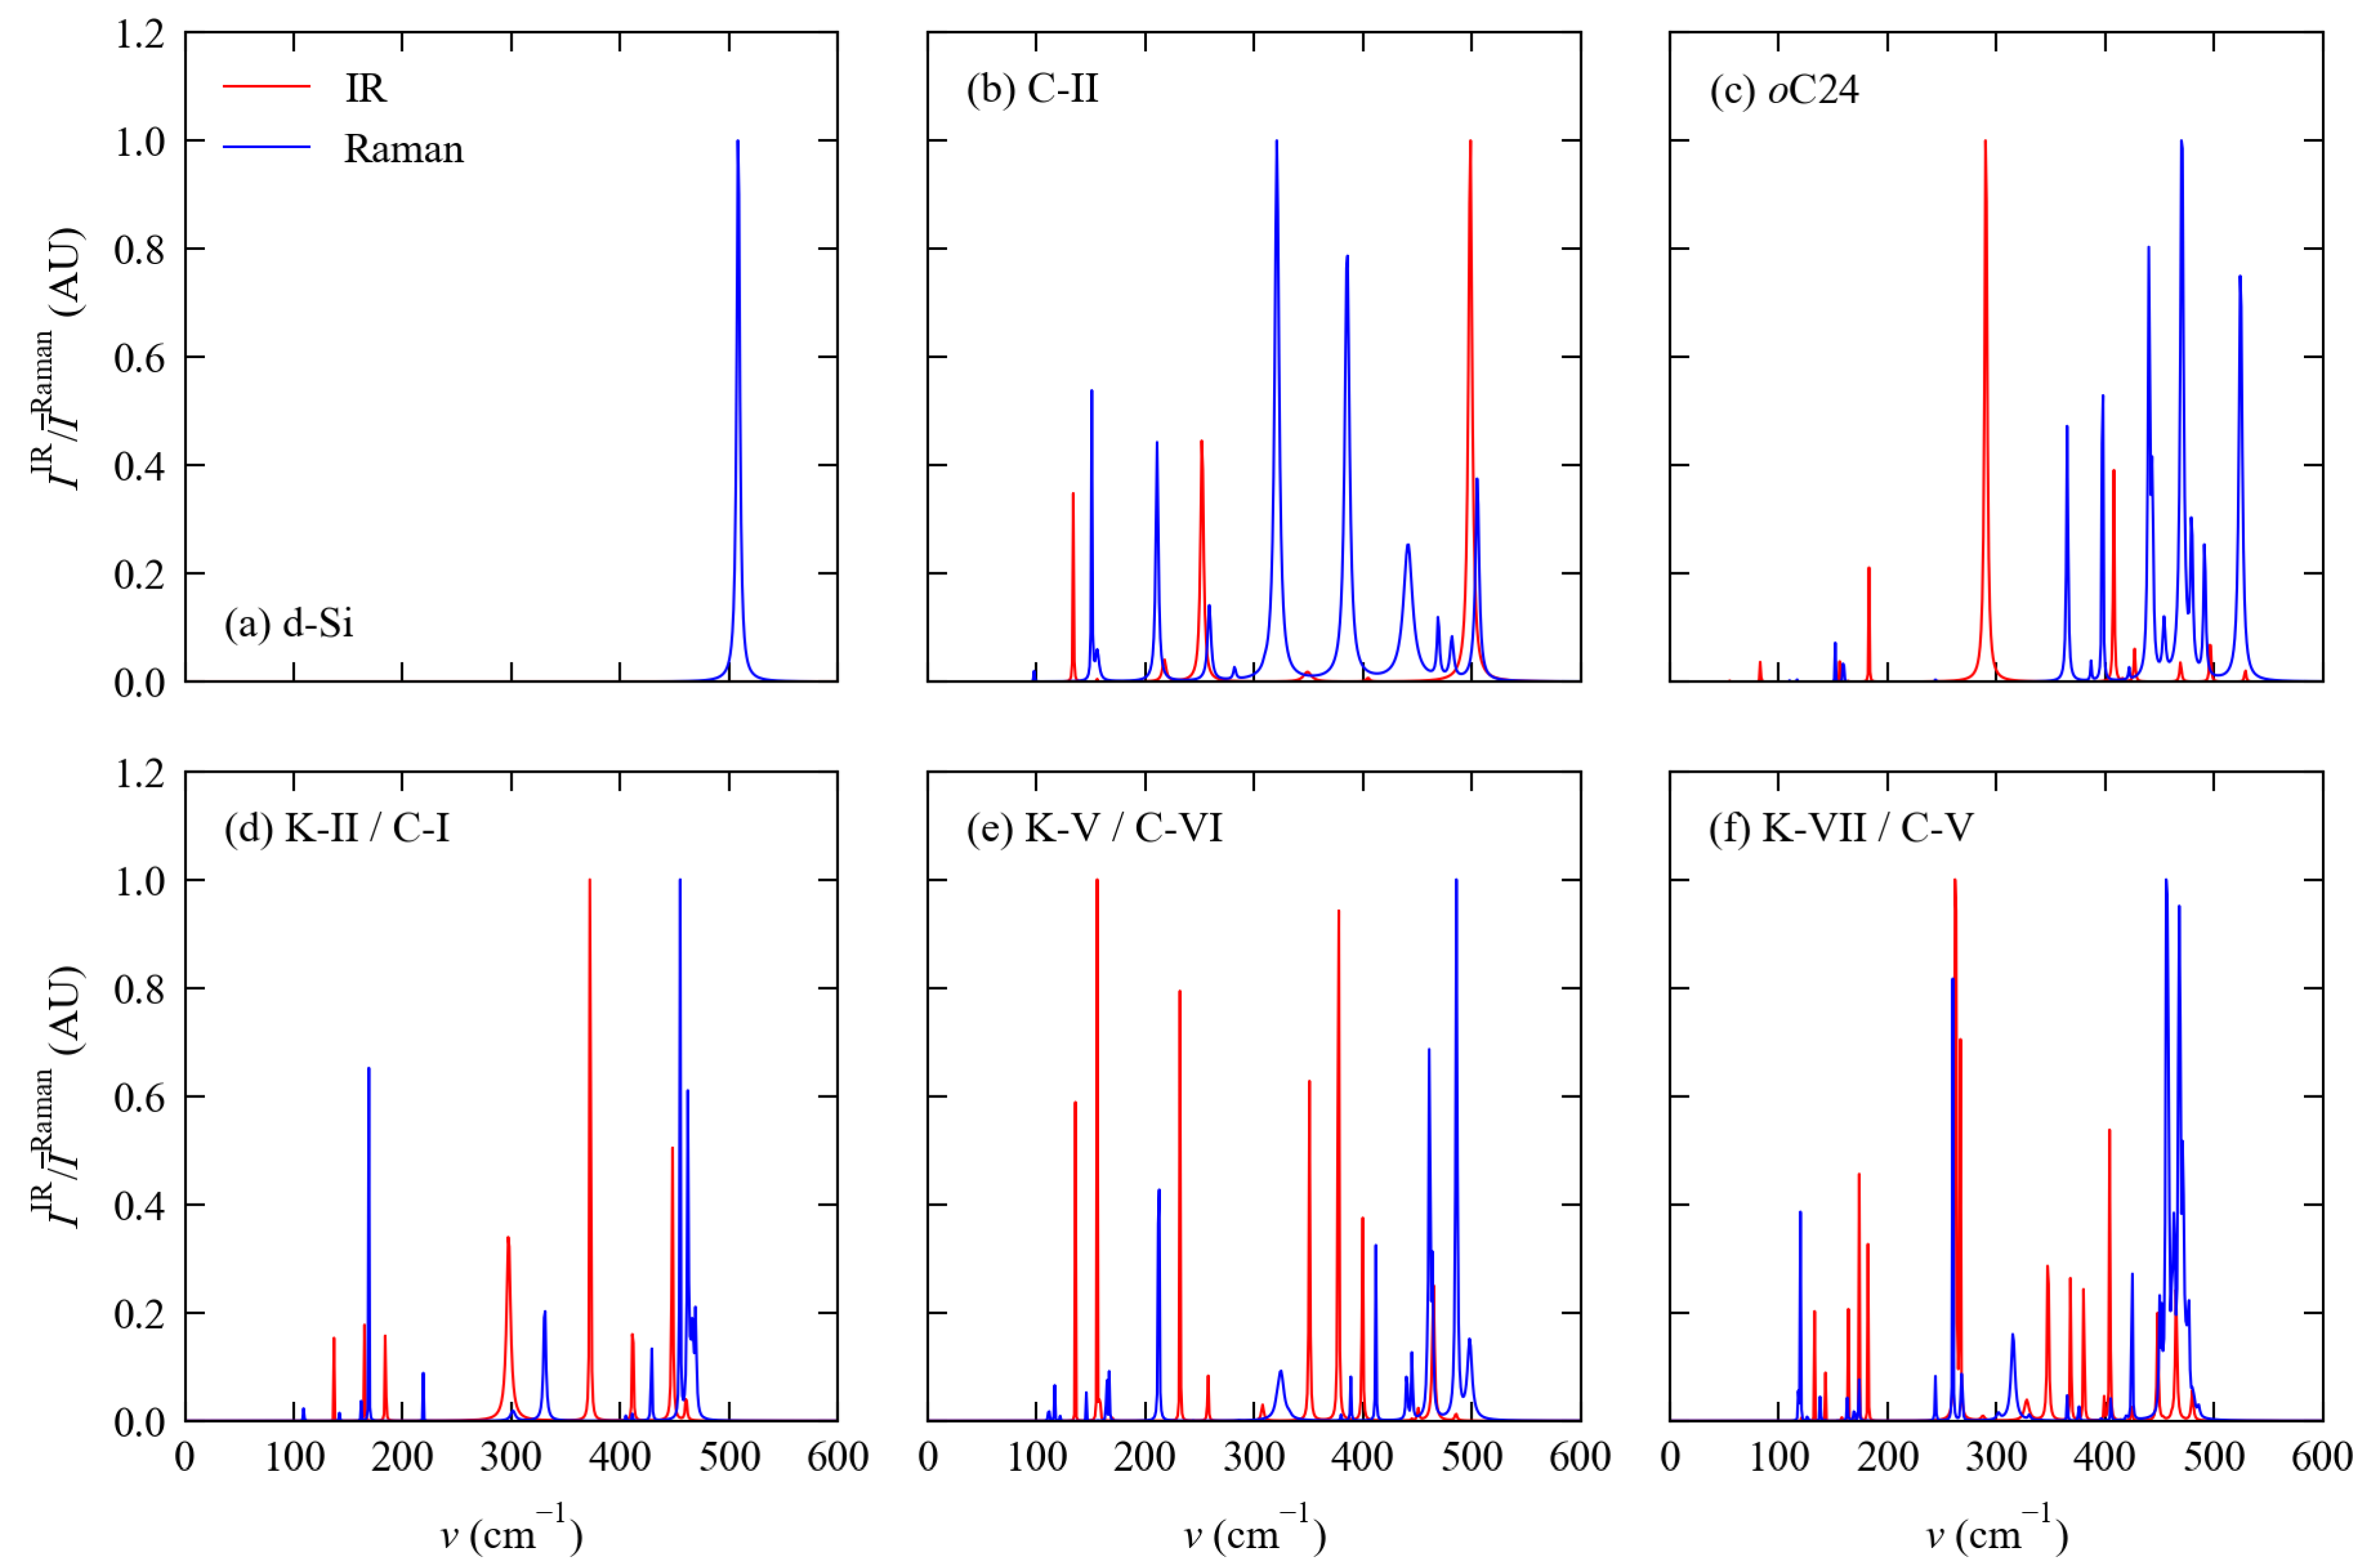
3.2. Phonon Spectra
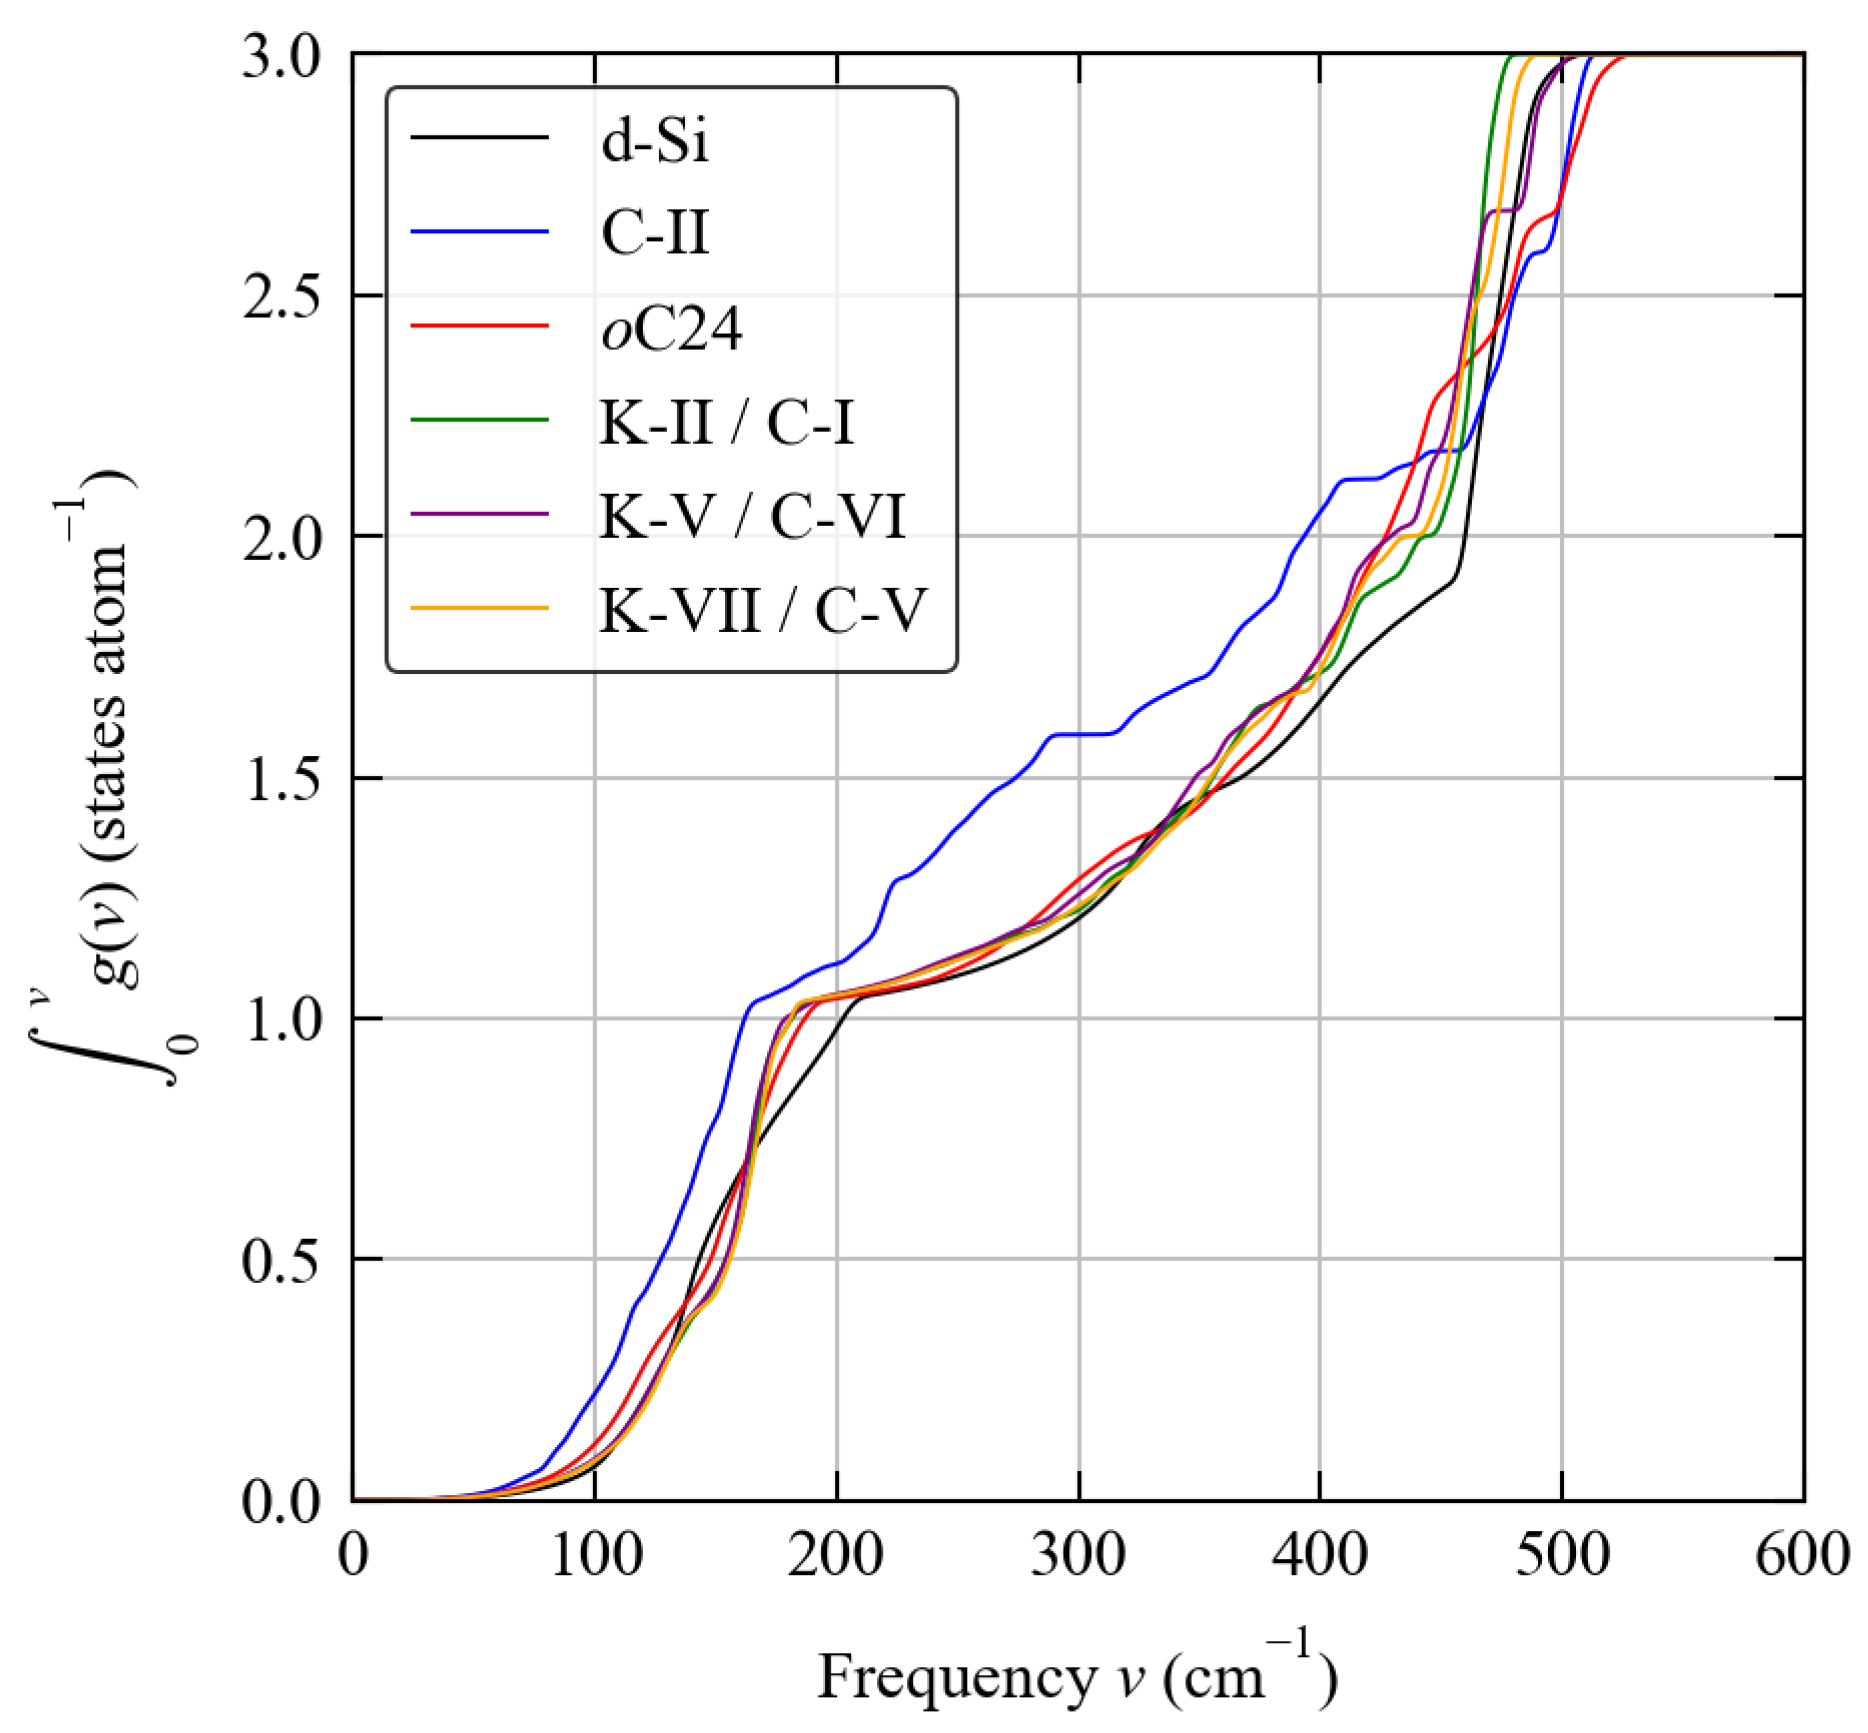
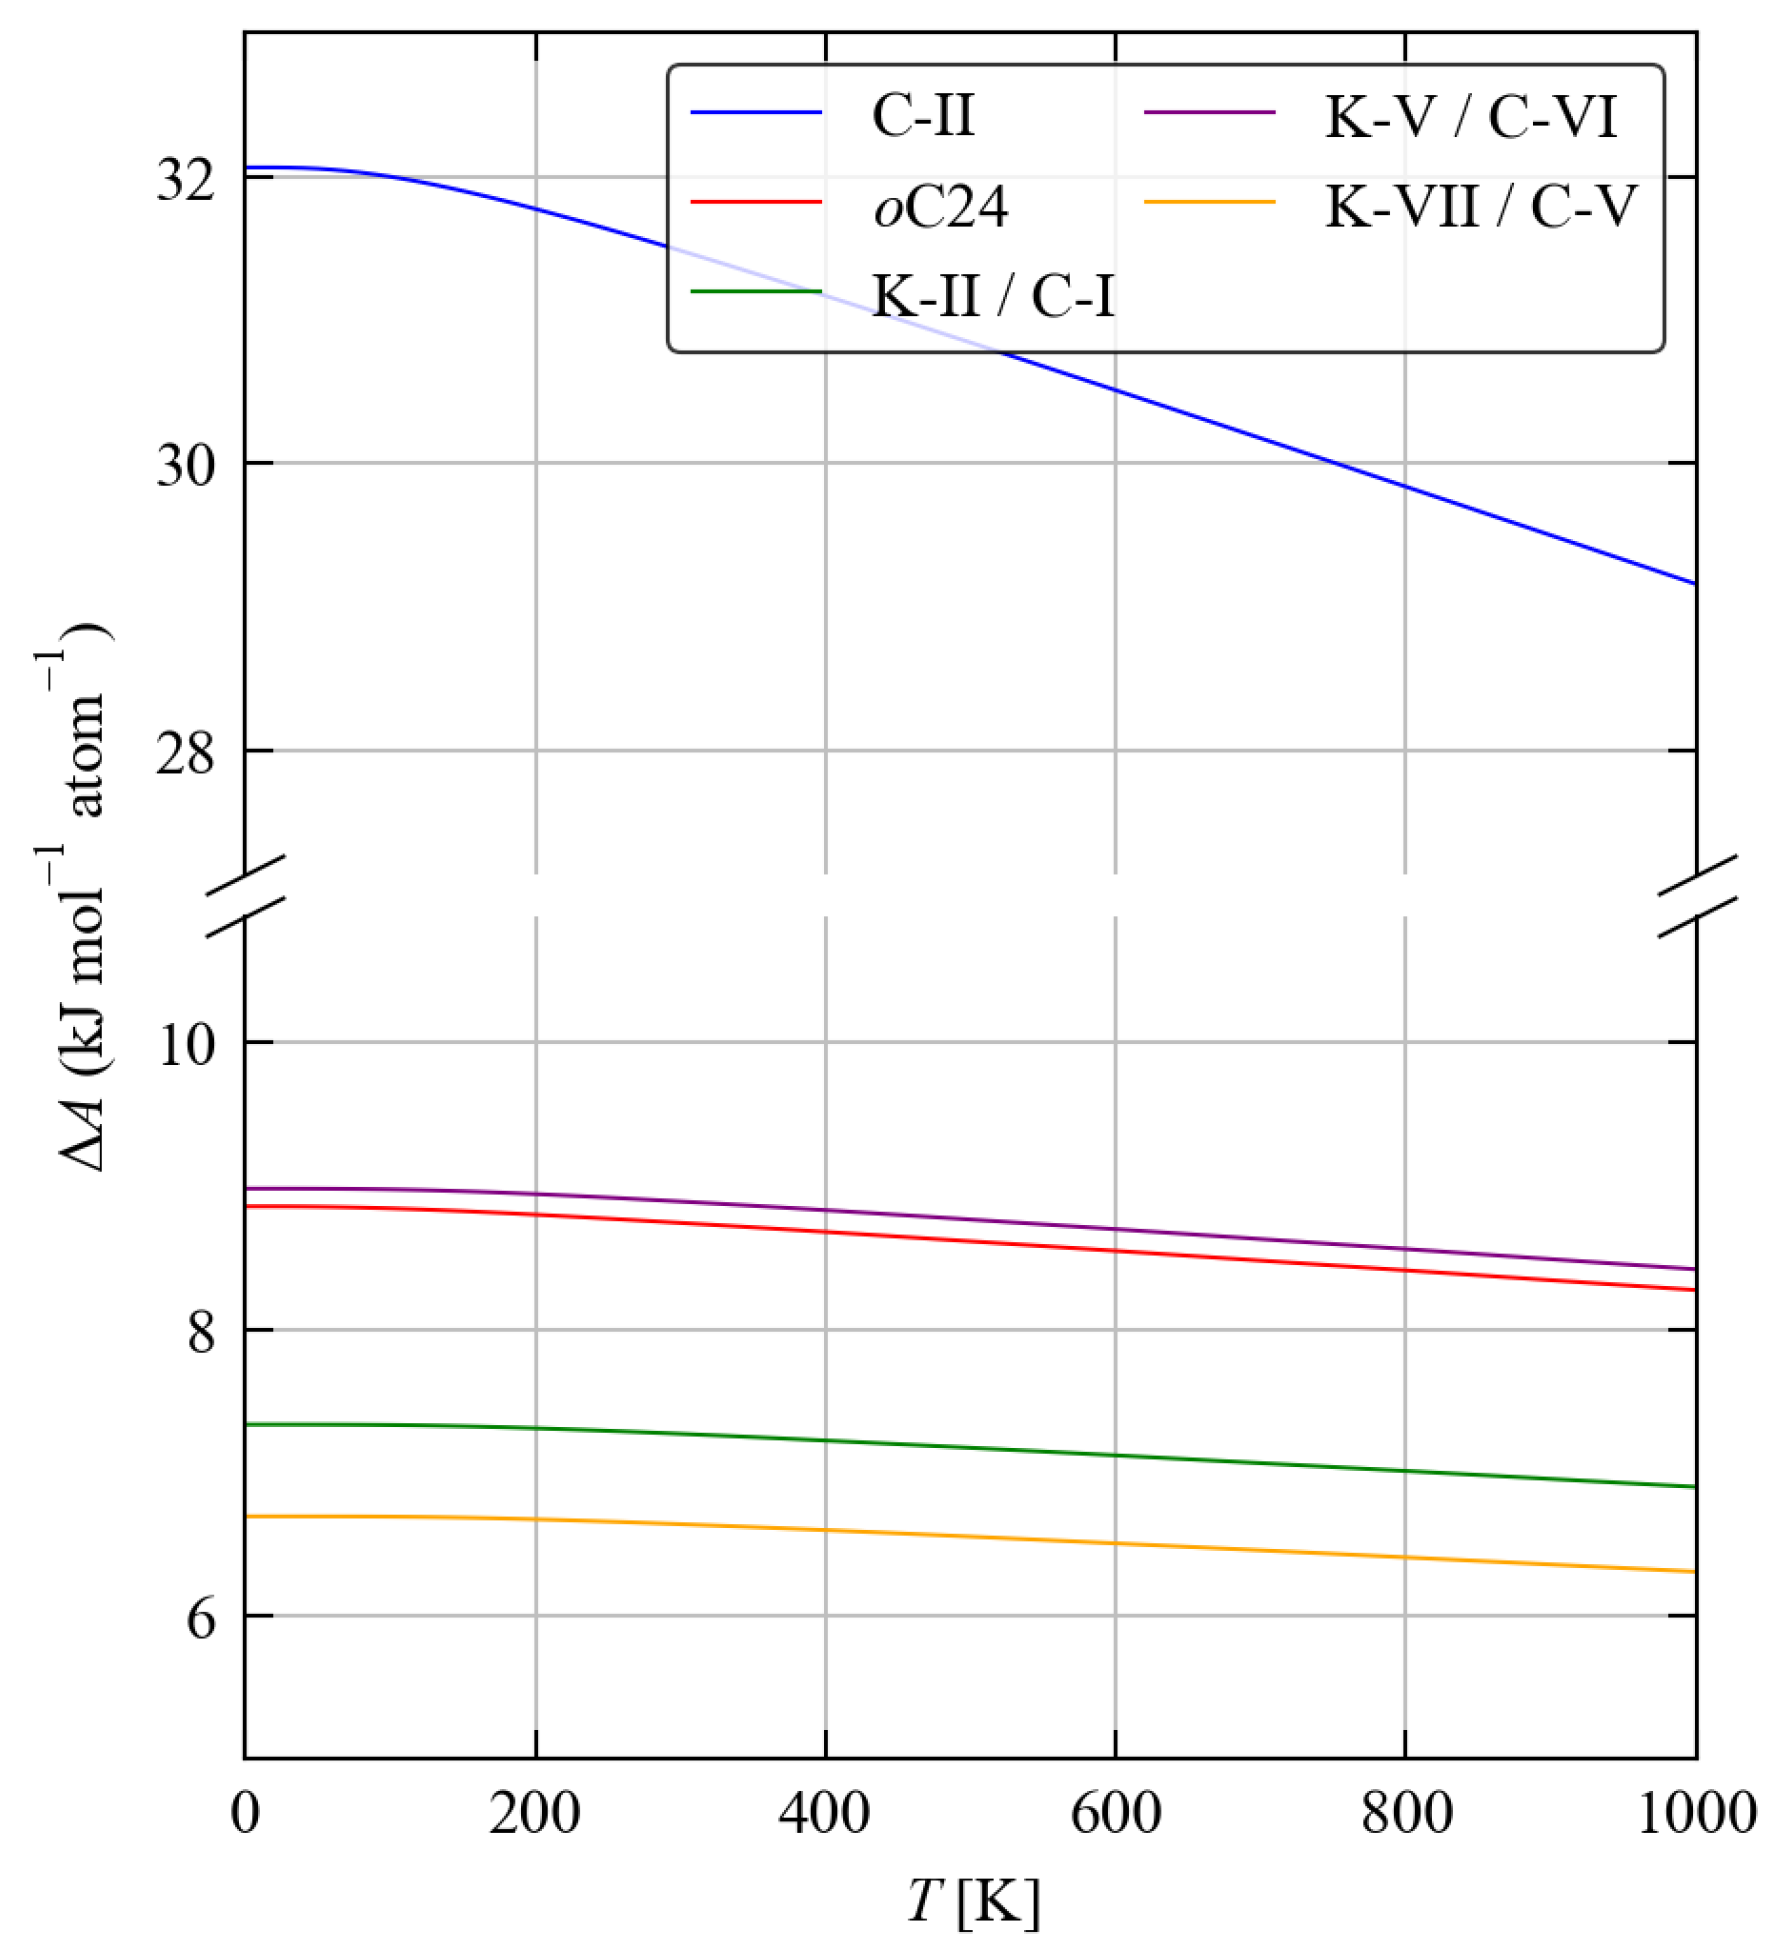
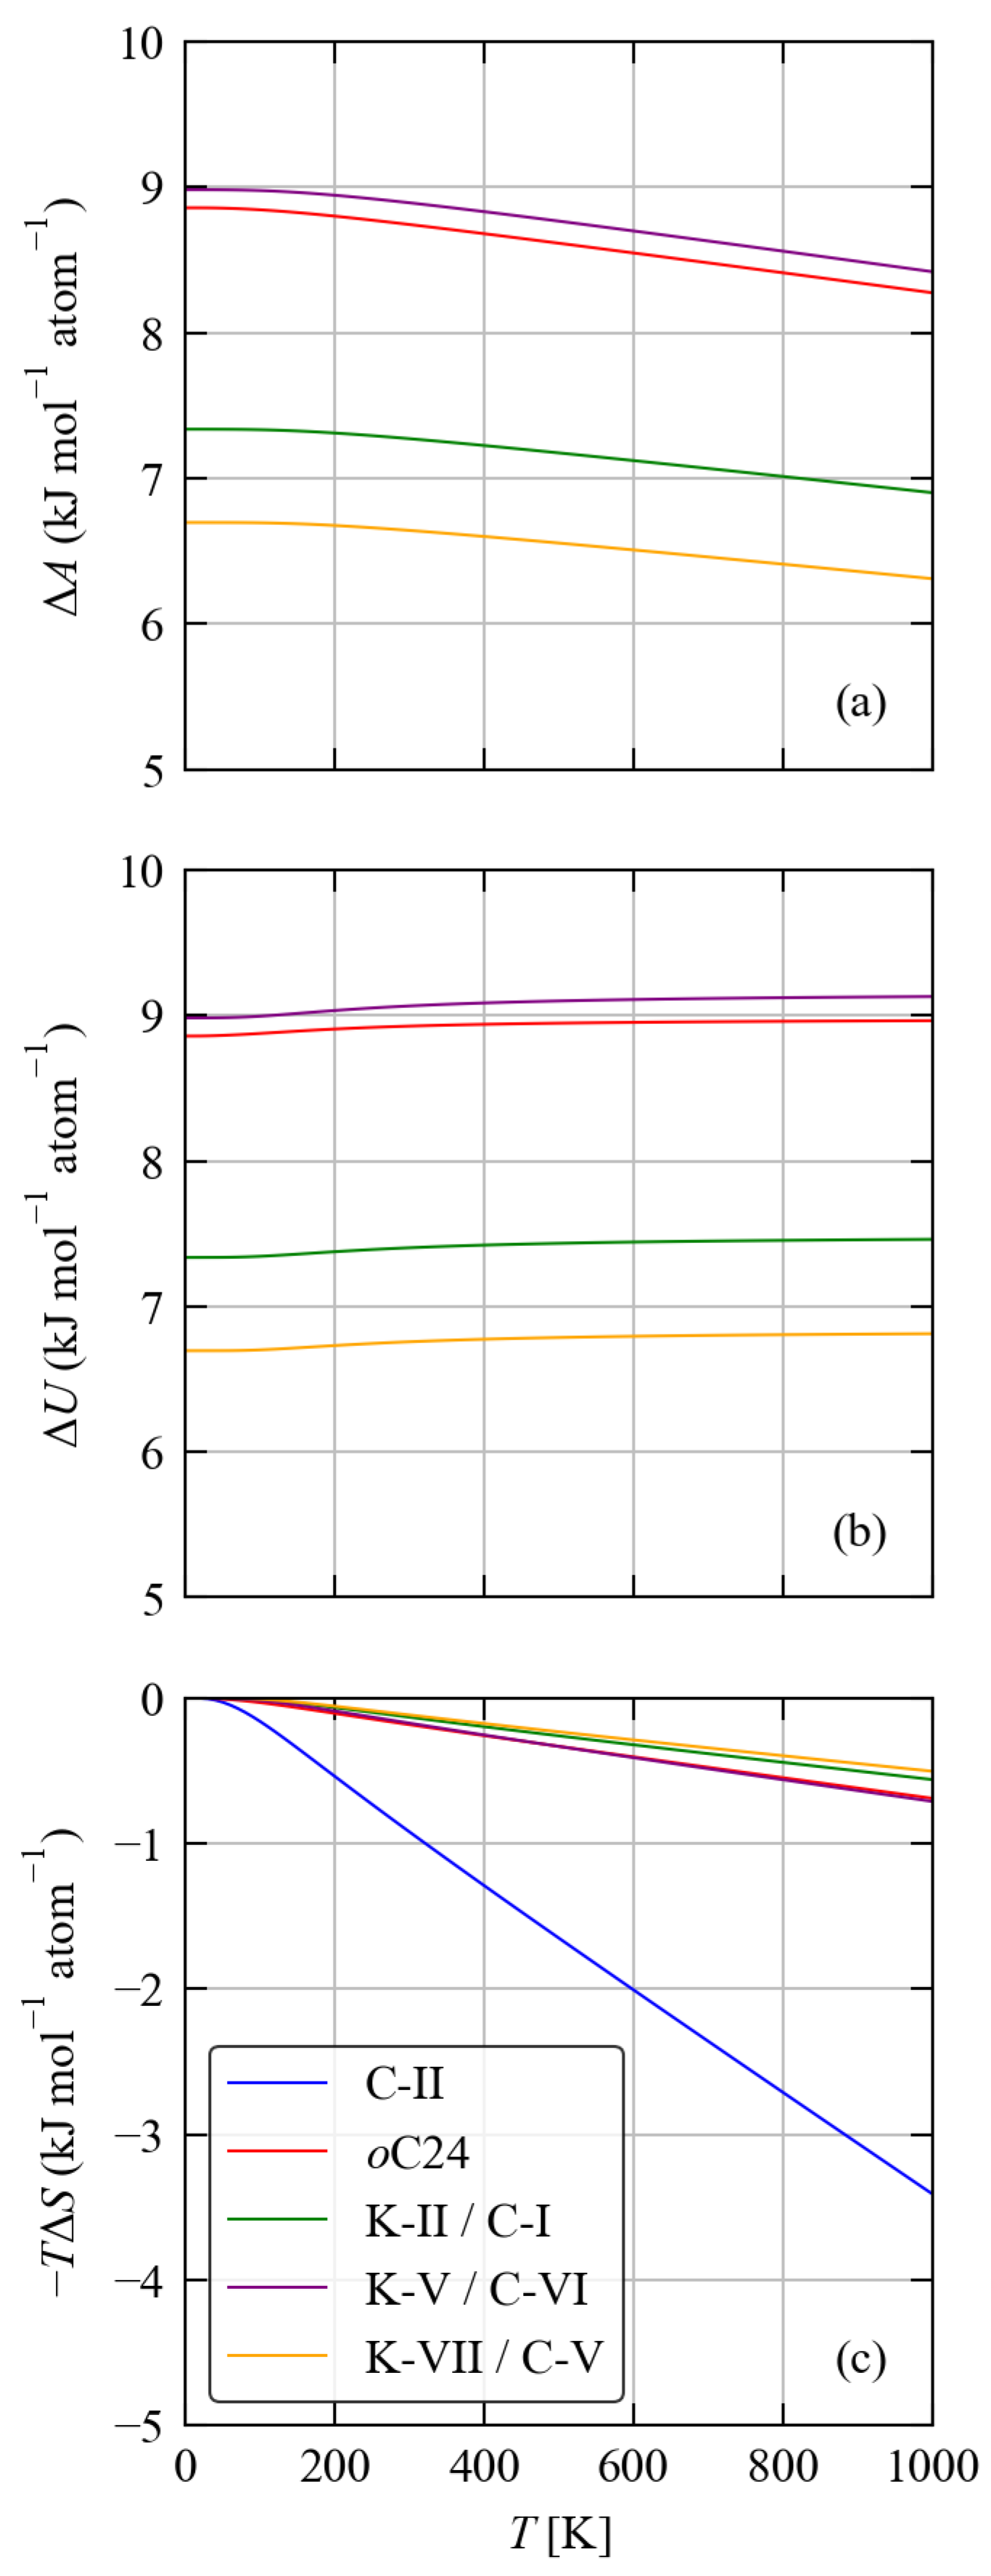
3.3. Thermodynamics
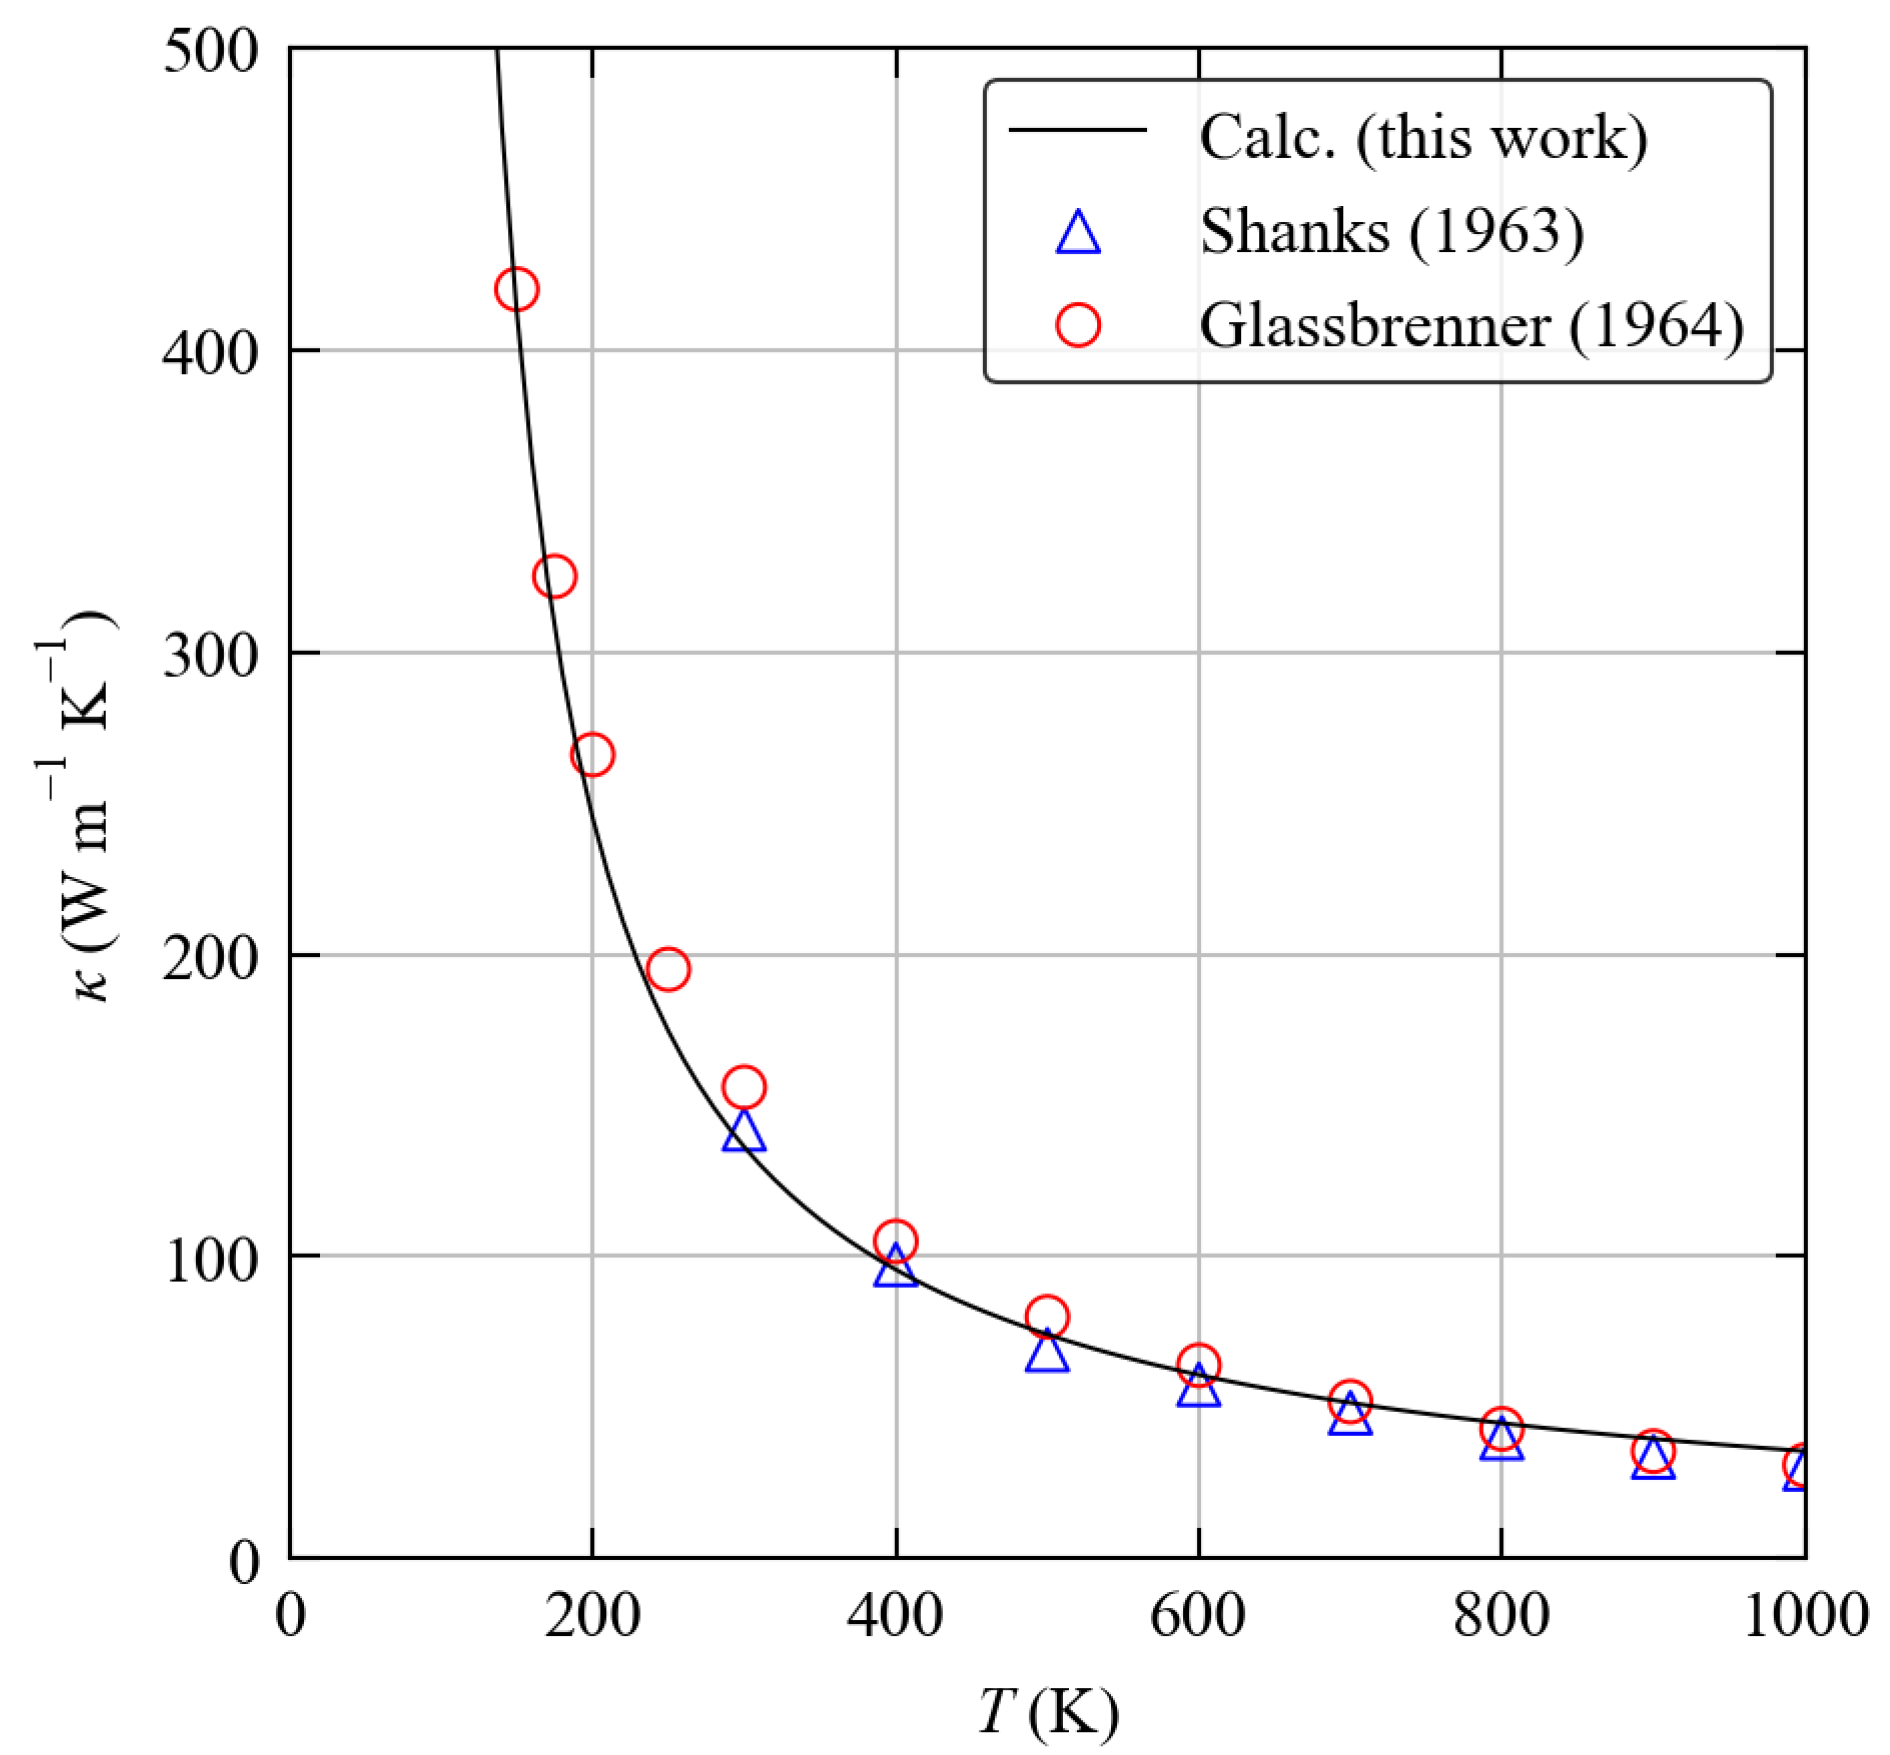
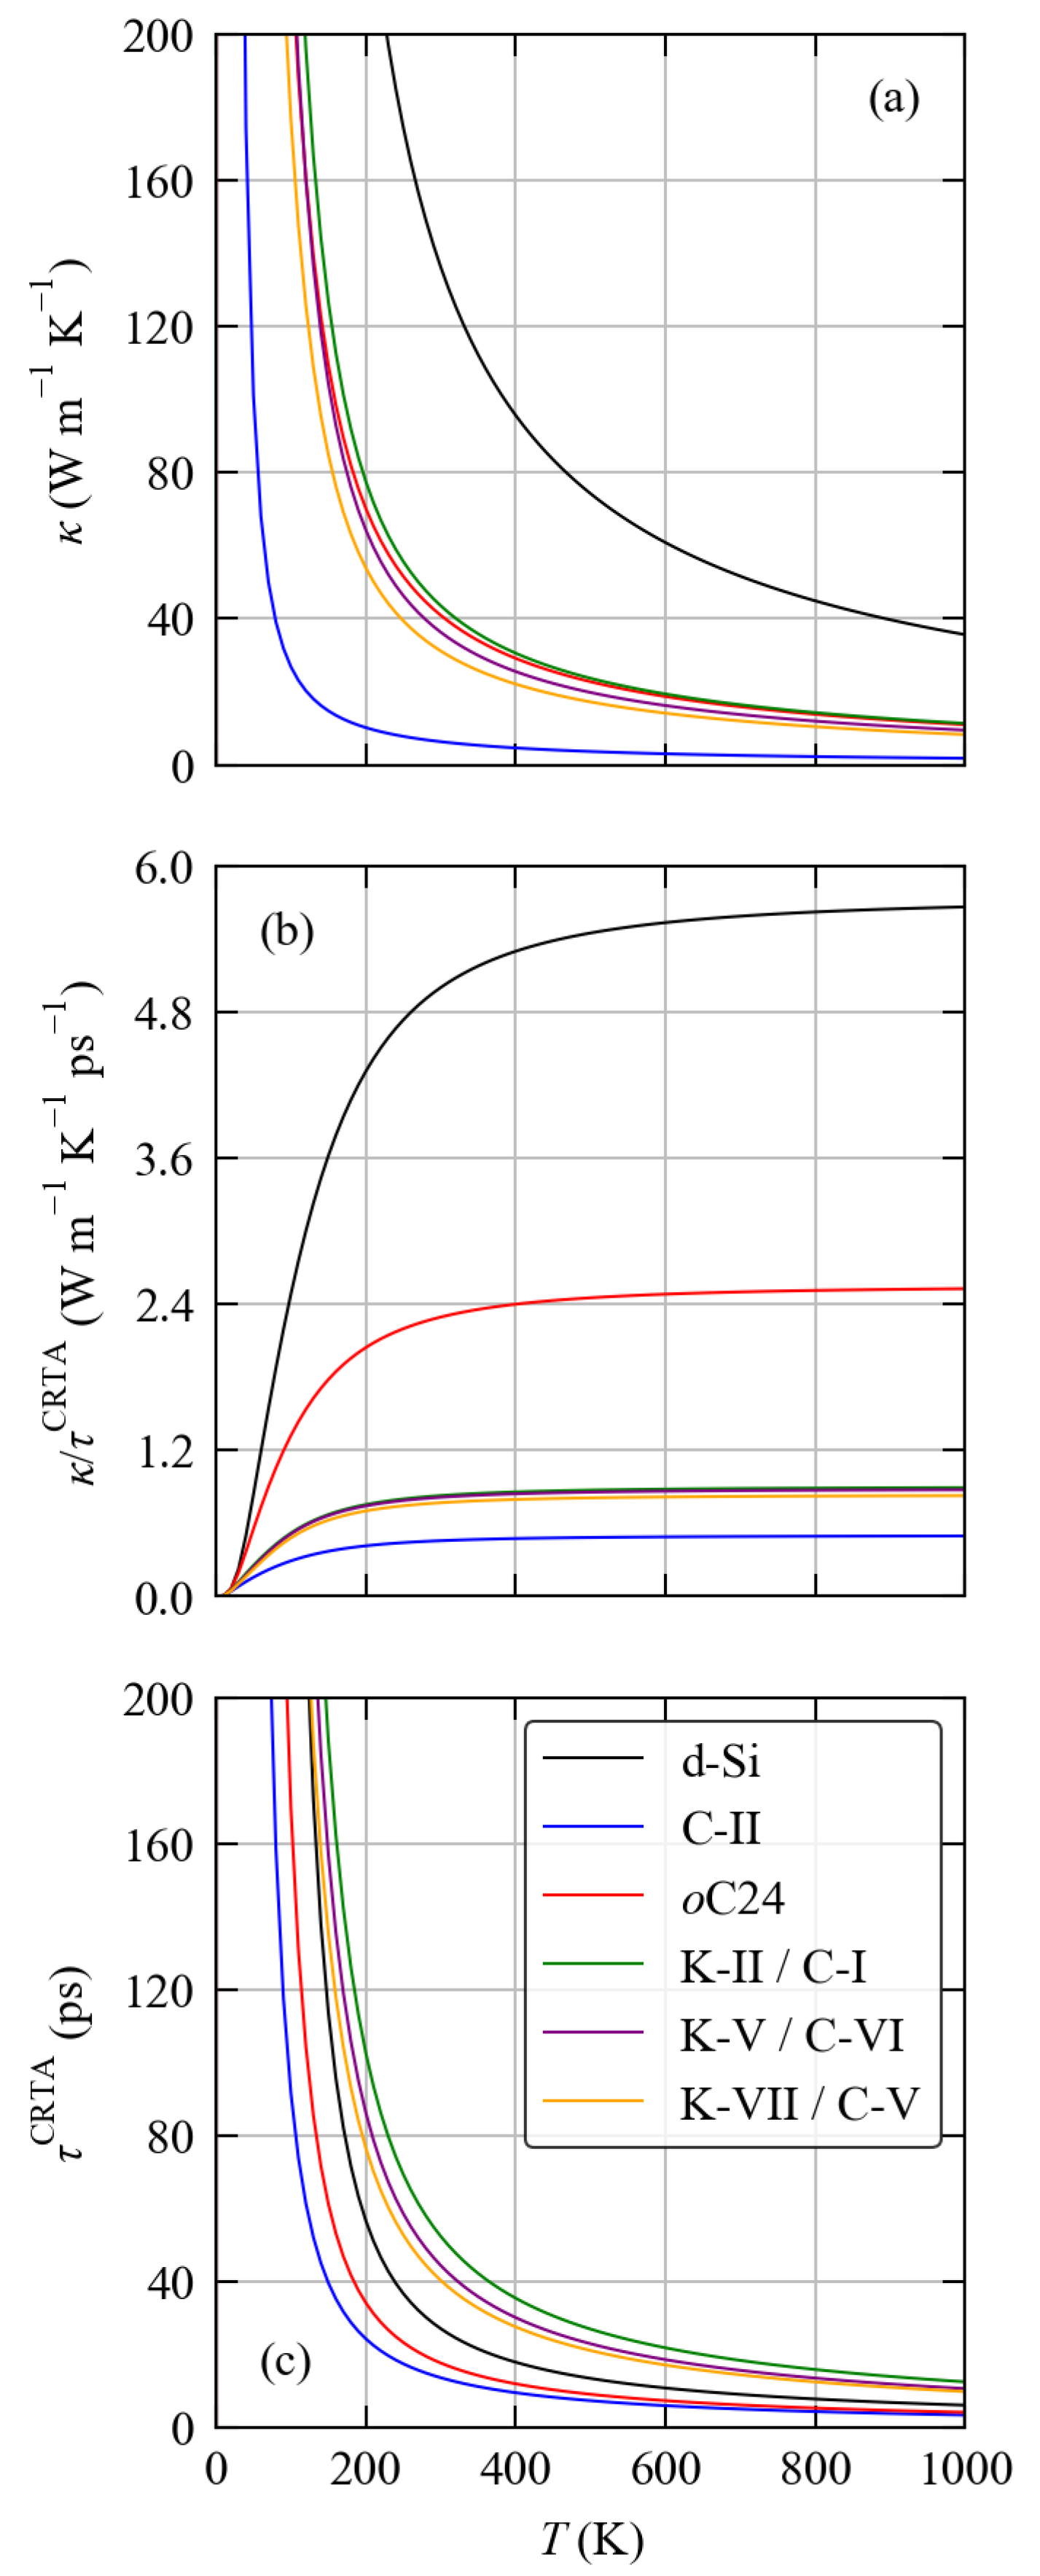
3.4. Thermal Transport
4. Discussion
Supplementary Materials
Author Contributions
Funding
Institutional Review Board Statement
Data Availability Statement
Acknowledgments
Conflicts of Interest
References
- Tan, G.; Zhao, L.D.; Kanatzidis, M.G. Rationally Designing High-Performance Bulk Thermoelectric Materials. Chem. Rev. 2016, 116, 12123–12149. [Google Scholar] [CrossRef] [PubMed]
- Firth, A.; Zhang, B.; Yang, A. Quantification of global waste heat and its environmental effects. Appl. Energy 2019, 235, 1314–1334. [Google Scholar] [CrossRef]
- Freer, R.; Powell, A.V. Realising the potential of thermoelectric technology: A Roadmap. J. Mater. Chem. C 2020, 8, 441–463. [Google Scholar] [CrossRef]
- Yan, Q.; Kanatzidis, M.G. High-performance thermoelectrics and challenges for practical devices. Nat. Mater. 2022, 21, 503–513. [Google Scholar] [CrossRef] [PubMed]
- Zeier, W.G.; Zevalkink, A.; Gibbs, Z.M.; Hautier, G.; Kanatzidis, M.G.; Snyder, G.J. Thinking Like a Chemist: Intuition in Thermoelectric Materials. Angew. Chem. Int. Ed. 2016, 55, 6826–6841. [Google Scholar] [CrossRef] [PubMed]
- Li, C.W.; Hong, J.; May, A.F.; Bansal, D.; Chi, S.; Hong, T.; Ehlers, G.; Delaire, O. Orbitally driven giant phonon anharmonicity in SnSe. Nat. Phys. 2015, 11, 1063–1069. [Google Scholar] [CrossRef]
- Aseginolaza, U.; Bianco, R.; Monacelli, L.; Paulatto, L.; Calandra, M.; Mauri, F.; Bergara, A.; Errea, I. Phonon Collapse and Second-Order Phase Transition in Thermoelectric SnSe. Phys. Rev. Lett. 2019, 122, 075901. [Google Scholar] [CrossRef]
- Aseginolaza, U.; Bianco, R.; Monacelli, L.; Paulatto, L.; Calandra, M.; Mauri, F.; Bergara, A.; Errea, I. Strong anharmonicity and high thermoelectric efficiency in high-temperature SnS from first principles. Phys. Rev. B 2019, 100, 214307. [Google Scholar] [CrossRef]
- Nielsen, M.D.; Ozolins, V.; Heremans, J.P. Lone pair electrons minimize lattice thermal conductivity. Energy Environ. Sci. 2013, 6, 570–578. [Google Scholar] [CrossRef]
- Biswas, K.; He, J.; Blum, I.D.; Wu, C.I.; Hogan, T.P.; Seidman, D.N.; Dravid, V.P.; Kanatzidis, M.G. High-performance bulk thermoelectrics with all-scale hierarchical architectures. Nature 2012, 489, 414–418. [Google Scholar] [CrossRef]
- Gonçalves, A.P.; Godart, C. New promising bulk thermoelectrics: Intermetallics, pnictides and chalcogenides. Eur. Phys. J. B 2014, 87, 42. [Google Scholar] [CrossRef]
- Dolyniuk, J.A.; Owens-Baird, B.; Wang, J.; Zaikina, J.V.; Kovnir, K. Clathrate thermoelectrics. Mater. Sci. Eng. R Rep. 2016, 108, 1–46. [Google Scholar] [CrossRef]
- Xia, K.; Hu, C.; Fu, C.; Zhao, X.; Zhu, T. Half-Heusler thermoelectric materials. Appl. Phys. Lett. 2021, 118, 140503. [Google Scholar] [CrossRef]
- Pei, Y.; Wang, H.; Snyder, G.J. Band Engineering of Thermoelectric Materials. Adv. Mater. 2012, 24, 6125–6135. [Google Scholar] [CrossRef]
- Tan, X.; Wang, H.; Liu, G.; Noudem, J.G.; Hu, H.; Xu, J.; Shao, H.; Jiang, J. Designing band engineering for thermoelectrics starting from the periodic table of elements. Mater. Today Phys. 2018, 7, 35–44. [Google Scholar] [CrossRef]
- Liu, W.; Lukas, K.C.; McEnaney, K.; Lee, S.; Zhang, Q.; Opeil, C.P.; Chen, G.; Ren, Z. Studies on the Bi2Te3–Bi2Se3–Bi2S3 system for mid-temperature thermoelectric energy conversion. Energy Environ. Sci. 2013, 6, 552–560. [Google Scholar] [CrossRef]
- Xie, H.; Su, X.; Hao, S.; Zhang, C.; Zhang, Z.; Liu, W.; Yan, Y.; Wolverton, C.; Tang, X.; Kanatzidis, M.G. Large Thermal Conductivity Drops in the Diamondoid Lattice of CuFeS2 by Discordant Atom Doping. J. Am. Chem. Soc. 2019, 141, 18900–18909. [Google Scholar] [CrossRef]
- Skelton, J.M. Approximate models for the lattice thermal conductivity of alloy thermoelectrics. J. Mater. Chem. C 2021, 9, 11772–11787. [Google Scholar] [CrossRef]
- Lu, Y.; Zheng, F.w.; Yang, Y.; Zhang, P.; Zhang, D.B. Phase stabilities of Cmcm and Pnma SnSe studied by phonon quasiparticle approach. Phys. Rev. B 2019, 100, 054304. [Google Scholar] [CrossRef]
- Slack, G.A. New Materials and Performance Limits for Thermoelectric Cooling. In CRC Handbook of Thermoelectrics; Rowe, D.M., Ed.; CRC Press: Boca Raton, FL, USA, 1985; p. 407. [Google Scholar]
- Toberer, E.S.; Zevalkink, A.; Snyder, G.J. Phonon engineering through crystal chemistry. J. Mater. Chem. 2011, 21, 15843–15852. [Google Scholar] [CrossRef]
- Kawaharada, Y.; Kurosaki, K.; Uno, M.; Yamanaka, S. Thermoelectric properties of CoSb3. J. Alloy. Compd. 2001, 315, 193–197. [Google Scholar] [CrossRef]
- Pei, Y.Z.; Yang, J.; Chen, L.D.; Zhang, W.; Salvador, J.R.; Yang, J. Improving thermoelectric performance of caged compounds through light-element filling. Appl. Phys. Lett. 2009, 95, 042101. [Google Scholar] [CrossRef]
- Shi, X.; Yang, J.; Salvador, J.R.; Chi, M.; Cho, J.Y.; Wang, H.; Bai, S.; Yang, J.; Zhang, W.; Chen, L. Multiple-Filled Skutterudites: High Thermoelectric Figure of Merit through Separately Optimizing Electrical and Thermal Transports. J. Am. Chem. Soc. 2011, 133, 7837–7846. [Google Scholar] [CrossRef]
- Nolas, G.S.; Slack, G.A.; Schujman, S.B. Semiconductor clathrates: A phonon glass electron crystal material with potential for thermoelectric applications. In Recent Trends in Thermoelectric Materials Research I; Tritt, T.M., Ed.; Academic Press: London, UK, 2001; Volume 69, pp. 255–300. [Google Scholar] [CrossRef]
- Nolas, G.S.; Cohn, J.L.; Slack, G.A.; Schujman, S.B. Semiconducting Ge clathrates: Promising candidates for thermoelectric applications. Appl. Phys. Lett. 1998, 73, 178–180. [Google Scholar] [CrossRef]
- Cohn, J.L.; Nolas, G.S.; Fessatidis, V.; Metcalf, T.H.; Slack, G.A. Glasslike Heat Conduction in High-Mobility Crystalline Semiconductors. Phys. Rev. Lett. 1999, 82, 779–782. [Google Scholar] [CrossRef]
- Zhu, G.H.; Lee, H.; Lan, Y.C.; Wang, X.W.; Joshi, G.; Wang, D.Z.; Yang, J.; Vashaee, D.; Guilbert, H.; Pillitteri, A.; et al. Increased Phonon Scattering by Nanograins and Point Defects in Nanostructured Silicon with a Low Concentration of Germanium. Phys. Rev. Lett. 2009, 102, 196803. [Google Scholar] [CrossRef] [PubMed]
- He, R.; Heyn, W.; Thiel, F.; Pérez, N.; Damm, C.; Pohl, D.; Rellinghaus, B.; Reimann, C.; Beier, M.; Friedrich, J.; et al. Thermoelectric properties of silicon and recycled silicon sawing waste. J. Mater. 2019, 5, 15–33. [Google Scholar] [CrossRef]
- Shanks, H.R.; Maycock, P.D.; Sidles, P.H.; Danielson, G.C. Thermal Conductivity of Silicon from 300 to 1400°K. Phys. Rev. 1963, 130, 1743–1748. [Google Scholar] [CrossRef]
- Glassbrenner, C.J.; Slack, G.A. Thermal Conductivity of Silicon and Germanium from 3°K to the Melting Point. Phys. Rev. 1964, 134, A1058–A1069. [Google Scholar] [CrossRef]
- Dong, J.; Sankey, O.F.; Kern, G. Theoretical study of the vibrational modes and their pressure dependence in the pure clathrate-II silicon framework. Phys. Rev. B 1999, 60, 950–958. [Google Scholar] [CrossRef]
- Gryko, J.; McMillan, P.F.; Marzke, R.F.; Ramachandran, G.K.; Patton, D.; Deb, S.K.; Sankey, O.F. Low-density framework form of crystalline silicon with a wide optical band gap. Phys. Rev. B 2000, 62, R7707–R7710. [Google Scholar] [CrossRef]
- Karttunen, A.J.; Fässler, T.F.; Linnolahti, M.; Pakkanen, T.A. Structural Principles of Semiconducting Group 14 Clathrate Frameworks. Inorg. Chem. 2011, 50, 1733–1742. [Google Scholar] [CrossRef]
- Zhao, H.Y.; Wang, J.; Ma, Q.M.; Liu, Y. sp3-Bonded silicon allotropes based on the Kelvin problem. Phys. Chem. Chem. Phys. 2013, 15, 17619–17625. [Google Scholar] [CrossRef]
- Kim, D.Y.; Stefanoski, S.; Kurakevych, O.O.; Strobel, T.A. Synthesis of an open-framework allotrope of silicon. Nat. Mater. 2015, 14, 169–173. [Google Scholar] [CrossRef]
- Nolas, G.S.; Beekman, M.; Gryko, J.; Lamberton, G.A.; Tritt, T.M.; McMillan, P.F. Thermal conductivity of elemental crystalline silicon clathrate Si136. Appl. Phys. Lett. 2003, 82, 910–912. [Google Scholar] [CrossRef]
- Skelton, J.M.; Burton, L.A.; Parker, S.C.; Walsh, A.; Kim, C.E.; Soon, A.; Buckeridge, J.; Sokol, A.A.; Catlow, C.R.A.; Togo, A.; et al. Anharmonicity in the High-Temperature Cmcm Phase of SnSe: Soft Modes and Three-Phonon Interactions. Phys. Rev. Lett. 2016, 117, 075502. [Google Scholar] [CrossRef]
- Tang, J.; Skelton, J.M. Impact of noble-gas filler atoms on the lattice thermal conductivity of CoSb3 skutterudites: First-principles modelling. J. Phys. Condens. Matter 2021, 33, 164002. [Google Scholar] [CrossRef]
- Cen, J.; Pallikara, I.; Skelton, J.M. Structural Dynamics and Thermal Transport in Bismuth Chalcogenide Alloys. Chem. Mater. 2021, 33, 8404–8417. [Google Scholar] [CrossRef]
- Kresse, G.; Hafner, J. Ab Initio Mol. Dyn. Liq. Met. Phys. Rev. B 1993, 47, 558–561. [Google Scholar] [CrossRef]
- Jain, A.; Ong, S.P.; Hautier, G.; Chen, W.; Richards, W.D.; Dacek, S.; Cholia, S.; Gunter, D.; Skinner, D.; Ceder, G.; et al. The Materials Project: A materials genome approach to accelerating materials innovation. APL Mater. 2013, 1, 011002. [Google Scholar] [CrossRef]
- Perdew, J.P.; Ruzsinszky, A.; Csonka, G.I.; Vydrov, O.A.; Scuseria, G.E.; Constantin, L.A.; Zhou, X.; Burke, K. Restoring the Density-Gradient Expansion for Exchange in Solids and Surfaces. Phys. Rev. Lett. 2008, 100, 136406. [Google Scholar] [CrossRef]
- Skelton, J.M.; Tiana, D.; Parker, S.C.; Togo, A.; Tanaka, I.; Walsh, A. Influence of the exchange-correlation functional on the quasi-harmonic lattice dynamics of II-VI semiconductors. J. Chem. Phys. 2015, 143, 064710. [Google Scholar] [CrossRef]
- Blöchl, P.E. Projector augmented-wave method. Phys. Rev. B 1994, 50, 17953–17979. [Google Scholar] [CrossRef]
- Kresse, G.; Joubert, D. From ultrasoft pseudopotentials to the projector augmented-wave method. Phys. Rev. B 1999, 59, 1758–1775. [Google Scholar] [CrossRef]
- Monkhorst, H.J.; Pack, J.D. Special points for Brillouin-zone integrations. Phys. Rev. B 1976, 13, 5188–5192. [Google Scholar] [CrossRef]
- Togo, A.; Tanaka, I. Spglib: A software library for crystal symmetry search. arXiv 2018, arXiv:cond-mat.mtrl-sci/1808.01590. [Google Scholar]
- Togo, A.; Tanaka, I. First principles phonon calculations in materials science. Scr. Mater. 2015, 108, 1–5. [Google Scholar] [CrossRef]
- Togo, A.; Chaput, L.; Tanaka, I. Distributions of phonon lifetimes in Brillouin zones. Phys. Rev. B 2015, 91, 094306. [Google Scholar] [CrossRef]
- Porezag, D.; Pederson, M.R. Infrared intensities and Raman-scattering activities within density-functional theory. Phys. Rev. B 1996, 54, 7830–7836. [Google Scholar] [CrossRef] [PubMed]
- Skelton, J.M.; Burton, L.A.; Jackson, A.J.; Oba, F.; Parker, S.C.; Walsh, A. Lattice dynamics of the tin sulphides SnS2, SnS and Sn2S3: Vibrational spectra and thermal transport. Phys. Chem. Chem. Phys. 2017, 19, 12452–12465. [Google Scholar] [CrossRef] [PubMed]
- Gajdoš, M.; Hummer, K.; Kresse, G.; Furthmüller, J.; Bechstedt, F. Linear optical properties in the projector-augmented wave methodology. Phys. Rev. B 2006, 73, 045112. [Google Scholar] [CrossRef]
- Souza, I.; Íñiguez, J.; Vanderbilt, D. First-Principles Approach to Insulators in Finite Electric Fields. Phys. Rev. Lett. 2002, 89, 117602. [Google Scholar] [CrossRef]
- Kurakevych, O.O.; Strobel, T.A.; Kim, D.Y.; Muramatsu, T.; Struzhkin, V.V. Na-Si Clathrates Are High-Pressure Phases: A Melt-Based Route to Control Stoichiometry and Properties. Cryst. Growth Des. 2013, 13, 303–307. [Google Scholar] [CrossRef]
- Jennings, H.M.; Richman, M.H. A Hexagonal (Wurtzite) Form of Silicon. Science 1976, 193, 1242–1243. [Google Scholar] [CrossRef]
- Tang, J.; Maurice, J.L.; Fossard, F.; Florea, I.; Chen, W.; Johnson, E.V.; Foldyna, M.; Yu, L.; Roca i Cabarrocas, P. Natural occurrence of the diamond hexagonal structure in silicon nanowires grown by a plasma-assisted vapour–liquid–solid method. Nanoscale 2017, 9, 8113–8118. [Google Scholar] [CrossRef]
- Kasper, J.S.; Richards, S.M. The crystal structures of new forms of silicon and germanium. Acta Crystallogr. 1964, 17, 752–755. [Google Scholar] [CrossRef]
- Duclos, S.J.; Vohra, Y.K.; Ruoff, A.L. Experimental study of the crystal stability and equation of state of Si to 248 GPa. Phys. Rev. B 1990, 41, 12021–12028. [Google Scholar] [CrossRef]
- Crain, J.; Ackland, G.J.; Maclean, J.R.; Piltz, R.O.; Hatton, P.D.; Pawley, G.S. Reversible pressure-induced structural transitions between metastable phases of silicon. Phys. Rev. B 1994, 50, 13043–13046. [Google Scholar] [CrossRef]
- McMahon, M.I.; Nelmes, R.J.; Wright, N.G.; Allan, D.R. Pressure dependence of the Imma Phase Silicon. Phys. Rev. B 1994, 50, 739–743. [Google Scholar] [CrossRef]
- Hanfland, M.; Schwarz, U.; Syassen, K.; Takemura, K. Crystal Structure of the High-Pressure Phase Silicon VI. Phys. Rev. Lett. 1999, 82, 1197–1200. [Google Scholar] [CrossRef]
- Okada, Y.; Tokumaru, Y. Precise determination of lattice parameter and thermal expansion coefficient of silicon between 300 and 1500 K. J. Appl. Phys. 1984, 56, 314–320. [Google Scholar] [CrossRef]
- Kasper, J.S.; Hagenmuller, P.; Pouchard, M.; Cros, C. Clathrate Structure of Silicon Na8Si46 and NaxSi136 (x < 11). Science 1965, 150, 1713–1714. [Google Scholar] [CrossRef]
- Momma, K.; Izumi, F. VESTA3 Three-Dimens. Vis. Crystal, Vol. Morphol. Data. J. Appl. Crystallogr. 2011, 44, 1272–1276. [Google Scholar] [CrossRef]
- Parker, J.H.; Feldman, D.W.; Ashkin, M. Raman Scattering by Silicon and Germanium. Phys. Rev. 1967, 155, 712–714. [Google Scholar] [CrossRef]
- Beekman, M.; Nolas, G. Synthesis and thermal conductivity of type II silicon clathrates. Phys. B Condens. Matter 2006, 383, 111–114. [Google Scholar] [CrossRef]
- Härkönen, V.J.; Karttunen, A.J. Ab initio studies on the lattice thermal conductivity of silicon clathrate frameworks II and VIII. Phys. Rev. B 2016, 93, 024307. [Google Scholar] [CrossRef]
- Norouzzadeh, P.; Krasinski, J.S.; Tadano, T. Thermal conductivity of type-I, type-II, and type-VIII pristine silicon clathrates: A first-principles study. Phys. Rev. B 2017, 96, 245201. [Google Scholar] [CrossRef]
- Ceperley, D.M.; Alder, B.J. Ground State of the Electron Gas by a Stochastic Method. Phys. Rev. Lett. 1980, 45, 566–569. [Google Scholar] [CrossRef]
- Perdew, J.P.; Chevary, J.A.; Vosko, S.H.; Jackson, K.A.; Pederson, M.R.; Singh, D.J.; Fiolhais, C. Atoms, molecules, solids, and 117 surfaces: Applications of the generalized gradient approximation for exchange and correlation. Phys. Rev. B 1992, 46, 6671–6687. [Google Scholar] [CrossRef]
- Perdew, J.P.; Burke, K.; Ernzerhof, M. Generalized Gradient Approximation Made Simple. Phys. Rev. Lett. 1996, 77, 3865–3868. [Google Scholar] [CrossRef]
- Murnaghan, F.D. The Compressibility of Media under Extreme Pressures. Proc. Natl. Acad. Sci. USA 1944, 30, 244–247. [Google Scholar] [CrossRef]
- Birch, F. Finite Elastic Strain of Cubic Crystals. Phys. Rev. 1947, 71, 809–824. [Google Scholar] [CrossRef]


| d-Si | C-II | oC24 | K-II/C-I | K-V/C-VI | K-VII/C-V | ||
|---|---|---|---|---|---|---|---|
| Optimisation | Cell | Conv. | Prim. | Prim. | - | Prim. | - |
| -points | 6 × 6 × 6 | 4 × 4 × 4 | 8 × 8 × 2 | 3 × 3 × 3 | 4 × 4 × 3 | 4 × 4 × 2 | |
| / | Cell | Prim. | Prim. | Prim. | - | Prim. | - |
| -points | 10 × 10 × 10 | 4 × 4 × 4 | 8 × 8 × 2 | 3 × 3 × 3 | 4 × 4 × 3 | 4 × 4 × 2 | |
| Cell | Conv. | Conv. | Conv. | - | Conv. | - | |
| Supercell (# atoms) 1 | 3 × 3 × 3 (216) | (272) | (384) | 2 × 2 × 2 (368) | (320) | 2 × 2 × 1 (272) | |
| -points | 2 × 2 × 2 | 2 × 2 × 2 | 2 × 2 × 1 | 2 × 2 × 2 | 2 × 2 × 2 | 2 × 2 × 2 | |
| Cell | Conv. | Conv. | Conv. | - | Conv. | - | |
| Supercell (# atoms) | 2 × 2 × 2 (64) | 1 × 1 × 1 (136) | 3 × 1 × 1 (72) | 1 × 1 × 1 (46) | 1 × 1 × 1 (80) | 1 × 1 × 1 (68) | |
| -points | 3 × 3 × 3 | 2 × 2 × 2 | 3 × 2 × 2 | 3 × 3 × 3 | 4 × 2 × 3 | 4 × 4 × 2 | |
| -points | DoS/ | 48 × 48 × 48 | 24 × 24 × 24 | 40 × 40 × 16 | 24 × 24 × 24 | 24 × 24 × 24 | 24 × 24 × 16 |
| 2 | 36 × 36 × 36 | 16 × 16 × 16 | 13 × 13 × 5 | 13 × 13 × 13 | 9 × 9 × 9 | 14 × 14 × 9 |
| Source | Spacegroup | a (Å) | b (Å) | c (Å) | V (Å3) | ||
|---|---|---|---|---|---|---|---|
| d-Si | mp-149 | 8 | 5.436 | - | - | 160.6 | |
| C-II | mp-16220 [32] | 136 | 14.629 | - | - | 3130.9 | |
| oC24 | mp-1095269 [36] | 24 | 3.826 | 10.697 | 12.660 | 518.1 | |
| K-II/C-I | mp-971662 [35] | 46 | 10.227 | - | - | 1052.5 | |
| K-V/C-VI | ICSD: 189396 [35] | 80 | 10.158 | 17.596 | 10.325 | 1845.6 | |
| K-VII/C-V | mp-1203790 [35] | 68 | 10.358 | - | 16.956 | 1575.3 |
| # IR Active | # Raman Active | |||
|---|---|---|---|---|
| d-Si | 6 | T1u + T2g | 1 | 1 |
| C-II | 102 | 3 A1g + A1u + A2g + 3 A2u + 4 Eg + 4 Eu + 5 T1g + 8 T1u + 8 T2g + 5 T2u | 8 | 15 |
| oC24 | 36 | 6 Ag + 3 Au + 3 B1g + 6 B1u + 3 B2g + 6 B2u + 6 B3g + 3 B3u | 15 | 18 |
| K-II/C-I | 138 | 3 A1g + 2 A1u + 4 A2g + 2 A2u + 7 Eg + 4 Eu + 8 T1g + 10 T1u + 8 T2g + 9 T2u | 10 | 18 |
| K-V/C-VI | 120 | 18 Ag + 11 Au + 15 B1g + 16 B1u + 13 B2g + 17 B2u + 14 B3g + 16 B3u | 49 | 50 |
| K-VII/C-V | 204 | 11 A1g + 5 A1u + 7 A2g + 11 A2u + 5 B1g + 11 B1u + 11 B2g + 7 B2u + 16 E1g + 18 E1u + 18 E2g + 16 E2u | 29 | 45 |
| (kJ mol−1 atom−1) | ||||
|---|---|---|---|---|
| d-Si | - | - | - | - |
| C-II | 32.62 | 31.47 | 32.39 | −0.92 |
| oC24 | 8.97 | 8.73 | 8.91 | −0.18 |
| K-II/C-I | 7.47 | 7.25 | 7.39 | −0.13 |
| K-V/C-VI | 9.14 | 8.88 | 2.70 | −0.17 |
| K-VII/C-V | 6.82 | 6.62 | 6.74 | −0.12 |
| (W m−1 K−1) | (W m−1 K−1 ps−1) | (ps) | (10−8 eV2) | ||||
|---|---|---|---|---|---|---|---|
| d-Si | 136.24 | - | - | 136.24 | 5.002 | 27.24 | 2.164 |
| C-II | 6.33 | - | - | 6.33 | 0.458 | 13.81 | 2.704 |
| oC24 | 57.86 | 44.70 | 20.21 | 40.92 | 2.295 | 17.83 | 2.983 |
| K-II/C-I | 43.54 | - | - | 43.54 | 0.829 | 52.52 | 1.184 |
| K-V/C-VI | 38.24 | 37.68 | 32.96 | 36.29 | 0.815 | 44.53 | 1.327 |
| K-VII/C-V | 30.45 | - | 32.56 | 31.16 | 0.770 | 40.45 | 1.477 |
Publisher’s Note: MDPI stays neutral with regard to jurisdictional claims in published maps and institutional affiliations. |
© 2022 by the authors. Licensee MDPI, Basel, Switzerland. This article is an open access article distributed under the terms and conditions of the Creative Commons Attribution (CC BY) license (https://creativecommons.org/licenses/by/4.0/).
Share and Cite
Wei, B.; Flitcroft, J.M.; Skelton, J.M. Structural Dynamics, Phonon Spectra and Thermal Transport in the Silicon Clathrates. Molecules 2022, 27, 6431. https://doi.org/10.3390/molecules27196431
Wei B, Flitcroft JM, Skelton JM. Structural Dynamics, Phonon Spectra and Thermal Transport in the Silicon Clathrates. Molecules. 2022; 27(19):6431. https://doi.org/10.3390/molecules27196431
Chicago/Turabian StyleWei, Benxiang, Joseph M. Flitcroft, and Jonathan M. Skelton. 2022. "Structural Dynamics, Phonon Spectra and Thermal Transport in the Silicon Clathrates" Molecules 27, no. 19: 6431. https://doi.org/10.3390/molecules27196431
APA StyleWei, B., Flitcroft, J. M., & Skelton, J. M. (2022). Structural Dynamics, Phonon Spectra and Thermal Transport in the Silicon Clathrates. Molecules, 27(19), 6431. https://doi.org/10.3390/molecules27196431