
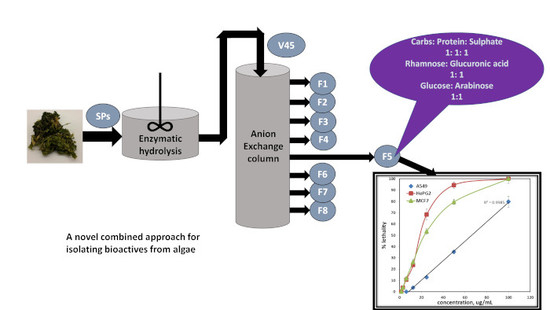
Production of Bioactive Compounds from the Sulfated Polysaccharides Extracts of Ulva lactuca: Post-Extraction Enzymatic Hydrolysis Followed by Ion-Exchange Chromatographic Fractionation


Abstract
1. Introduction
2. Results and Discussion
2.1. Chemical Analysis
2.2. FTIR Characterization
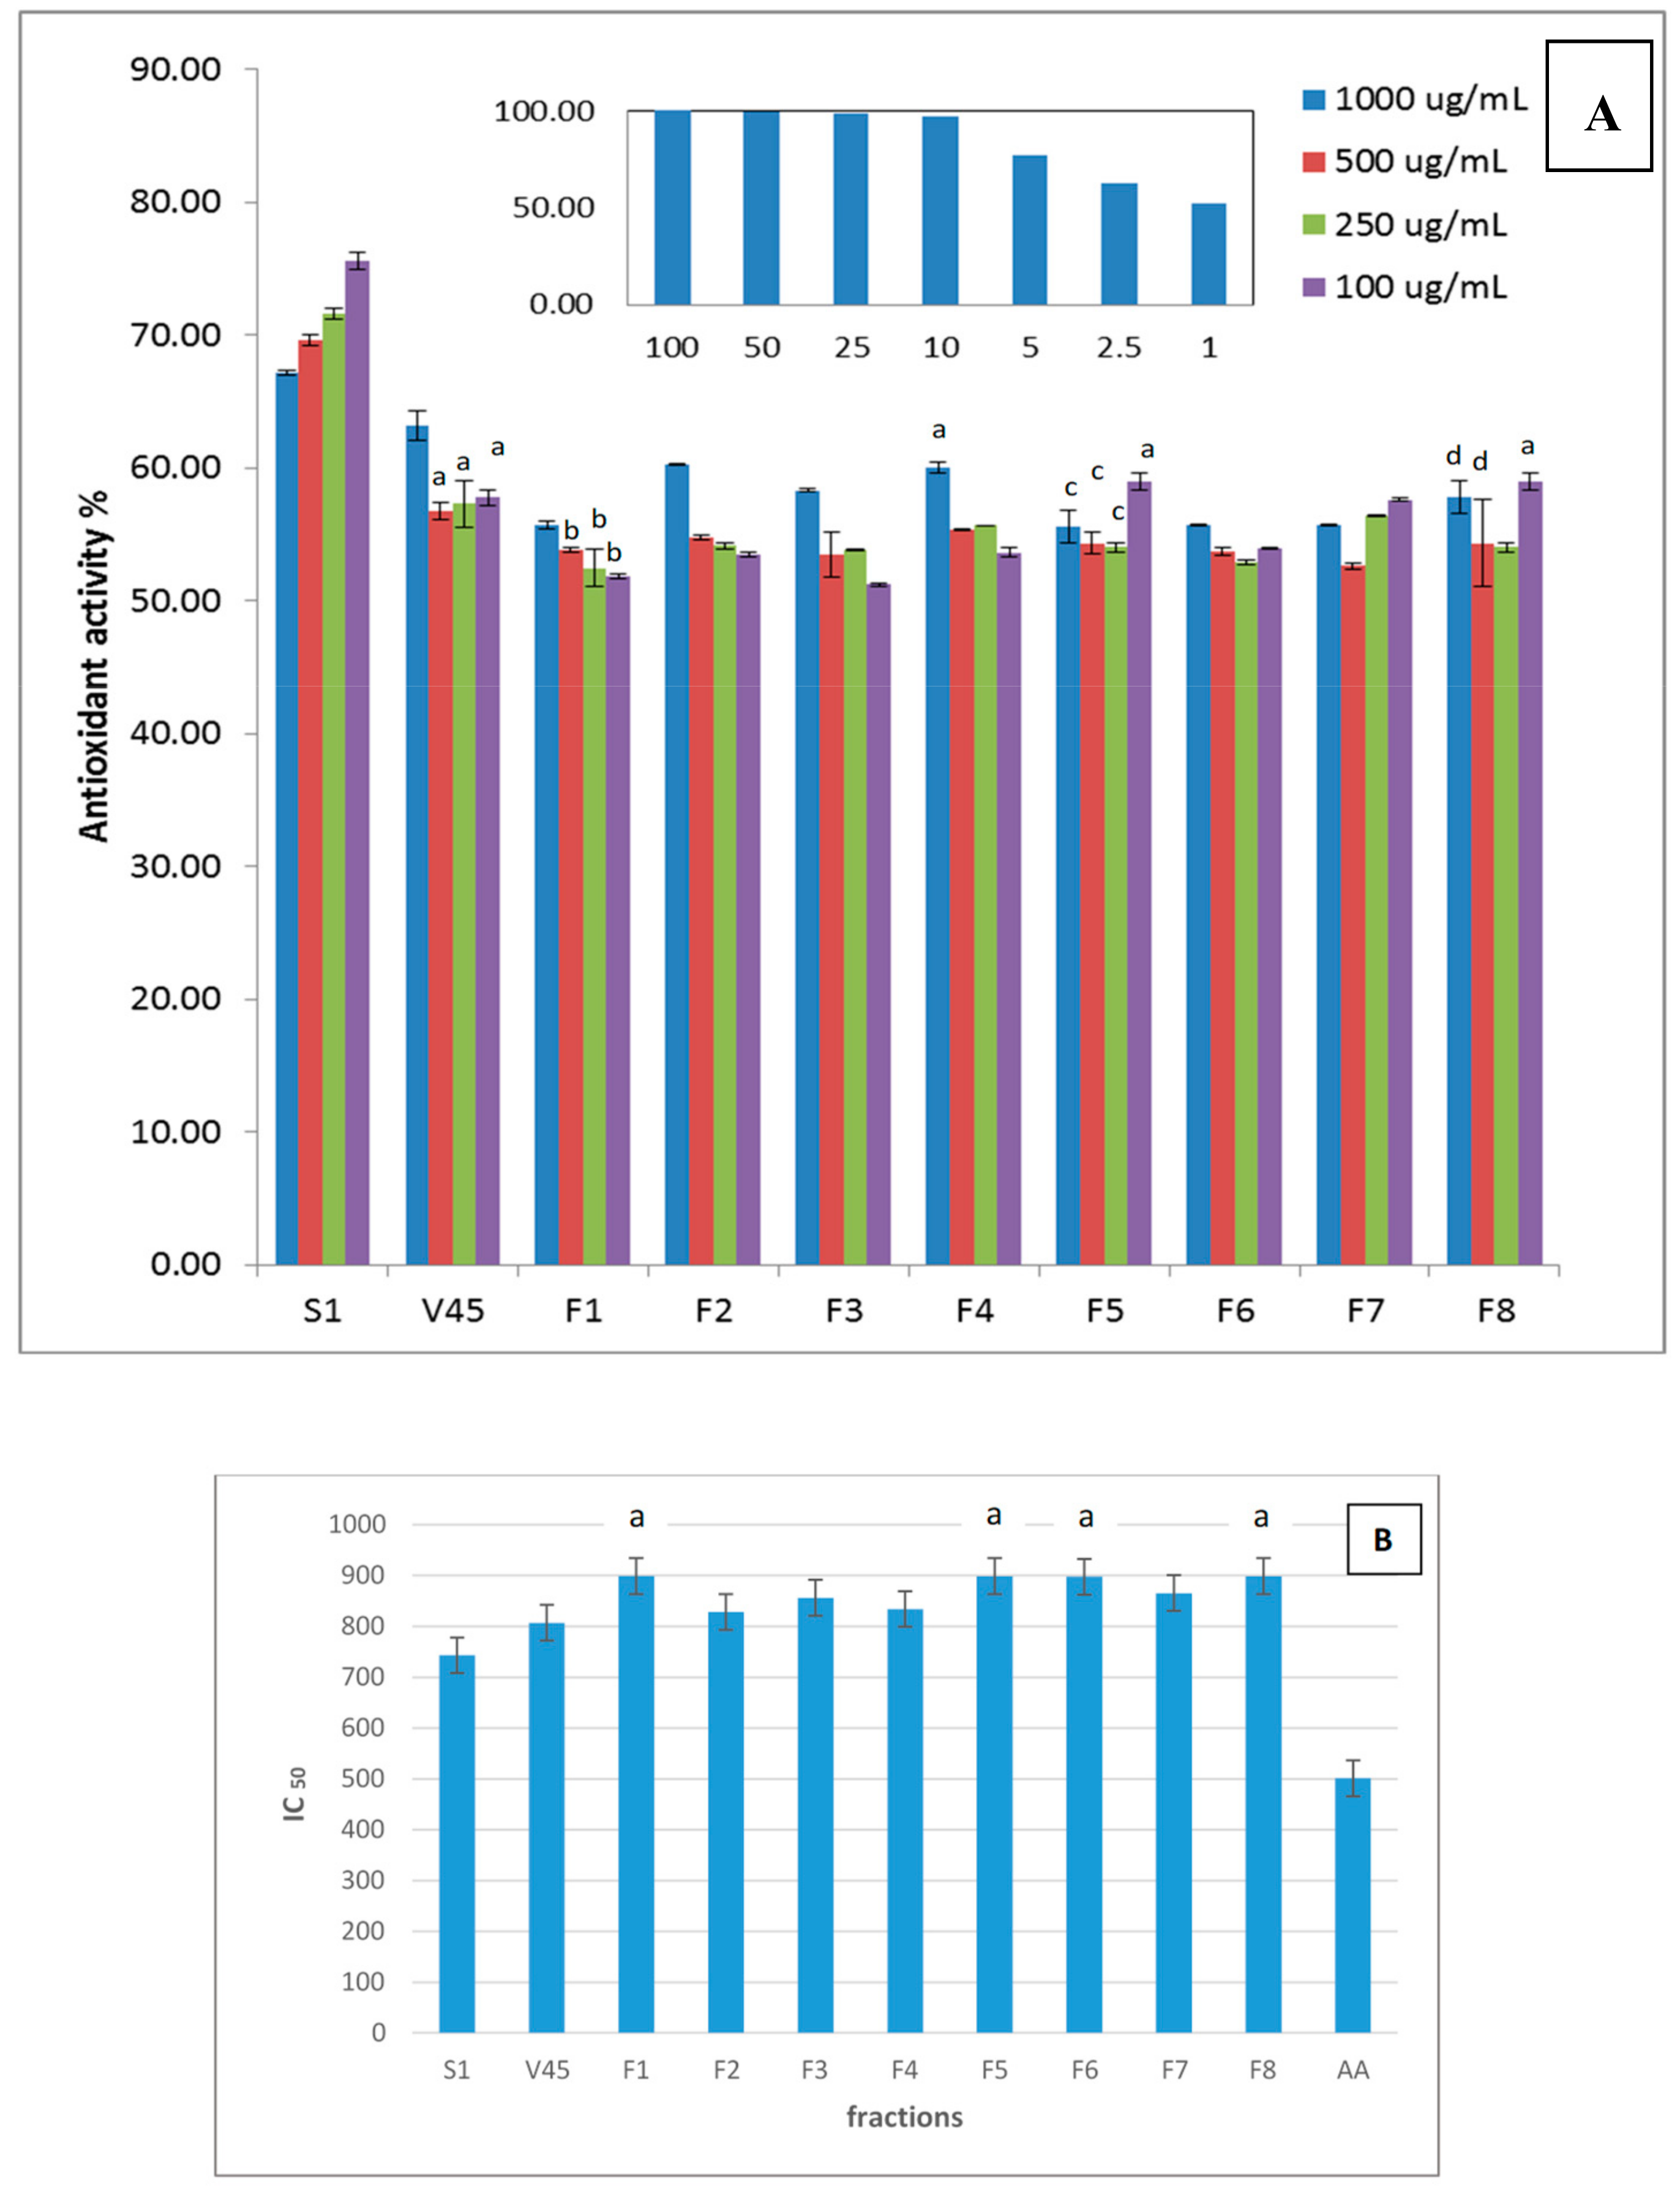
2.3. Antioxidant Activity
2.4. Antitumor Activity
2.5. Hill Coefficient
2.6. Sugar Analysis by HPLC
3. Materials and Methods
3.1. Extraction of SPs from Algae
3.2. Enzymatic Hydrolysis and Anion-Exchange Chromatography
3.3. Chemical Tests
3.3.1. Determination of Carbohydrate, Protein, and Sulfate Contents
3.3.2. Determination of Degree of Polymerization (DP)
3.3.3. Determination of Sugar Content
3.4. Fourier Transform Spectral Analysis
3.5. Biological Tests
3.5.1. Antioxidant Activity
3.5.2. Antitumor Activity
3.5.3. LC50, LC90, and Hill Coefficient
4. Conclusions
Author Contributions
Funding
Conflicts of Interest
References
- Lahaye, M. NMR spectroscopic characterisation of oligosaccharides from two Ulva rigida ulvan samples (Ulvales, Chlorophyta) degraded by a lyase. Carb. Res. 1998, 314, 1–12. [Google Scholar] [CrossRef]
- Jiao, G.; Yu, G.; Zhang, J.; Ewart, H. Chemical structures and bioactivities of sulfated polysaccharides from marine algae. Mar. Drugs 2011, 9, 196–223. [Google Scholar] [CrossRef] [PubMed]
- Qi, H.; Zhao, T.; Zhang, Q.; Li, Z.; Zhao, Z.; Xing, R. Antioxidant activity of different molecular weight sulfated polyssacharides from Ulva pertusa Kjellum (Chlorophyta). J. Appl. Phycol. 2005, 17, 527–534. [Google Scholar] [CrossRef]
- Abd El-Baky, H.H.; El Baz, F.K.; El-Baroty, G.S. Evaluation of marine alga Ulva lactuca L. as a source of natural preservative ingredient. Electron. J. Environ. Agric. Food Chem. 2008, 7, 3353–3367. [Google Scholar]
- Meenakshi, S.; Manicka, D.G.; Tamil, S.; Arumugam, M.; Balasubramanian, T. Total flavanoid and in vitro antioxidant activity of two seaweeds of Rameshwaram Coast. Glob. J. Pharmacol. 2009, 3, 59–62. [Google Scholar]
- Kokabi, M.; Yousefzadi, M.; Ahmadi, A.; Feghhi, M.; Amin, K.M. Antioxidant activity of extracts of selected algae from the Persian Gulf, Iran. J. Persian Gulf 2013, 4, 45–50. [Google Scholar]
- Farasat, M.; Khavari-nejad, R.A.; Nabavi, S.M.B.; Namjooya, F. Antioxidant activity, total phenolics and flavonoid and contents of some edible seaweeds from Northern Coasts of Persian Gulf Iran. J. Pharm. Res. 2014, 13, 163–170. [Google Scholar]
- Khairy, H.; El-Sheikh, M. Antioxidant activity and mineral composition of three Mediterranean common seaweeds from Abu-Qir Bay, Egypt. Saudi J. Biol. Sci. 2015, 22, 623–630. [Google Scholar] [CrossRef]
- El-Sayed, M.H.; Fleita, D.; Rifaat, D.; Essa, H. Ingredients Extraction by Physicochemical Methods in Food; Alexandru, M.G., Alina, M.H., Eds.; Elsevier: Cambridge, MA, USA, 2018; Chapter 9; pp. 367–397. [Google Scholar]
- Fan, S.; Zhang, J.; Nie, W.; Zhou, W.; Jin, L.; Chen, X.; Lu, J. Antitumor effects of polysaccharide from Sargassum fusiforme against human hepatocellular carcinoma HepG2 cells. Food Chem. Toxicol. 2017, 102, 53–62. [Google Scholar] [CrossRef]
- Peasura, N.; Laohakunjit, N.; Kerdchoechuena, O.; Vongsawasdib, P.; Chao, K.L. Assessment of biochemical and immunomodulatory activity of sulfated polysaccharides from Ulva intestinalis. Int. J. Biol. Macromol. 2016, 91, 269–277. [Google Scholar] [CrossRef]
- Boopathy, N.S.; Kathiresan, K. Anticancer agents derived from marine algae. In Functional Ingredients from Algae for Foods and Nutraceuticals; Dominguez, H., Ed.; Woodhead Publishing Ltd.: Cambridge, UK, 2013; pp. 307–337. [Google Scholar]
- Shao, P.; Chen, X.; Sun, P. In vitro antioxidant and antitumor activities of different sulfated polysaccharides isolated from three algae. Int. J. Biol. Macromol. 2013, 62, 155–161. [Google Scholar] [CrossRef] [PubMed]
- Kaeffer, B.; Bénard, C.; Lahaye, M.; Blottière, H.M.; Cherbut, C. Biological properties of ulvan, a new source of green seaweed sulfated polysaccharides, on cultured normal and cancerous colonic epithelial cells. Planta Medica 1999, 65, 527–531. [Google Scholar] [CrossRef] [PubMed]
- Ahmed, O.; Ahmed, R. Anti-Proliferative and apoptotic efficacies of ulvan polysaccharides against different types of carcinoma cells in vitro and in vivo. J. Cancer Sci. Ther. 2014, 6, 202–208. [Google Scholar] [CrossRef]
- Thanh, T.T.T.; Quacha, T.M.T.; Nguyenb, T.N.; Luonga, D.V.; Buic, M.L.; Tran, T.T.V. Structure and cytotoxic activity of ulvan extracted from green seaweed Ulva lactuca. Int. J. Biol. Macromol. 2016, 93, 695–702. [Google Scholar] [CrossRef] [PubMed]
- Sun, L.; Wang, C.; Shi, Q.; Ma, C. Preparation of different molecular weight polysaccharides from Prophyridium cruentum and their antioxidant activities. Int. J. Biol. Macromol. 2009, 45, 42–47. [Google Scholar] [CrossRef] [PubMed]
- Ye, H.; Wang, K.; Zhou, C.J.; Zeng, X. Purification, antitumor and antioxidant activities in vitro of polysaccharides from the brown seaweed Sargassum pallidum. Food Chem. 2008, 111, 428–432. [Google Scholar] [CrossRef] [PubMed]
- Chen, Y.; Xie, M.; Nie, S.; Li, C.; Wang, Y. Purification, composition analysis and antioxidant activity of a polysaccharide from the fruiting bodies of Ganoderma atrum. Food Chem. 2008, 107, 231–241. [Google Scholar] [CrossRef]
- Di, T.; Chen, G.; Sun, Y.; Ou, S.; Zeng, X.; Ye, H. Antioxidant and immunostimulating activities in vitro of sulfated polysaccharides isolated from Gracilaria rubra. J. Funct. Foods 2017, 28, 64–75. [Google Scholar] [CrossRef]
- Fleita, D.; El-Sayed, M.; Rifaat, D. Evaluation of the antioxidant activity of enzymatically-hydrolysed sulfated polysaccharides extracted from red algae; Pterocladia capillacea. LWT-Food Sci. Technol. 2015, 63, 1236–1244. [Google Scholar] [CrossRef]
- Lowry, O.H.; Rosenbrough, N.J.; Farr, A.L.; Randall, R.J. Protein measurement with the Folin phenol reagent. J. Biol. Chem. 1951, 193, 265–275. [Google Scholar] [PubMed]
- Agardh, J.; Vasquez, R.; Donnie, J.; Ramos, A.; Bernal, S. Chemopreventive properties of sulfated polysaccharide extracts from Saragasum siliquosum. Int. J. Pharm. Biol. Sci. 2012, 3, 333–345. [Google Scholar]
- Kannan, S. FT-IR and EDS analysis of the seaweeds Sargassum wightii (brown algae) and Gracilaria corticata (red algae). Int. J. Curr. Microbiol. Appl. Sci. 2014, 4, 341–351. [Google Scholar]
- Radhika, D.; Mohaideen, A. Fourier transform infrared analysis of Ulva lactuca and Gracilaria corticata and their effect on antibacterial activity. Asian J. Pharm. Clin. Res. 2015, 8, 209–212. [Google Scholar]
- Hortin, G.L.; Goldberger, G.A. Chromatography and extraction. In Tietz Textbook of Clinical Chemistry and Molecular Diagnosis; Burtis, C.A., Ashwood, E.R., Bruns, D.E., Eds.; Elsevier Saunders Publisher: Philadelphia, PA, USA, 2012; pp. 307–328. [Google Scholar]
- Ji, A.; Yao, Y.; Che, O.; Wang, B.; Sun, L.; Li, X.; Xu, F. Isolation and characterization of sulfated polysaccharide from the Sargassum pallidum (Turn.) C. Ag. and its sedative/hypnotic activity. J. Med. Plants Res. 2011, 5, 5240–5246. [Google Scholar]
- Tian, H.; Yin, X.; Zeng, Q.; Zhu, L.; Chen, J. Isolation, structure, and surfactant properties of polysaccharides from Ulva lactuca L. from South China Sea. Int. J. Biol. Macromol. 2015, 79, 577–582. [Google Scholar] [CrossRef] [PubMed]
- Pereira, L.; Amado, A.; Critchely, A.; Velde, F.; Claro, P. Identification of selected seaweed polysaccharides (phycocolloids) by vibrational spectroscopy (FTIR-ATR and FT-Raman). Food Hydrocoll. 2009, 7, 1903–1909. [Google Scholar] [CrossRef]
- Ordonez, F.; Ruperez, P. FTIR-ATR spectroscopy as a tool for polysaccharide identification in edible brown and red seaweeds. Food Hydrocoll. 2011, 25, 1514–1520. [Google Scholar] [CrossRef]
- Tingaut, P.; Hauert, R.; Zimmermann, T. Highly efficient and straight forward functionalization of cellulose films with thiol-ene. J. Mater. Chem. 2011, 21, 16066–16076. [Google Scholar] [CrossRef]
- Guan, X.; Shang, C.; Chen, G. ATR-FTIR investigation of the role of phenolic groups in the interaction of some NOM model compounds with aluminum hydroxide. Chemosphere 2006, 65, 2074–2081. [Google Scholar] [CrossRef]
- Rajani, S.; Gokilai, M.; Jency, P.; Brindha, P.; Sujathai, R. Antioxidant and phytochemical properties of Aegle marmelos fruit pulp. Int. J. Curr. Pharm. Res. 2011, 3, 65–70. [Google Scholar]
- Chen, S.; Tsai, M.; Huang, J.; Chen, R. In vitro antioxidant activities of low-molecular-weight polysaccharides with various functional groups. J. Agri. Food Chem. 2009, 57, 2699–2704. [Google Scholar] [CrossRef] [PubMed]
- Zhang, Z.; Wang, F.; Wang, X.; Liu, X.; Hou, Y.; Zhang, Q. Extraction of the polysaccharides from five algae and their potential antioxidant activity in vitro. Carbohyd. Polym. 2010, 82, 118–121. [Google Scholar] [CrossRef]
- Thetsrimuang, C.; Khammuang, S.; Sarnthima, R. Antioxidant activity of crude polysaccharides from edible fresh and dry mushroom fruiting bodies of Lentinus sp. strain RJ-2. Int. J. Pharmacol. 2011, 7, 58–65. [Google Scholar]
- Weiss, J.N. The Hill equation revisited: Uses and misuses. FASEB J. 1997, 11, 836–841. [Google Scholar] [CrossRef]
- He, R.; Zhao, Y.; Zhao, R.; Sun, P. Antioxidant and antitumor activities in vitro of polysaccharides from E. sipunculoides. Int. J. Biol. Macromol. 2015, 78, 56–61. [Google Scholar] [CrossRef] [PubMed]
- Hao, W.; Wang, X.; Li, H.; Wang, S.; Chen, T.; Yuan, Z.; Tang, Y. Isolation and characterization of polysaccharides with the antitumor activity from Tuber fruiting bodies and fermentation system. Appl. Microbiol. Biotechnol. 2014, 98, 1991–2002. [Google Scholar]
- Dore, C.; Alves, M.; Santos, M.; Cruz, A.; Camara, R.; Castro, A.; Alves, L.; Nader, L.; Leite, E. Antiangiogenic activity and direct antitumor effect from a sulfated polysaccharide isolated from seaweed. Microvasc. Res. 2013, 88, 12–18. [Google Scholar] [CrossRef]
- Jose, G.M.; Kurup, G.M. Sulfated polysaccharides from Padina tetrastromatica arrest cell cycle, prevent metastasis and down regulate angiogenic mediators in HeLa cells. Bioact. Carbohydr. Diet. Fibre 2017, 12, 7–13. [Google Scholar] [CrossRef]
- Evert, J.; Pathak, S.; Sun, X.F.; Zhang, H. A Study on Effect of Oxaliplatin in MicroRNA Expression in Human Colon Cancer. J. Cancer 2018, 9, 2046–2053. [Google Scholar] [CrossRef]
- Soliman, C.; Yuriev, E.; Ramsland, P.A. Antibody recognition of aberrant glycosylation on the surface of cancer cells. Curr. Opin. Struct. Biol. 2017, 44, 1–8. [Google Scholar] [CrossRef]
- Khotimchenko, Y.S. Antitumor Properties of Non starch Polysaccharides: Fucoidans and Chitosans. Russ. J. Mar. Biol. 2010, 36, 321–330. [Google Scholar] [CrossRef]
- Hussien, M.M. Biochemical studies on the Egyptian marine algae. The water soluble polysaccharides of Ulva lactuca. Pak. J. Biochem. Mol. Biol. 1977, 10, 19–24. [Google Scholar]
- Essa, H.; Fleita, D.; Rifaat, D.; Samy, S.; El-Sayed, M.H. Towards optimizing the conventional and ultrasonic-assisted extraction of sulphated polysaccharides from Marine Algae. IOP Conf. Ser. Mater. Sci. Eng. 2018, 464, 1–11. [Google Scholar] [CrossRef]
- Dubois, M.; Gillis, K.A.; Hamilton, J.K.; Rebers, P.A.; Smith, F. Colorimetric methods for determination of sugars and related substances. Anal. Chem. 1956, 28, 350–356. [Google Scholar] [CrossRef]
- Larsen, B.; Haug, A.; Painter, J.T.J. Sulfated polysaccharides in brown algae. Isolation and preliminary characterization of three sulfated polysaccharides from Ascophyllum nodosum. Acta Chem. Scand. 1966, 20, 219–230. [Google Scholar] [CrossRef]
- Garrido, M.L. Determination of sulphur in “plant material”. Analyst 1964, 89, 61–66. [Google Scholar] [CrossRef]
- Timell, T.E. Determination of the degree of polymerization of reducing pentose and hexose oligosaccharides. Svensk Papperstidning 1960, 63, 668–671. [Google Scholar]
- AOAC. Official Methods of Analysis, 16th ed.; Association of Analytica l Chemists, AOAC International: Gaithersburg, MD, USA, 1997. [Google Scholar]
- Blois, M.S. Antioxidant determination by the use of a stable free radical. Nature 1958, 181, 1199–2000. [Google Scholar] [CrossRef]
- Mosmann, T. Rapid colourimetric assays for cellular growth and survival, Application to proliferation and cytotoxicity assays. J. Immunol. Methods 1983, 65, 55–63. [Google Scholar] [CrossRef]
- Sreekumar, B.; Bansal, A.; Ray, A.; Rao, A.; Mishra, A. A rapid MTT colourimetric assay to assess the proliferative index of two Indian strains of Theileria annulata. Vet. Parasitol. 2003, 113, 211–216. [Google Scholar]
- Septisetyani, E.; Ningrum, R.; Romadhani, Y.; Wisnuwardhani, P.; Santoso, A. Optimization of sodium dodecyl sulfate as a formazan solvent and comparison of 3- (4, -5 dimethylthiazo-2-yl)- 2.5 diphenyl tetrazolim bromide (MTT) assay with WST- 1 assay in MCF7 cells. Indones. J. Pharm. 2014, 25, 245–254. [Google Scholar] [CrossRef]
- Thabrew, M.I.; Hughes, R.D.; McFarlane, I.G. Screening of hepatoprotective plant components using a HepG2 cell cytotoxicity assay. J. Pharm. Pharmacol. 1997, 49, 1132–1135. [Google Scholar] [CrossRef]
- Graphpad Software Inc. GraphPad Curve Fitting Guide. 2015. Available online: https://www.graphpad.com/guides/prism/6/curve-fitting/index.htm?reg_dr_inhibit_variable.htm (accessed on 9 January 2019).
Sample Availability: Samples of the compounds are not available from the authors. |


| Fraction | Protein (%) | Carbohydrate (%) | Sulfate (%) | DP |
|---|---|---|---|---|
| F1 | 11.3 ± 0.9 | 13.8 ± 1.1 | 1.20 ± 0.10 | 1 |
| F2 | 18.8 ± 0.8 | 29.3 ± 2.1 | 0.625 ± 0.040 | 1.3~1 |
| F3 | 7.50 ± 0.60 | 3.70 ± 0.26 | 9.06 ± 0.70 | 1.2~1 |
| F4 | 26.9 ± 1.9 | 11.0 ± 0.9 | 11.6 ± 0.9 | 2.5~3 |
| F5 | 10.6 ± 0.9 | 14.9 ± 1.1 | 15.5 ± 1.1 | 3 |
| F6 | 3.10 ± 0.05 | 15.0 ±1.3 | 38.0 ± 2.9 | 3 |
| F7 | 0.200 ± 0.001 | 25.0 ± 2.0 | 32.0 ± 2.7 | 3.3~3 |
| F8 | 0.100 ± 0.007 | 16.1 ± 2.1 | 12.00 ± 1.90 | 4.5~5 |
| V45 | 13.1 ± 1.1 | 29.1 ± 2.1 | 4.10 ± 0.30 | 6 |
| S1 | 5.20 ± 0.31 | 36.2 ± 3.5 | 32.3 ± 3.1 | ___ |
| Functional Group | Wavelength Range (cm−1) | Bond | S1 | V45 | F1 | F2 | F3 | F4 | F5 | F6 | F7 | F8 |
|---|---|---|---|---|---|---|---|---|---|---|---|---|
| Hydroxyl | 3500–3200 | O-H stretch | √ | √ | √ | √ | √ | √ | √ | √ | √ | √ |
| Amide | 1670–1600 | C=O stretch | √ | √ | √ | √ | √ | √ | √ | √ | √ | √ |
| Sulfate | 1450–1350 | S=O stretch | √ | √ | √ | √ | √ | √ | √ | √ | √ | √ |
| Sulfoxide | 1060–1030 | S=O stretch | √ | √ | √ | √ | X | X | X | X | X | √ |
| Ester sulfate | 805–900 | C-O-S stretch | √ | X | X | X | X | X | X | X | X | √ |
| Aromatic ester | 1310–1250 | C=O stretch | √ | X | X | X | X | X | X | √ | √ | √ |
| Thiocarbonyl | 1060–1200(~1110) | C=S stretch | X | X | X | X | √ | √ | √ | √ | √ | X |
| Fraction | HePG2 | HCT116 | A549 | MCF7 |
|---|---|---|---|---|
| F1 | 12.6 ± 1.1 | 0.0 ± 0.1 | 65.3 ± 4.1 | 62.8 ± 3.5 |
| F2 | 20.1 ± 2.5 | 4.0 ± 0.3 | 20.8 ± 2.0 | 0.0 ± 0.1 |
| F3 | 11.2 ± 1.3 | 14.8 ± 1.4 | 4.1 ± 0.2 | 31.4 ± 2.8 |
| F4 | 99.9 ± 8.2 | 32.8 ± 2.9 | 21.1 ± 1.6 | 58.2 ± 5.0 |
| F5 | 99.5 ± 5.0 | 41.1 ± 2.8 | 79.8 ± 6.0 | 99.0 ± 4.3 |
| F6 | 46.8 ± 3.8 | −243 ± 14.0 | −341 ± 20.5 | −116 ± 10.2 |
| F7 | 29.7 ± 1.9 | 66.7 ± 7.0 | 14.7 ± 11.3 | 49.3 ± 3.9 |
| F8 | 32.2 ± 3.1 | 51.8 ± 4.8 | 19.6 ± 1.5 | 99.2 ± 4.1 |
| V45 | 40.4 ± 3.6 | 43.6 ± 3.7 | −128 ± 11.5 | 0.0 ± 0.0 |
| S1 | 54.1 ± 4.8 | 90.2 ± 7.8 | −210 ± 15.0 | 12.9 ± 1.8 |
| Fraction | Cancer Cells | LC50 (µg/mL) | LC90 (µg/mL) |
|---|---|---|---|
| S1 | HCT116 | 37.28 ± 1.032 | 120.3 ± 1.075 |
| F4 | HePG2 | 5.063 ± 1.039 | 19.12 ± 1.086 |
| F5 | HePG2 | 18.66 ± 1.027 | 43.57 ± 1.059 |
| F5 | A549 | 60.68 ± 1.026 | 145.5 ± 1.064 |
| F5 | MCF7 | 22.32 ± 1.035 | 76.69 ± 1.078 |
| F8 | MCF7 | 28.65 ± 0.022 | 105.6 ± 1.120 |
| Fraction (Cell Line) | Hill Coefficient |
|---|---|
| S1 (HCT116) | 1.876 ± 0.102 |
| F4 (HePG2) | 1.654 ± 0.092 |
| F5 (HePG2) | 2.591 ± 0.155 |
| F5 (A549) | 2.512 ± 0.156 |
| F5 (MCF7) | 1.780 ± 0.097 |
| F8 (MCF7) | 1.684 ± 0.129 |
| Glucose | Arabinose | Xylose | Rhamnose | Glucuronic Acid | |
|---|---|---|---|---|---|
| S1 | 23.8 ± 1.9 | 19.5 ± 1.1 | 5.30 ± 0.05 | 36.5 ± 2.0 | 14.9 ± 1.0 |
| F4 | 23.2 ± 1.8 | 44.8 ± 3.1 | 14.3 ± 1.0 | ___ | 17.8 ± 1.5 |
| F5 | 18.0 ± 1.3 | 16.6 ± 1.2 | 9.70 ± 0.50 | 30.0 ± 2.5 | 25.8 ± 2.0 |
| F8 | 9.50 ± 0.03 | ___ | 12.4 ± 0.9 | 69.1 ± 4.3 | 9.00 ± 0.06 |
© 2019 by the authors. Licensee MDPI, Basel, Switzerland. This article is an open access article distributed under the terms and conditions of the Creative Commons Attribution (CC BY) license (http://creativecommons.org/licenses/by/4.0/).
Share and Cite
Abou El Azm, N.; Fleita, D.; Rifaat, D.; Mpingirika, E.Z.; Amleh, A.; El-Sayed, M.M.H. Production of Bioactive Compounds from the Sulfated Polysaccharides Extracts of Ulva lactuca: Post-Extraction Enzymatic Hydrolysis Followed by Ion-Exchange Chromatographic Fractionation. Molecules 2019, 24, 2132. https://doi.org/10.3390/molecules24112132
Abou El Azm N, Fleita D, Rifaat D, Mpingirika EZ, Amleh A, El-Sayed MMH. Production of Bioactive Compounds from the Sulfated Polysaccharides Extracts of Ulva lactuca: Post-Extraction Enzymatic Hydrolysis Followed by Ion-Exchange Chromatographic Fractionation. Molecules. 2019; 24(11):2132. https://doi.org/10.3390/molecules24112132
Chicago/Turabian StyleAbou El Azm, Nihal, Daisy Fleita, Dalia Rifaat, Eric Zadok Mpingirika, Asma Amleh, and Mayyada M. H. El-Sayed. 2019. "Production of Bioactive Compounds from the Sulfated Polysaccharides Extracts of Ulva lactuca: Post-Extraction Enzymatic Hydrolysis Followed by Ion-Exchange Chromatographic Fractionation" Molecules 24, no. 11: 2132. https://doi.org/10.3390/molecules24112132
APA StyleAbou El Azm, N., Fleita, D., Rifaat, D., Mpingirika, E. Z., Amleh, A., & El-Sayed, M. M. H. (2019). Production of Bioactive Compounds from the Sulfated Polysaccharides Extracts of Ulva lactuca: Post-Extraction Enzymatic Hydrolysis Followed by Ion-Exchange Chromatographic Fractionation. Molecules, 24(11), 2132. https://doi.org/10.3390/molecules24112132