Abstract
Understanding the soil moisture behavior in relation to land use in tropical Andean mountain catchments is essential for comprehending water fluxes, ecohydrological relations and hydrological dynamics in this understudied ecosystem. Soils are a key factor of these ecosystems, especially in reference to water level regulation and anthropogenic activities that can alter the interactions, and generate physical, chemical and biological imbalances. In this study, we investigated the relationship between precipitation, soil water content (SWC) and the flow at different pedon scales, and hillslope and microcatchment scales subjected to different land uses. The results showed the relation between the soils uses, topographical conditions and soil moisture at the microcatchment scale. At the pedon scale, soil moisture is higher and with a low variability in depth; high soil moisture content throughout the study period was registered in forest > pasture > coffee agroforestry systems. The topographic wetness index (TWI), despite its adjusted interpretation of the behavior of humidity at the microcatchment scale, is a poor predictor of the behavior of soil humidity at the pedon scale. Pedon water content has a close relation with the precipitation behavior, especially in prolonged dry and humid periods. The soils studied tend to present udic moisture regimes with a dry period of approximately 67 accumulative days per year. The mean flow behavior responds to precipitation and soil moisture behavior at a monthly scale. Understanding the consequences of the land cover changes in relation to soil water behavior, as well as how soil water interacts with the different components of the hydric balance at different scales, allows an understanding of the complex interactions in natural microcatchments under different land use systems.
1. Introduction
Land use changes can have a significant impact on the terrestrial component of the water cycle, Roa-García et al. []. An accurate description of soil moisture behavior requires an understanding of the interplay between precipitation, soil and vegetation. Soil moisture is closely related to soil structure because it affects plant growth by influencing root distribution and the ability to take up water, facilitate oxygen and water infiltration, improve water storage and increase water transfer through soil, Rampazzo et al. []; Pardo et al. [,]. Volcanic ash soils have a large capacity to hold water, amplify differences in land use and limit the potential impact of land use management activities (conservation or restoration) on the water regulation function of catchments, Roa-Garcia et al. []. The studies under forest cover of Lai et al. [] showed the importance of the dynamic interactions between rainfall, antecedent moisture and static soil properties (e.g., soil texture, structure, horizon and macropores) in soil water behavior. The effects of land use and land cover types representative of largely deforested areas of the Amazon basin were studied by Zimmermann et al. [], who reported the importance of land cover on soil hydrological flow paths (infiltrability and field-saturated hydraulic conductivity) in surfaces (12.5 and 20 cm depth). The soils under riparian and natural forest have a higher storage capacity and water availability than the soils under pastures []. Ramírez et al. [] reported soil moisture variability under forests with respect to tillage and pasture in tropical montane forests microcatchments. The results of Guo et al. [] suggested the average soil moisture content in decreasing order of grassland > shrubland > soybean land > maize land > adzuki bean (Vigna angularis) land > forestland.
The measurement of soil moisture and the development of knowledge about its spatio-temporal behavior at the soil profile, slope and watershed levels is of utmost importance to help understand and predict the effects of climate change related to the dynamics of land cover and/or land use change, use and management. Instrumental methods for measuring and monitoring soil moisture behavior, such as gravimetric [], neutron scattering method [,], TDR and FDR capacitive sensor methods and resistive sensor methods [], have been the most widely used for several decades, according to Loazia and Pauwels []; this is as well as the traditional use of soil psychrometers and tensiometers. In recent years, advances have also been made in measurement and monitoring through the use of satellites and infrared radars in research on the measurement and monitoring of moisture at the soil–atmosphere interface Moran et al. []; Loew et al. [].
Most of the research on the relation of soil moisture underlines the connection between soil moisture and land uses; the soil water content dynamics and its behavior in depth are strongly influenced by the slope and geomorphological position (Yang et al. []; Guo et al. []. In a Mediterranean catchment, Llorens et al. [] reported topographic position and soil cover (forest and pasture) as the main factors that control soil moisture patterns of up to 80 cm in depth. The soil depths exposed to more intensive and dynamic wetting and drying cycles presented well-defined water release ranges as compared to the pore system of deeper soil horizons Dörner et al. []. Previous studies of Roa-Garcia et al. [], in three small headwater catchments in the Andean mountains of Colombia under Andisols, underline the importance of soils to contribute to the understanding of the aggregate catchment hydrological behavior; similar results are reported by Berbesi-Jaimes et al. [] in a central mountain Andes catchment under pasture, culture and natural forest. The water retention at wilting point in Andisols diminishes by an average 16% after two years of cultivation. However, the original water retention values of the soil are not recovered with changes to the pasture, Buytaert et al. []. High soil moisture retention rates in Andisols have been reported by Nanzyo et al. []; Poulenard et al. [], Buytaert et al. []; Roa-Garcia et al. []; Dörner et al. []; and Ivelic-Sáez et al. [], with slow percolation rates during the wet season and an increase in surface runoff. Several authors have shown a close relation between rainfall and soil moisture behavior in Andean soils, Buytaert et al. []; Dörner et al. []; Ramirez et al. [].
The aim of this paper is to quantify the effect of site slope conditions, land use, rainfall behavior and environmental conditions on soil moisture behavior in six Andean microcatchments under different land uses. Rainfall and volumetric water content were continuously measured with data loggers under different Andean land uses, i.e., Andean forest, grasslands and coffee agroforestry systems. In situ observations at a number of test sites in two different zones in Colombia were used for this purpose.
2. Materials and Methods
2.1. Study Site
The following study regions are in the central Andes: the Valle del Cauca, the Rio Cali basin (21.526 ha) and Tolima the Río Combeima basin (27.421 ha). Soil moisture behavior was studied in six Andean microcatchments under different land uses. The spatial distribution of the study sites appears in Figure 1, and their major characteristics are summarized in Table 1 and Table 2. The sampling zones cover the main Colombian land uses in the central Andes basins. Soil parent materials are Ibague Batolite granodiorite, phyllites and diabases of the Combeima and Rio Cali basins, respectively. There are two different morphogenetic environments. The Combeima basin has a convex and concave steep mountain landscape (slopes between 50% to 70%) with structural and fluvial erosional dynamics that eventually evolve into landslides (creeping, solifluxion and landslides) and fluvial torrential dynamics with an altitude ranging from 1650 to 2350 m.a.s.l. The Rio Cali basin has hills, steep slopes (between 25% and 50%) with miscellaneous concave and convex slopes modelled by interaction of fluvial erosional and denudational processes with strong anthropic action; the altitude ranges from 1350 to 1750 m.a.s.l. The predominant soils in each catchment were classified as Typic Eutrudepts San Simon soil unit and Typic Haplustalfs 200 soil unit for Combeima and Cali basins, respectively []. A description of the complete soil survey can be found in IGAC [,]. The predominant land uses are natural forest, pasture and coffee agroforestry systems; the main climate in these zones is tropical dry forest to premontane humid forest, according to Holdridge classification []. The mean annual temperatures are 20.8° and 25.4°, mean evapotranspiration 1038 and 1655 mm/year, mean relative humidity 79% and 70%, and annual precipitation 1887 ± 26.7 and 1608 ± 62.7 mm for Combeima and Rio Cali basins, respectively. Seasonal rainfall regime for both is biannual with rainy periods from March to May and from September to November, interspersed with dry seasons.
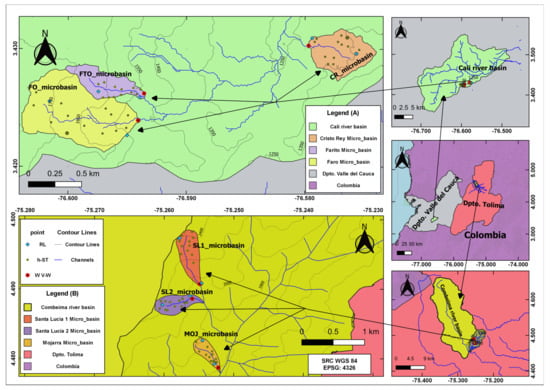
Figure 1.
Location of the experimental microbasins FO, FTO, CR at Cali River basin (A) in the Valle del Cauca region; and SL1, SL2, MOJ at Combeima River basin (B) in the Tolima region. Measurement locations are indicated rain logger (RL), humidity site-tube (h-ST) and wall V-Weir (W V-W). (Microbasin is basically a watershed or hydrographic–hydrologic unit of a small drainage area. In some cases it is referred to in English as microcatchment, being preferable the expression “small watershed or small catchment”, according to Haan et al. []. It can be homologated in the same way as some hydrologists have indicated in terms of headwater (Haigh et al. [], Haan et al. [], as basins of zero order, based on the criterion of order number, delivery network and/or formation of the drainage network).

Table 1.
Microbasins in the Combeima River basin and Cali River basin. Area, georeferencing and altitude gradient.
Table 2.
Study sites and environmental characteristics.
2.2. Soil Survey and Pedostratigraphic Description and Analisys
Ten soil profiles were described, five for each microcatchment. A detailed description can be found in Table 3. The morphology of soil profiles was described on site, morphological characterization and diagnostic properties of the studied soils were performed according to Soil Survey Manual [] and classified according to soil taxonomy []. From the field camp, 33 soil samples were collected and analyzed at the Soil Laboratory of the Universidad del Tolima and Universidad Nacional de Colombia—Medellín campus. The soil samples were oven dried at 65 °C and pulverized. Samples were taken for physical analysis, which included texture [], bulk density and water retention curves.
Table 3.
Soil physical properties.
2.3. Field Instrumentation
From 2015 to 2017, soil water content, rainfall and mean flow or caudal were measured in six microcatchments. For each site, 12 points have been monitored using a soil moisture sensor “capacitance Diviner 2000” portable soil moisture monitoring (SENTEK Sensor Technologies, SENTEK PTY. LTD, Stepney, Australia) at 160 cm depth, volumetric water content was measured every day and stored in a database (Figure 2). Sensors were calibrated in each experimental microcatchment according to Paltineanu and Starr []; the R2 for the calibration equations in the different study sites ranged from 0.97 to 0.99. For each site, precipitation was registered daily using a Sutron’s 5600-0625 tipping bucket rain gauge (Sutron Corporation, Sterling, VA, USA) and Rainlogger Edge 3002 (Solinst, Georgetown, Ontario, Canada). At the closure of microcatchment a V-notch weir was installed to measure the regime flow every 5 min using Levelogger model 3001 sensors (Solinst, Georgetown, Ontario, Canada); the changes in atmospheric pressure were recorded with a Barologger Edge model 3001 (Solinst, Georgetown, Ontario, Canada) to compensate sensor Levelogger registers.
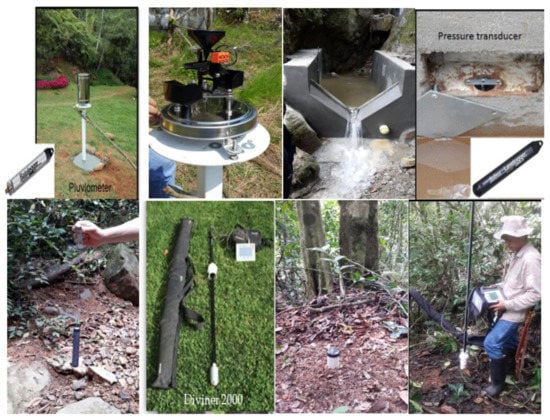
Figure 2.
Main experimental equipment and instruments: tipping bucket and rain logger pluviometers, wall V-Weir with liminimeter and Levelogger; soil moisture monitoring solution, humidity site-tube and operator measuring the soil moisture.
2.4. Data Analysis
Soil moisture content was studied using a geomorphic transect through the slope considering the relationship between soil and geomorphology in the context of hydrological fluxes at the hillslope and microcatchment scale, according to Sidle et al. []. In this paper, (i) detailed soil moisture behavior was monitored at the pedon scale, (ii) the soil moisture fluxes in the hillslope were observed, and (iii) soil moisture content and regime flow were analyzed at microcatchment scale. The first balance analyzed the water storage at the pedon scale, and behavior considered the depth ranges for the soil types and land uses, the second balance focused on water fluxes in the hillslope in relation to soil water content. The third considered soil moisture distribution and behavior in the microbasins. Soil moisture analysis was developed through analysis using Tukey–Kramer post-hoc test (MathWorks, Natick, MA, USA) to confirm where the differences occurred between groups, after one-way ANOVA with a confidence level of 95% and values of p < 0.05 (Table 4). The analysis was developed using the free software MATLAB version MATLAB R2008a (MathWorks, Natick, MA, USA). Also, STATGRAPHICS CENTURION 16.1 software was used to perform a multifactorial analysis of variance at 95% confidence, for the soil moisture content response variable, for which soil use was defined as the main factor and sampling depth, catchment, and climatic season of rain and drought as associated sources of variation. Second-order interactions were also analyzed. Significant statistical differences were declared for p-values less than α = 0.05. All F-ratios were based on the mean square of the residual error and with the Type III Sum of Squares method.
Table 4.
Frequency and distribution of the precipitation for studied microbasins.
3. Results and Discussion
3.1. Rainfall Behavior
During the study period precipitation fluctuated between 1578 ± 37.62 to 2353 ± 23.05 mm/year for the microbasins studied in the Combeima River, and 1340 ± 55.37 to1892 ± 62.55 mm/year in the Cali River (Figure 3). In the Combeima River basin, the wettest period occurred between March and June 2017 (54.18% of total precipitation), and the driest month was in the Cali River basin in December 2015 (0.18% of total precipitation). It was found that 9.4% of the precipitation events had a mean intensity between 43.2 and 54.8 mm/h, and 2.9% of the precipitation events had intensities ≤ 5 mm/h. The Combeima River microbasins registered the highest mean intensity (Table 4). The intensity and volume of precipitation had a high variability between and within watersheds.
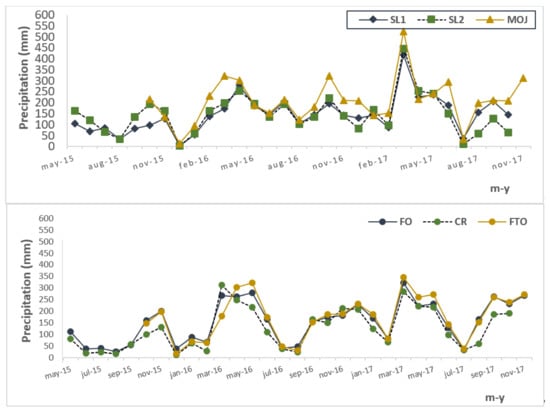
Figure 3.
Monthly distribution of precipitation (May 2015–November 2017) on microbasins SL1, SL2, MOJ in the Combeima River basin (up), and FO, CR, FTO at the Cali River basin (down).
The variability of the precipitation regime can be attributed to microclimatic conditions associated with the dynamics of the orographic rain fronts, due to the effect of the mountain ranges and localized convective processes typical of the inter-Andean valleys (Jaramillo and Chaves [], Roa-García et al. []. In small sectors of the Colombian Andean region, the precipitation volume and maximum rainfall can vary with the position on the slopes, increase with altitudes up to 1300–1500 m.a.s.l., and decreasing from this gradient, Hoyos et al. []. These results confirm the findings of Roa-García et al. [] and Vásquez-Velásquez [] for micro-watersheds in the central Andes under conditions of low montane wet forest (wf-LM) and premontane wet forest (wf-PM). The research results by Roa-García et al. [] and Muñoz-Villers et al. [] associate this response with microclimatic conditions as a function of altitudinal gradient.
Notwithstanding the notable variability in the precipitation volumes and intensities within and between the microbasins, and the fact that during the study period there was a higher mean annual and total accumulated rainfall regime in the Combeima microbasins, in both basins there was what we could call a very similar rainfall regime or gradient that fluctuated between 112 mm and 106 mm per 100 m in the Combeima and Cali River basins, respectively. In addition, the highest annual and accumulated rainfall regime that occurred in the two basins was in the MOJ microbasin, which was at a lower altitudinal range than in the Combeima River basin. This variability between the basins and within each microbasin is explained due to the variability and topographic gradient of location in the context of the physiographic landscape of the sectors, and the interaction between the surrounding geoforms. Moreover, it is emphasized that this variability may be more a function of the interaction and convergence of convective and cyclonic fronts associated with the rainfall of orographic origin in both basins. In the areas studied, a kind of focused circulation of dynamics, flows and valley–mountain interactions was observed and perceived during the day and valley–mountain at night, which, based on the research of Jaramillo and Chaves [], helps to explain the greater or lesser incidence in the variation in rainfall volumes and intensities in the Colombian Andina zone.
3.2. Soil Moisture Behavior
At the soil profile scale, the soil moisture content in the study sites increase in depth, fluctuating between 18% and 64% in dry and wet periods, respectively. The soils under the forest had a low soil moisture variability, followed by pastures and coffee agroforestry systems; under these land uses, soil moisture variability was higher in the first 40 cm of depth and diminished between 90 and 160 cm depth (Figure 4). For the land uses study, the highest values of soil moisture were found in Pasture 1 and Natural Forest 2; the lowest values of soil water content correspond to Coffee Agroforestry System 1 and Pasture 2. In the case of Pasture 1, this high water content was related to high precipitation at the microcatchment scale, and Natural Forest 2 precipitation distribution and the presence of a thick litter layer favored soil moisture regulation. The soil under the forest remains at field capacity throughout the year, even in the dry periods. A possible explanation for this might be high soil infiltration and low runoff, also the water was intercepted by a plant canopy favoring soil moisture regulation inside the soil. For the wet periods in April and May 2015, and March and April 2017, the soil moisture content fluctuates between 54.3% and 64.5%; while for the dry periods of January and February, and July and August 2016, they range from 17% to 25%. The land use with the lowest soil moisture content was Pasture 2 with 6% less than Pasture 1; despite having the same land use, the climatic conditions in each microcatchment determine the soil water content. This finding is consistent with the results of Berbesi et al. [] for Andean natural forests in Colombia. Also, these results at the soil profile scale coincide with those of Zhan et al. [] and Venkatesh et al. [] for different land uses in tropical zones.
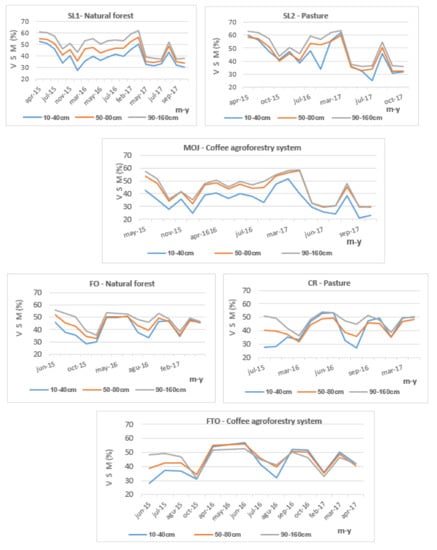
Figure 4.
Behavior of the average volumetric soil moisture (VSM) for depth ranges 1 (10–40 cm), 2 (50–80 cm) and 3 (90–160 cm) at each microbasin and soil use SL1, SL2, MOJ, Combeima River basin and FO, CR, FTO, Cali River basin.
The evaluated land uses in the Combeima River basin at the microbasin scale showed significant differences in relation to soil moisture behavior at three evaluated soil depths. During the periods of April and May 2015, and June to September 2017, the soil moisture showed no significant differences in a depth of up to 80 cm (Table 5 and Table 6, and Figure 4 describe the soil moisture values in relation to its use and geographic location). The soil moisture in the Cali River catchment showed significant differences between microcatchments, except for the microcatchment under the agroforestry systems, which do not display significant differences from 40 and 160 cm depth in the dry period. Similar results were found by Zimmermann et al. []; Rodríguez-Vagaria and Gaspari []; Venkatesh et al. [] and Zhan et al. []. Vásquez-Velásquez [], Roa-García et al. [] and Ramírez et al. [] highlight the role of a precipitation regime related to altitudinal gradient, vegetation type, soil type and land use in explaining soil moisture behavior in Andean mountainous areas. These authors give a secondary role to soil physical properties, such as texture, porosity and bulk density, in soil moisture behavior in Colombian Andisols.
Table 5.
Test Tukey (p < 0.05) for the mean volumetric soil moisture by depth ranges and soil uses in the microbasins of Cali River basin.
Table 6.
Test Tukey (p < 0.05) for the mean volumetric soil moisture by depth ranges and soil uses in the microbasins of Combeima River basin.
3.3. Topographic Wetness Index—TWI
The Combeima River basin showed a low soil moisture content of 38.7% to 46.7% in the middle and upper parts; these percentages were 7% to 20% higher in the low part of the catchment. Similar behavior was observed in the Cali River microbasins where the soil moisture content in the middle and upper part fluctuated from 27.3% to 47.4%, and 7% to 32% more in the low part (Figure 5). The steeper sites in the Combeima (50 to 75% slope) and Cali River (25 to 45% slope) basins had 27% to 47% and 3% to 56%, respectively. This performance is due to the presence of clay soils in the Cali River catchment. The soil texture, slope, rainfall distribution (dry and humid periods) associated with topographic gradients play an important role in the water behavior in soils.
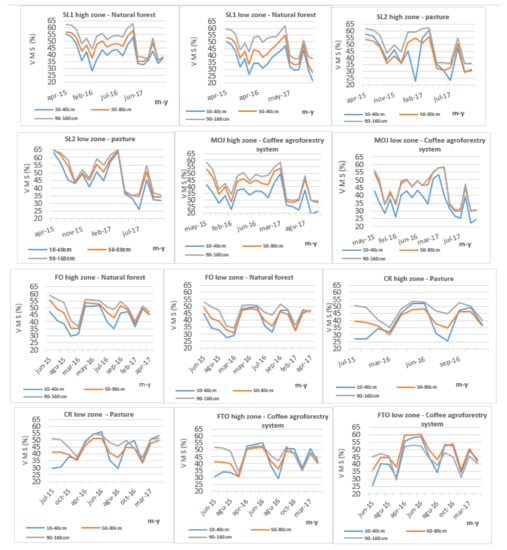
Figure 5.
Behavior of the average volumetric soil moisture (VMS) from the high-zone, low-zone and depth ranges 1 (20–40 cm), 2 (50–80 cm) and 3 (90–160 cm), at the microbasin SL1, SL2, MOJ, Combeima River basin and FO, CR, FTO, Cali River basin.
Similar results for a mountain system in Northeastern Orinoquía in Colombia were reported by Ramírez et al. []. The relation between soil moisture behavior in depth and topographic position was higher in the lower part of the micro-watersheds. Studies conducted by Leiva et al. [] in an Andean Piedmont catchment, showed that during the rainy season, the topographic variables such as curvature, slope and topographic index are relevant in the soil moisture behavior.
3.4. Soil Moisture Variability for Different Soils Uses
The mean soil moisture content under pasture, natural forest and coffee agroforestry systems in the Combeima River catchment were 64.5%, 62.5% and 60.5%, respectively. In the Cali River catchment the mean soil moisture was high in the forest (58.5%) in respect to the pasture (54.5%) and coffee agroforestry systems (54.3%). The mean values in the Combeima River catchment were 6% higher than the values in the Cali River catchment; this soil moisture behavior was related to the precipitation regime at the microcatchment scale, soil type and land uses. The agroforestry systems showed a higher number of dry days (137 days per year) followed by pasture (113 days per year) and natural forest (105 days per year); the last land use registered a great number of days to field capacity. The soil moisture regime was udic where the dry periods were December to February (75 dry days) and June to August (62 dry days); the moist months were March to May (81 wet days) with a maximum and minimum soil moisture of 17% and 65%, respectively (Figure 4 and Table 5 and Table 6). For the entire studied period, the driest months were February 2016 (65% dry days) and August 2017 (75% dry days), with soil moisture values below wilting point; in the wet period the soil was saturated for 168 days consecutively. Previous studies by Roa-García et al. [] and Vásquez-Velásquez [] report similar results for these types of land uses in the Colombian Andean mountain context.
In addition to evaluating the response of the HVS as a function of the three depth levels corresponding to the soil horizons studied, this response was evaluated as a function of the land use factor itself, of the region or basin, of the rainy and dry climatic regime associated with periods with ustic and udic regimen soil moisture, by the interaction of land use and depth, the interaction of land use and climatic regime, and the interaction of land use, depth and climatic regime. It was found that there are no statistically significant differences in the HVS due to soil use; however, the coffee agroforestry system with coffee presented much lower average values than the natural forest and pasture uses. A high statistical significance between the depth ranges and the HVS is ratified, being increasingly higher when going from depth range 1 (10–40 cm) to 2 (50–80 cm) to 3 (90–160 cm). Although there are no statistically significant differences between the river basins, there was a tendency to present higher HVS values in the Cali River basin; in this perspective, in spite of finding statistically significant differences between the rainy and dry regimes in both basins, a much greater range of extreme values was observed in the HVS in the dry season in the Cali River basin than in the Combeima River basin, and there was a better regulation of the rainy season in the Combeima river basin with a lower variation in the average values in this regime. The interaction between land use and climatic regime with the HVS did not show statistically significant differences, but it was observed that the HVS values remained constant in the natural forest and coffee agroforestry system during the rainy season with some increases in the use of pastures; the use of the coffee agroforestry system showed the lowest values in the drought regime.
In addition to finding highly significant statistical differences resulting from the interaction between watershed and land use with the HVS, for land use in the natural forest the range of average values presents a minimal variation with a slight tendency to increase from the Combeima River basin to the Cali River basin, showing in general the behavior of the HVS content to remain constant and regulated; this is most likely attributable to the regulating effect of the natural forest use, the contribution of organic matter to the soil and a greater presence of clayey material in the soils of the Cali River basin. In the interaction between soil use and depth with the HVS, although no statistically significant differences were found, there were slightly higher values in the depth range 3 (90–160 cm) in association with the forest, while in the coffee agroforestry system the HVS content tends to remain constant in depth ranges 2 (50–80 cm) and 3 (90–160 cm). An analysis of covariance between bulk density and HVS did not show statistically significant differences, although it is known that there is a close relationship between these two variables. The results of these multivariate or multifactorial analyses of variance are shown in Table 7 and Table 8.
Table 7.
Analysis of variance for mean (VSM) sum of squares type III.
Table 8.
Analysis of variance for mean (VSM) sum of squares type III.
3.5. Water Behavior at Microcatchment Scale
During the observed period (May 2015 to May 2017), the highest precipitation events were registered in 2016 and the lowest in 2016; the rainiest months were April 2016 (417.1 mm) and March 2017 (278.7 mm). There was an alternation between dry and wet months recorded, without a clear trend that would establish a marked period of rain and drought. In respect to evapotranspiration in the Combeima River catchment, the highest evapotranspiration values were registered in August 2015 (128 mm) and September 2016 (110 mm); the lowest value was registered in February 2017 (71.5 mm). The evapotranspiration showed a clear seasonal trend, and increased or decreased in relation with dry and wet periods (Figure 6). Our results reveal the close relation between rainy periods and caudal increases in all the studied microcatchments; this behavior continues until after 2 or 3 months of the rainy period. The discharge lag time in the studied microcatchments was 1 to 2 months, the base flow response had a close relation with the precipitation and soil moisture content. The soil moisture had a direct relation with rainfall behavior, in fact the periods of higher soil moisture content correspond to the periods of higher rainfall. This soil moisture and precipitation dynamic is clear in the periods October and November 2015, and February and March 2017, where precipitation increase was directly proportional to an increase in the soil moisture content and caudal. The soil moisture content was between field capacity and saturation 69.8% of the time per year, 21% corresponds to the wilting point. The soil water content was adequate to guarantee soil water stock, subsurface flows and base flow, maintaining the minimum required flow of a river for maintaining ecological status during dry periods in all the studied microbasins. The soils under the natural forest showed a high soil moisture content with scarce variability between the dry and wet periods. Of the studied land uses, the Combeima River catchment showed the highest soil moisture values at the pedon and microcatchment scales, and better hydrological regulation in comparison with Cali River microbasins. The soil moisture and caudal behavior were closely related to precipitation distribution within altitudinal ranges.
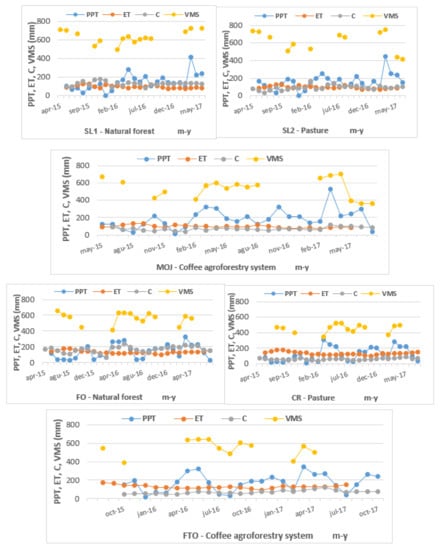
Figure 6.
Water balance components distribution (BH) (April 2015–May 2017). Precipitation (P), evapotranspiration (ET), caudal (C), volumetric soil moisture (VMS) at the microbasin SL1, SL2, MOJ, Combeima River basin (up), and FO, CR, FTO, Cali River basin (down).
4. Conclusions
During the studied period, the soil moisture showed an increase in all land uses with a low variability in depth, keeping the soil moist most of the year; for up to 40 cm depth, the soil showed high soil moisture variability throughout the year. The relation between soil moisture and precipitation was more closed in the periods of high precipitation volumes and intensity. For the dry periods or with irregular precipitation, the soils tend to be humid at a depth of 40–160 cm, with slight variations from the surface to 40 cm depth. The soil moisture behavior was forest > pasture > coffee agroforestry systems. The lowest value of soil moisture was 17% and the maximum was 64.5%; the rainfall volume with a high effect in soil recharge was 15–30 mm. At the soil profile scale, the influence of topography on soil moisture behavior was not obvious. Nevertheless, at the microbasin scale it became clear. The mean soil moisture at the microbasin scale fluctuates between 54.3% and 64.5%, with an increase in caudal and soil moisture in direct relation to precipitation volume.
Author Contributions
H.G.-S. designed the doctoral research project that is the basis of this manuscript; he collected and processed the experimental data. Together with J.C.L.-U. and J.I.V.-U., this manuscript was written and revised during the process. All authors have read and agreed to the published version of the manuscript.
Funding
This research was financed by the regional environmental authorities CVC and CORTOLIMA, Universidad del Tolima and Henry Garzón Sánchez’s own resources.
Institutional Review Board Statement
Not applicable.
Informed Consent Statement
No applicable.
Data Availability Statement
In case anyone is interested in knowing the base data and support of this research, please contact Henry Garzón Sánchez.
Acknowledgments
A special thanks to the Universidad del Tolima and Universidad Nacional de Colombia Sede Medellín; Regional environmental authorities in Colombia CVC-Valle del Cauca and CORTOLIMA-Tolima for their financial support of the base doctoral research thesis and support of this work. Our thanks to Leigh Sanders for her reading and feedback and, finally, to the anonymous reviewers whose contributions substantially improved this paper.
Conflicts of Interest
The authors declare that there are no disclosures to be made.
References
- Roa-García, M.C.; Brown, S.; Schreier, H.; Lavkulich, L.M. The role of land use and soils in regulating water flow in small headwater catchments of the Andes. Water Resour. Res. 2011, 47. [Google Scholar] [CrossRef]
- Rampazzo, N.; Blum, W.E.H.; Wimmer, B. Assessment of soil structure parameters and functions in agricultural soils. Bodenkultur 1998, 49, 69–84. [Google Scholar]
- Pardo, A.; Amato, M.; Chiarandà, F.Q. Relationships between soil structure, root distribution and water uptake of chickpea (Cicer arietinum L.). Plant growth and water distribution. Eur. J. Agron. 2000, 13, 39–45. [Google Scholar] [CrossRef]
- Franzluebbers, A. Water infiltration and soil structure related to organic matter and its stratification with depth. Soil Tillage Res. 2002, 66, 197–205. [Google Scholar] [CrossRef]
- Lai, X.; Liao, K.; Feng, H.; Zhu, Q. Responses of soil water percolation to dynamic interactions among rainfall, antecedent moisture and season in a forest site. J. Hydrol. 2016, 540, 565–573. [Google Scholar] [CrossRef]
- Zimmermann, B.; Elsenbeer, H.; De Moraes, J.M. The influence of land-use changes on soil hydraulic properties: Implications for runoff generation. For. Ecol. Manag. 2006, 222, 29–38. [Google Scholar] [CrossRef]
- Bruijnzeel, L. Hydrological functions of tropical forests: Not seeing the soil for the trees? Agric. Ecosyst. Environ. 2004, 104, 185–228. [Google Scholar] [CrossRef]
- Ramírez, B.H.; Teuling, A.J.; Ganzeveld, L.; Hegger, Z.; Leemans, R. Tropical Montane Cloud Forests: Hydrometeorological variability in three neighbouring catchments with different forest cover. J. Hydrol. 2017, 552, 151–167. [Google Scholar] [CrossRef]
- Guo, X.; Fu, Q.; Hang, Y.; Lu, H.; Gao, F.; Si, J. Spatial Variability of Soil Moisture in Relation to Land Use Types and Topographic Features on Hillslopes in the Black Soil (Mollisols) Area of Northeast China. Sustainability 2020, 12, 3552. [Google Scholar] [CrossRef]
- WMO. Guide to Meteorological Instruments and Methods of Observation, 7th ed.; WMO-No. 8; WMO: Geneva, Switzerland, 2008; Cap. I.4-1–I.4-30; Available online: https://mail.google.com/mail/u/0/?ogbl#inbox?compose=new&projector=1 (accessed on 19 May 2021).
- Florentino, A. Métodos para medir el contenido de agua en el suelo. Venesuelos 2006, 14, 48–70. [Google Scholar]
- Loaiza-Usuga, J.C.; Pauwels, V.R.N. Utilización de sensores de humedad para la determinación del contenido de agua en el suelo (Ecuaciones de Calibración). Suelos Ecuat. SCCS 2008, 38, 24–33. [Google Scholar]
- Moran, M.S.; McElroy, S.; Watts, J.M.; Peters-Lidard, C.D. Radar Remote Sensing for Estimation of Surface Soil Moisture at the Watershed Scale. Can. J. Remote Sens. 2004, 30. [Google Scholar] [CrossRef]
- Loew, A.; Stacke, T.; Dorigo, W.; de Jeu, R.; Hagemann, S. Potential and limitations of multidecadal satellite soil moisture observations for selected climate model evaluation studies. Hydrol. Earth Syst. Sci. 2013, 17, 3523–3542. [Google Scholar] [CrossRef]
- Yang, T.; Ala, M.; Zhang, Y.; Wu, J.; Wang, A.; Guan, D. Characteristics of soil moisture under different vegetation coverage in Horqin Sandy Land, northern China. PLoS ONE 2018, 13, e0198805. [Google Scholar] [CrossRef]
- Llorens, P.; Latron, J.; Gallart, F. Dinámica espacio-temporal de la humedad del suelo en un área de montaña mediterránea. Cuencas experimentales de Vallcebre (Alto Llobregat). Estud. Zona No Saturada Suelo 2003, 6, 71–76. [Google Scholar]
- Dörner, J.; Huertas, J.; Cuevas, J.G.; Leiva, C.; Paulino, L.; Arumí, J.L. Water content dynamics in a volcanic ash soil slope in southern Chile. J. Plant Nutr. Soil Sci. 2015, 178, 693–702. [Google Scholar] [CrossRef]
- Berbesí-Jaimes, A.; Loaiza-Usuga, J.C.; Casamitjana-Causa, M.; Cardona-Gallo, S.; Correa, G.A. Hydrogeochemical nitrogenous behaviour in an Andean agricultural basin. In Water in Agricultural Practices: Training the Trainers: Water Perspectives in Emerging Countries; Cuvillier Verlag: Göttingen, Germany, 2019; ISBN 9783736971004. [Google Scholar]
- Buytaert, W.; Deckers, J.; Dercon, G.; De Bièvre, B.; Poesen, J.; Govers, G. Impact of land use changes on the hydrological properties of volcanic ash soils in South Ecuador. Soil Use Manag. 2006, 18, 94–100. [Google Scholar] [CrossRef]
- Nanzyo, M.; Shoji, S.; Dahlgren, R. Physical characteristics of volcanic ash soils. In Volcanic Ash Soils: Genesis, Properties and Utilization, Development in Soil Science; Shoji, S., Nanzio, M., Dahlgren, R., Eds.; Elsevier: Amsterdam, The Netherlands, 1993; Volume 17, pp. 189–201. [Google Scholar]
- Poulenard, J.; Podwojewski, P.; Janeau, J.-L.; Collinet, J. Runoff and soil erosion under rainfall simulation of Andisols from the Ecuadorian Páramo: Effect of tillage and burning. Catena 2001, 45, 185–207. [Google Scholar] [CrossRef]
- Ivelic-Sáez, J.; Zúñiga, F.; Valle, S.; Lopez, I.; Dec, D.; Dörner, J. Functional resistance and resilience of the pore system of an andisol exposed to different strategies of pasture improvement under sheep grazing. J. Soil Sci. Plant Nutr. 2015, 15, 663–679. [Google Scholar] [CrossRef][Green Version]
- SSS. Soil Survey Field and Laboratory Methods Manual; Burt and Soil Survey Staff, Ed.; Soil Survey Investigations Report No. 51, Version 2.0; USDA U.S. Department of Agriculture, Natural Resources Conservation Service: Washington, DC, USA, 2014.
- IGAC. Estudio General de Suelos y Zonificación de Tierras del Departamento del Tolima; Instituto Geografico Agustin Codazzi: Bogota, Colombia, 1997.
- IGAC. Estudio General de Suelos y Zonificación de Tierras del Departamento del Valle del Cauca; Instituto Geografico Agustin Codazzi: Bogota, Colombia, 2005.
- Holdridge, L.R. Life Zone Ecology; Tropical Science Center: San José, Costa Rica, 1967. [Google Scholar]
- Haan, C.T.; Barfield, B.J.; Hayes, J.C. Design Hydrology and Sedimentology for Small Catchments; Academic Press: Cambridge, MA, USA, 1994; 588p. [Google Scholar]
- Haigh, M.J.; Jansky, L.; Hellin, J. Headwater deforestation: A challenge for environmental management. Glob. Environ. Chang. 2004, 14, 51–61. [Google Scholar] [CrossRef]
- SSS. Soil Survey Manual. In USDA Handbook 18; Ditzler, C., Scheffe, K., Monger, H.C., Eds.; Government Printing Office: Washington, DC, USA, 2017. [Google Scholar]
- Bouyoucos, G.J. Hydrometer method improved for making particle size analysis of soils. Agron. J. 1962, 54, 464–465. [Google Scholar] [CrossRef]
- Paltineanu, I.C.; Starr, J.L. Real-time Soil Water Dynamics Using Multisensor Capacitance Probes: Laboratory Calibration. Soil Sci. Soc. Am. J. 1997, 61, 1576–1585. [Google Scholar] [CrossRef]
- Sidle, R.C.; Gomi, T.; Usuga, J.C.L.; Jarihani, B. Hydrogeomorphic processes and scaling issues in the continuum from soil pedons to catchments. Earth-Sci. Rev. 2017, 175, 75–96. [Google Scholar] [CrossRef]
- Jaramillo, Á.; Chaves, B. Distribución de la precipitación en Colombia analizada mediante conglomeración estadística. Cenicafé 2000, 51, 102–113. [Google Scholar]
- Hoyos, N.; Waylen, P.R.; Jaramillo, A. Seasonal and spatial patterns of erosivity in a tropical watershed of the Colombian Andes. J. Hydrol. 2005, 314, 177–191. [Google Scholar] [CrossRef]
- Vásquez-Velásquez, G. Headwaters Deforestation for Cattle Pastures in the Andes of Colombia and Its Implications for Soils Properties and Hydrological Dynamic. Open J. For. 2016, 6, 337–347. [Google Scholar] [CrossRef][Green Version]
- Muñoz-Villers, L.; Holwerda, F.; Gómez-Cárdenas, M.; Equihua, M.; Asbjornsen, H.; Bruijnzeel, L.; Marín-Castro, B.; Tobón, C. Water balances of old-growth and regenerating montane cloud forests in central Veracruz, Mexico. J. Hydrol. 2012, 462–463, 53–66. [Google Scholar] [CrossRef]
- Zhan, T.; Qiu, Q.; Xu, W. Analytical solution for infiltration and deep percolation of rainwater into a monolithic cover subjected to different patterns of rainfall. Comput. Geotech. 2016, 77, 1–10. [Google Scholar] [CrossRef]
- Venkatesh, B.; Lakshman, N.; Purandara, B.; Reddy, V. Analysis of observed soil moisture patterns under different land covers in Western Ghats, India. J. Hydrol. 2011, 397, 281–294. [Google Scholar] [CrossRef]
- Rodriguez-Vagaria, A.; Gaspari, F. GeoQ: Herramienta para la determinación del número de curva y escorrentía bajo entorno SIG IDRISI ANDES. Rev. Int. Cienc. Tecnol. Inf. Geogr. 2010, 10, 11–26. [Google Scholar] [CrossRef]
- Leiva, N.; Rubiano, Y.; Peña, A.J. Evaluation of soil moisture using topographic (dem), climate and soil parameters in a piedmont area of Villavicencio. Rev. EIA 2015, 12, 61–75. [Google Scholar]
Publisher’s Note: MDPI stays neutral with regard to jurisdictional claims in published maps and institutional affiliations. |
© 2021 by the authors. Licensee MDPI, Basel, Switzerland. This article is an open access article distributed under the terms and conditions of the Creative Commons Attribution (CC BY) license (https://creativecommons.org/licenses/by/4.0/).