Abstract
Earthquake nowcasting (EN) is a modern method of estimating seismic risk by evaluating the progress of the earthquake (EQ) cycle in fault systems. EN evaluation is based on a new concept of time, termed ’natural time’. EN employs natural time, and uniquely estimates seismic risk by means of the earthquake potential score (EPS), which has been found to have useful applications both regionally and globally. Amongst these applications, here we focused on Greece since 2019, for the estimation of the EPS for the largest-magnitude events, (USGS) ≥ 6, that occurred during our study period: for example, the 6.0 WNW-of-Kissamos EQ on 27 November 2019, the 6.5 off-shore Southern Crete EQ on 2 May 2020, the 7.0 Samos EQ on 30 October 2020, the 6.3 Tyrnavos EQ on 3 March 2021, the 6.0 Arkalohorion Crete EQ on 27 September 2021, and the 6.4 Sitia Crete EQ on 12 October 2021. The results are promising, and reveal that the EPS provides useful information on impending seismicity.
1. Introduction
Greece has the highest seismicity in Europe, and statistically produces a large-magnitude (M) earthquake (EQ) of the order of M6.0 almost every year [1,2,3]: in this sense, Greece is a natural laboratory for seismology, and the short repeat time in the region provides the opportunity to explore changes in regional seismicity rates over “earthquake cycles”. Here, we report the results obtained by the new method of earthquake nowcasting (EN), introduced by Rundle, Turcotte, and coworkers [4]. In this method, to answer the question of the current hazard level of the region, we simply counted the number of small EQs since the last large EQ. Event-counting as a measure of “time”, rather than clock time, is known as “natural time”, a concept that was introduced by Varotsos et al. [5,6,7,8,9]. Rundle et al. [4] pointed out that the use of natural time has the following two advantages when applied to EQ seismicity: firstly, it is not necessary to decluster the aftershocks, as natural time is uniformly valid when aftershocks dominate, when background seismicity dominates, and when both contribute; secondly, in computing nowcasts, the concept of natural time—counts of small EQs—is used as a measure of the accumulation of stress and strain between large EQs in a defined geographic region.
In other words, the basis of nowcast is the use of natural time. There exist two advantages, as mentioned, to using natural time: the first is that it is not necessary to separate the aftershocks from the backgroung seismicity; the second is that only the natural interevent count statistics are used, rather than the seismicity rate, which involves conventional (clock) time as well. The nowcasting method considers an “EQ cycle” as the recurring large EQs in a large seismically active region comprising several active faults, rather than the traditional focus on recurring events on individual faults. Following Pasari [10] (see also Pasari et al. [11]), we may state that, though the idea of natural time is unique in its characteristics, the notion of “EQ cycle” has been applied in many earlier seismological studies [12,13,14].
The method of EN has been widely and successfully applied in the estimation of the seismic risk in global megacities [15], in the study of induced seismicity [16], in the study of temporal clustering of global EQs [17], in clarifying the role of small EQ bursts in the dynamics associated with large EQs [18], in understanding the complex dynamics of EQ faults [19], in identifying the current state of the “EQ cycle” [20,21,22], in nowcasting avalanches [23], in the Olami–Feder–Christensen model [24], and, very recently, in the study of volcanic eruptions [25]. Here, we studied the largest-magnitude events, with (USGS) ≥ 6, that occurred in Greece between 1 January 2019 and 6 February 2023 (see Figure 1 and Table 1), by means of the earthquake potential score (EPS) (see below).
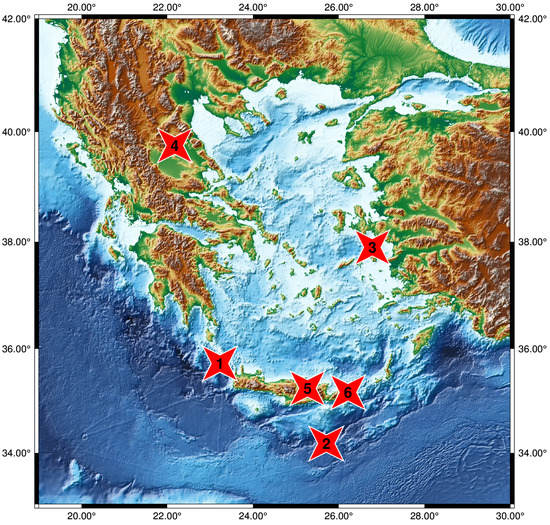
Figure 1.
Map with the epicenters (red stars) of the six events with (USGS) ≥ 6 during the period 1 January 2019 to 6 February 2023, in Greece. The stars correspond, from top to bottom, to the 6.3 Tyrnavos EQ on 3 March 2021, the 7.0 Samos EQ on 30 October 2020, the 6.0 WNW-of-Kissamos EQ on 27 November 2019, the 6.0 Arkalohorion Crete EQ on 27 September 2021, the 6.4 Sitia Crete EQ on 12 October 2021, and the 6.5 off-shore Southern Crete EQ on 2 May 2020, respectively, with their corresponding numbers in Table 1. Reference [26] was used to produce this map.

In general, natural time analysis (NTA), which was reviewed in [9] and, more recently, in [27], reveals the dynamical evolution of a complex system, and identifies when it enters a critical stage. As such, NTA is able to play a key role in predicting impending catastrophic events, such as the occurrence of large EQs: in this sense, it was applied in cases of EQs in Greece [5,7,8,28,29,30,31], Japan [32,33,34], the USA [35,36], Mexico [37,38,39], the Eastern Mediterranean [40,41], and globally [42,43,44]. We note that NTA allows the introduction [5,45,46] of an entropy, S, which is a dynamic entropy [47] that exhibits positivity, concavity, and Lesche [48,49] experimental stability. Complexity measures [50] based on natural time entropy, and on S itself, have recently been applied to the study of EQs in Japan [51,52,53,54] and Mexico [55,56], with promising results [57]. Specifically, as mentioned very recently in the Preface of [27], two quantities, which are described below, have emerged from natural time analysis, to play an important role in estimating if and when the critical point (mainshock, the new phase) is approached.
First, the order parameter of seismicity: its value (=0.070) identifies when the system enters the critical stage; as for its fluctuations, their minimum marks the time when the Seismic Electric Signals (SES) [58,59,60,61,62,63] activities initiate [64]. The SES amplitude is important, as it enables the estimation of the magnitude of the impending mainshock, and the epicentral area is estimated on the basis of the SES selectivity map of the station, which records the relevant SES (on this basis, a successful prediction was issued [29,31,65] for an EQ that occurred on 8 June 2008 in the Andravida area in Greece).
Secondly, the entropy change, , under time reversal: its value–when minimized a few months in advance–marks the initiation of precursory phenomena; as for its fluctuations (when the minimum of appears), they exhibit an evident increase, pointing to the time when the EQ preparation starts, as explained by the physical model that inspired the SES research [63].
These two quantities were used for the study of precursory phenomena before the following two major EQs: the 9.0 Tohoku EQ on 11 March 2011, which was the largest event ever recorded in Japan; and the Chiapas EQ that occurred on 7 September 2017, which was the largest EQ in Mexico for more than a century.
2. Data and Methods
For the present analysis, the events reported since 1 January 1980 in the United States Geological Survey (USGS) earthquake catalog—as described in [66] (see also https://earthquake.usgs.gov/fdsnws/event/1/)—were used (accessed on 6 February 2023). Additionally, the EQs (since 24 February 1964) of the National Observatory of Athens (NOA) earthquake catalog [2], available at https://www.gein.noa.gr/en/services-products/earthquake-catalogs/, were considered (accessed on 6 February 2023).
As concerns notation, the generic symbol M stands for the EQ magnitude, i.e., the preferred magnitude either in the USGS or the NOA catalog, while (USGS), or simply , is used for the moment magnitude [67] of the USGS. The local EQ magnitude reported by the NOA is denoted by ML(NOA), when needed.
We now examine, within the regions and of the USGS and the NOA catalogs, respectively, the completeness magnitude of the Gutenberg–Richter (GR) law [68] of EQs. The latter states that:
where is the number of EQs exceeding a magnitude M, while a is related to the total seismicity rate of the region, and b, which should usually be observed to be near 1, is set by the level of seismicity in the region [69]. A catalog is assumed to be complete (in a certain space–time region), at least for a magnitude , when every earthquake of magnitude at least in that space–time region is present in the catalog, assurance of which is secured by the validity of Equation (1) (see, e.g., [2,70]). The maximum likelihood estimation [71] for the GR law is shown in Figure 2 for the aforementioned regions: this results in with , and with for the USGS and NOA catalogs, respectively. In simple words, a GR law b-value equal to 1 means that, when assuming ≈ 1000 3 events to have occurred in a spatial region since the last 6 EQ, another 6 EQ should be expected soon.
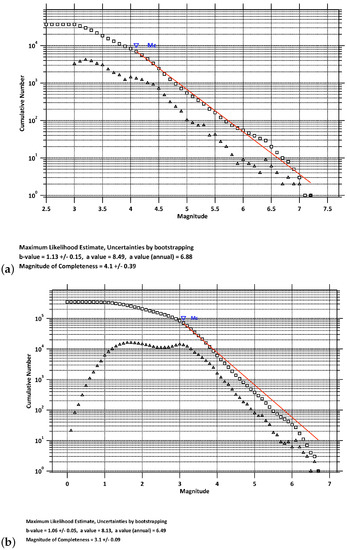
Figure 2.
Determination of for: (a) the USGS catalog; (b) the NOA catalog. The squares depict , while the triangles depict the number of EQs that occurred during the concerned period, within a range of magnitude.
Earthquake nowcasting [4] uses an EQ catalog to calculate, from the number n of “small” EQs —defined as those with magnitude , but above a threshold , i.e., — that occurred after the last “large” EQ, the level of hazard for such a “large” EQ: thus, the number n stands for the waiting natural time or interoccurrence natural time [39,41,44]. The current value, , in a given region since the occurrence of the last “large” EQ is compared with the cumulative distribution function (CDF) obtained, when ensuring that we have enough data to span at least 20 or more “large” EQ cycles. The EPS equals the current CDF value, i.e., EPS = , and is therefore a unique measure of the current level of hazard, which assigns a number between 0 and 100%. For the calculation of the CDF, the EQs with depths smaller than a certain value D within the region are considered. The seismic risk for various cities throughout the world has been estimated [4,10,15,72,73,74,75] by first calculating the CDF within a large region—such as and in our case—and comparing it with the number of the “small” EQs around the city: these being the EQs that had occurred within a circular area of epicentral distances, , since the occurrence of the last “large” EQ there. As EQs exhibit ergodicity [76,77,78], Rundle et al. [15,73] proposed that the seismic risk for the city can be found by substituting for in the aforementioned CDF, i.e.,
In other words, whereas the statistics come from the large map region, (see, e.g., Figure 3a), the current count of “small” EQs comes from “small” events that occur within the circular region of radius, (see, e.g., Figure 3b). We note that EN calculations are not based on a model, but on the empirical CDF obtained. Exact details of the rankings in EN may be sensitive to the radius R and depth D of the circular region, the spatial extent of the large region in the map, and the quality and completeness of the catalog data. It is possible to have an EPS = 100%, meaning that a large EQ is overdue, based on historical catalog statistics. Weibull statistics has been used in many cases [10,39,41,44,74], to approximate the empirical CDF, in order to convert into a probability.
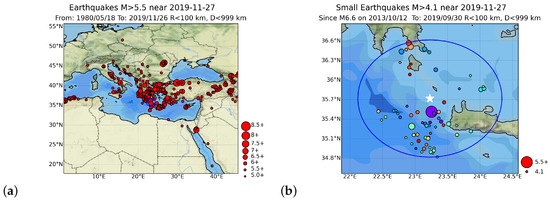
Figure 3.
Analysis example for the WNW-of-Kissamos EQ on 27 November 2019: = 6.0; ML(NOA) = 6.1 within 100 km radius of the epicenter. Panel (a) depicts the regional seismicity during the period from 18 May 1980 to 26 November 2019, just before the EQ occurrence. Panel (b) depicts the local seismicity since the last = 6.6 EQ, on 12 December 2013.
Here, we employed the most recent version of the Megacities Earthquake Nowcasting software [66] (see also [15,73]), which used the empirical CDF estimated in the large region, as shown in Figure 3a, to calculate the EPS on the basis of Equation (2), and by assuming in each catalog case. We also considered, as the center of the circular region, the epicenter of each of the strong EQs compiled in Table 1. Rundle et al. [15,73], when considering in their Figure 2 the large area , in order to estimate the EPS for EQs of magnitude greater than or equal to = 6.5, assumed 400 km and km around the capital of Greece, i.e., Athens. Following [72], and taking into account that the scaling is expected to hold for the linear size of both the aftershock [79] and the foreshock [80] zone of a mainshock of magnitude , we assumed that
This led to 126 km for the case of , which was further truncated to 100 km for simplicity, and was used throughout this study. Moreover, the value of D was not considered essential, as EQs deeper than are extremely rare in Greece: thus, we set km.
Finally, we briefly describe the self-consistent method of producing average EPS maps, also termed ⟨EPS⟩ maps, using a coarse-grain radius, R: this was introduced and applied to the Eastern Mediterranean area in [41], and was further developed by Perez-Oregon et al. [39] and Christopoulos et al. [44]. To construct such a map, one first estimates the EPS for disks of radius R centered at the points of a lattice (here, of a unit cell ), to obtain the EPS; one then averages, for each point , the estimated EPS values within the same radius, R, i.e.,
where the summation is restricted to the lattice points whose distances from the observation point are smaller than or equal to R, with N standing for the number of lattice points included in the sum.
3. Results
Using the USGS catalog, we studied all six EQs with 6 during the period from 1 January 2019 to 6 February 2023. The results for , , and km are shown in Figure 4. The corresponding EPS just before the EQ occurrences was inserted into the last column of Table 1.
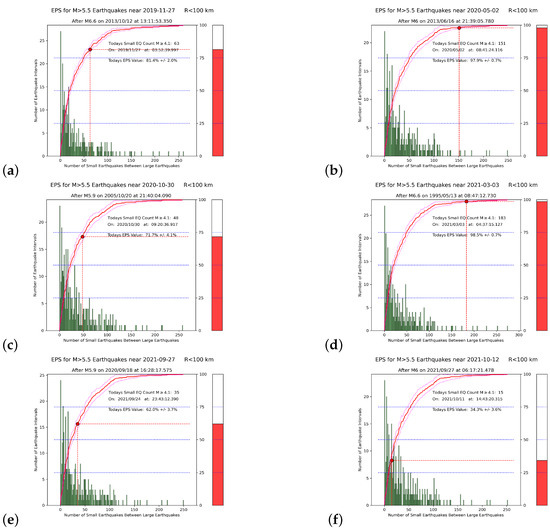
Figure 4.
Earthquake nowcasts, when using the USGS catalog with , within the 100 km circle around each of the Figure 1 EQs in Greece. Panels (a–f) correspond to the Kissamos, off-shore Southern Crete, Samos, Tyrnavos, Arkalohorion, and Sitia Crete EQs, respectively, in Table 1. Green bars comprise the histogram of the number of small EQs within each circular region. The red curve is the experimental CDF, and the red dot corresponds to its value at the current number, , of “small” EQs since the last large event. The thermometer on the right side is a pictorial representation of the current state of the “EQ cycle”.
As an example, we also present, in Figure 5, the EN results obtained when using the NOA catalog for the Tyrnavos EQ. Since the unification in 2012 of the Greek national seismological network, the NOA catalog has been substantially improved, in terms of both the detectability of seismic events and the magnitude of completeness. Recent EQ activity has been well-monitored in Greece, and the EQ catalog of the NOA is the richest database for investigating the associated seismicity patterns [1,2,81]. As mentioned, for the NOA catalog, = 3.1, (see Figure 2b): hence, we considered, in the NOA case, , and the corresponding EPS became 91.3% (see Figure 5c), in comparison to 98.5% when using the USGS catalog (see Figure 4d).
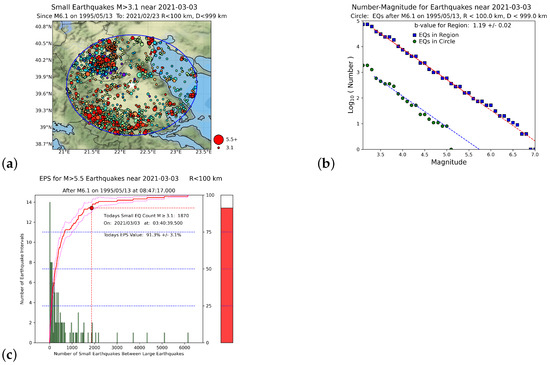
Figure 5.
EN results for the Tyrnavos EQ on 3 March 2021, using the NOA catalog with = 3.1: (a) map of EQs near Tyrnavos, Greece having magnitude since 1995; the blue circle centered at the Tyrnavos EQ epicenter (white star) has radius 100 km; (b) GR law statistics; the upper blue square symbols are all EQs in the region as a whole; the lower green circles are all EQs inside the circular area shown in (a) since the last ML(NOA) = 6.1 EQ on 13 May 1995, i.e., the date of the = 6.6 EQ at Grevena–Kozani; (c) Nowcast for ; the green bars are a histogram of the number of small EQs within the circular region; the red curve is the experimental CDF, and the red dot corresponds to its value at the current number of “small” EQs since the last “large” ML(NOA) = 6.1 event on 13 May 1995, inside the blue circle of panel (a); the thermometer on the right side is a pictorial representation of the current state of the “EQ cycle”.
4. Discussion
In physics, event count models are called natural time models, as counts of small events represent a physical or natural time scale characterizing the system dynamics. The fundamental assumption [82] is that a deficiency of large EQs within a local region contained within a seismically active larger region will eventually be filled in by the occurrence of large EQs. The idea is that the statistics of smaller regions over long times will be the same as the statistics of the larger region over large spatial domains and long times. Small events can therefore be used as a kind of “clock” that marks the “natural time” between the large events.
An inspection of Table 1 reveals that in five out of the six strong EQs studied, the EPS values exceed 50%: this result is compatible with the EPS value obtained in [72], just before the occurrence of the EQ that struck Western Greece on 25 October 2018, which had an epicenter at 37.5 N 20.6 E, i.e., close to the Zakynthos island [83]. In that study, the SES—which, we recall, are low-frequency 1 Hz) electric signals that precede [30,31,35,59] strong EQs— was recorded on 2 October 2018, in the form of SES activity [60,61], i.e., a series of transient variations of the Earth’s electric field, recorded within a short time interval, as shown in Figure 2 of [72]: this SES activity was combined with NTA [5,7,9,29,84] and EN to show that a strong EQ was imminent after 18 October 2018 in Western Greece, and inside the gray shaded area shown in Figure 1 of [72]. The latter area corresponded to the selectivity map [60,61] of the station that recorded the SES, and was determined [29] on the basis of the successful predictions [30,31] of all the EQs that struck Western Greece in 2008. In that study, Equation (3) was taken into account, and a circular area of radius km around the city of Patras was studied for (see Figure 1 of [72]): the actual epicenter [83] lay inside both the selectivity map and this circular area. The EPS value obtained [72] using the United States National EQ Information Center (NEIC) Preliminary Determination of Epicenters (PDE) catalog—which is available from USGS at https://earthquake.usgs.gov/earthquakes/search/ (accessed on 6 February 2023)— resulted in 80% (see Figure 4 of [72]). If we further consider that this 6.8 EQ was the single EQ in 2018 of magnitude in Greece, we find that in six out of the seven cases of EQs with in Greece since 1 January 2018—i.e., more than four years—the EPS exceeded 50% just before the corresponding EQ occurrences.
We now turn to a comparison with the recent work of Varotsos et al. [41], in which complex EQ networks based on similar activity patterns [85], together with NTA [40] and EN, were combined, in an attempt to obtain information on the epicenter location of an impending destructive () EQ, in the form of the self-consistent ⟨EPS⟩ maps (Section 2), using the NEIC PDE catalog, = 6.0, = 4.0, and 250 km km]. Here, as a comparison, we present in Figure 6 the ⟨EPS⟩ map corresponding to the Samos EQ of Table 1, which was the strongest EQ in our study. We observed that the value of the EPS closest to the epicenter was 63.2%, which does not differ much from the value of 71.7% reported in Table 1, in the sense that they both exceeded 50% and differed less than 10%. We can also compare the aforementioned value of 80% reported in [72] with the value of 71% reported as the EPS closest to the epicenter location of the corresponding ⟨EPS⟩ map in [41] (see their Table 2, for the 2018 6.8 Zakynthos EQ): hence, we can see that there is consistency (within 10%) of the EPS values reported in the earlier EN studies in Greece [41,72], meaning that the EPS can identify the progress of the “EQ cycle” in a consistent way, when employing Equation (3). We recall that, as mentioned in Section 2, this Equation correctly reflects the fault system dynamics [79,80].
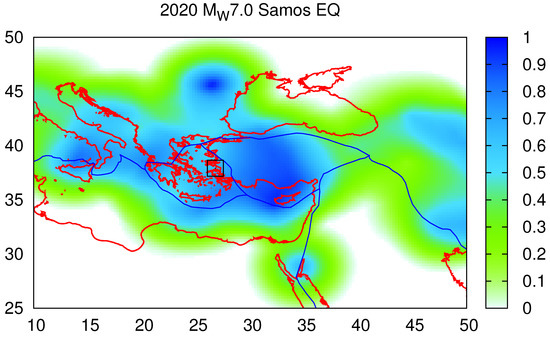
Figure 6.
Average EPS map, calculated on the basis of the data available on 30 October 2020, just before the 7.0 Samos EQ, with a coarse-grain radius km, in a fashion similar to those presented in Figures 4 and 6 of [41]. The EQ epicenter is indicated by the black square, and the value of the EPS at the grid point closest to this epicenter location is 63.2%.
For the Tyrnavos EQ, the same consistency was observed when comparing the EPS values 98.5% and 91.3%, obtained (see Figure 4d and Figure 5c) when using either the USGS or the NOA catalog, respectively. This was the first time that a local catalog, i.e., the NOA catalog, was used for EN in Greece. The results show remarkable consistency, implying that in future studies the NOA catalog will be particularly useful for EN in Greece.
In order to further examine the importance of Equation (3), we present in Figure 7 the results obtained when using the USGS catalog for the Tyrnavos EQ, but when employing km. We observe that the corresponding EPS was 9.7% in comparison to the aforementioned value of 98.5% when km. Moreover, we established that the EPS was 99.4% when km, as it results from Equation (3) for , thus differing less than 1% from that obtained for km (cf. the latter value of R, as mentioned, is used for the EPS calculations throughout this paper for simplicity). Hence, we conclude that when violating Equation (3), incompatible values of the EPS may appear.
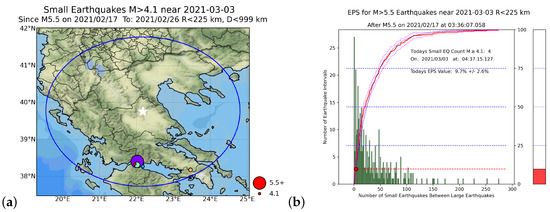
Figure 7.
EN results for the Tyrnavos EQ on 3 March 2021, using the USGS catalog ( = 4.1) but with km: (a) map of EQs having magnitude near Tyrnavos, Greece since 17 February 2021; the blue circle centered on the Tyrnavos EQ epicenter (white star) has radius 225 km; (b) Nowcast for ; the green bars are a histogram of the number of small EQs within the circular region; the red curve is the experimental CDF, and the red dot corresponds to its value at the current number of “small” EQs since the last “large” event on 17 February 2021 at 38.4 N 22.0 E inside the blue circle of panel (a); the thermometer on the right side is a pictorial representation of the current state of the “EQ cycle”.
When considering all the above, we find that the results reported here are promising, and reveal that the EPS provides useful information on impending seismicity. Of course, a better understanding of EQ source physics and interaction, as well as longer EQ observation with low magnitudes of completeness, may provide valuable information on precursory seismicity patterns, and help in finding the ultimate goal of EQ forecasting research.
5. Conclusions
In the present work, we found that EN, when using either the USGS or the NOA catalog, provides useful information about the occurrence of strong EQs in Greece. The calculated EPS values exhibited consistency within 10%, when employing different , which, in our opinion, was due to the application of Equation (3): this should be taken into account in future works.
In summary, we found that in six out of the seven cases of strong EQs () in Greece since 2018, the EPS exceeded the value of 50% close to the epicenter location: hence, we can say that they were overdue. All these cases concerned EQs with magnitudes in the range , and should be considered in comparison to the previous EN studies [41,72] in Greece.
Author Contributions
Conceptualization, G.C., E.S.S. and N.V.S.; methodology, G.C., E.S.S. and N.V.S.; software, G.C., E.S.S. and N.V.S.; validation, G.C., N.V.S. and E.S.S.; formal analysis, G.C. and N.V.S.; investigation, G.C., E.S.S. and N.V.S.; resources, G.C., E.S.S. and N.V.S.; data curation, G.C., E.S.S. and N.V.S.; writing—original draft preparation, G.C., E.S.S. and N.V.S.; writing—review and editing, G.C., E.S.S. and N.V.S.; visualization, G.C., E.S.S. and N.V.S.; supervision, G.C. and N.V.S.; project administration, G.C. and N.V.S. All authors have read and agreed to the published version of the manuscript.
Funding
This research received no external funding.
Institutional Review Board Statement
Not applicable.
Data Availability Statement
All seismological data used are publicly available.
Acknowledgments
The authors would like to deeply thank John B. Rundle for the computer code [66], useful discussions, and advice. We also deeply thank Panayiotis A. Varotsos for various stimulating discussions and useful recommendations on natural time analysis.
Conflicts of Interest
The authors declare no conflict of interest.
References
- Chouliaras, G. Investigating the earthquake catalog of the National Observatory of Athens. Nat. Hazards Earth Syst. Sci. 2009, 9, 905–912. [Google Scholar] [CrossRef]
- Mignan, A.; Chouliaras, G. Fifty Years of Seismic Network Performance in Greece (1964–2013): Spatiotemporal Evolution of the Completeness Magnitude. Seismol. Res. Lett. 2014, 85, 657–667. [Google Scholar] [CrossRef]
- National Observatory of Athens, Institute of Geodynamics. Recent Earthquakes. Available online: http://www.gein.noa.gr/en/seismicity/recent-earthquakes (accessed on 6 February 2023).
- Rundle, J.B.; Turcotte, D.L.; Donnellan, A.; Grant Ludwig, L.; Luginbuhl, M.; Gong, G. Nowcasting earthquakes. Earth Space Sci. 2016, 3, 480–486. [Google Scholar] [CrossRef]
- Varotsos, P.A.; Sarlis, N.V.; Skordas, E.S. Spatio-Temporal complexity aspects on the interrelation between Seismic Electric Signals and Seismicity. Pract. Athens Acad. 2001, 76, 294–321. Available online: http://physlab.phys.uoa.gr/org/pdf/p3.pdf (accessed on 6 February 2023).
- Varotsos, P.A.; Sarlis, N.V.; Skordas, E.S. Long-range correlations in the electric signals that precede rupture. Phys. Rev. E 2002, 66, 011902. [Google Scholar] [CrossRef]
- Varotsos, P.A.; Sarlis, N.V.; Skordas, E.S. Seismic Electric Signals and Seismicity: On a tentative interrelation between their spectral content. Acta Geophys. Pol. 2002, 50, 337–354. Available online: http://physlab.phys.uoa.gr/org/pdf/d35.pdf (accessed on 6 February 2023).
- Varotsos, P.A.; Sarlis, N.V.; Tanaka, H.K.; Skordas, E.S. Similarity of fluctuations in correlated systems: The case of seismicity. Phys. Rev. E 2005, 72, 041103. [Google Scholar] [CrossRef]
- Varotsos, P.A.; Sarlis, N.V.; Skordas, E.S. Natural Time Analysis: The New View of Time: Precursory Seismic Electric Signals, Earthquakes and Other Complex Time-Series; Springer: Berlin/Heidelberg, Germany, 2011. [Google Scholar] [CrossRef]
- Pasari, S. Nowcasting Earthquakes in the Bay of Bengal Region. Pure Appl. Geophys. 2019, 176, 1417–1432. [Google Scholar] [CrossRef]
- Pasari, S.; Verma, H.; Sharma, Y.; Choudhary, N. Spatial distribution of seismic cycle progression in northeast India and Bangladesh regions inferred from natural time analysis. Acta Geophys. 2023, 71, 89–100. [Google Scholar] [CrossRef]
- Utsu, T. Estimation of parameters for recurrence models of earthquakes. Bull. Earthq. Res. Inst. Univ. Tokyo 1984, 59, 53–66. Available online: http://basin.earth.ncu.edu.tw/download/courses/seminar_MSc/2009/0225-2_Estimation%20of%20parameters%20for%20recurrence%20models%20of%20earthquakes.pdf (accessed on 6 February 2023).
- Pasari, S.; Dikshit, O. Distribution of Earthquake Interevent Times in Northeast India and Adjoining Regions. Pure Appl. Geophys. 2015, 172, 2533–2544. [Google Scholar] [CrossRef]
- Pasari, S.; Dikshit, O. Earthquake interevent time distribution in Kachchh, Northwestern India. Earth Planets Space 2015, 67, 129. [Google Scholar] [CrossRef]
- Rundle, J.B.; Luginbuhl, M.; Giguere, A.; Turcotte, D.L. Natural Time, Nowcasting and the Physics of Earthquakes: Estimation of Seismic Risk to Global Megacities. Pure Appl. Geophys. 2018, 175, 647–660. [Google Scholar] [CrossRef]
- Luginbuhl, M.; Rundle, J.B.; Hawkins, A.; Turcotte, D.L. Nowcasting Earthquakes: A Comparison of Induced Earthquakes in Oklahoma and at the Geysers, California. Pure Appl. Geophys. 2018, 175, 49–65. [Google Scholar] [CrossRef]
- Luginbuhl, M.; Rundle, J.B.; Turcotte, D.L. Natural Time and Nowcasting Earthquakes: Are Large Global Earthquakes Temporally Clustered? Pure Appl. Geophys. 2018, 175, 661–670. [Google Scholar] [CrossRef]
- Rundle, J.B.; Donnellan, A. Nowcasting Earthquakes in Southern California With Machine Learning: Bursts, Swarms, and Aftershocks May Be Related to Levels of Regional Tectonic Stress. Earth Space Sci. 2020, 7, e2020EA001097. [Google Scholar] [CrossRef]
- Rundle, J.; Stein, S.; Donnellan, A.; Turcotte, D.L.; Klein, W.; Saylor, C. The Complex Dynamics of Earthquake Fault Systems: New Approaches to Forecasting and Nowcasting of Earthquakes. Rep. Prog. Phys. 2021, 84, 076801. [Google Scholar] [CrossRef]
- Rundle, J.B.; Donnellan, A.; Fox, G.; Crutchfield, J.P. Nowcasting Earthquakes by Visualizing the Earthquake Cycle with Machine Learning: A Comparison of Two Methods. Surv. Geophys. 2022, 43, 483–501. [Google Scholar] [CrossRef]
- Rundle, J.B.; Donnellan, A.; Fox, G.; Crutchfield, J.P.; Granat, R. Nowcasting Earthquakes: Imaging the Earthquake Cycle in California with Machine Learning. Earth Space Sci. 2021, 8, e2021EA001757. [Google Scholar] [CrossRef]
- Rundle, J.; Donnellan, A.; Fox, G.; Ludwig, L.; Crutchfield, J. Does the Catalog of California Earthquakes, with Aftershocks Included, Contain Information about Future Large Earthquakes? Earth Space Sci. 2023, 10, e2022EA002521. [Google Scholar] [CrossRef]
- Perez-Oregon, J.; Angulo-Brown, F.; Sarlis, N.V. Nowcasting Avalanches as Earthquakes and the Predictability of Strong Avalanches in the Olami-Feder-Christensen Model. Entropy 2020, 22, 1228. [Google Scholar] [CrossRef]
- Olami, Z.; Feder, H.J.S.; Christensen, K. Self-organized criticality in a continuous, nonconservative cellular automaton modeling earthquakes. Phys. Rev. Lett. 1992, 68, 1244–1247. [Google Scholar] [CrossRef]
- Fildes, R.A.; Turcotte, D.L.; Rundle, J.B. Natural time analysis and nowcasting of quasi-periodic collapse events during the 2018 Kīlauea volcano eruptive sequence. Earth Space Sci. 2022, 9, e2022EA002266. [Google Scholar] [CrossRef]
- Uieda, L.; Tian, D.; Leong, W.J.; Jones, M.; Schlitzer, W.; Grund, M.; Toney, L.; Fröhlich, Y.; Yao, J.; Magen, Y.; et al. PyGMT: A Python interface for the Generic Mapping Tools. Zenodo 2022. [Google Scholar] [CrossRef]
- Varotsos, P.A.; Sarlis, N.V.; Skordas, E.S. Natural Time Analysis: The New View of Time, Part II. Advances in Disaster Prediction Using Complex Systems; Springer: Berlin/Heidelberg, Germany, 2023; in press; ISBN 978-3-031-26005-6. [Google Scholar]
- Varotsos, P.A.; Sarlis, N.V.; Skordas, E.S.; Lazaridou, M.S. Fluctuations, under time reversal, of the natural time and the entropy distinguish similar looking electric signals of different dynamics. J. Appl. Phys. 2008, 103, 014906. [Google Scholar] [CrossRef]
- Sarlis, N.V.; Skordas, E.S.; Lazaridou, M.S.; Varotsos, P.A. Investigation of seismicity after the initiation of a Seismic Electric Signal activity until the main shock. Proc. Jpn. Acad. Ser. B Phys. Biol. Sci. 2008, 84, 331–343. [Google Scholar] [CrossRef]
- Uyeda, S.; Kamogawa, M. The Prediction of Two Large Earthquakes in Greece. Eos Trans. AGU 2008, 89, 363. [Google Scholar] [CrossRef]
- Uyeda, S.; Kamogawa, M. Comment on ‘The Prediction of Two Large Earthquakes in Greece’. Eos Trans. AGU 2010, 91, 163. [Google Scholar] [CrossRef]
- Uyeda, S.; Kamogawa, M.; Tanaka, H. Analysis of electrical activity and seismicity in the natural time domain for the volcanic-seismic swarm activity in 2000 in the Izu Island region, Japan. J. Geophys. Res. 2009, 114, B02310. [Google Scholar] [CrossRef]
- Sarlis, N.V.; Skordas, E.S.; Varotsos, P.A.; Nagao, T.; Kamogawa, M.; Tanaka, H.; Uyeda, S. Minimum of the order parameter fluctuations of seismicity before major earthquakes in Japan. Proc. Natl. Acad. Sci. USA 2013, 110, 13734–13738. [Google Scholar] [CrossRef]
- Sarlis, N.V.; Skordas, E.S.; Varotsos, P.A.; Nagao, T.; Kamogawa, M.; Uyeda, S. Spatiotemporal variations of seismicity before major earthquakes in the Japanese area and their relation with the epicentral locations. Proc. Natl. Acad. Sci. USA 2015, 112, 986–989. [Google Scholar] [CrossRef]
- Varotsos, P.A.; Sarlis, N.V.; Skordas, E.S.; Uyeda, S.; Kamogawa, M. Natural time analysis of critical phenomena: The case of Seismicity. Europhys. Lett. 2010, 92, 29002. [Google Scholar] [CrossRef]
- Skordas, E.S.; Christopoulos, S.R.G.; Sarlis, N.V. Detrended fluctuation analysis of seismicity and order parameter fluctuations before the M7.1 Ridgecrest earthquake. Nat. Hazards 2020, 100, 697–711. [Google Scholar] [CrossRef]
- Sarlis, N.V.; Skordas, E.S.; Varotsos, P.A.; Ramírez-Rojas, A.; Flores-Márquez, E.L. Natural time analysis: On the deadly Mexico M8.2 earthquake on 7 September 2017. Physica A 2018, 506, 625–634. [Google Scholar] [CrossRef]
- Sarlis, N.V.; Skordas, E.S.; Varotsos, P.A.; Ramírez-Rojas, A.; Flores-Márquez, E.L. Identifying the Occurrence Time of the Deadly Mexico M8.2 Earthquake on 7 September 2017. Entropy 2019, 21, 301. [Google Scholar] [CrossRef]
- Perez-Oregon, J.; Varotsos, P.K.; Skordas, E.S.; Sarlis, N.V. Estimating the Epicenter of a Future Strong Earthquake in Southern California, Mexico, and Central America by Means of Natural Time Analysis and Earthquake Nowcasting. Entropy 2021, 23, 1658. [Google Scholar] [CrossRef]
- Mintzelas, A.; Sarlis, N. Minima of the fluctuations of the order parameter of seismicity and earthquake networks based on similar activity patterns. Phys. A 2019, 527, 121293. [Google Scholar] [CrossRef]
- Varotsos, P.K.; Perez-Oregon, J.; Skordas, E.S.; Sarlis, N.V. Estimating the epicenter of an impending strong earthquake by combining the seismicity order parameter variability analysis with earthquake networks and nowcasting: Application in Eastern Mediterranean. Appl. Sci. 2021, 11, 10093. [Google Scholar] [CrossRef]
- Sarlis, N.V.; Christopoulos, S.R.G.; Skordas, E.S. Minima of the fluctuations of the order parameter of global seismicity. Chaos 2015, 25, 063110. [Google Scholar] [CrossRef]
- Sarlis, N.V.; Skordas, E.S.; Mintzelas, A.; Papadopoulou, K.A. Micro-scale, mid-scale, and macro-scale in global seismicity identified by empirical mode decomposition and their multifractal characteristics. Sci. Rep. 2018, 8, 9206. [Google Scholar] [CrossRef]
- Christopoulos, S.R.G.; Varotsos, P.K.; Perez-Oregon, J.; Papadopoulou, K.A.; Skordas, E.S.; Sarlis, N.V. Natural Time Analysis of Global Seismicity. Appl. Sci. 2022, 12, 7496. [Google Scholar] [CrossRef]
- Varotsos, P.A.; Sarlis, N.V.; Skordas, E.S. Attempt to distinguish electric signals of a dichotomous nature. Phys. Rev. E 2003, 68, 031106. [Google Scholar] [CrossRef]
- Varotsos, P.A.; Sarlis, N.V.; Skordas, E.S.; Lazaridou, M.S. Entropy in Natural Time Domain. Phys. Rev. E 2004, 70, 011106. [Google Scholar] [CrossRef]
- Varotsos, P.A.; Sarlis, N.V.; Tanaka, H.K.; Skordas, E.S. Some properties of the entropy in the natural time. Phys. Rev. E 2005, 71, 032102. [Google Scholar] [CrossRef]
- Lesche, B. Instabilities of Renyi entropies. J. Stat. Phys. 1982, 27, 419. [Google Scholar] [CrossRef]
- Lesche, B. Renyi entropies and observables. Phys. Rev. E 2004, 70, 017102. [Google Scholar] [CrossRef]
- Sarlis, N.V. Entropy in Natural Time and the Associated Complexity Measures. Entropy 2017, 19, 177. [Google Scholar] [CrossRef]
- Sarlis, N.V.; Skordas, E.S.; Varotsos, P.A. A remarkable change of the entropy of seismicity in natural time under time reversal before the super-giant M9 Tohoku earthquake on 11 March 2011. EPL (Europhys. Lett.) 2018, 124, 29001. [Google Scholar] [CrossRef]
- Varotsos, P.A.; Sarlis, N.V.; Skordas, E.S. Tsallis Entropy Index q and the Complexity Measure of Seismicity in Natural Time under Time Reversal before the M9 Tohoku Earthquake in 2011. Entropy 2018, 20, 757. [Google Scholar] [CrossRef]
- Skordas, E.S.; Sarlis, N.V.; Varotsos, P.A. Identifying the occurrence time of an impending major earthquake by means of the fluctuations of the entropy change under time reversal. EPL (Europhys. Lett.) 2019, 128, 49001. [Google Scholar] [CrossRef]
- Varotsos, P.A.; Sarlis, N.V.; Skordas, E.S. Self-organized criticality and earthquake predictability: A long-standing question in the light of natural time analysis. EPL (Europhys. Lett.) 2020, 132, 29001. [Google Scholar] [CrossRef]
- Ramírez-Rojas, A.; Flores-Márquez, E.L.; Sarlis, N.V.; Varotsos, P.A. The Complexity Measures Associated with the Fluctuations of the Entropy in Natural Time before the Deadly Mexico M8.2 Earthquake on 7 September 2017. Entropy 2018, 20, 477. [Google Scholar] [CrossRef]
- Flores-Márquez, E.L.; Ramírez-Rojas, A.; Perez-Oregon, J.; Sarlis, N.V.; Skordas, E.S.; Varotsos, P.A. Natural Time Analysis of Seismicity within the Mexican Flat Slab before the M7.1 Earthquake on 19 September 2017. Entropy 2020, 22, 730. [Google Scholar] [CrossRef]
- Varotsos, P.A.; Sarlis, N.V.; Skordas, E.S. Order Parameter and Entropy of Seismicity in Natural Time before Major Earthquakes: Recent Results. Geosciences 2022, 12, 225. [Google Scholar] [CrossRef]
- Varotsos, P.; Alexopoulos, K. Physical Properties of the variations of the electric field of the Earth preceding earthquakes, I. Tectonophysics 1984, 110, 73–98. [Google Scholar] [CrossRef]
- Varotsos, P.; Alexopoulos, K.; Nomicos, K.; Lazaridou, M. Earthquake prediction and electric signals. Nature 1986, 322, 120. [Google Scholar] [CrossRef]
- Varotsos, P.; Lazaridou, M. Latest aspects of earthquake prediction in Greece based on Seismic Electric Signals. Tectonophysics 1991, 188, 321–347. [Google Scholar] [CrossRef]
- Varotsos, P.; Alexopoulos, K.; Lazaridou, M. Latest aspects of earthquake prediction in Greece based on Seismic Electric Signals, II. Tectonophysics 1993, 224, 1–37. [Google Scholar] [CrossRef]
- Varotsos, P. The Physics of Seismic Electric Signals; TERRAPUB: Tokyo, Japan, 2005; p. 338. [Google Scholar]
- Varotsos, P.A.; Sarlis, N.V.; Skordas, E.S. Phenomena preceding major earthquakes interconnected through a physical model. Ann. Geophys. 2019, 37, 315–324. [Google Scholar] [CrossRef]
- Varotsos, P.A.; Sarlis, N.V.; Skordas, E.S.; Lazaridou, M.S. Seismic Electric Signals: An additional fact showing their physical interconnection with seismicity. Tectonophysics 2013, 589, 116–125. [Google Scholar] [CrossRef]
- Chouliaras, G. Seismicity anomalies prior to 8 June 2008, MW = 6.4 earthquake in Western Greece. Nat. Hazards Earth Syst. Sci. 2009, 9, 327–335. [Google Scholar] [CrossRef]
- Rundle, J. Megacities Earthquake Nowcasting V4.0. Zenodo 2023. [Google Scholar] [CrossRef]
- Kanamori, H. Quantification of Earthquakes. Nature 1978, 271, 411–414. [Google Scholar] [CrossRef]
- Gutenberg, B.; Richter, C.F. Frequency of earthquakes in California. Bull. Seismol. Soc. Am. 1944, 34, 185–188. [Google Scholar] [CrossRef]
- Scholz, C.H. The Mechanics of Earthquakes and Faulting, 3rd ed.; Cambridge University Press: Cambridge, UK, 2019. [Google Scholar] [CrossRef]
- Mignan, A. Functional shape of the earthquake frequency-magnitude distribution and completeness magnitude. J. Geophys. Res. Solid Earth 2012, 117, B08302. [Google Scholar] [CrossRef]
- Wiemer, S. A Software Package to Analyze Seismicity: ZMAP. Seismol. Res. Lett. 2001, 72, 373–382. [Google Scholar] [CrossRef]
- Sarlis, N.V.; Skordas, E.S. Study in Natural Time of Geoelectric Field and Seismicity Changes Preceding the Mw6.8 Earthquake on 25 October 2018 in Greece. Entropy 2018, 20, 882. [Google Scholar] [CrossRef]
- Rundle, J.B.; Luginbuhl, M.; Giguere, A.; Turcotte, D.L. Natural Time, Nowcasting and the Physics of Earthquakes: Estimation of Seismic Risk to Global Megacities. In Earthquakes and Multi-Hazards around the Pacific Rim; Williams, C.A., Peng, Z., Zhang, Y., Fukuyama, E., Goebel, T., Yoder, M.R., Eds.; Springer International Publishing: Cham, Switzersland, 2019; Volume II, pp. 123–136. [Google Scholar] [CrossRef]
- Pasari, S.; Sharma, Y. Contemporary Earthquake Hazards in the West-Northwest Himalaya: A Statistical Perspective through Natural Times. Seismol. Res. Lett. 2020, 91, 3358–3369. [Google Scholar] [CrossRef]
- Pasari, S.; Simanjuntak, A.V.H.; Neha; Sharma, Y. Nowcasting earthquakes in Sulawesi Island, Indonesia. Geosci. Lett. 2021, 8, 27. [Google Scholar] [CrossRef]
- Ferguson, C.D.; Klein, W.; Rundle, J.B. Spinodals, scaling, and ergodicity in a threshold model with long-range stress transfer. Phys. Rev. E 1999, 60, 1359–1373. [Google Scholar] [CrossRef]
- Tiampo, K.F.; Rundle, J.B.; Klein, W.; Martins, J.S.S.; Ferguson, C.D. Ergodic Dynamics in a Natural Threshold System. Phys. Rev. Lett. 2003, 91, 238501. [Google Scholar] [CrossRef]
- Tiampo, K.F.; Rundle, J.B.; Klein, W.; Holliday, J.; Sá Martins, J.S.; Ferguson, C.D. Ergodicity in natural earthquake fault networks. Phys. Rev. E 2007, 75, 066107. [Google Scholar] [CrossRef]
- Shcherbakov, R.; Turcotte, D.L.; Rundle, J.B. A generalized Omori’s law for earthquake aftershock decay. Geophys. Res. Lett. 2004, 31, L11613. [Google Scholar] [CrossRef]
- Bowman, D.D.; Ouillon, G.; Sammis, C.G.; Sornette, A.; Sornette, D. An observational test of the critical earthquake concept. J. Geophys. Res. Solid Earth 1998, 103, 24359–24372. [Google Scholar] [CrossRef]
- Chouliaras, G.; Melis, N.S.; Drakatos, G.; Makropoulos, K. Operational network improvements and increased reporting in the NOA (Greece) seismicity catalog. Adv. Geosci. 2013, 36, 7–9. [Google Scholar] [CrossRef]
- Holliday, J.R.; Rundle, J.B.; Turcotte, D.L.; Klein, W.; Tiampo, K.F.; Donnellan, A. Space-Time Clustering and Correlations of Major Earthquakes. Phys. Rev. Lett. 2006, 97, 238501. [Google Scholar] [CrossRef]
- United States Geological Survey, Earthquake Hazards Program. M 6.8–32 km SW of Lithakiá, Greece. Available online: https://earthquake.usgs.gov/earthquakes/eventpage/us1000hhb1/executive (accessed on 6 February 2023).
- Varotsos, P.A.; Sarlis, N.V.; Skordas, E.S.; Uyeda, S.; Kamogawa, M. Natural time analysis of critical phenomena. Proc. Natl. Acad. Sci. USA 2011, 108, 11361–11364. [Google Scholar] [CrossRef]
- Tenenbaum, J.N.; Havlin, S.; Stanley, H.E. Earthquake networks based on similar activity patterns. Phys. Rev. E 2012, 86, 046107. [Google Scholar] [CrossRef]
Disclaimer/Publisher’s Note: The statements, opinions and data contained in all publications are solely those of the individual author(s) and contributor(s) and not of MDPI and/or the editor(s). MDPI and/or the editor(s) disclaim responsibility for any injury to people or property resulting from any ideas, methods, instructions or products referred to in the content. |
© 2023 by the authors. Licensee MDPI, Basel, Switzerland. This article is an open access article distributed under the terms and conditions of the Creative Commons Attribution (CC BY) license (https://creativecommons.org/licenses/by/4.0/).