Brief Hospital Supervision of Exercise and Diet During Adjuvant Breast Cancer Therapy Is Not Enough to Relieve Fatigue: A Multicenter Randomized Controlled Trial

 ,
, 
Abstract
1. Introduction
2. Materials and Methods
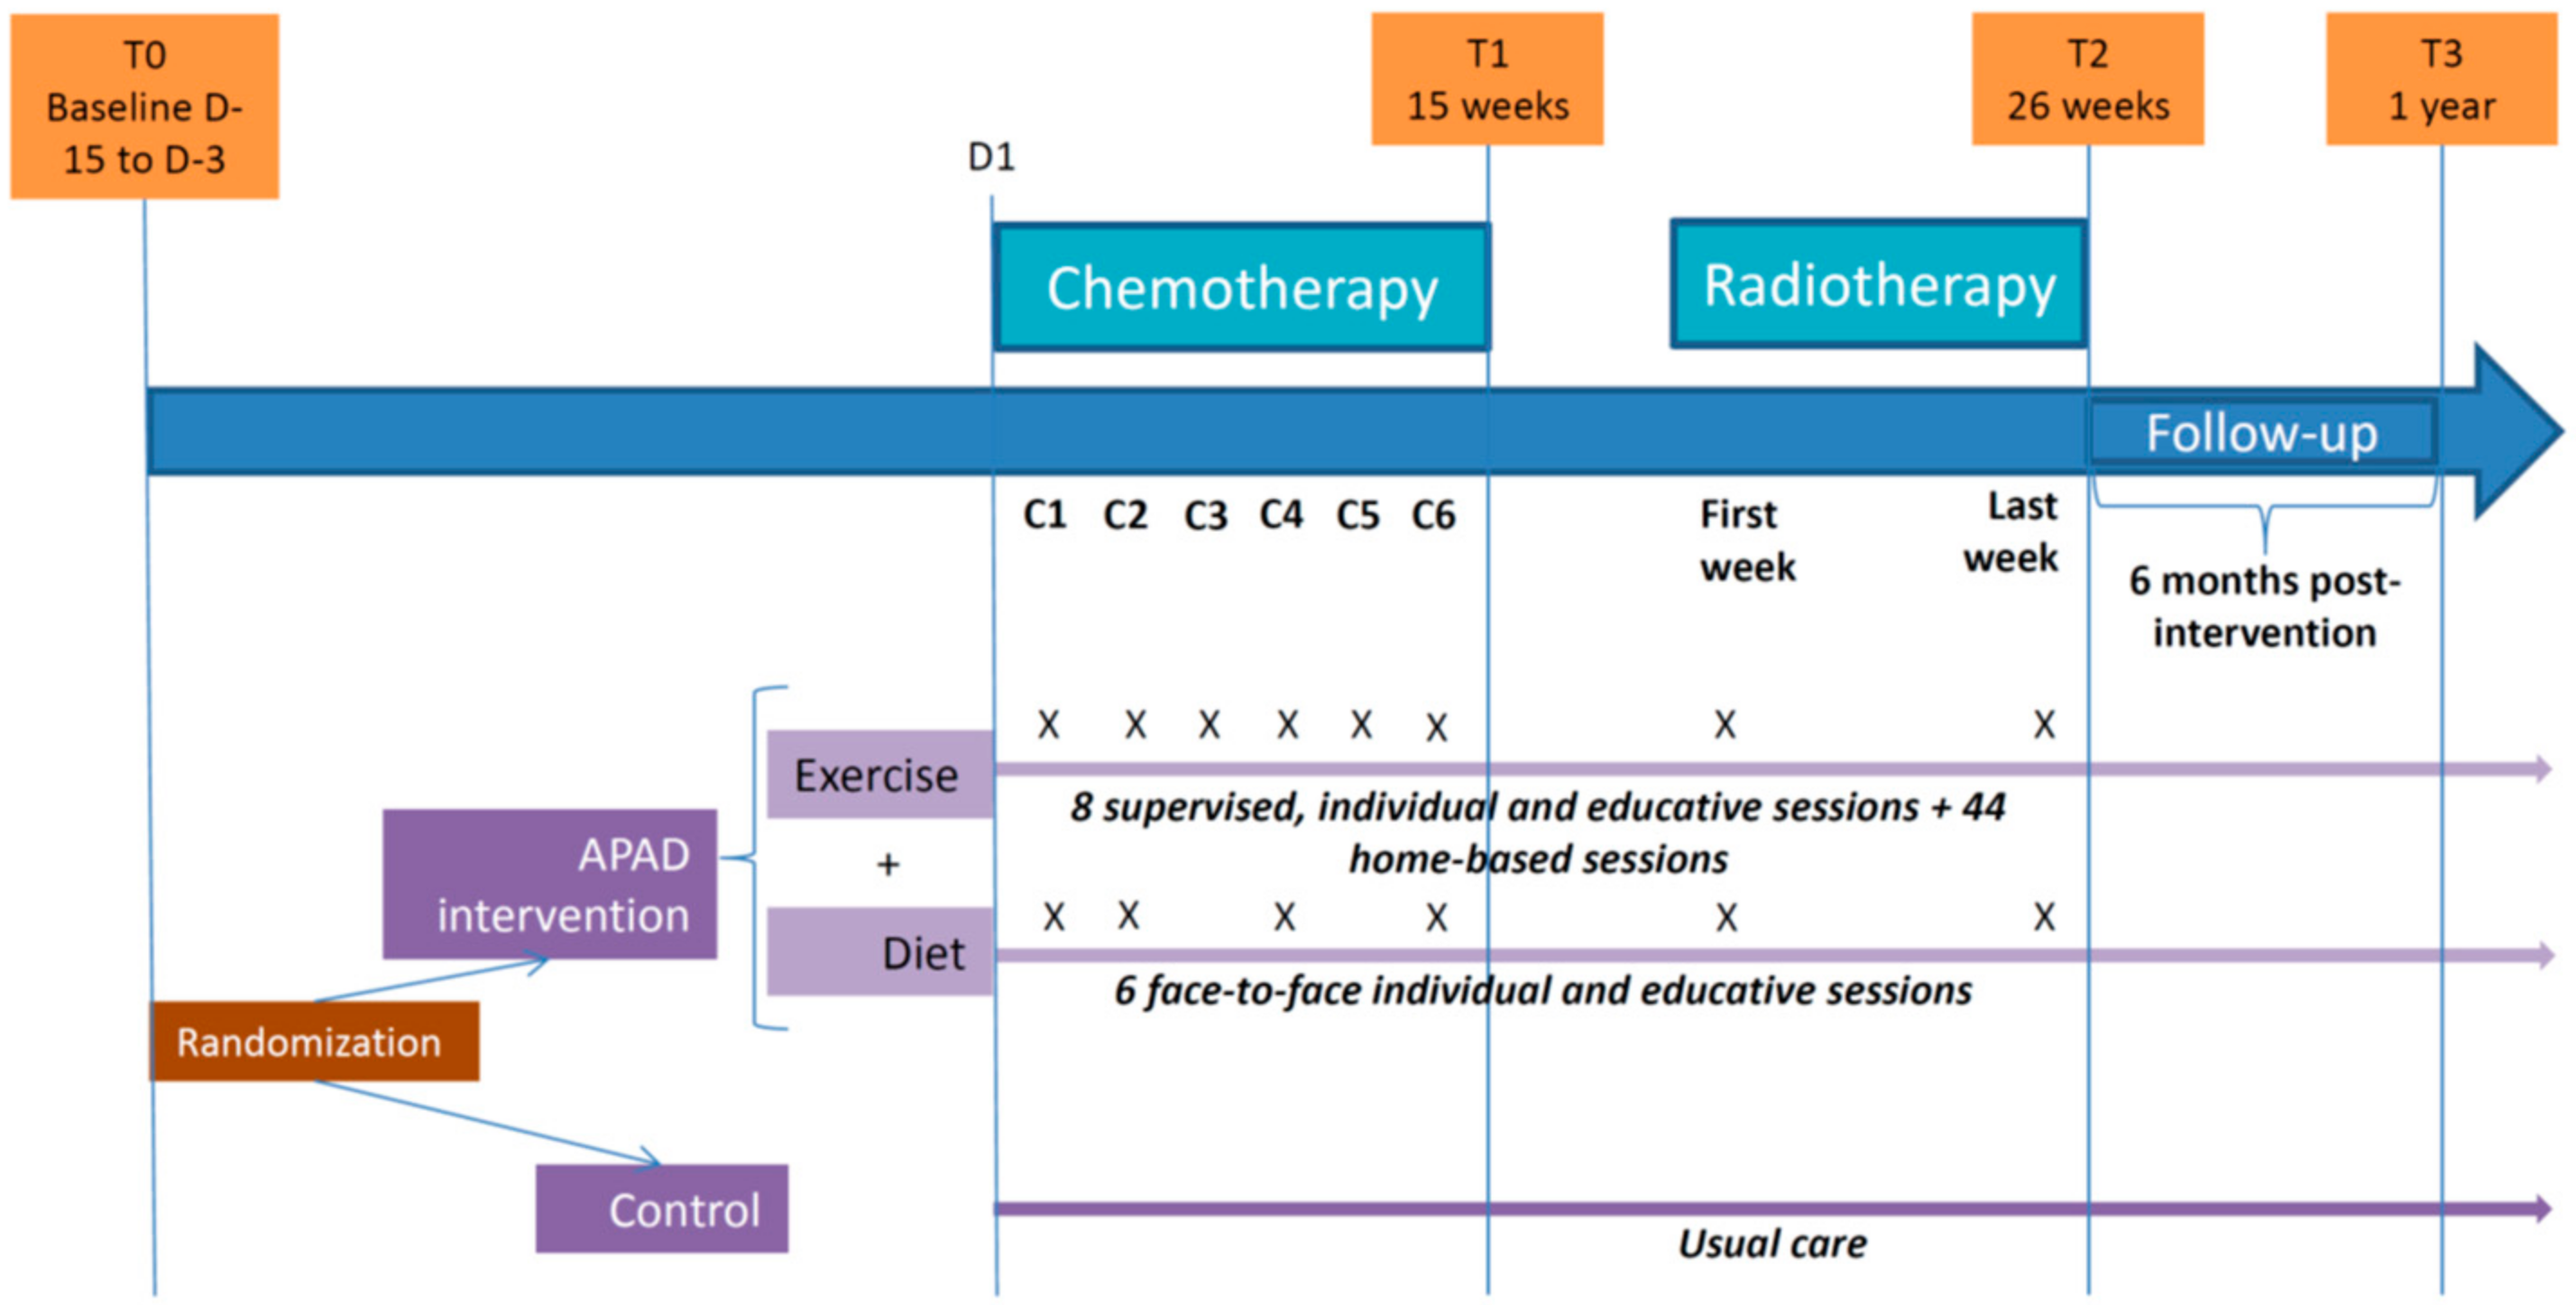
2.1. Design
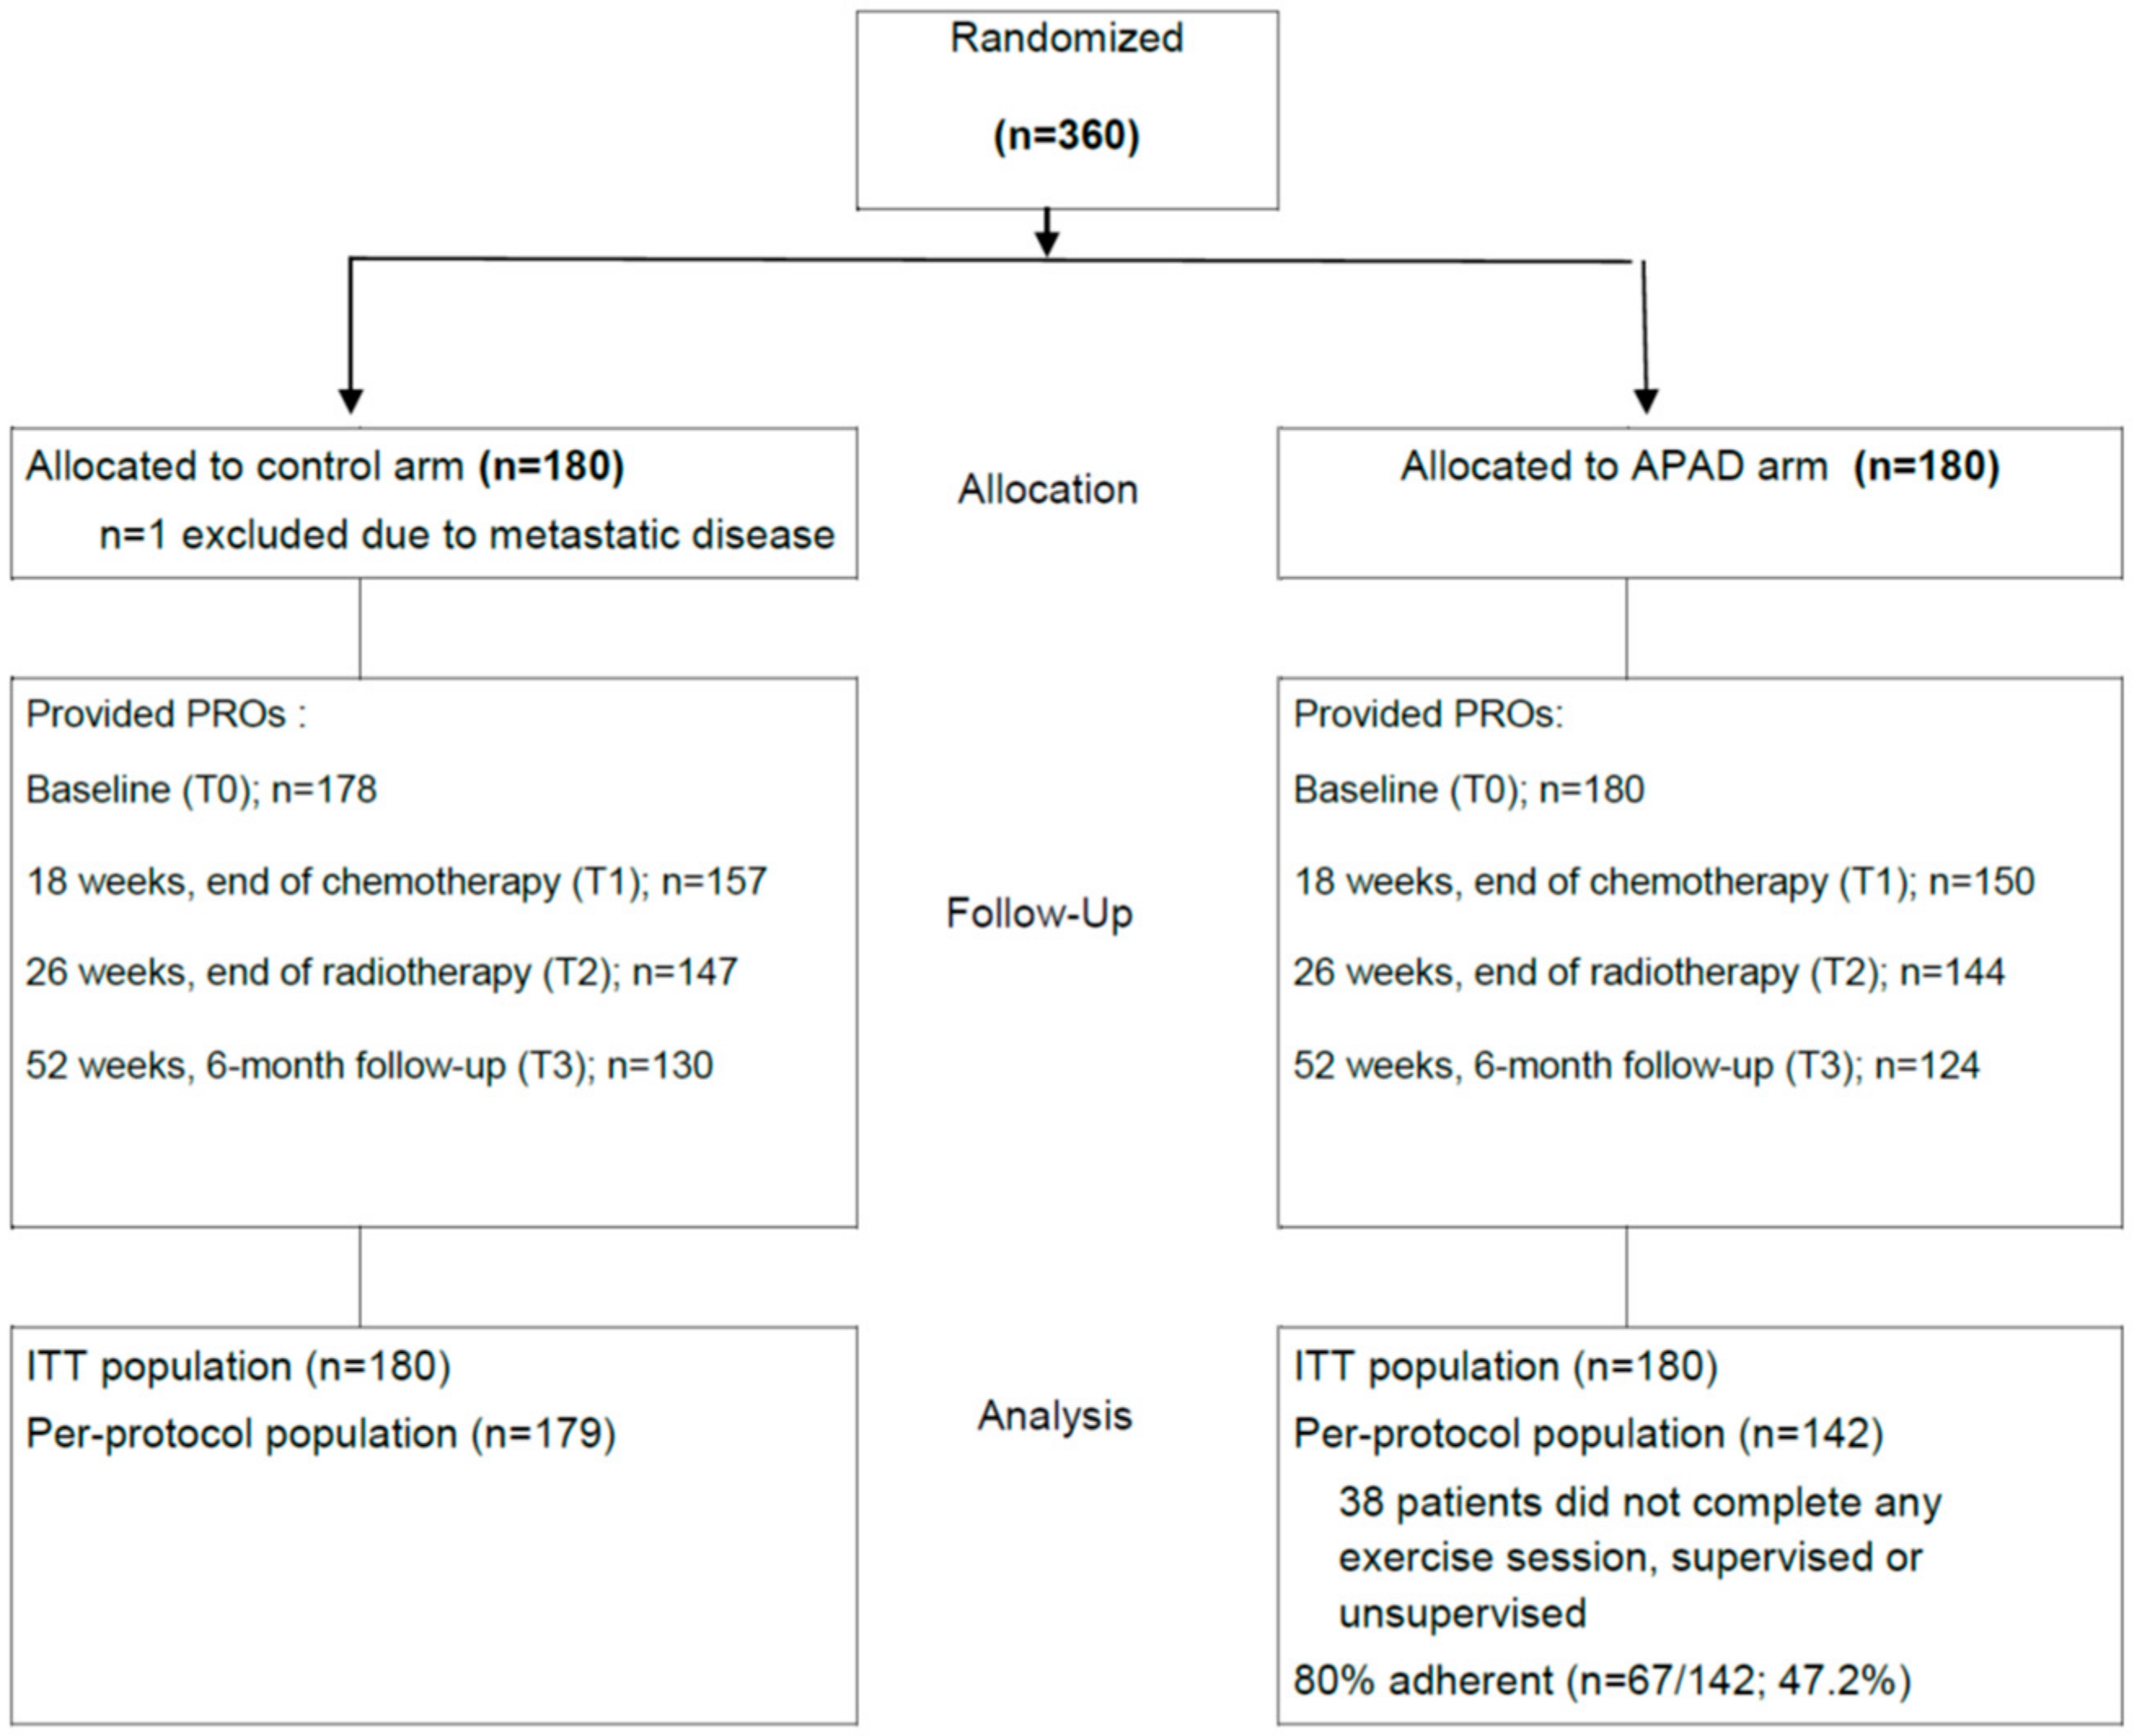
2.2. Participants
2.3. Intervention
2.3.1. Exercise
2.3.2. Diet
2.3.3. Evaluation of Nutritional Status
2.3.4. Nutrition Care
2.3.5. Nutritional Education
2.3.6. Missed Sessions
2.4. Outcomes and Assessments
2.5. Statistical Considerations
2.5.1. Sample Size Calculation and Randomization
2.5.2. Statistical Analysis
2.6. Ethics Approval, Consent to Participate and Trial Registration
3. Results
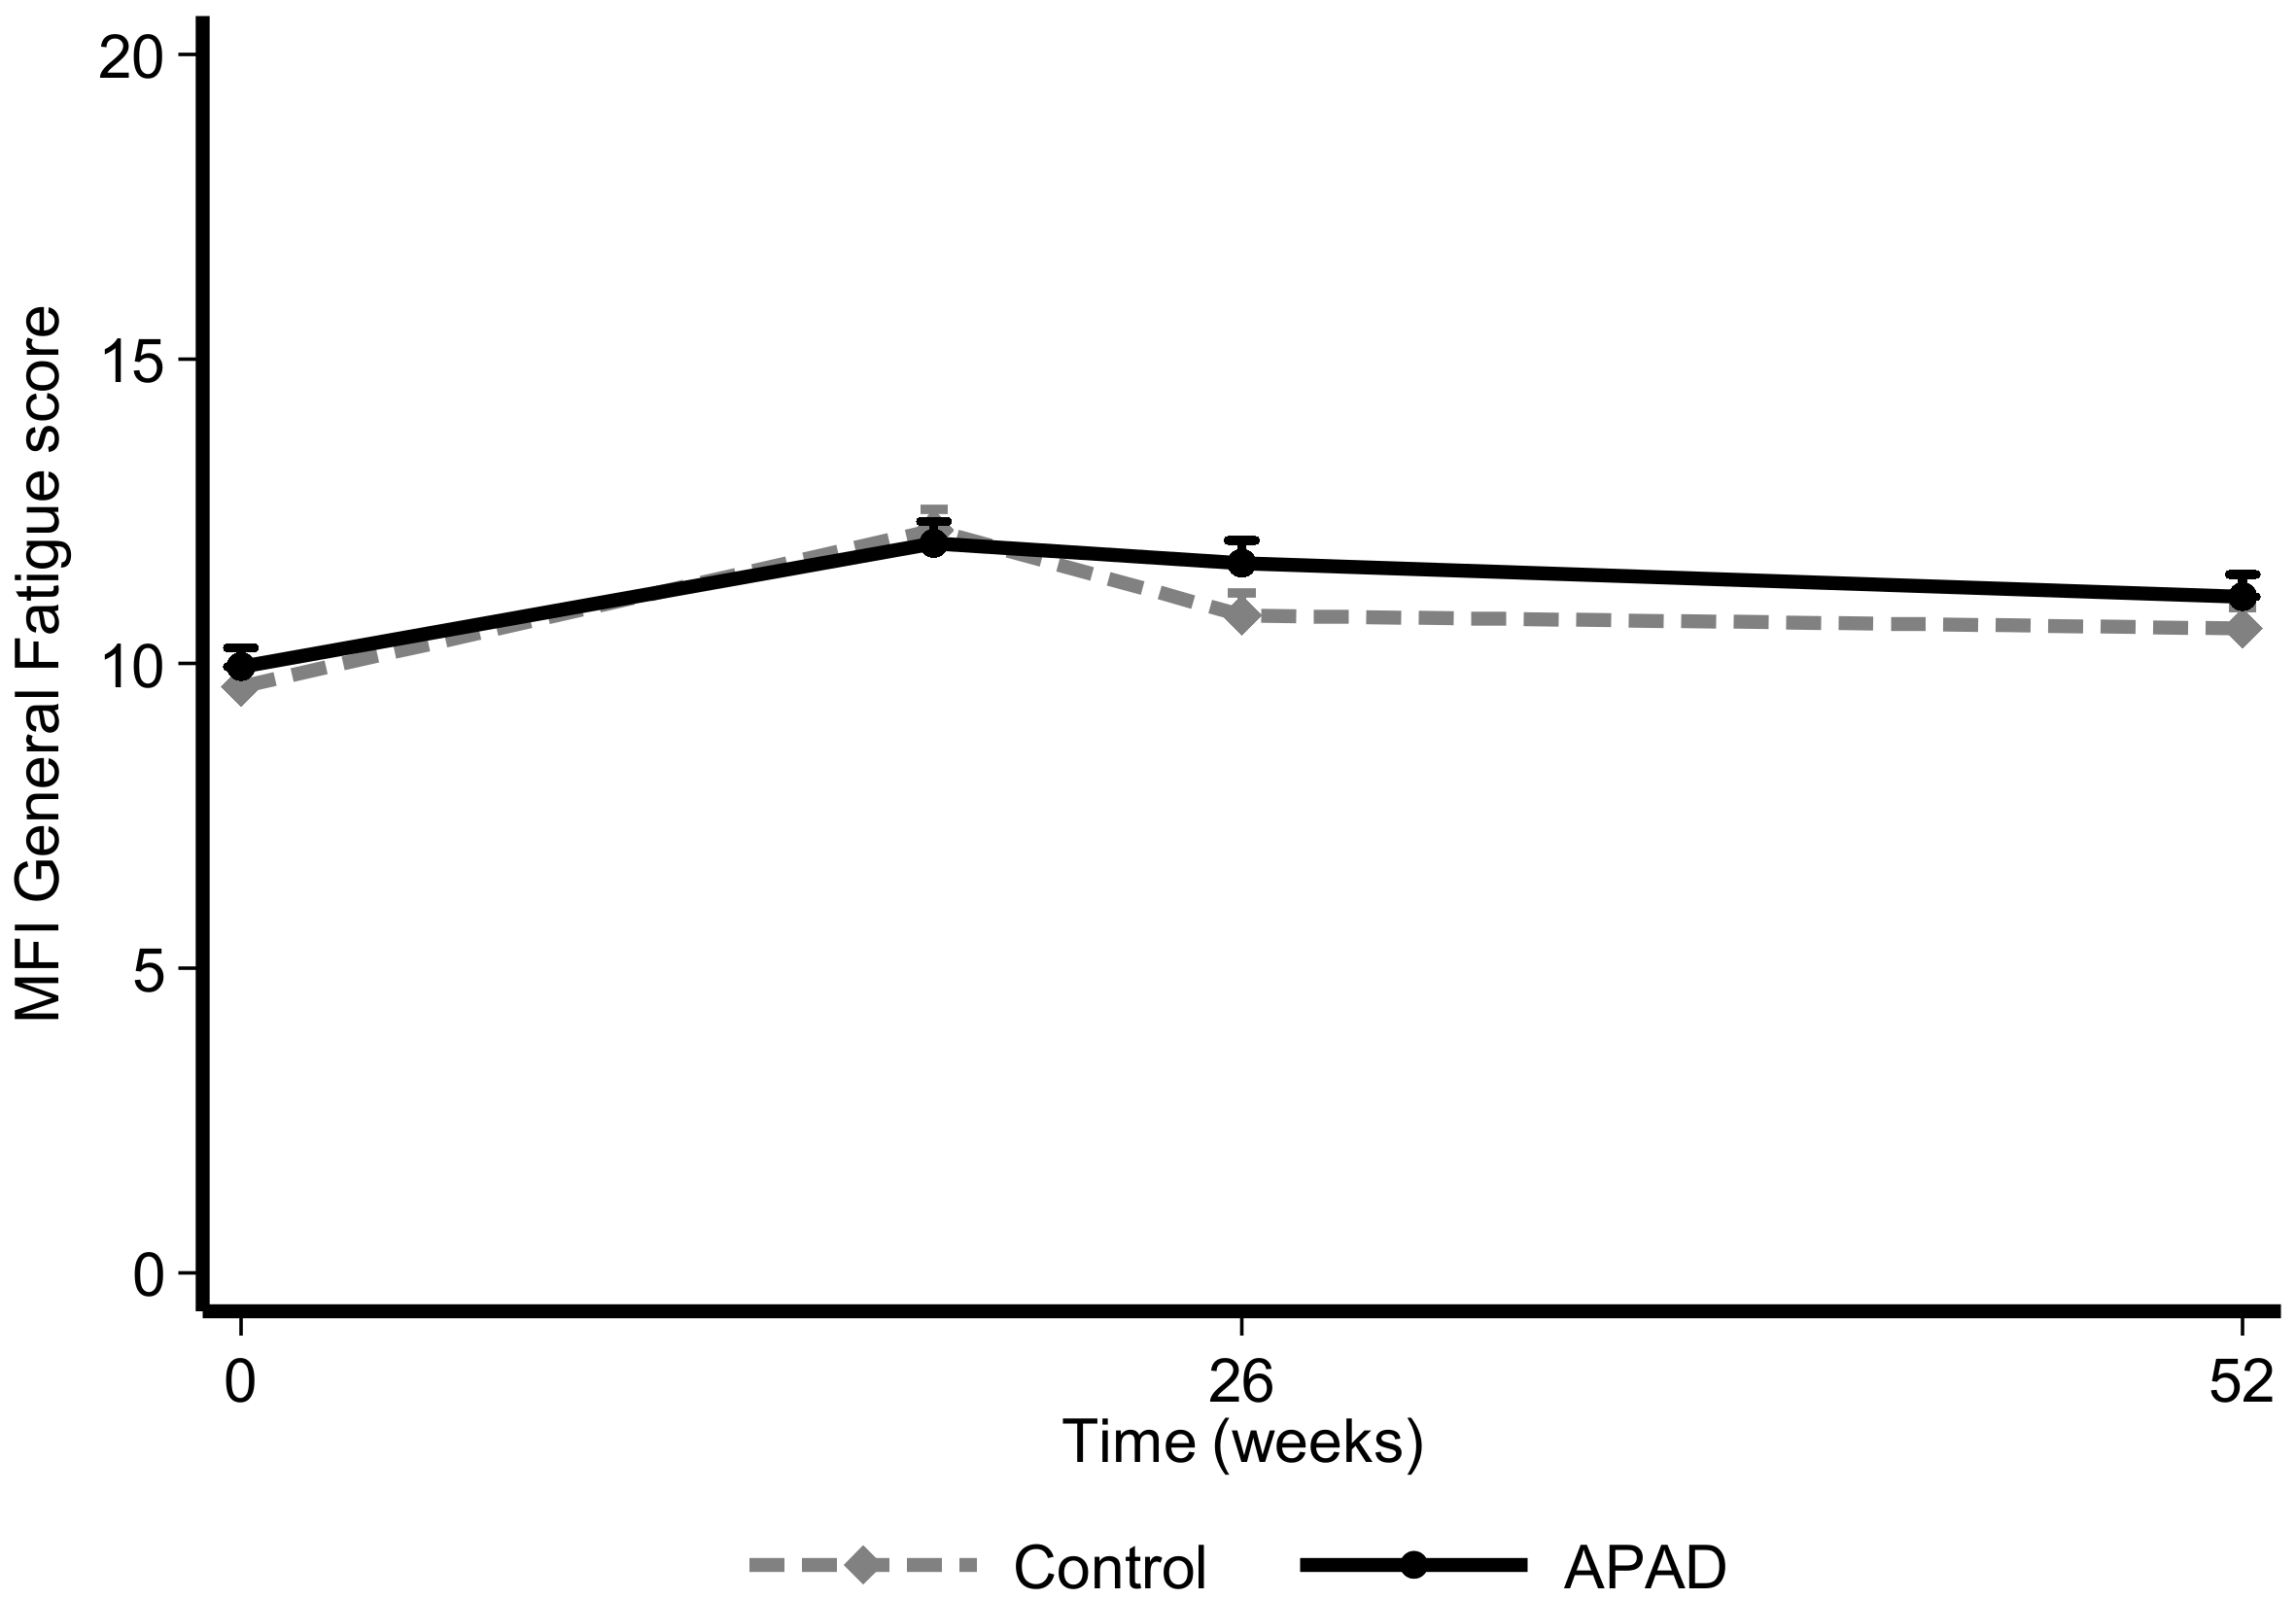
3.1. Fatigue
3.2. QoL and Psychological Distress
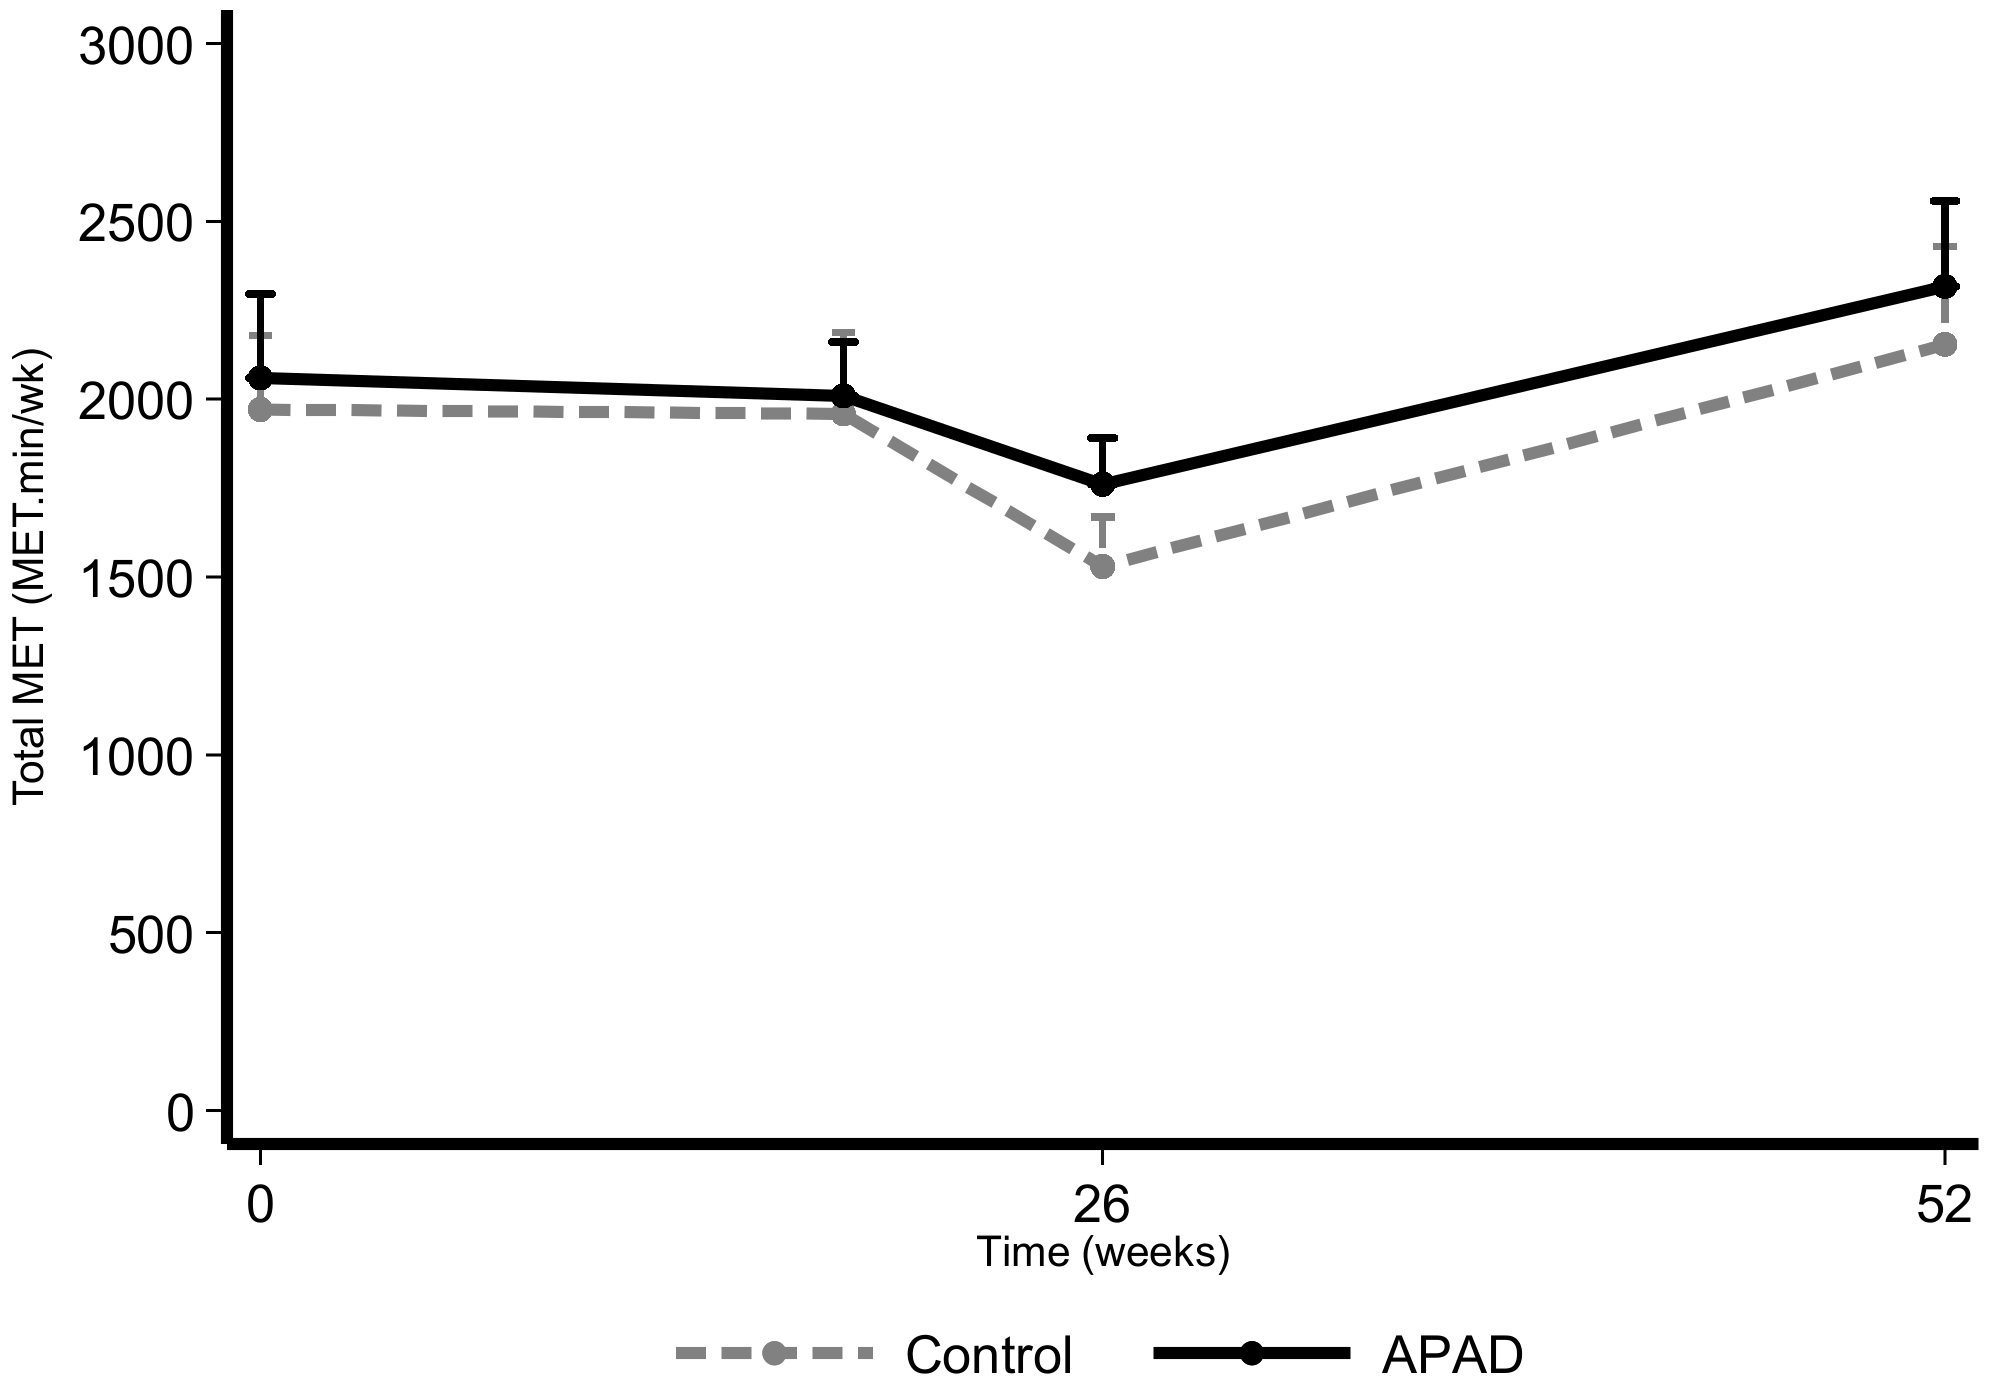
3.3. Physical Activity
3.4. Dietary Intake
3.5. Chemotherapy Completion Rates
4. Discussion
5. Conclusions
Supplementary Materials
Author Contributions
Funding
Conflicts of Interest
Abbreviations
| APAD | adapted physical activity and diet |
| EBC | early breast cancer |
| BMI | body mass index |
| GPAQ | Global Physical Activity Questionnaire |
| MFI | Multidimensional Fatigue Inventory |
| PRO | patient-reported outcome |
| QoL | quality-of-life |
| RCT | randomized controlled trial |
| RDI | relative dose index |
| SD | standard deviation |
References
- Henry, D.H.; Viswanathan, H.N.; Elkin, E.P.; Traina, S.; Wade, S.; Cella, D. Symptoms and treatment burden associated with cancer treatment: Results from a cross-sectional national survey in the U.S. Support. Care Cancer Off. J. Multinatl. Assoc. Support. Care Cancer 2008, 16, 791–801. [Google Scholar] [CrossRef] [PubMed]
- Fabi, A.; Falcicchio, C.; Giannarelli, D.; Maggi, G.; Cognetti, F.; Pugliese, P. The course of cancer related fatigue up to ten years in early breast cancer patients: What impact in clinical practice? Breast 2017, 34, 44–52. [Google Scholar] [CrossRef] [PubMed]
- Williams, L.A.; Bohac, C.; Hunter, S.; Cella, D. Patient and health care provider perceptions of cancer-related fatigue and pain. Support. Care Cancer Off. J. Multinatl. Assoc. Support. Care Cancer 2016, 24, 4357–4363. [Google Scholar] [CrossRef] [PubMed]
- Vogelzang, N.J.; Breitbart, W.; Cella, D.; Curt, G.A.; Groopman, J.E.; Horning, S.J.; Itri, L.M.; Johnson, D.H.; Scherr, S.L.; Portenoy, R.K. Patient, caregiver, and oncologist perceptions of cancer-related fatigue: Results of a tripart assessment survey. The Fatigue Coalition. Semin. Hematol. 1997, 34, 4–12. [Google Scholar] [PubMed]
- Penttinen, H.M.; Saarto, T.; Kellokumpu-Lehtinen, P.; Blomqvist, C.; Huovinen, R.; Kautiainen, H.; Jarvenpaa, S.; Nikander, R.; Idman, I.; Luoto, R.; et al. Quality of life and physical performance and activity of breast cancer patients after adjuvant treatments. Psycho Oncol. 2011, 20, 1211–1220. [Google Scholar] [CrossRef]
- Montazeri, A. Quality of life data as prognostic indicators of survival in cancer patients: An overview of the literature from 1982 to 2008. Health Qual. Life Outcomes 2009, 7, 102. [Google Scholar] [CrossRef]
- Chan, D.S.; Vieira, A.R.; Aune, D.; Bandera, E.V.; Greenwood, D.C.; McTiernan, A.; Navarro Rosenblatt, D.; Thune, I.; Vieira, R.; Norat, T. Body mass index and survival in women with breast cancer-systematic literature review and meta-analysis of 82 follow-up studies. Ann. Oncol. Off. J. Eur. Soc. Med Oncol. 2014, 25, 1901–1914. [Google Scholar] [CrossRef]
- Playdon, M.C.; Bracken, M.B.; Sanft, T.B.; Ligibel, J.A.; Harrigan, M.; Irwin, M.L. Weight Gain After Breast Cancer Diagnosis and All-Cause Mortality: Systematic Review and Meta-Analysis. J. Natl. Cancer Inst. 2015, 107, djv275. [Google Scholar] [CrossRef]
- Campbell, K.L.; Winters-Stone, K.M.; Wiskemann, J.; May, A.M.; Schwartz, A.L.; Courneya, K.S.; Zucker, D.S.; Matthews, C.E.; Ligibel, J.A.; Gerber, L.H.; et al. Exercise Guidelines for Cancer Survivors: Consensus Statement from International Multidisciplinary Roundtable. Med. Sci. Sports Exerc. 2019, 51, 2375–2390. [Google Scholar] [CrossRef]
- Berger, A.M.; Mooney, K.; Alvarez-Perez, A.; Breitbart, W.S.; Carpenter, K.M.; Cella, D.; Cleeland, C.; Dotan, E.; Eisenberger, M.A.; Escalante, C.P.; et al. Cancer-Related Fatigue, Version 2.2015. J. Natl. Compr. Cancer Netw. JNCCN 2015, 13, 1012–1039. [Google Scholar] [CrossRef]
- Jones, L.W.; Demark-Wahnefried, W. Diet, exercise, and complementary therapies after primary treatment for cancer. Lancet Oncol. 2006, 7, 1017–1026. [Google Scholar] [CrossRef]
- Denlinger, C.S.; Ligibel, J.A.; Are, M.; Baker, K.S.; Demark-Wahnefried, W.; Dizon, D.; Friedman, D.L.; Goldman, M.; Jones, L.; King, A.; et al. Survivorship: Nutrition and weight management, Version 2.2014. Clinical practice guidelines in oncology. J. Natl. Compr. Cancer Netw. 2014, 12, 1396–1406. [Google Scholar] [CrossRef]
- Demark-Wahnefried, W.; Morey, M.C.; Sloane, R.; Snyder, D.C.; Miller, P.E.; Hartman, T.J.; Cohen, H.J. Reach out to enhance wellness home-based diet-exercise intervention promotes reproducible and sustainable long-term improvements in health behaviors, body weight, and physical functioning in older, overweight/obese cancer survivors. J. Clin. Oncol. Off. J. Am. Soc. Clin. Oncol. 2012, 30, 2354–2361. [Google Scholar] [CrossRef] [PubMed]
- Goodwin, P.J.; Segal, R.J.; Vallis, M.; Ligibel, J.A.; Pond, G.R.; Robidoux, A.; Blackburn, G.L.; Findlay, B.; Gralow, J.R.; Mukherjee, S.; et al. Randomized trial of a telephone-based weight loss intervention in postmenopausal women with breast cancer receiving letrozole: The LISA trial. J. Clin. Oncol. Off. J. Am. Soc. Clin. Oncol. 2014, 32, 2231–2239. [Google Scholar] [CrossRef] [PubMed]
- Rock, C.L.; Flatt, S.W.; Byers, T.E.; Colditz, G.A.; Demark-Wahnefried, W.; Ganz, P.A.; Wolin, K.Y.; Elias, A.; Krontiras, H.; Liu, J.; et al. Results of the Exercise and Nutrition to Enhance Recovery and Good Health for You (ENERGY) Trial: A Behavioral Weight Loss Intervention in Overweight or Obese Breast Cancer Survivors. J. Clin. Oncol. Off. J. Am. Soc. Clin. Oncol. 2015, 33, 3169–3176. [Google Scholar] [CrossRef] [PubMed]
- Demark-Wahnefried, W.; Case, L.D.; Blackwell, K.; Marcom, P.K.; Kraus, W.; Aziz, N.; Snyder, D.C.; Giguere, J.K.; Shaw, E. Results of a diet/exercise feasibility trial to prevent adverse body composition change in breast cancer patients on adjuvant chemotherapy. Clin. Breast Cancer 2008, 8, 70–79. [Google Scholar] [CrossRef] [PubMed]
- Djuric, Z.; Ellsworth, J.S.; Weldon, A.L.; Ren, J.; Richardson, C.R.; Resnicow, K.; Newman, L.A.; Hayes, D.F.; Sen, A. A Diet and Exercise Intervention during Chemotherapy for Breast Cancer. Open Obes. J. 2011, 3, 87–97. [Google Scholar] [CrossRef]
- Carayol, M.; Ninot, G.; Senesse, P.; Bleuse, J.P.; Gourgou, S.; Sancho-Garnier, H.; Sari, C.; Romieu, I.; Romieu, G.; Jacot, W. Short- and long-term impact of adapted physical activity and diet counseling during adjuvant breast cancer therapy: The “APAD1” randomized controlled trial. BMC Cancer 2019, 19, 737. [Google Scholar] [CrossRef]
- Perrier, L.; Foucaut, A.M.; Morelle, M.; Touillaud, M.; Kempf-Lepine, A.S.; Heinz, D.; Gomez, F.; Meyrand, R.; Baudinet, C.; Berthouze, S.; et al. Cost-effectiveness of an exercise and nutritional intervention versus usual nutritional care during adjuvant treatment for localized breast cancer: The PASAPAS randomized controlled trial. Support. Care Cancer Off. J. Multinatl. Assoc. Support. Care Cancer 2020, 28, 2829–2842. [Google Scholar] [CrossRef]
- Carayol, M.; Romieu, G.; Bleuse, J.P.; Senesse, P.; Gourgou-Bourgade, S.; Sari, C.; Jacot, W.; Sancho-Garnier, H.; Janiszewski, C.; Launay, S.; et al. Adapted physical activity and diet (APAD) during adjuvant breast cancer therapy: Design and implementation of a prospective randomized controlled trial. Contemp. Clin. Trials 2013, 36, 531–543. [Google Scholar] [CrossRef]
- Eisinger, F.; Viguier, J.; Touboul, C.; Coscas, Y.; Pivot, X.; Blay, J.Y.; Lhomel, C.; Morere, J.F. Social stratification, risk factor prevalence and cancer screening attendance. Eur. J. Cancer Prev. Off. J. Eur. Cancer Prev. Organ. 2015, 24, S77–S81. [Google Scholar] [CrossRef]
- Labbe, E.; Blanquet, M.; Gerbaud, L.; Poirier, G.; Sass, C.; Vendittelli, F.; Moulin, J.J. A new reliable index to measure individual deprivation: The EPICES score. Eur. J. Public Health 2015, 25, 604–609. [Google Scholar] [CrossRef] [PubMed]
- Morere, J.F.; Eisinger, F.; Touboul, C.; Lhomel, C.; Couraud, S.; Viguier, J. Decline in Cancer Screening in Vulnerable Populations? Results of the EDIFICE Surveys. Curr. Oncol. Rep. 2018, 20, 17. [Google Scholar] [CrossRef] [PubMed]
- Roche, H.; Fumoleau, P.; Spielmann, M.; Canon, J.L.; Delozier, T.; Serin, D.; Symann, M.; Kerbrat, P.; Soulie, P.; Eichler, F.; et al. Sequential adjuvant epirubicin-based and docetaxel chemotherapy for node-positive breast cancer patients: The FNCLCC PACS 01 Trial. J. Clin. Oncol. Off. J. Am. Soc. Clin. Oncol. 2006, 24, 5664–5671. [Google Scholar] [CrossRef]
- Clinton, S.K.; Giovannucci, E.L.; Hursting, S.D. The World Cancer Research Fund/American Institute for Cancer Research Third Expert Report on Diet, Nutrition, Physical Activity, and Cancer: Impact and Future Directions. J. Nutr. 2020, 150, 663–671. [Google Scholar] [CrossRef] [PubMed]
- Schmitz, K.H.; Courneya, K.S.; Matthews, C.; Demark-Wahnefried, W.; Galvao, D.A.; Pinto, B.M.; Irwin, M.L.; Wolin, K.Y.; Segal, R.J.; Lucia, A.; et al. American College of Sports Medicine roundtable on exercise guidelines for cancer survivors. Med. Sci. Sports Exerc. 2010, 42, 1409–1426. [Google Scholar] [CrossRef]
- Courneya, K.S.; Mackey, J.R.; McKenzie, D.C. Exercise for breast cancer survivors: Research evidence and clinical guidelines. Physician Sportsmed. 2002, 30, 33–42. [Google Scholar] [CrossRef] [PubMed]
- Wolin, K.Y.; Schwartz, A.L.; Matthews, C.E.; Courneya, K.S.; Schmitz, K.H. Implementing the exercise guidelines for cancer survivors. J. Supportive Oncol. 2012, 10, 171–177. [Google Scholar] [CrossRef]
- Roza, A.M.; Shizgal, H.M. The Harris Benedict equation reevaluated: Resting energy requirements and the body cell mass. Am. J. Clin. Nutr. 1984, 40, 168–182. [Google Scholar] [CrossRef]
- Martin, A.; Touvier, M.; Volatier, J.L. The basis for setting the upper range of adequate intake for regulation of macronutrient intakes, especially amino acids. J. Nutr. 2004, 134, 1625S–1629S, discussion 1630S–1632S, 1667S–1672S. [Google Scholar] [CrossRef] [PubMed]
- Smets, E.M.; Garssen, B.; Cull, A.; de Haes, J.C. Application of the multidimensional fatigue inventory (MFI-20) in cancer patients receiving radiotherapy. Br. J. Cancer 1996, 73, 241–245. [Google Scholar] [CrossRef] [PubMed]
- Gentile, S.; Delaroziere, J.C.; Favre, F.; Sambuc, R.; San Marco, J.L. Validation of the French ‘multidimensional fatigue inventory’ (MFI 20). Eur. J. Cancer Care 2003, 12, 58–64. [Google Scholar] [CrossRef] [PubMed]
- Razavi, D.; Delvaux, N.; Farvacques, C.; Robaye, E. Screening for adjustment disorders and major depressive disorders in cancer in-patients. Br. J. Psychiatry J. Ment. Sci. 1990, 156, 79–83. [Google Scholar] [CrossRef] [PubMed]
- Sprangers, M.A.; Cull, A.; Bjordal, K.; Groenvold, M.; Aaronson, N.K. The European Organization for Research and Treatment of Cancer. Approach to quality of life assessment: Guidelines for developing questionnaire modules. EORTC Study Group on Quality of Life. Qual. Life Res. Int. J. Qual. Life Asp. Treat. Care Rehabil. 1993, 2, 287–295. [Google Scholar] [CrossRef] [PubMed]
- Trinh, O.T.; Nguyen, N.D.; van der Ploeg, H.P.; Dibley, M.J.; Bauman, A. Test-retest repeatability and relative validity of the Global Physical Activity Questionnaire in a developing country context. J. Phys. Act. Health 2009, 6, S46–S53. [Google Scholar] [CrossRef] [PubMed]
- Ruiz-Casado, A.; Alejo, L.B.; Santos-Lozano, A.; Soria, A.; Ortega, M.J.; Pagola, I.; Fiuza-Luces, C.; Palomo, I.; Garatachea, N.; Cebolla, H.; et al. Validity of the Physical Activity Questionnaires IPAQ-SF and GPAQ for Cancer Survivors: Insights from a Spanish Cohort. Int. J. Sports Med. 2016, 37, 979–985. [Google Scholar] [CrossRef]
- Bull, F.C.; Maslin, T.S.; Armstrong, T. Global physical activity questionnaire (GPAQ): Nine country reliability and validity study. J. Phys. Act. Health 2009, 6, 790–804. [Google Scholar] [CrossRef]
- Biro, G.; Hulshof, K.F.; Ovesen, L.; Amorim Cruz, J.A.; Group, E. Selection of methodology to assess food intake. Eur. J. Clin. Nutr. 2002, 56, S25–S32. [Google Scholar] [CrossRef]
- Aaronson, N.K.; Ahmedzai, S.; Bergman, B.; Bullinger, M.; Cull, A.; Duez, N.J.; Filiberti, A.; Flechtner, H.; Fleishman, S.B.; de Haes, J.C.; et al. The European Organization for Research and Treatment of Cancer QLQ-C30: A quality-of-life instrument for use in international clinical trials in oncology. J. Natl. Cancer Inst. 1993, 85, 365–376. [Google Scholar] [CrossRef]
- Cornette, T.; Vincent, F.; Mandigout, S.; Antonini, M.T.; Leobon, S.; Labrunie, A.; Venat, L.; Lavau-Denes, S.; Tubiana-Mathieu, N. Effects of home-based exercise training on VO2 in breast cancer patients under adjuvant or neoadjuvant chemotherapy (SAPA): A randomized controlled trial. Eur. J. Phys. Rehabil. Med. 2016, 52, 223–232. [Google Scholar]
- Courneya, K.S.; Segal, R.J.; Mackey, J.R.; Gelmon, K.; Reid, R.D.; Friedenreich, C.M.; Ladha, A.B.; Proulx, C.; Vallance, J.K.; Lane, K.; et al. Effects of aerobic and resistance exercise in breast cancer patients receiving adjuvant chemotherapy: A multicenter randomized controlled trial. J. Clin. Oncol. Off. J. Am. Soc. Clin. Oncol. 2007, 25, 4396–4404. [Google Scholar] [CrossRef] [PubMed]
- Husebo, A.M.; Dyrstad, S.M.; Mjaaland, I.; Soreide, J.A.; Bru, E. Effects of scheduled exercise on cancer-related fatigue in women with early breast cancer. Sci. World J. 2014, 2014, 271828. [Google Scholar] [CrossRef]
- Mutrie, N.; Campbell, A.M.; Whyte, F.; McConnachie, A.; Emslie, C.; Lee, L.; Kearney, N.; Walker, A.; Ritchie, D. Benefits of supervised group exercise programme for women being treated for early stage breast cancer: Pragmatic randomised controlled trial. BMJ 2007, 334, 517. [Google Scholar] [CrossRef]
- Travier, N.; Velthuis, M.J.; Steins Bisschop, C.N.; van den Buijs, B.; Monninkhof, E.M.; Backx, F.; Los, M.; Erdkamp, F.; Bloemendal, H.J.; Rodenhuis, C.; et al. Effects of an 18-week exercise programme started early during breast cancer treatment: A randomised controlled trial. BMC Med. 2015, 13, 121. [Google Scholar] [CrossRef] [PubMed]
- Van Waart, H.; Stuiver, M.M.; van Harten, W.H.; Geleijn, E.; Kieffer, J.M.; Buffart, L.M.; de Maaker-Berkhof, M.; Boven, E.; Schrama, J.; Geenen, M.M.; et al. Effect of Low-Intensity Physical Activity and Moderate- to High-Intensity Physical Exercise During Adjuvant Chemotherapy on Physical Fitness, Fatigue, and Chemotherapy Completion Rates: Results of the PACES Randomized Clinical Trial. J. Clin. Oncol. Off. J. Am. Soc. Clin. Oncol. 2015, 33, 1918–1927. [Google Scholar] [CrossRef] [PubMed]
- Van Vulpen, J.K.; Sweegers, M.G.; Peeters, P.H.M.; Courneya, K.S.; Newton, R.U.; Aaronson, N.K.; Jacobsen, P.B.; Galvao, D.A.; Chinapaw, M.J.; Steindorf, K.; et al. Moderators of Exercise Effects on Cancer-related Fatigue: A Meta-analysis of Individual Patient Data. Med. Sci. Sports Exerc. 2020, 52, 303–314. [Google Scholar] [CrossRef] [PubMed]
- Furmaniak, A.C.; Menig, M.; Markes, M.H. Exercise for women receiving adjuvant therapy for breast cancer. Cochrane Database Syst. Rev. 2016, 9, CD005001. [Google Scholar] [CrossRef]
- Courneya, K.S.; McKenzie, D.C.; Mackey, J.R.; Gelmon, K.; Friedenreich, C.M.; Yasui, Y.; Reid, R.D.; Cook, D.; Jespersen, D.; Proulx, C.; et al. Effects of exercise dose and type during breast cancer chemotherapy: Multicenter randomized trial. J. Natl. Cancer Inst. 2013, 105, 1821–1832. [Google Scholar] [CrossRef]
- Sheehan, P.; Denieffe, S.; Murphy, N.M.; Harrison, M. Exercise is more effective than health education in reducing fatigue in fatigued cancer survivors. Support. Care Cancer Off. J. Multinatl. Assoc. Support. Care Cancer 2020, 10. [Google Scholar] [CrossRef]
- An, K.Y.; Morielli, A.R.; Kang, D.W.; Friedenreich, C.M.; McKenzie, D.C.; Gelmon, K.; Mackey, J.R.; Reid, R.D.; Courneya, K.S. Effects of exercise dose and type during breast cancer chemotherapy on longer-term patient-reported outcomes and health-related fitness: A randomized controlled trial. Int. J. Cancer 2020, 146, 150–160. [Google Scholar] [CrossRef]
- Morey, M.C.; Snyder, D.C.; Sloane, R.; Cohen, H.J.; Peterson, B.; Hartman, T.J.; Miller, P.; Mitchell, D.C.; Demark-Wahnefried, W. Effects of home-based diet and exercise on functional outcomes among older, overweight long-term cancer survivors: RENEW: A randomized controlled trial. JAMA 2009, 301, 1883–1891. [Google Scholar] [CrossRef] [PubMed]
- Demark-Wahnefried, W.; Clipp, E.C.; Lipkus, I.M.; Lobach, D.; Snyder, D.C.; Sloane, R.; Peterson, B.; Macri, J.M.; Rock, C.L.; McBride, C.M.; et al. Main outcomes of the FRESH START trial: A sequentially tailored, diet and exercise mailed print intervention among breast and prostate cancer survivors. J. Clin. Oncol. Off. J. Am. Soc. Clin. Oncol. 2007, 25, 2709–2718. [Google Scholar] [CrossRef] [PubMed]
- Demark-Wahnefried, W.; Clipp, E.C.; Morey, M.C.; Pieper, C.F.; Sloane, R.; Snyder, D.C.; Cohen, H.J. Lifestyle intervention development study to improve physical function in older adults with cancer: Outcomes from Project LEAD. J. Clin. Oncol. Off. J. Am. Soc. Clin. Oncol. 2006, 24, 3465–3473. [Google Scholar] [CrossRef]
- Adams, R.N.; Mosher, C.E.; Blair, C.K.; Snyder, D.C.; Sloane, R.; Demark-Wahnefried, W. Cancer survivors’ uptake and adherence in diet and exercise intervention trials: An integrative data analysis. Cancer 2015, 121, 77–83. [Google Scholar] [CrossRef]
- Stone, C.R.; Friedenreich, C.M.; O’Reilly, R.; Farris, M.S.; Vallerand, J.R.; Kang, D.W.; Courneya, K.S. Predictors of Adherence to Different Volumes of Exercise in the Breast Cancer and Exercise Trial in Alberta. Ann. Behav. Med. Publ. Soc. Behav. Med. 2019, 53, 453–465. [Google Scholar] [CrossRef]
- Buffart, L.M.; Sweegers, M.G.; May, A.M.; Chinapaw, M.J.; van Vulpen, J.K.; Newton, R.U.; Galvao, D.A.; Aaronson, N.K.; Stuiver, M.M.; Jacobsen, P.B.; et al. Targeting Exercise Interventions to Patients with Cancer in Need: An Individual Patient Data Meta-Analysis. J. Natl. Cancer Inst. 2018, 110, 1190–1200. [Google Scholar] [CrossRef]


| Control n = 180 | APAD n = 180 | Total n = 360 | ||||
|---|---|---|---|---|---|---|
| Mean | SD | Mean | SD | Mean | SD | |
| Age (years) | 52.35 | 10.09 | 52.66 | 9.69 | 52.51 | 9.88 |
| Weight (kg) | 67.00 | 14.13 | 68.41 | 14.60 | 67.71 | 14.36 |
| BMI (kg/m2) | 25.22 | 5.30 | 25.72 | 5.14 | 25.47 | 5.22 |
| BMI categories | n | % | n | % | n | % |
| <18.5 kg/m2 | 6 | 3.33 | 2 | 1.12 | 8 | 2.23 |
| 18.5–24.9 kg/m2 | 99 | 55.00 | 95 | 53.07 | 194 | 54.04 |
| 25–29.9 kg/m2 | 45 | 25.00 | 45 | 25.14 | 90 | 25.07 |
| ≥30 kg/m2 | 30 | 16.67 | 37 | 20.67 | 67 | 18.66 |
| Post-menopausal | 88 | 48.89 | 88 | 48.89 | 176 | 48.89 |
| Tobacco smoking | ||||||
| Non-smoker | 102 | 56.67 | 86 | 47.78 | 188 | 52.22 |
| Smoker | 29 | 16.11 | 34 | 18.89 | 63 | 17.50 |
| Ex-smoker | 49 | 27.22 | 60 | 33.33 | 109 | 30.28 |
| Marital status | ||||||
| Single/divorced/widowed, no child | 16 | 8.99 | 10 | 5.56 | 26 | 7.26 |
| Single/divorced/widowed, with child | 23 | 12.92 | 37 | 20.56 | 60 | 16.76 |
| Married/living together, no child | 21 | 11.80 | 26 | 14.44 | 47 | 13.13 |
| Married/living together, with child | 118 | 66.29 | 107 | 59.44 | 225 | 62.85 |
| Education level | ||||||
| No qualifications | 29 | 16.57 | 24 | 13.56 | 53 | 15.06 |
| Secondary level | 43 | 24.57 | 31 | 17.51 | 74 | 21.02 |
| Completed high school | 29 | 16.57 | 43 | 24.29 | 72 | 20.45 |
| Completed ≥ 2 years at university | 74 | 42.29 | 79 | 44.64 | 153 | 43.47 |
| Usual professional status | ||||||
| Full or part-time employed | 97 | 53.89 | 103 | 57.22 | 200 | 55.56 |
| Retired | 42 | 23.33 | 41 | 22.78 | 83 | 23.06 |
| Unemployed/medical leave | 41 | 22.78 | 36 | 20.00 | 77 | 21.38 |
| EPICES precariousness (or deprivation) level | ||||||
| Non-precarious | 109 | 60.56 | 109 | 60.56 | 218 | 60.56 |
| Intermediate | 60 | 33.33 | 60 | 33.33 | 120 | 33.33 |
| Precarious | 11 | 6.11 | 11 | 6.11 | 22 | 6.11 |
| Surgery type | n | % | n | % | n | % |
| Lumpectomy | 89 | 49.44 | 88 | 48.89 | 177 | 49.17 |
| Quadrantectomy | 37 | 20.56 | 45 | 25.00 | 82 | 22.78 |
| Mastectomy | 54 | 30.00 | 46 | 25.56 | 100 | 27.78 |
| T stage | ||||||
| T1 | 91 | 50.56 | 97 | 53.89 | 188 | 52.22 |
| T2 | 74 | 41.11 | 73 | 40.56 | 147 | 40.83 |
| T3 | 11 | 6.11 | 8 | 4.44 | 19 | 5.28 |
| T3 | 3 | 1.67 | 1 | 0.56 | 4 | 1.11 |
| T4 | 1 | 0.56 | 0 | 0 | 1 | 0.28 |
| Tis | 0 | 0 | 1 | 0.56 | 1 | 0.28 |
| T stage | ||||||
| N0 | 71 | 39.66 | 79 | 44.63 | 150 | 42.13 |
| N1 | 86 | 48.04 | 83 | 46.89 | 169 | 47.47 |
| N2 | 14 | 7.82 | 11 | 6.21 | 25 | 7.02 |
| N3 | 7 | 3.91 | 3 | 1.69 | 10 | 2.81 |
| NX | 1 | 0.56 | 1 | 0.56 | 2 | 0.56 |
| Breast cancer subtype | ||||||
| Triple negative | 17 | 18.48 | 17 | 18.89 | 34 | 18.68 |
| HER2+, ER+, and/or PR+ | 29 | 31.52 | 35 | 38.89 | 64 | 35.16 |
| HER2+, ER−, and PR− | 9 | 9.78 | 10 | 11.11 | 19 | 10.44 |
| HER2−, ER+, and/or PR+ | 37 | 40.22 | 28 | 31.11 | 65 | 35.71 |
| Baseline (T0) | End of CT (T1) | End of RT (T2) | 1 Year after Inclusion (T3) | LMM Coefficients 1 (95% CI) | |||||||||
|---|---|---|---|---|---|---|---|---|---|---|---|---|---|
| Mean | SD | Mean | SD | p | Mean | SD | p | Mean | SD | p | |||
| General fatigue (Endpoint) | Control | 9.63 | 4.2 | 12.19 | 4.21 | 0.683 | 10.79 | 4.44 | 0.107 | 10.58 | 3.84 | 0.231 | β1 = 0.33 [−0.40; 1.07], p = 0.374 |
| APAD | 9.95 | 4.18 | 11.97 | 4.37 | 11.65 | 4.44 | 11.1 | 4.07 | β0 = 0.24 [0.014; 0.034], p < 0.05 | ||||
| Median (range) of the relative difference2 | Control | 0.25 (−0.67; 3.0) | 0.083 (−0.60; 3.50) | 0.20 (−0.69; 3.5) | |||||||||
| APAD | 0.21 (−0.5; 2.75) | 0.20 (−0.58; 3.25) | 0.15 (−0.6; 3.0) | ||||||||||
| p = 0.274 | p = 0.157 | p = 0.933 | |||||||||||
| Physical fatigue | Control | 9.55 | 3.72 | 11.28 | 4.05 | 0.896 | 10.61 | 3.96 | 0.985 | 10.1 | 3.63 | 0.742 | β1 = −0.15 [−0.81; 0.52], p = 0.670 |
| APAD | 9.11 | 3.85 | 11.33 | 4.19 | 10.64 | 4.25 | 10.06 | 3.77 | β0 = 0.02 [0.007; 0.025], p < 0.05 | ||||
| Mental fatigue 3 | Control | 7.66 | 3.81 | 9.19 | 4.26 | 1 | 8.9 | 4.31 | 1 | 8.82 | 4.26 | 0.872 | β2 = −0.015 [−0.035; 0.005], p = 0.152 |
| APAD | 8.57 | 4.07 | 9.15 | 4.24 | 9.06 | 4.71 | 9.06 | 4.65 | β0 = 0.03 [0.013; 0.042], p < 0.05 | ||||
| Reduced activities | Control | 8.34 | 3.64 | 10.12 | 4.26 | 0.466 | 9.14 | 3.92 | 0.433 | 8.75 | 4.02 | 0.743 | β1 = 0.30 [−0.40; 0.99], p = 0.399 |
| APAD | 9.01 | 4.01 | 9.84 | 4.64 | 9.67 | 4.49 | 8.9 | 4 | β0 = 0.004 [−0.005; 0.014], p = 0.402 | ||||
| Reduced motivation 3 | Control | 7.73 | 3.5 | 8.22 | 3.92 | 0.587 | 7.84 | 3.46 | 0.651 | 8.07 | 3.19 | 0.572 | β1 = −0.30 [−0.34; 0.93], p = 0.360 |
| APAD | 8.54 | 3.73 | 8.31 | 3.7 | 8.15 | 3.77 | 8.1 | 3.83 | β0 = 0.002 [−0.006; 0.009], p = 0.696 | ||||
| EORTC QLQ-C30 | |||||||||||||
| Global health status | Control | 69.94 | 18.67 | 59.39 | 21.22 | 0.516 | 66.55 | 19.53 | 0.429 | 67.44 | 19.3 | 0.537 | β1 = −0.0026 [−0.071; 0.065], p = 0.940 |
| APAD | 68.45 | 19.55 | 60.83 | 21.34 | 64.82 | 19.1 | 69.17 | 17.76 | β0 = 0.001 [−0.001; 0.001], p = 0.824 | ||||
| Physical functioning | Control | 87.17 | 14.59 | 79.79 | 19.1 | 0.219 | 84.4 | 15.38 | 0.083 | 85.45 | 17.26 | 0.194 | β1 = −0.020 [−0.034; 0.075], p = 0.466 |
| APAD | 88.48 | 14.64 | 82 | 19.58 | 86.49 | 17.11 | 89.46 | 12.95 | β0 = −0.0001 [−0.0007; 0.0006], p = 0.873 | ||||
| Role functioning | Control | 84.46 | 22.16 | 77.99 | 23.34 | 0.257 | 84.35 | 21.03 | 0.966 | 87.05 | 18.48 | 0.309 | β1 = 0.026 [−0.073; 0.125], p = 0.607 |
| APAD | 86.57 | 20.4 | 80.63 | 23.25 | 83.8 | 22.01 | 90.05 | 16.86 | β0 = 0.0009 [−0.0005; 0.0022], p = 0.220 | ||||
| Emotional functioning | Control | 63.7 | 23.52 | 72.75 | 24.83 | 0.211 | 75.51 | 23.09 | 0.309 | 73.26 | 20.1 | 0.679 | β1 = 0.007 [−0.106; 0.119], p = 0.910 |
| APAD | 63.66 | 23.95 | 70.5 | 22.93 | 73.1 | 23.28 | 73.21 | 23.33 | β0 = 0.004 [0.002; 0.005], p < 0.01 | ||||
| Cognitive functioning | Control | 85.21 | 20.5 | 79.3 | 25.14 | 0.657 | 80.16 | 21.75 | 0.849 | 79.97 | 23.42 | 0.957 | β1 = −0.019 [−0.114; 0.076], p = 0.695 |
| APAD | 84.17 | 20.32 | 78.56 | 24.37 | 79.58 | 22.4 | 80.24 | 23.12 | β0 = −0.002 [−0.004; −0.001], p < 0.01 | ||||
| Social functioning | Control | 82.58 | 24.15 | 66.77 | 30.63 | 0.827 | 73.58 | 27.71 | 0.23 | 82.04 | 23.99 | 0.849 | β1 = 0.003 [−0.128; 0.134], p = 0.964 |
| APAD | 84.45 | 21.97 | 66.44 | 29.73 | 69.84 | 28.42 | 83.6 | 21.78 | β0 = −0.00008 [−0.002; 0.002], p = 0.942 | ||||
| Fatigue symptom | Control | 28.54 | 21.86 | 44.87 | 27.24 | 0.934 | 34.62 | 25.73 | 0.152 | 32.26 | 21.96 | 0.935 | β1 = −0.042 [−0.248; 0.164], p = 0.687 |
| APAD | 28.49 | 23.35 | 45.38 | 29.13 | 37.4 | 23.8 | 31.63 | 21.15 | β0 = 0.004 [0.001; 0.007], p = 0.018 | ||||
| Control | APAD | ||||
|---|---|---|---|---|---|
| n | % | n | % | p | |
| Baseline (T0) | |||||
| Anxiety | 0.662 | ||||
| Absence (<7) | 0 | 0.00 | 0 | 0.00 | |
| Suspected (8–10) | 2 | 1.12 | 3 | 1.67 | |
| Confirmed (>10) | 176 | 98.88 | 177 | 98.33 | |
| Mean anxiety (SD) | 11.85 (2.56) | 11.92(2.69) | |||
| Depression | 0.368 | ||||
| Absence (<7) | 0 | 0.00 | 2 | 1.11 | |
| Suspected (8–10) | 70 | 39.33 | 71 | 39.44 | |
| Confirmed (>10) | 108 | 60.67 | 107 | 59.44 | |
| Mean depression (SD) | 18.93 (3.34) | 18.78 (3.54) | |||
| End of chemotherapy (T1) | |||||
| Anxiety | 0.974 | ||||
| Absence (<7) | 0 | 0.00 | 0 | 0.00 | |
| Suspected (8–10) | 1 | 0.64 | 1 | 0.67 | |
| Confirmed (>10) | 156 | 99.36 | 149 | 99.33 | |
| Mean anxiety (SD) | 12.29 (3.21) | 11.99 (3.03) | |||
| Depression | 0.163 | ||||
| Absence (<7) | 0 | 0.00 | 3 | 2.00 | |
| Suspected (8–10) | 55 | 35.03 | 57 | 38.00 | |
| Confirmed (>10) | 102 | 64.97 | 90 | 60.00 | |
| Mean depression (SD) | 20.25 (3.26) | 20.46 (3.22) | |||
| End of radiotherapy (T2) | |||||
| Anxiety | |||||
| Absence (<7) | 0 | 0.00 | 0 | 0.00 | |
| Suspected (8–10) | 0 | 0.00 | 0 | 0.00 | |
| Confirmed (>10) | 147 | 100.00 | 142 | 100.00 | |
| Mean anxiety (SD) | 11.69 (3.04) | 11.97 (3.04) | |||
| Depression | 0.576 | ||||
| Absence (<7) | 1 | 0.68 | 1 | 0.70 | |
| Suspected (8–10) | 68 | 46.26 | 57 | 40.14 | |
| Confirmed (>10) | 78 | 53.06 | 84 | 59.15 | |
| Mean depression (SD) | 20.38 (3.06) | 20.08 (3.34) | |||
| 1 year after inclusion (T3) | |||||
| Anxiety | 0.367 | ||||
| Absence (<7) | 0 | 0.00 | 1 | 0.81 | |
| Suspected (8–10) | 1 | 0.77 | 0 | 0.00 | |
| Confirmed (>10) | 129 | 99.23 | 123 | 99.19 | |
| Mean anxiety (SD) | 11.85 (2.42) | 11.81 (3.11) | |||
| Depression | 0.052 | ||||
| Absence (<7) | 0 | 0.00 | 2 | 1.61 | |
| Suspected (8–10) | 43 | 33.08 | 55 | 44.35 | |
| Confirmed (>10) | 87 | 66.92 | 67 | 54.03 | |
| Mean depression (SD) | 20.26 (2.87) | 19.87 (3.62) | |||
| Baseline (T0) | End of CT (T1) | End of RT (T2) | 1 Year after Inclusion (T3) (n = 113; n = 97) | LMM Coefficients 1 (95% CI) | |||||||||
|---|---|---|---|---|---|---|---|---|---|---|---|---|---|
| (158/168) | (n = 139; n = 129) | (n = 134; n = 128) | |||||||||||
| Mean | SD | Mean | SD | p | Mean | SD | p | Mean | SD | p | |||
| Total MET (MET.min/wk) | Control | 1998.63 | 2632.06 | 2339.37 | 4181.16 | 0.03 | 1522.69 | 1591.27 | 0.048 | 2157.1 | 2902.02 | 0.03 | β1 = 0.74 [0.37; 1.10], p < 0.001 |
| APAD | 2133.07 | 3206.8 | 2023.1 | 1729.05 | 1760.78 | 1464.05 | 2363.96 | 2386.1 | β0 = −0.005 [−0.007; 0.007], p = 0.864 | ||||
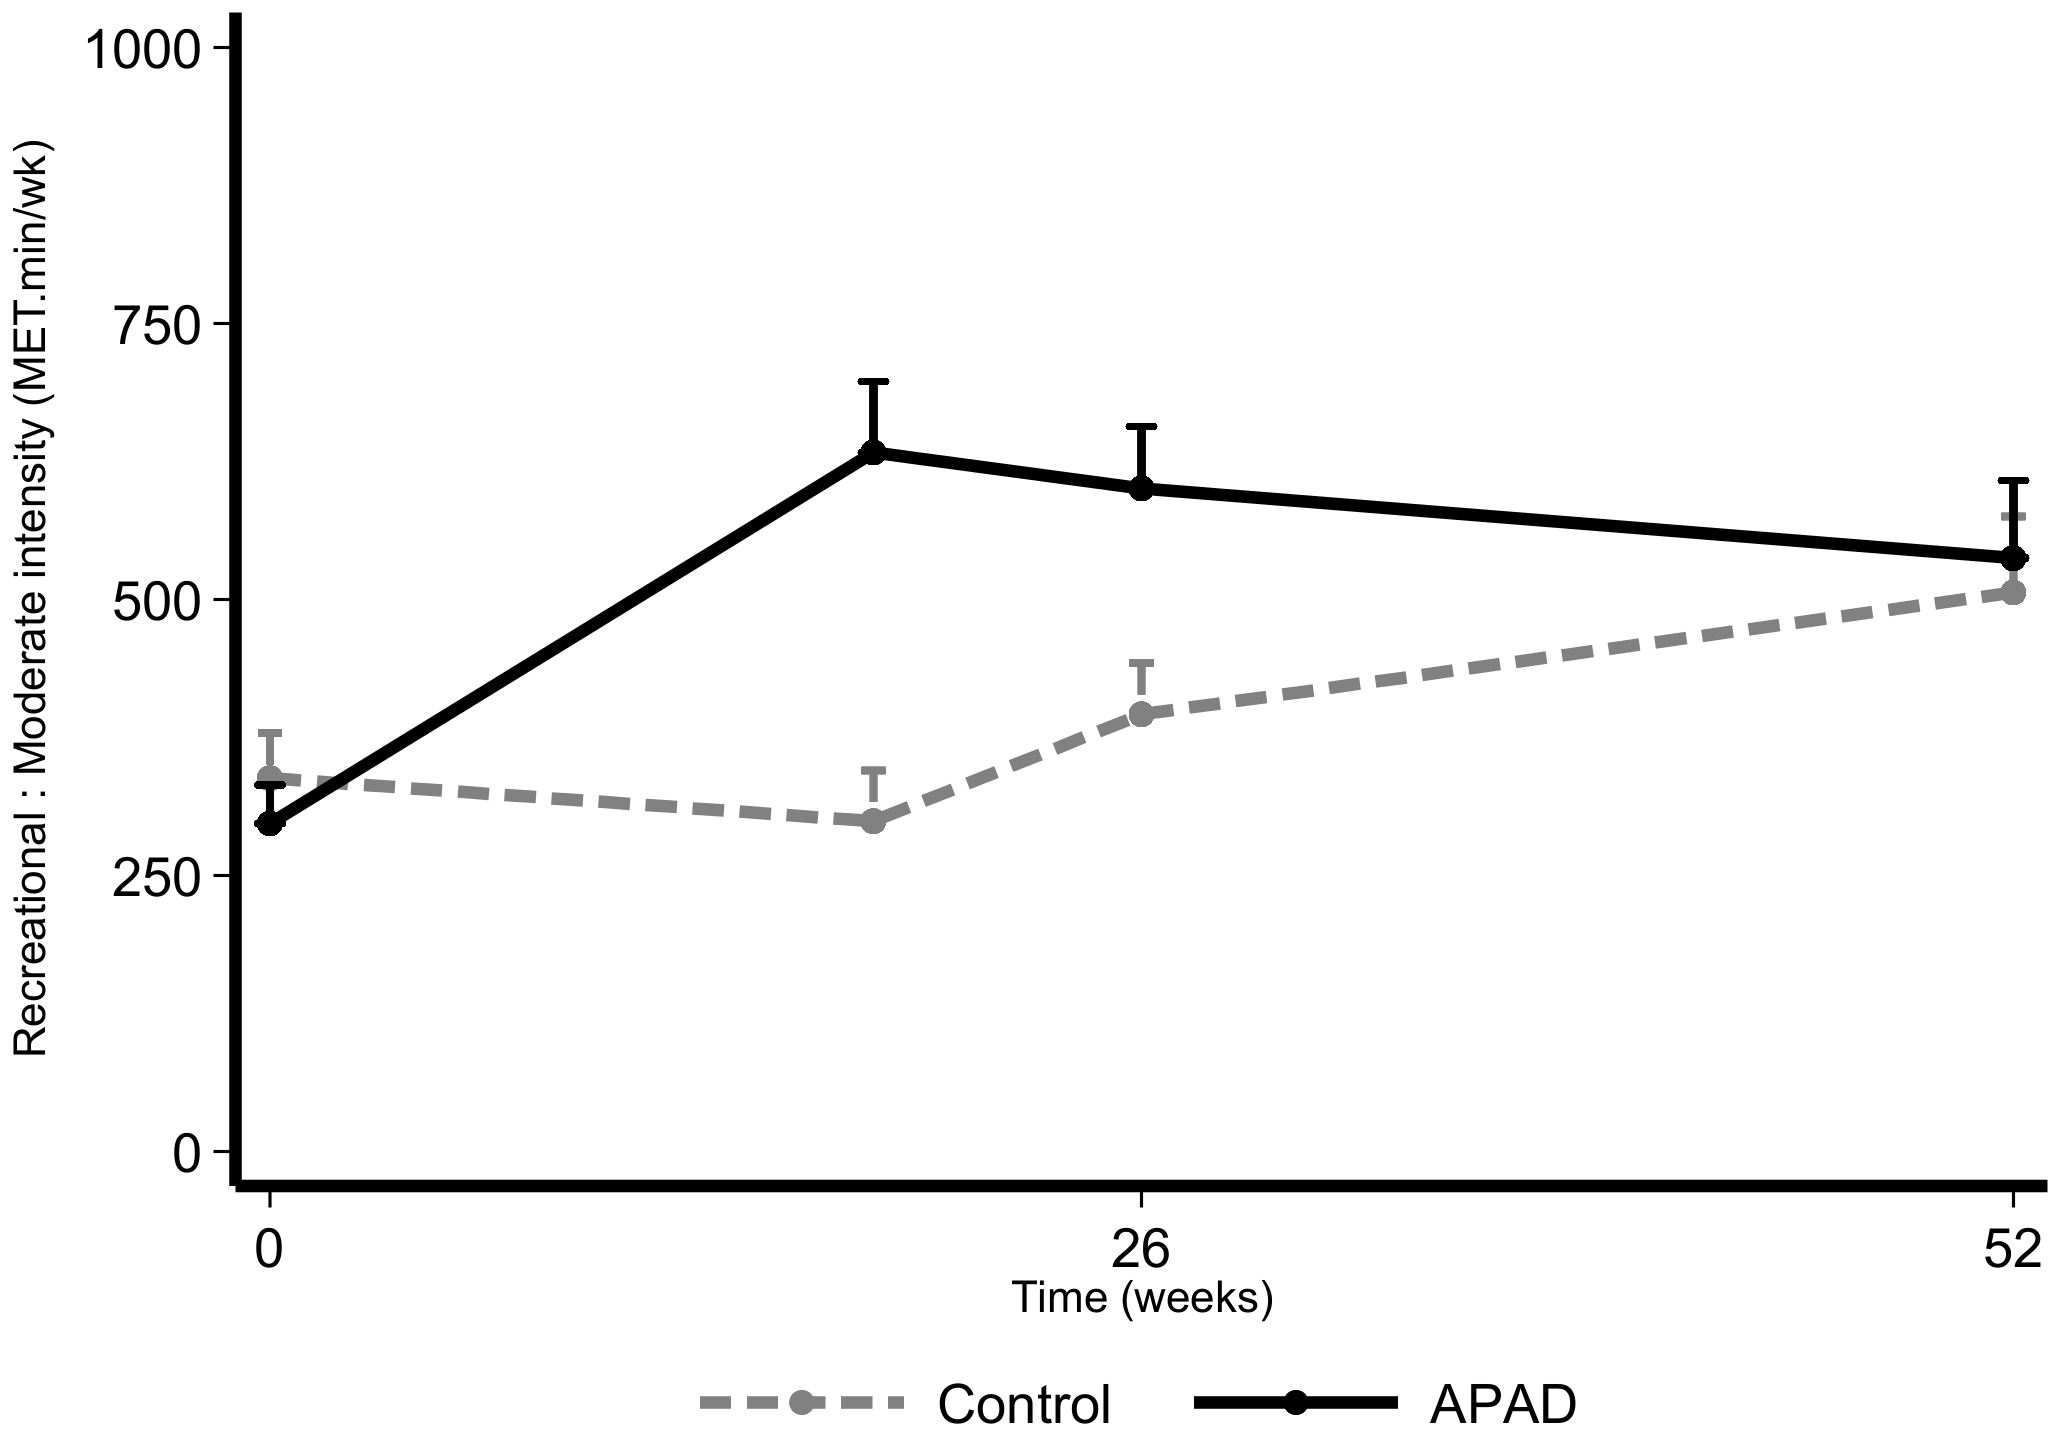
| Recreational–Moderate intensity (MET.min/wk) | Control | 338 | 511.97 | 299.08 | 539.7 | <0.001 | 395.82 | 538.71 | 0.001 | 506.27 | 728.95 | 0.349 | β1 = 0.95 [0.46; 1.43], p < 0.001 |
| APAD | 296.98 | 454.64 | 632.87 | 730.3 | 600.56 | 630.25 | 537.2 | 694.62 | β0 = 0.021 [0.012; 0.030], p < 0.001 | ||||
| Recreational–Vigorous intensity (MET.min/wk) | Control | 122.78 | 461.56 | 219.86 | 829.16 | 0.433 | 173.73 | 618.49 | 0.636 | 216.28 | 777.94 | 0.353 | β1 = 0.27 [−0.13; 0.67], p = 0.184 |
| APAD | 135 | 450.99 | 187.6 | 538.19 | 220.31 | 767.45 | 274.06 | 654.44 | β0 = 0.008 [0.001; 0.015], p = 0.019 | ||||
| Work—Moderate intensity (MET.min/wk) | Control | 816.46 | 1479.06 | 515.11 | 1419.7 | 0.006 | 429.28 | 849.11 | 0.674 | 667.65 | 1423.57 | 0.743 | β1 = 0.34 [−0.19; 0.86], p = 0.212 |
| APAD | 824.4 | 1638.35 | 576.59 | 1001.46 | 508.78 | 998.82 | 546.1 | 963.79 | β0 = −0.012 [0.022; −0.002], p = 0.014 | ||||
| Work—Vigorous intensity (MET.min/wk) | Control | 212.41 | 1378.38 | 523.17 | 2778.69 | 0.935 | 53.73 | 316.49 | 0.813 | 120.35 | 804.99 | 0.721 | β1 = 0.10 [−0.16; 0.36], p = 0.454 |
| APAD | 374.29 | 1906.61 | 78.76 | 420.47 | 79.38 | 556.03 | 225.15 | 1119.72 | β0 = 0.00003 [−0.005; 0.005], p = 0.989 | ||||
| Travel—Moderate intensity (MET.min/wk) | Control | 508.99 | 816.59 | 782.16 | 1117.32 | 0.071 | 470.12 | 702.81 | 0.277 | 646.55 | 1307.34 | 0.141 | β1 = 0.19 [−0.35; 0.72], p = 0.494 |
| APAD | 502.4 | 805.68 | 547.29 | 964.76 | 465.23 | 542.61 | 781.44 | 1734.93 | β0 = 0.01 [0.01; 0.02], p = 0.022 | ||||
| Sitting or reclining time (min/day) | Control | 372.41 | 175.26 | 355.29 | 197.46 | 0.041 | 357.07 | 171.3 | 0.84 | 337.12 | 164.13 | 0.946 | β1 = 0.18 [0.02; 0.33], p = 0.023 |
| APAD | 400.85 | 178.62 | 391.05 | 177.33 | 369.2 | 177.26 | 353.76 | 183.5 | β0 = −0.004 [−0.008; −0.0004], p = 0.029 | ||||
| Muscular test | |||||||||||||
| Sit-to-stand 30 s | Control | 18.09 | 4.67 | 17.3 | 5.51 | 0.013 | 18.86 | 5.32 | 0.39 | 19.42 | 6.02 | 0.615 | β1 = 0.001 [−0.002; 0.002], p = 0.094 |
| β0 = 0.001 [0.0002; 0.002], p = 0.017 | |||||||||||||
| APAD | 17.72 | 4.87 | 18.61 | 4.77 | 19.68 | 5.64 | 20.04 | 6.16 | |||||
| Sit-to-stand ratio | Control | 1.97 | 0.38 | 1.93 | 0.2 | 0.341 | 1.94 | 0.16 | 0.59 | 1.93 | 0.16 | 0.844 | β1 = −0.002 [−0.014; 0.01], p = 0.694 |
| (30 s/15 s) | β0 = −0.0001 [−0.0004; 0.0002], p = 0.431 | ||||||||||||
| APAD | 1.93 | 0.18 | 1.94 | 0.17 | 1.95 | 0.13 | 1.93 | 0.15 | |||||
| Control | APAD | Total | ||||||
|---|---|---|---|---|---|---|---|---|
| n | % | n | % | n | % | p | ||
| Baseline (T0) | ||||||||
| Low activity | 0.084 | |||||||
| No | 105 | 66.46 | 96 | 57.14 | 201 | 61.66 | ||
| Yes | 53 | 33.54 | 72 | 42.86 | 125 | 38.34 | ||
| Failed to meet WHO recommendations | 0.568 | |||||||
| No | 118 | 74.68 | 130 | 77.38 | 248 | 76.07 | ||
| Yes | 40 | 25.32 | 38 | 22.62 | 78 | 23.93 | ||
| End of chemotherapy (T1) | ||||||||
| Low activity | 0.004 | |||||||
| No | 71 | 51.08 | 88 | 68.22 | 159 | 59.33 | ||
| Yes | 68 | 48.92 | 41 | 31.78 | 109 | 40.67 | ||
| Failed to meet WHO recommendations | 0.000 | |||||||
| No | 86 | 61.87 | 105 | 81.40 | 191 | 71.27 | ||
| Yes | 53 | 38.13 | 24 | 18.60 | 77 | 28.73 | ||
| End of radiotherapy (T2) | ||||||||
| Low activity | 0.094 | |||||||
| No | 81 | 60.45 | 90 | 70.31 | 171 | 65.27 | ||
| Yes | 53 | 39.55 | 38 | 29.69 | 91 | 34.73 | ||
| Failed to meet WHO recommendations | 0.071 | |||||||
| No | 95 | 70.90 | 103 | 80.47 | 198 | 75.57 | ||
| Yes | 39 | 29.10 | 25 | 19.53 | 64 | 24.43 | ||
| 1 year after inclusion (T3) | ||||||||
| Low activity | 0.003 | |||||||
| No | 64 | 56.64 | 74 | 76.29 | 138 | 65.71 | ||
| Yes | 49 | 43.36 | 23 | 23.71 | 72 | 34.29 | ||
| Failed to meet WHO recommendations | 0.002 | |||||||
| No | 77 | 68.14 | 84 | 86.60 | 161 | 76.67 | ||
| Yes | 36 | 31.86 | 13 | 13.40 | 49 | 23.33 | ||
| Baseline (T0) | End of Radiotherapy (T2) | 1 Year after Inclusion (T3) | LMM Coefficients 1 [95% CI] | ||||||||
|---|---|---|---|---|---|---|---|---|---|---|---|
| Mean | SD | p | Mean | SD | p | Mean | SD | p | |||
| Total energy (Kcal) | Control | 1507.46 | 362.87 | 0.312 | 1402.41 | 386.27 | 0.637 | 1382.97 | 384.02 | 0.16 | β1 = −0.0020 [−0.054; 0.050], p = 0.947 |
| APAD | 1463.76 | 434.09 | 1377.56 | 373.81 | 1452.03 | 372.93 | β0 = −0.0010 [−0.002; −0.0002], p = 0.013 | ||||
| Animal proteins (g) | Control | 19.64 | 17.92 | 0.233 | 10.38 | 10.04 | 0.003 | 8.35 | 8.99 | 0.233 | β1 = −0.26 [−0.55; 0.017], p = 0.066 |
| APAD | 17.29 | 17.03 | 7.95 | 9.94 | 7.42 | 8.55 | β0 = −0.017 [−0.022; −0.011], p < 0.001 | ||||
| Vegetal proteins (g) | Control | 8.85 | 5.93 | 1 | 5.61 | 4.29 | 0.415 | 5.49 | 4.3 | 0.836 | β1 = −0.084 [−0.23; 0.067], p = 0.276 |
| APAD | 9.2 | 6.87 | 5.45 | 5.59 | 5.53 | 5.07 | β0 = −0.010 [−0.013; −0.007], p < 0.01 | ||||
| Lipids (g) | Control | 61.43 | 21.98 | 0.147 | 57 | 22.9 | 0.22 | 54.82 | 24.05 | 0.407 | β1 = −0.037 [−0.11; 0.034], p = 0.306 |
| APAD | 57.72 | 23.49 | 52.32 | 18.73 | 56.34 | 19.54 | β0 = −0.001 [−0.003; −0.0002], p = 0.021 | ||||
| Monounsaturated lipids (g) | Control | 22 | 9.64 | 0.207 | 19.39 | 9.95 | 0.805 | 19.73 | 12.88 | 0.538 | β1 = −0.024 [−0.11; 0.057], p = 0.558 |
| APAD | 20.55 | 9.27 | 18.37 | 7.15 | 19.62 | 7.51 | β0 = −0.002 [−0.003; 0.0004], p = 0.009 | ||||
| Polyunsaturated lipids (g) | Control | 7.86 | 5.35 | 0.549 | 7.92 | 5.32 | 0.791 | 7.26 | 4.51 | 0.085 | β1 = 0.022 [−0.078; 0.12], p = 0.671 |
| APAD | 7.4 | 4.31 | 7.35 | 3.97 | 8.11 | 4.42 | β0 = 0.0002 [−0.001; 0.002], p = 0.773 | ||||
| Simple sugars (g) | Control | 69.97 | 28.08 | 0.926 | 61.93 | 23.26 | 0.273 | 61.26 | 24.46 | 0.504 | β1 = 0.023 [−0.058; 0.10], p = 0.582 |
| APAD | 70.25 | 30.15 | 65.66 | 24.96 | 64.03 | 26.17 | β0 = −0.002 [−0.004; 0.001], p < 0.001 | ||||
| Alcohol (g) | Control | 4.18 | 6.58 | 0.742 | 4.11 | 5.95 | 0.019 | 4.15 | 6.83 | 0.055 | β1 = −0.091 [−0.010; −0.0009], p = 0.549 |
| APAD | 4.44 | 7.31 | 2.25 | 4.18 | 2.98 | 5.67 | β0 = −0.005 [−0.010; -0.0009], p = 0.020 | ||||
| Fiber (g) | Control | 15.54 | 5.56 | 0.277 | 15.35 | 5.73 | 0.02 | 15.35 | 6.03 | 0.003 | β1 = 0.096 [0.026; 0.17], p = 0.007 |
| APAD | 16.28 | 5.87 | 17.37 | 6.49 | 17.58 | 5.9 | β0 = 0.0005 [−0.0006; 0.001], p = 0.389 | ||||
| Weight control | |||||||||||
| Weight (kg) | Control | 67 | 14.13 | 0.44 | 66.23 | 12.93 | 0.571 | 67.13 | 13.98 | 0.576 | β1 = 0.020 [−0.020; 0.060], p = 0.334 |
| APAD | 68.41 | 14.6 | 67.57 | 13.56 | 68.28 | 14.19 | β0 = 0.0001 [−0.0001; 0.0002], p = 0.389 | ||||
| BMI (kg/m2) | Control | 25.22 | 5.3 | 0.317 | 24.95 | 5.01 | 0.51 | 25.23 | 5.28 | 0.655 | β1 = 0.020 [−0.019; 0.059], p = 0.320 |
| APAD | 25.72 | 5.14 | 25.29 | 4.79 | 25.47 | 5.01 | β0 = 0.0001 [−0.0001; 0.0002], p = 0.337 | ||||
| Waist size (cm) | Control | 163.08 | 6.49 | 0.717 | 87.09 | 13.05 | 0.827 | 87.26 | 15.74 | 0.344 | β1 = 0.0034 [−0.027; 0.034], p = 0.827 |
| APAD | 163.06 | 6.32 | 86.87 | 11.72 | 88.65 | 13.48 | β0 = 0.0002 [−0.0001; 0.0004], p = 0.133 | ||||
© 2020 by the authors. Licensee MDPI, Basel, Switzerland. This article is an open access article distributed under the terms and conditions of the Creative Commons Attribution (CC BY) license (http://creativecommons.org/licenses/by/4.0/).
Share and Cite
Jacot, W.; Arnaud, A.; Jarlier, M.; Lefeuvre-Plesse, C.; Dalivoust, P.; Senesse, P.; Azzedine, A.; Tredan, O.; Sadot-Lebouvier, S.; Mas, S.; et al. Brief Hospital Supervision of Exercise and Diet During Adjuvant Breast Cancer Therapy Is Not Enough to Relieve Fatigue: A Multicenter Randomized Controlled Trial. Nutrients 2020, 12, 3081. https://doi.org/10.3390/nu12103081
Jacot W, Arnaud A, Jarlier M, Lefeuvre-Plesse C, Dalivoust P, Senesse P, Azzedine A, Tredan O, Sadot-Lebouvier S, Mas S, et al. Brief Hospital Supervision of Exercise and Diet During Adjuvant Breast Cancer Therapy Is Not Enough to Relieve Fatigue: A Multicenter Randomized Controlled Trial. Nutrients. 2020; 12(10):3081. https://doi.org/10.3390/nu12103081
Chicago/Turabian StyleJacot, William, Antoine Arnaud, Marta Jarlier, Claudia Lefeuvre-Plesse, Philippe Dalivoust, Pierre Senesse, Ahmed Azzedine, Olivier Tredan, Sophie Sadot-Lebouvier, Sébastien Mas, and et al. 2020. "Brief Hospital Supervision of Exercise and Diet During Adjuvant Breast Cancer Therapy Is Not Enough to Relieve Fatigue: A Multicenter Randomized Controlled Trial" Nutrients 12, no. 10: 3081. https://doi.org/10.3390/nu12103081
APA StyleJacot, W., Arnaud, A., Jarlier, M., Lefeuvre-Plesse, C., Dalivoust, P., Senesse, P., Azzedine, A., Tredan, O., Sadot-Lebouvier, S., Mas, S., Carayol, M., Bleuse, J.-P., Gourgou, S., Janiszewski, C., Launay, S., D’Hondt, V., Lauridant, G., Grenier, J., Romieu, G., ... Vanlemmens, L. (2020). Brief Hospital Supervision of Exercise and Diet During Adjuvant Breast Cancer Therapy Is Not Enough to Relieve Fatigue: A Multicenter Randomized Controlled Trial. Nutrients, 12(10), 3081. https://doi.org/10.3390/nu12103081