Article

Cultivar Determines Fatty Acids and Phenolics Dynamics for Olive Fruit and Oil in Super-High-Density Orchards

by
Juan J. Polari
1,
Lauren M. Crawford
1,2 and
Selina C. Wang
1,3,*
1
Department of Food Science and Technology, University of California Davis, Davis, CA 95616, USA
2
Blount Fine Foods, Fall River, MA 02720, USA
3
Olive Center, University of California Davis, Davis, CA 95616, USA
*
Author to whom correspondence should be addressed.
Agronomy 2021, 11(2), 313; https://doi.org/10.3390/agronomy11020313
Submission received: 20 January 2021 / Revised: 5 February 2021 / Accepted: 8 February 2021 / Published: 10 February 2021

Abstract

:
The dynamics of maturation index, water and oil concentrations, and total phenols in olive fruit, together with fatty acids and total phenols content in olive oil, was studied as a function of time after flowering for super-high-density ‘Arbequina’, ‘Arbosana’ and ‘Koroneiki’ using data collected in three seasons. Oil concentration increased linearly from the middle of August until reaching a plateau by the end of November for all three cultivars, with ‘Koroneiki’ (45.7 g/100 g) and ‘Arbosana’ (45.4 g/100 g) showing higher maximum oil concentration than ‘Arbequina’ (41.8 g/100 g). While total phenols in the fruit decreased linearly during the harvest for all three cultivars, phenolics in oil peaked at 180 days after flowering (400 mg/kg) for ‘Arbequina’ and at 160 days after flowering (600 mg/kg) for ‘Koroneiki’. For ‘Arbosana’, total phenols in oil decreased linearly with a maximum of 400 mg/kg for early harvest oils. Fatty acid dynamics was largely affected by genotype, with ‘Arbequina’ displaying the largest variation in fatty acid concentrations along the season. ‘Koroneiki’ presented the highest values of oleic acid (73.0–77.1%), followed by ‘Arbosana’ (70.2–72.4%) and ‘Arbequina’ (64.4–74.0%). Results presented here are useful for growers to make planting and harvesting decisions, for producers to understand the differences in oil made from the most common super-high-density cultivars during the harvest seasons, and for regulators to consider legal standards for authentic olive oil.

Graphical Abstract

1. Introduction

Olive oil consumption has been steadily increasing worldwide during the last decades. Production has been expanding into traditionally non-producing areas such as South America, Australia, and the United States of America [1]. Although traditional plantation systems are still responsible for a significant part of the production, new plantation systems have arisen to increase production efficiency [2]. Super-high-density plantation systems use a higher density of trees than traditional schemes, minimizing tree sizes and spacing. Besides this, the super-high-density system requires irrigation but allows mechanical harvesting, minimizing the workforce needed for the harvest and reducing harvesting times [3].
Three of the most widely used olive cultivars are ‘Arbequina’, ‘Arbosana’, and ‘Koroneiki’, which have shown good adaptation to the super-high-density system in orchards located in Spain, Italy, Australia, Uruguay, and Argentina [4]. Given the differences in sensory profile among the three cultivars, commercial orchards commonly exploit the three cultivars concurrently, with a higher proportion of ‘Arbequina’. Given its mild sensory properties and good oil yield, this cultivar has shown great success among olive oil producers. In California, where the extension of super-high-density orchards goes up to 6000 hectares, 65% corresponds to ‘Arbequina’, 30% to ‘Arbosana’, and 5% to ‘Koroneiki’ [5].
Both the quantity and quality of olive oil are critical parameters for processors. Oil concentration in the fruit is a relevant parameter for growers and processors since it determines the oil yield and, therefore, the overall crop value. Oil concentration is affected by genetic, cultural, and environmental factors [4,6,7]. Throughout the growing season, oil accumulates in olives until reaching a maximum, so it is advised to harvest after this maximum has been achieved to maximize profitability. Although oil accumulation kinetics have been studied for several cultivars in both the Mediterranean and non-Mediterranean regions [8,9,10,11], this information has not been reported for super-high-density cultivars in California, a relatively new cultivation region.
One of the main drivers for the increased olive oil consumption is the health benefit associated with regular olive oil intake. These benefits are associated in part with the unique fatty acid composition of olive oil, characterized by a high relative concentration of oleic acid and low levels of linoleic acid [12]. Olive oil fatty acid composition has been shown to be affected mainly by genetic factors [11,13,14,15]. In California, studies have demonstrated the relevance of these factors for super-high-density ‘Arbequina’, ‘Arbosana’, and ‘Koroneiki’ [16]. Nevertheless, no kinetics studies considering harvest time have been published in the United States.
Phenolic compounds are key minor components of olive oil, related to its prolonged shelf life [17], nutritional properties [18], and sensory characteristics [19]. The olive fruit has an exceptionally high content of phenolic compounds [20]. Consequently, some of these phenolic compounds migrate to the oil during the extraction process. Although the concentration of phenolics in the olive fruit is not the only factor determining their concentration in the oil [21], knowing the variation in fruit composition during crop seasons and cultivars, as well as its correlation with the concentration in the oil, is relevant to make good predictions and characterize olive cultivars.
In this study, we measured and modeled the dynamics of water, oil, and total phenols in olive fruit and olive oil during ripening for super-high-density ‘Arbequina’, ‘Arbosana’, and ‘Koroneiki’ cultivated in California, US, from three consecutive crop seasons. Additionally, the fatty acid composition and total phenols concentration of the extracted oils were determined to give an insight into their accumulation dynamics and explore the potential of these parameters in cultivar classification.

2. Materials and Methods

2.1. Olive Samples

Olive fruits from super-high-density ‘Arbequina’, ‘Arbosana’, and ‘Koroneiki’ were used for this study. The experiment was carried out in a commercial orchard property of California Olive Ranch Inc., located at Corning, CA, USA. The climate of the area is considered Mediterranean (Figure 1). The trees were planted during 2010 in a frame of 4 × 1.5 m. The tree density is approximately 1700 trees per hectare. A surface drip irrigation system was used during spring and summer.
Olive fruit samples were hand-harvested during the 2016, 2017, and 2018 crop seasons; total sampling times were 13, 14, and 8, respectively, between mid-August and early December. Approximately 3 kg of fruits were randomly sampled from a block consisting of three lines of 20 trees each. This sample was divided into three 1 kg portions. For each portion, maturation index, water, oil, and total phenols concentration were assessed, and the extracted oil was analyzed for fatty acid composition and total phenols compounds. All measurements were performed in triplicates.

2.2. Maturation Index

One hundred olives were randomly selected from each batch of fruit and categorized in seven groups according to the epicarp pigmentation, from right-green skin (group n = 0) to black skin with 100% purple flesh (group n = 7). Maturation index (MI) is given by the equation:
M I = N = 0 N = 7 N × n i 100
where N is the group number and n i is the number of olives in the group.

2.3. Water Concentration

Olive paste was obtained by crushing olive fruit with a hammer mill. The sample (60 ± 0.1 g) was weighed in a beaker and placed in the oven at 105 °C until constant weight (12 h approx.). The beaker was transferred to a desiccator, and the weight of the dry paste was registered after two hours.

2.4. Oil Concentration

Dried olive paste (20 ± 0.1 g) was weighed in a cellulose extraction thimble, placed in the Soxhlet extractor, and extracted using n-hexane for six hours. The solvent was then evaporated in a rotary evaporator, and the residual solvent was eliminated in an oven at 105 °C for three hours.

2.5. Total Phenols Concentration in Olive Fruit

Phenolic compounds were extracted using a previously described method with some modifications [20]. Olive paste was collected immediately after hammer mill crushing and 2 g was extracted with 10 mL dimethyl sulfoxide. The sample was vortexed for 30 s and centrifuged (7400 g, 5 min). The supernatant was collected and filtered (0.45 µm, nylon), and 0.3 mL was diluted with 0.3 mL of methanol and 0.6 mL of nanopure water to allow for storage at −20 °C prior to analysis without solid freezing of the extracts. For total phenol analysis, 0.2 mL of the sample was diluted with 3.8 mL nanopure water. Folin-Ciocalteu reagent (0.1 mL) was added, and the sample was briefly vortexed and allowed to stand for 3 min. One mL of saturated sodium carbonate solution (200 g/L) was added and, after further vortexing, the extract was stored in the dark at room temperature for 45 min. Absorbance was measured at 725 nm using a GENESYS™ 10S UV-Vis Spectrophotometer (Thermo Electron Corporation, Madison, WI, USA). Total phenols were calculated relative to the absorbance caffeic acid. Stock solutions of caffeic acid (0–550 µg/mL) were prepared in water and these solutions were analyzed using the same method described in the paragraph above. A six-point second-order polynomial calibration curve was constructed for each harvest year, with R2 values between 0.999–0.9998. The data for each cultivar were represented as caffeic acid equivalents (CAE) on a dry-weight basis.

2.6. Olive Oil Extraction

Olive oil was extracted with a laboratory scale system consisting of a hammer crusher, a malaxer, and a basket centrifuge (Abencor analyzer, MC2 Ingenieria y Sistemas S.L., Seville, Spain). Olives were crushed in triplicates in batches of 700 g. After malaxation (45 min at 27 °C), the olive paste was centrifuged for 2 min in the basket centrifuge. The obtained oil was centrifuged at 5000 rpm for 10 min to separate the water and stored at −20 °C in plastic bottles without headspace until analysis.

2.7. Quality Parameters

Free fatty acids (FFA) and peroxide value (PV) were determined according to AOCS standard methods Ca 5a-40 (09) and Cd 8b-90(09), respectively.

2.8. Fatty Acid Profile

Olive oil (0.010 ± 0.001 g) was weighed in a 12-mL amber vial and dissolved in toluene (0.4 mL). Methanol (3 mL) and methanol/HCl (0.6 mL, 80:20, v/v) were added. The vial was securely capped and then kept in a heating block at 80 °C for 1 hr. Hexane (1.5 mL) and nanopore water (1 mL) were then added and vortexed. The upper hexane layer containing the methyl esters was decanted into a 1.5-mL Eppendorf tube with the aid of a glass transfer pipet. Anhydrous sodium sulfate (enough to cover the bottom conical part of the tube) was added to dry out the water residue. The clear solution was then transferred into GC autosampler vials for GC injection.
The GC analysis was conducted on a Varian 450-GC (Agilent Technologies, Santa Clara, CA, US) equipped with a flame ionization detector (FID). Helium was used as carrier gas at a flow rate of 1.5 mL/min. Fatty acid methyl esters (1 µL) were injected onto a DB-23 capillary column (60 m × 0.25 mm × 0.25 μm; Agilent Technologies) with the injector temperature at 270 °C at a split ratio of 1:100 and FID temperature at 280 °C. The GC oven temperature was initially held at 100 °C for 8 min, ramped at 6.5 °C/min to 160 °C, ramped at 2.7 °C/min to 215 °C and held for 12 min, ramped at 15 °C/min to 230 °C and held for 10 min. A mix of FAME standard (Supelco, Bellefonte, PA, USA) was used as references for peak identification by retention times; relative fatty acid proportions were determined by peak area normalization.

2.9. Total Phenols Concentration in Olive Oil

Olive oil (2.0 ± 0.1 g) was dissolved in hexane (1 mL) and extracted 3 times with methanol/water (2 mL; 60:40 v/v). After centrifugation (5000 rpm, 6 min) the supernatants were collected, and total phenols determination was performed using Folin-Ciocalteu colorimetric method. An aliquot (0.2 mL) of the phenolic extract was diluted with distilled water up to 5 mL and mixed with Folin-Ciocalteu reagent (0.5 mL) and sodium carbonate (1 mL; 35% w/v). After bringing it to a final volume of 10 mL, the mixture was stored in the dark for 2 h. The absorbance at 725 nm was measured, and the concentration of phenolic compounds was calculated using an external calibration curve prepared with caffeic acid.

2.10. Statistical Analysis

For each cultivar, GraphPad Prism 9.0.0 (GraphPad Inc., San Diego, CA, USA) was used to fit linear and non-linear regression models to obtain relationships between days after flowering (DAF) and the set of fruit and oil parameters named previously. Linear models were used for modelling total phenolic compounds in olive fruit. Gaussian models were used to fit the maturation index and total phenols on olive oil. Bilinear models were used for water and oil concentration, as well as individual fatty acids. The bilinear model provides a good estimation for accumulation rate and duration, as well as other parameters with biological significance [9]; for water and oil concentrations, as well as oleic and linoleic acids, the model equations were:
y = a + b x   for   x < c y = z   for   x c
For palmitic acid in ‘Arbequina’, the model equations were:
y = a + b x   for   x < c y = d + e x   for   x c
For palmitic acid from ‘Arbosana’ and ‘Koroneiki’, model equations were:
y = z   for   x < c y = a + b x   for   x c
where y is the parameter to model (water, oil, fatty acid concentration), x is the time from full bloom in days, a is the intercept and b is the slope of the linear phase, c is the breakpoint over which y reaches the maximum z, and the x-intercept (-a/b) estimates the onset of the linear stage. Principal component analysis (PCA) was used to segregate cultivars according to their fatty acid composition.

3. Results

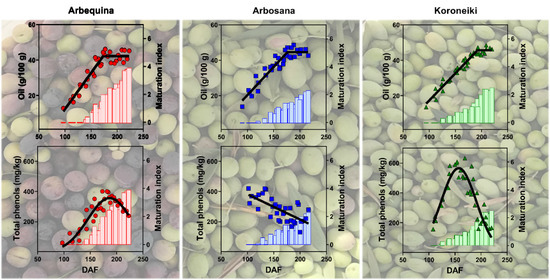
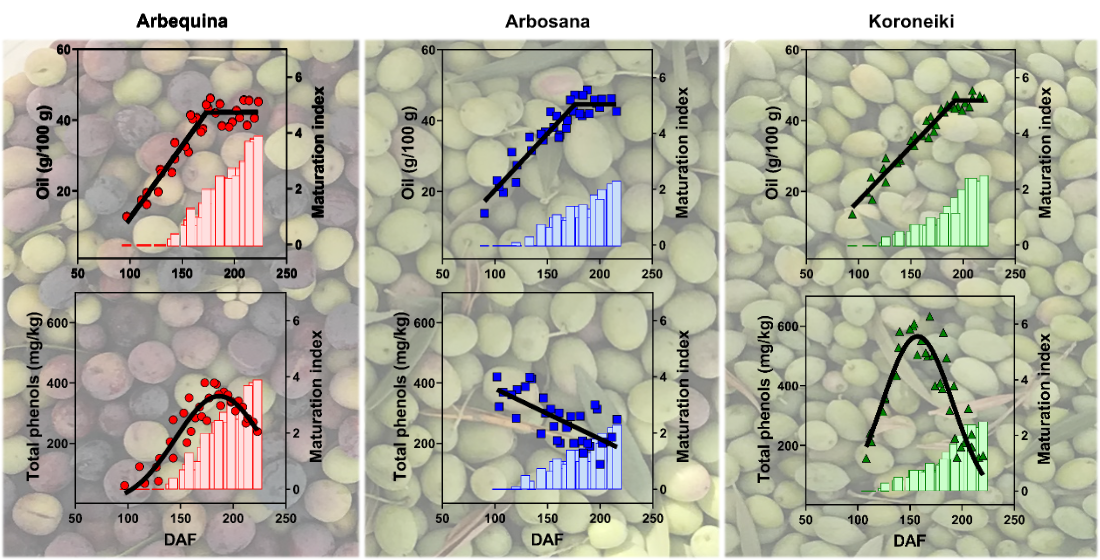
3.1. Dynamics of Maturation Index

The maturation index increased with DAF from the end of August until December (Figure 2). However, the final values, as well as the incremental rate, differed among cultivars. ‘Arbequina’ reached higher maturation indexes (0.0–3.9) when compared with ‘Arbosana’ (0.0–2.3) and ‘Koroneiki’ (0.0–2.5) in this study. The proposed gaussian model adequately described the changes in the maturation index with DAF for all three cultivars (R2 = 0.96, 0.85, and 0.90, respectively).

3.2. Dynamics of Water Concentration

Figure 3 shows the dynamics of olive fruit water concentration as a function of DAF for the three studied cultivars. For ‘Arbequina’, values were in the range 57.1–65.4 g/100 g, and water concentration decreased linearly until 149 DAF, reaching 58.4 g/100 g and remaining constant. Similarly, for ‘Koroneiki’, the range was 51.5–65.9 g/100 g, and water concentration decreased until 140 DAF, remaining around 54.1 g/100 g. Water concentration for ‘Arbosana’ remained steady in the interval 56.2–62.5 g/100 g throughout the season, with a mean value of 59.6 g/100 g. Water concentration in olive fruit is affected by cultivar, harvest time, and irrigation; the main factor determining water concentration in olives is indeed water availability [10,22]. Since the experiment was performed in an irrigated orchard, where the water amount was adjusted to keep water potential constant, we can attribute the observed differences to the cultivars and harvest time effect.
There was a significant negative correlation between extraction efficiency (data not shown) and water concentration of the olive fruit (r = −0.69) as well as positive correlations between fat content on dry (r = 0.54) and wet basis (r = 0.66), indicating that fat content on a wet basis is a better predictor of extractability compared to fat content on a dry basis.

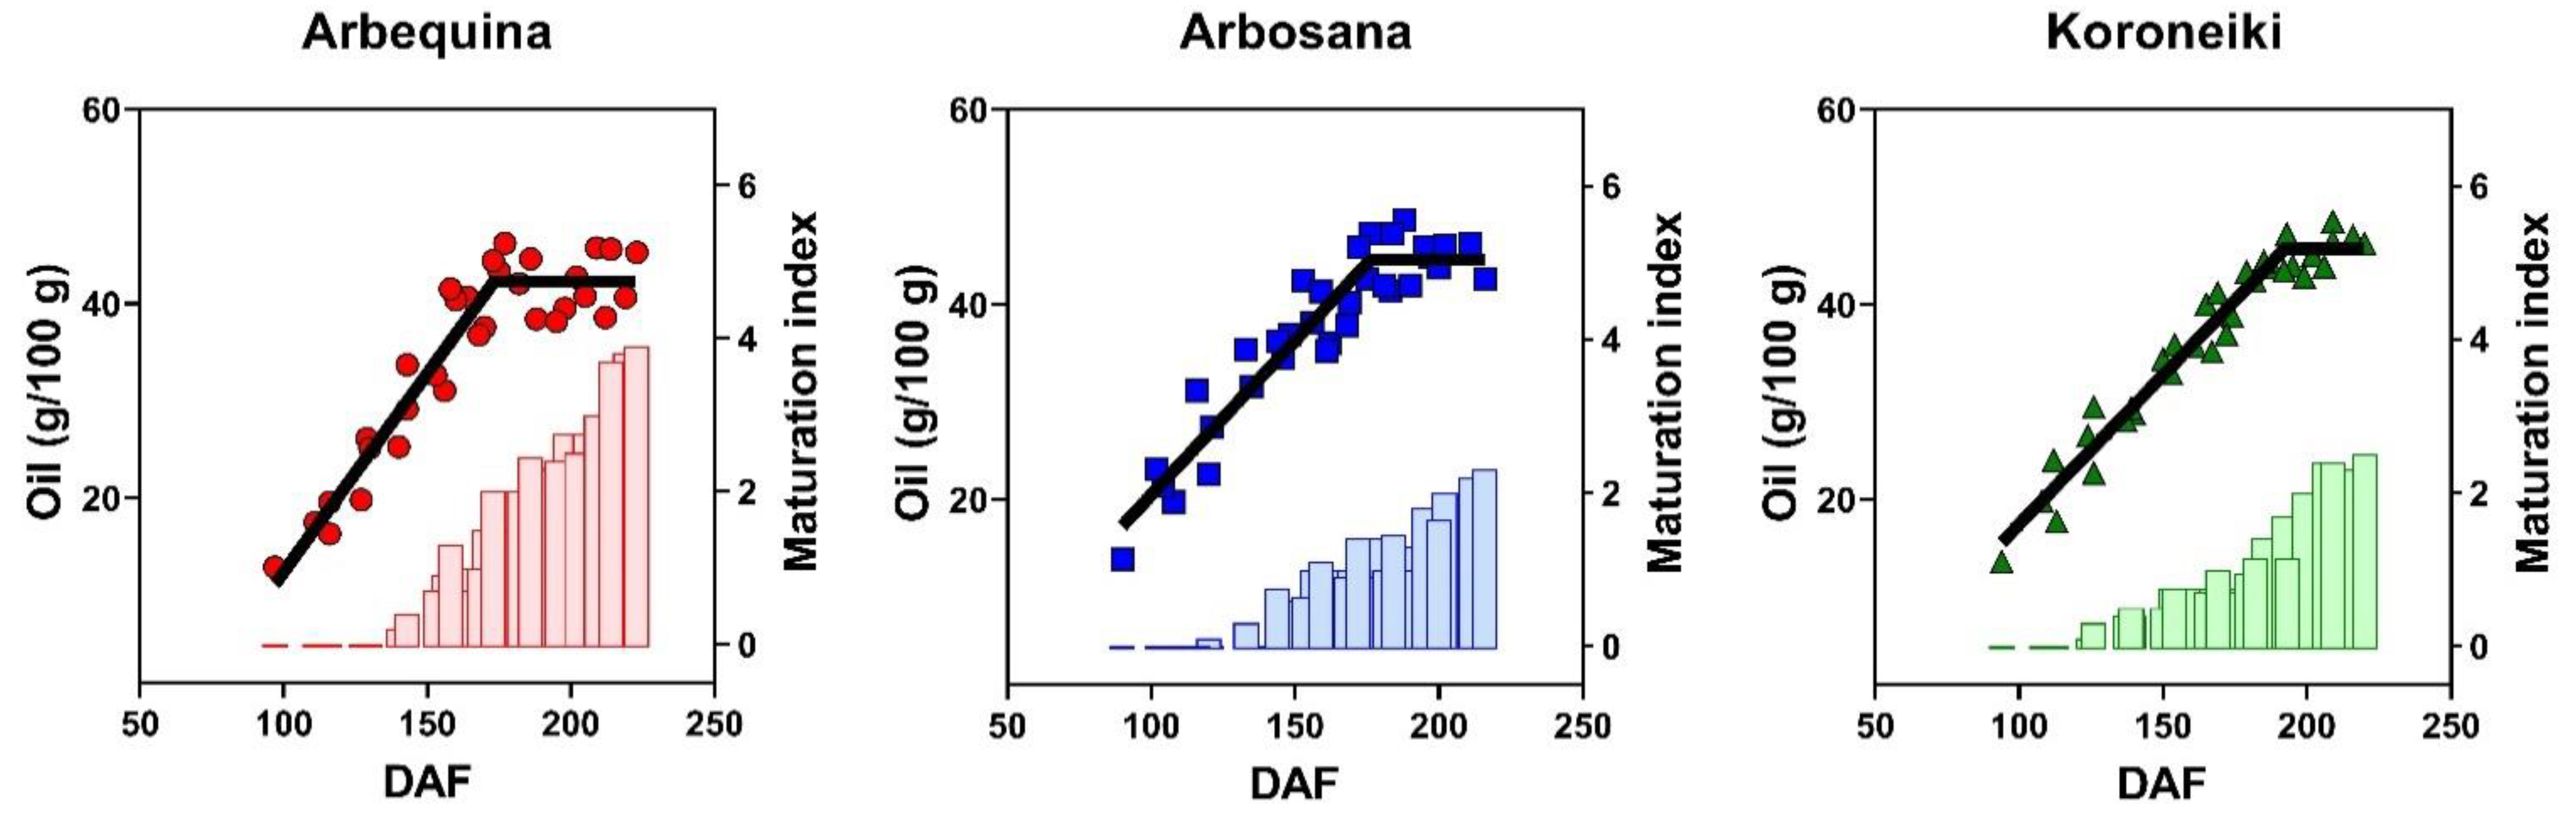
3.3. Dynamics of Oil Concentration

Figure 4 shows the results for the dynamics of oil concentration on a dry basis as a function of DAF for ‘Arbequina’, ‘Arbosana’, and ‘Koroneiki’. Table 1 summarizes the model parameters for the three cultivars. The proposed bilinear model adequately described the changes in oil concentration with DAF for all three cultivars (R2 = 0.91, 0.90, and 0.96, respectively). Maximum oil concentration (MOC) ranged between 41.8% and 45.7% among cultivars. ‘Koroneiki’ presented the highest oil concentration (45.7 g/100 g) and the more extended accumulation period (192 DAF). The onset of oil accumulation occurred first to ‘Arbosana’ (36 DAF) and ‘Koroneiki’ (43 DAF) and last to ‘Arbequina’ (60 DAF), which presented the highest accumulation rate compared to the other two cultivars (0.41%/DAF).

3.4. Dynamics of Fatty Acids Concentration

All the extracted olive oil presented FFA and PV within limits for the extra virgin category according to International Olive Council (IOC) and United States Department of Agriculture (USDA) standards. No effect of cultivar was observed for FFA. In addition, no specific trend was observed along the time window considered for this study. Results expressed as an average of the three years, and all harvest times were 0.13 ± 0.03 g/100 g for ‘Arbequina’, 0.13 ± 0.02 g/100 g for ‘Arbosana’, and 0.14 ± 0.02 g/100 g for ‘Koroneiki’. While always remaining below the maximum of 20 mEq O2/kg established for the extra virgin quality, PV decreased throughout the harvest season for the three cultivars. Low free fatty acidity on all three cultivars studied are consistent with healthy olive fruits and oil samples extracted shortly after harvest.
Results for the dynamics of oleic, linoleic, and palmitic acids relative concentration as a function of time after flowering are shown in Figure 5. For ‘Arbequina’, changes in oleic, linoleic, and palmitic fatty acids were studied using bilinear models (R2 = 0.87, 0.94, and 0.78, respectively). Oleic acid decreased linearly with time until reaching a plateau at 164 DAF, remaining constant with a mean value of 65.8%. Linoleic acid, on the other hand, increased linearly until reaching a plateau at the same time as oleic acid, remaining constant at 12.6%. Palmitic acid increased linearly to reach a maximum at the same time oleic and linoleic acid reached the plateau 164 DAF, but in this case, it decreased linearly after this date. The trends show a precise breakpoint in the dynamics of these fatty acids, coincident with the end of the oil accumulation period. For ‘Arbosana’, oleic acid remains constant during the harvest season (70.2–72.4%), whereas linoleic and palmitic acid dynamics were explained by bilinear models (R2 = 0.84 and 0.64, respectively). Linoleic acid increased linearly from 5% to 8% at 200 DAF, remaining constant afterward. Palmitic acid remained stable (15.7%) until 164 DAF and then decreased linearly to 13% by the end of the season. For ‘Koroneiki’, oleic and palmitic acids were fitted with a bilinear model (R2 = 0.72 and 0.92, respectively), whereas linoleic acid remained constant (5.3–6.9%) throughout the harvest season. Oleic acid increased linearly from 74% until 76.7% at day 200, reaching a plateau by the end of the season. Palmitic acid behaved as in the case of ‘Arbosana’, remaining constant (13.3%) until day 141 and then decreasing linearly until 11% by the end of the season.

3.5. Cultivar Discrimination by Fatty Acids

Principal component analysis was applied to establish correlations among individual fatty acids and determine distinctive fatty acids to specific cultivars. The first two principal components explain 75.0% of the total variance found in the dataset (PC1: 51.2%; PC2: 23.8%). The score plot (Figure 6, right) shows that the three cultivars have unique fatty acid compositions that can differentiate all the cultivars from each other, independent of the harvest time. Supervised statistical classification methods, such as partial least squares discriminant analysis, also provided robust classification models for these cultivars [23].
Stearic, oleic, linolenic, arachidic, gondoic, and behenic acids were positively correlated with PC1, while palmitic, palmitoleic, margaric, heptadecenoic, and linoleic acids were negatively correlated with PC1. PC2 was positively correlated with palmitic, palmitoleic, margaric, heptadecenoic, stearic, linolenic, arachidic, behenic, and lignoceric acids and negatively correlated with linoleic and gondoic acids. While PC1 contributed mainly to the segregation of ‘Koroneiki’, characterized by a high concentration of oleic acid, PC2 contributed mostly to the separation of ‘Arbosana’ and ‘Arbequina’. The results for the fatty acid profile according to each cultivar are summarized in Table 2. ‘Koroneiki’ had the highest concentration of oleic acid, with a range between 73.0% and 77.1%, followed by ‘Arbosana’, ranging from 70.2% to 72.4%, and ‘Arbequina’, with a range between 64.4% and 74.0%. ‘Arbosana’ had a higher concentration of margaric, heptadecenoic, and lignoceric acids, while ‘Arbequina’ presented a higher concentration of linoleic acid. All three cultivars were below the upper limit of 83% oleic acid proposed by the International Olive Council (IOC) as a measure of genuine olive oil. However, for heptadecenoic acid (C17:1), some ‘Arbosana’ oil exceeded the limit of 0.3% from the olive oil grade standards of USDA [24], though it is within the allowed limit from IOC.
From the loading and score plot analysis in Figure 6, oleic acid showed robust negative correlations with linoleic and palmitic acids. Since linoleic acid is synthesized from oleic acid, an increment in linoleic would necessarily be associated with a decrease in oleic. These trends were observed not only for olives but also for nuts [16,24,25]. It is the activity of the enzyme oleate desaturase that determines the balance between these two fatty acids [26]. Furthermore, the negative correlation between oleic and palmitic acids follows the same logic since palmitic acid is a precursor of stearic acid, and ultimately, of oleic acid. If the metabolic pathway is induced to the synthesis of one, this would be detrimental to the other. Genetic contributions to fatty acid biosynthesis have a crucial role in determining olive cultivars’ fatty acid composition.

3.6. Dynamics of Total Phenols Concentration in Olive Fruit and Oil

Results for total phenols in the olive fruit are shown in Figure 7, top row. Three cultivars followed the same trend, with the concentration decreasing along the season. Adjustment of the data to a linear model was moderately satisfactory, with R2 = 0.60, 0.63, and 0.64 for ‘Arbequina’, ‘Arbosana’, and ‘Koroneiki’, respectively. Total phenol concentration ranges were 7.7–20.7 g/kg for ‘Arbequina’, 10.3–25.73 g/kg for ‘Arbosana’, and 9.4–22.0 g/kg for ‘Koroneiki’.
Total phenols in olive oil followed significantly different trends to those in the fruit (Figure 7, bottom row). For ‘Arbequina’ and ‘Koroneiki’, total phenols first increased, reaching a maximum followed by a decrease until the beginning of December. Gaussian model adequately adjusted the variation along the season with R2 = 0.87 for ‘Arbequina’ and R2 = 0.96 for ‘Koroneiki’. Total phenol concentration ranges were 66.7–405.8 mg/kg for ‘Arbequina’, 110.1–420.4 mg/kg for ‘Arbosana’, and 156.9–608.5 mg/kg for ‘Koroneiki’. The rate at which concentration increased and the magnitude of the maximum values depended on the cultivar. ‘Arbequina’ reached its maximum for total phenols approximatively 180 DAF, whereas ‘Koroneiki’ reached its maximum 160 DAF. For ‘Arbosana’, total phenols concentration started at higher values than ‘Arbequina’ and ‘Koroneiki’, but steadily decreased from August until the first week of December.

4. Discussion

The composition of the olive fruit determine the yield and quality of olive oil. The correlation between olive fruit and olive oil composition is of utmost significance since it is the natural first step toward developing adequate prediction models to help make sound decisions for harvest time. This study was adapted to the harvest season in California, where the processors try to finish the harvest season in December to avoid a potential frost and associated quality issues. There is a lack of information regarding this abridged harvest season, which differs from some other producing countries. During the three crop seasons when this study was performed, little weather changes were observed (Figure 1) and the models shown may not be suitable in areas with more weather variability.
Only a few studies have attempted to model water concentration variation with harvest time [8,9]. While water content in ‘Arbosana’ did not show any specific trend throughout this experiment, both ‘Arbequina’ and ‘Arbosana’ behave similarly to ‘Arbequina’ fruit from trees grown in Argentina planted in a high-density frame [8]. The water concentration in olive fruit was negatively correlated with the overall efficiency of the extraction process. The general hypothesis behind this observation is that high water concentration favors the formation of emulsions in the olive paste, leading to the subsequent losses during the phase separation process [22,27].
Oil concentration at harvest is of paramount importance for growers since it determines the total amount of oil that can be extracted from the fruit and, therefore, the overall value of the crop. Descriptive studies have shown how oil concentration in olive fruit is affected by genetic and environmental factors [10,11,15] and harvest times [28,29]. Implementing mathematical models that can predict maximum oil concentration is essential to evaluate different olive cultivars’ adaptation to other cultural practices or geographical locations [8,9]. The differences observed among cultivars may be associated with changes in the activity of the enzymes involved in the synthesis of fatty acid and triglycerides [25,27,30]. Furthermore, climatic conditions might affect the activity of the active enzymes as well. Understanding the interactions between genetic and environmental factors on oil accumulation at a molecular level would be essential to lead breading efforts to create high yield cultivars.
In plants, C16 and C18 fatty acids are synthesized in the plastids using acetyl-CoA as a precursor via a cycle of enzymatic reactions involving the fatty acid synthase complex [31]. Oleic acid (C18:1) is synthetized from stearic acid in a desaturation step performed by the enzyme stearoyl-ACP Δ9-desaturase. Linoleic acid (C18:2) synthesis occurs outside the plastids, in the endoplasmic reticulum, in a subsequent desaturation reaction catalyzed by the enzyme oleate desaturase (Δ12 fatty acid desaturase). For ‘Arbequina’, we observed decreases in oleic acid concentration and correspondent increases in linoleic acid shown in Figure 5, demonstrating that enzyme oleate desaturase was very active, causing oleic acid was being converted into linoleic acid faster than it was synthesized during the oil accumulation period. The activity of oleate desaturase seems to be reduced in ‘Arbosana’, where oleic acid level remains steady, and the increasing rate in linoleic acid during the oil accumulation period is significantly lower compared to that of ‘Arbequina’. Oleate desaturase activity in ‘Koroneiki’ seems to be even lower than in the case of ‘Arbosana’, given that no increment is seen in the relative concentration of linoleic acid according to maturation, at an extent that oleic acid concentration increases during the oil accumulation period. The relative activities of stearoyl-ACP Δ9-desaturase and oleate desaturase might be responsible for the final fatty acid profile in olives. Even though more experiments are required to support this hypothesis, the following order can be stated for oleate desaturase activity during the olive fruit maturation: ‘Arbequina’ > ‘Arbosana’ > ‘Koroneiki’. The decrease of palmitic acid in ‘Arbosana’ and ‘Koroneiki’ may be explained by a dilution effect [14], where the elongation reactions are active without de novo synthesis of fatty acids. In the case of ‘Arbequina’, the observed increment may be related to the constant and higher consumption of stearic acid by oleate desaturase, with the consequent de novo synthesis of palmitic acid.
For the concentration of the total phenolics in olive fruit, all cultivars showed a significant decrease with harvest time, an observation that is in accordance with the decline in phenolic concentration for olive oil observed in previous studies [21]. Nonetheless, the trend observed for total phenols concentration in the olive oil was utterly different for ‘Arbequina’ and ‘Koroneiki’. The variation with harvest time was non-linear, and data were correctly modeled by Gaussian functions for these cultivars. Phenolic compounds concentration in olive oil was previously rationalized considering the interactions between the evolution of enzymatic activities during fruit ripening and mass transport processes between water and oil occurring during extraction [32,33,34]. However, genetic dispositions led to entirely different behavior regarding the dynamics of these minor components in olive oil, emphasizing the importance of understanding individual cultivars development in order to make sound harvest time decision. In the case of ‘Arbequina’, maximum oil accumulation and phenol concentration in oil were reached one week apart, showing that for this cultivar, both maximum yield and phenols are attainable without mutual sacrifice. For ‘Koroneiki’, the maximum phenol concentration was obtained approximately one month before the maximum oil concentration. For ‘Arbosana’, any delay in harvest will lower the total phenols content. While a late harvest may be desirable from the yield standpoint, the timing when the maximum healthful bioactive phenols in olive oil is reached should be considered when making harvest time decisions.

5. Conclusions

The dynamics olive fruit composition parameters were studied for super-high-density cultivars ‘Arbequina’, ‘Arbosana’, and ‘Koroneiki’. In addition, fatty acids and total phenol concentrations were determined in the extracted oil. Water concentration slightly decreased until reaching a plateau for ‘Arbequina’ and ‘Koroneiki’, while no specific trend was observed for ‘Arbosana’. Oil concentration increased linearly until reaching a plateau for the three cultivars, with ‘Koroneiki’ showing the highest maximum oil concentration compared with ‘Arbequina’ and ‘Arbosana’. Besides this, ‘Koroneiki’ showed the most extended oil accumulation period, suggesting that this cultivar should be harvested later than the other two. Oil accumulation started later in ‘Arbequina’ but evolved at a higher rate compared to the other two cultivars. Oleic, linoleic, and palmitic acids were the primary fatty acids detected in all cultivars and all harvest times. ‘Koroneiki’ presented the highest concentration of oleic acid and the lowest level of linoleic acid, whereas ‘Arbequina’ presented the lowest oleic acid and highest linoleic acid concentration. We hypothesize that this difference is due to a higher activity of oleate desaturase during the oil accumulation period in ‘Arbequina’ compared with ‘Koroneiki’. A strong non-linear behavior was observed for total phenols concentration in oils from ‘Arbequina’ and ‘Koroneiki’ cultivars. Maximum total phenol concentration was higher in ‘Koroneiki’ compared with ‘Arbequina’. Information presented here is useful for growers to make future planting and harvesting decisions; for processors to understand the natural variances in oil compositions that may be related to stability and shelf life; and for regulators to evaluate if the current standards of olive oil accommodate the genetic and environmental influences on fatty acid compositions. Further studies considering more seasons are necessary to account for increasing the weather variations produced by climate change, similarly, more locations are necessary to account for the geographical effects in the US.

Author Contributions

Conceptualization, J.J.P. and S.C.W.; methodology, J.J.P. and S.C.W.; formal analysis, J.J.P. and L.M.C.; investigation, J.J.P. and S.C.W.; resources, S.C.W.; data curation, J.J.P. and S.C.W.; writing—original draft preparation, J.J.P.; writing—review and editing, J.J.P., L.M.C. and S.C.W.; supervision, S.C.W.; project administration, S.C.W.; funding acquisition, S.C.W. All authors have read and agreed to the published version of the manuscript.

Funding

This research received no external funding.

Institutional Review Board Statement

Not applicable.

Informed Consent Statement

Not applicable.

Data Availability Statement

The data presented in this study are available in the article.

Acknowledgments

We thank California Olive Ranch Inc. for providing the samples and the Berta Family for supporting Polari’s graduate study.

Conflicts of Interest

The authors declare no conflict of interest.

References

  1. International Olive Council. Key-Figures on the World Market for Olive Oils. Available online: http://www.internationaloliveoil.org/estaticos/view/134-approved-balances (accessed on 8 December 2020).
  2. Vossen, P. Olive oil: History, production, and characteristics of the world’s classic oils. Hortscience 2007, 42, 1093–1100. [Google Scholar] [CrossRef] [Green Version]
  3. Connor, D.J.; Gómez-del-Campo, M.; Rousseaux, M.C.; Searles, P.S. Structure, management and productivity of hedgerow olive orchards: A review. Sci. Hortic. 2014, 169, 71–93. [Google Scholar] [CrossRef]
  4. Torres, M.; Pierantozzi, P.; Searles, P.; Rousseaux, M.C.; García-Inza, G.; Miserere, A.; Bodoira, R.; Contreras, C.; Maestri, D. Olive Cultivation in the Southern Hemisphere: Flowering, Water Requirements and Oil Quality Responses to New Crop Environments. Front. Plant Sci. 2017, 8, 1830. [Google Scholar] [CrossRef] [Green Version]
  5. Sturzenberger, N.D. Super-High-Density Olive Production in California; UC Davis Olive Center: Davis, CA, USA, 2009. [Google Scholar]
  6. Navas-Lopez, J.F.; León, L.; Trentacoste, E.R.; de la Rosa, R. Multi-environment evaluation of oil accumulation pattern parameters in olive. Plant Physiol. Biochem. 2019, 139, 485–494. [Google Scholar] [CrossRef]
  7. De la Rosa, R.; Talhaoui, N.; Rouis, H.; Velasco, L.; León, L. Fruit characteristics and fatty acid composition in advanced olive breeding selections along the ripening period. Food Res. Int. 2013, 54, 1890–1896. [Google Scholar] [CrossRef]
  8. Trentacoste, E.R.; Puertas, C.M.; Sadras, V.O. Effect of fruit load on oil yield components and dynamics of fruit growth and oil accumulation in olive (Olea europaea L.). Eur. J. Agron. 2010, 32, 249–254. [Google Scholar] [CrossRef]
  9. Trentacoste, E.R.; Puertas, C.M.; Sadras, V.O. Modelling the intraspecific variation in the dynamics of fruit growth, oil and water concentration in olive (Olea europaea L.). Eur. J. Agron. 2012, 38, 83–93. [Google Scholar] [CrossRef]
  10. Beltrán, G.; Del Río, C.; Sánchez, S.; Martínez, L. Seasonal changes in olive fruit characteristics and oil accumulation during ripening process. J. Sci. Food Agric. 2004, 84, 1783–1790. [Google Scholar] [CrossRef]
  11. Mailer, R.J.; Ayton, J.; Conlan, D. Influence of harvest timing on olive (Olea europaea) oil accumulation and fruit characteristics under Australian conditions. J. Food Agric. Environ. 2007, 5, 58–63. [Google Scholar]
  12. Schwingshackl, L.; Hoffmann, G. Monounsaturated fatty acids, olive oil and health status: A systematic review and meta-analysis of cohort studies. Lipids Health Dis. 2014, 13. [Google Scholar] [CrossRef] [PubMed] [Green Version]
  13. Rondanini, D.P.; Castro, D.N.; Searles, P.S.; Rousseaux, M.C. Contrasting patterns of fatty acid composition and oil accumulation during fruit growth in several olive varieties and locations in a non-Mediterranean region. Eur. J. Agron. 2014, 52, 237–246. [Google Scholar] [CrossRef]
  14. Gómez-González, S.; Ruiz-Jiménez, J.; De Castro, M.D.L. Oil content and fatty acid profile of Spanish cultivars during olive fruit ripening. JAOCS J. Am. Oil Chem. Soc. 2011, 88, 1737–1745. [Google Scholar] [CrossRef]
  15. De La Rosa, R.; León, L.; Moreno, I.; Barranco, D.; Rallo, L. Ripening time and fruit characteristics of advanced olive selections for oil production. Aust. J. Agric. Res. 2008, 59, 46–51. [Google Scholar] [CrossRef]
  16. Li, X.; Flynn, J.D.; Wang, S.C. The Effects of Variety, Growing Region, and Drought Stress on Fatty Acid and Sterol Compositions of California Olive Oil. JAOCS J. Am. Oil Chem. Soc. 2019, 96, 215–230. [Google Scholar] [CrossRef]
  17. Baldioli, M.; Servili, M.; Perretti, G.; Montedoro, G.F. Antioxidant activity of tocopherols and phenolic compounds of virgin olive oil. J. Am. Oil Chem. Soc. 1996, 73, 1589–1593. [Google Scholar] [CrossRef]
  18. Servili, M.; Selvaggini, R.; Esposto, S.; Taticchi, A.; Montedoro, G.; Morozzi, G. Health and sensory properties of virgin olive oil hydrophilic phenols: Agronomic and technological aspects of production that affect their occurrence in the oil. J. Chromatogr. A 2004, 1054, 113–127. [Google Scholar] [CrossRef]
  19. Andrewes, P.; Busch, J.L.H.C.; de Joode, T.; Groenewegen, A.; Alexandre, H. Sensory Properties of Virgin Olive Oil Polyphenols: Identification of Deacetoxy-ligstroside Aglycon as a Key Contributor to Pungency. J. Agric. Food Chem. 2003. [Google Scholar] [CrossRef]
  20. Crawford, L.M.; Holstege, D.M.; Wang, S.C. High-throughput extraction method for phenolic compounds in olive fruit (Olea europaea). J. Food Compos. Anal. 2018, 66, 136–144. [Google Scholar] [CrossRef]
  21. Romero-Segura, C.; García-Rodríguez, R.; Sánchez-Ortiz, A.; Sanz, C.; Pérez, A.G. The role of olive β-glucosidase in shaping the phenolic profile of virgin olive oil. Food Res. Int. 2012, 45, 191–196. [Google Scholar] [CrossRef]
  22. Jose Motilva, M.; Jess Tovar, M.; Paz Romero, M.; Alegre, S.; Girona, J. Influence of regulated deficit irrigation strategies applied to olive trees (Arbequina cultivar) on oil yield and oil composition during the fruit ripening period. J. Sci. Food Agric. 2000, 80, 2037–2043. [Google Scholar] [CrossRef]
  23. Polari, J.J.; Mori, M.; Wang, S.C. Virgin Olive Oils from Super-High-Density Orchards in California: Impact of Cultivar, Harvest time, and Crop Season on Quality and Chemical Composition. Eur. J. Lipid Sci. Technol. 2020, 2000180. [Google Scholar] [CrossRef]
  24. Mailer, R.J.; Ayton, J.; Graham, K. The influence of growing region, cultivar and harvest timing on the diversity of australian olive oil. JAOCS J. Am. Oil Chem. Soc. 2010, 87, 877–884. [Google Scholar] [CrossRef]
  25. Polari, J.J.; Zhang, L.; Ferguson, L.; Maness, N.O.; Wang, S.C. Impact of Microclimate on Fatty Acids and Volatile Terpenes in “Kerman” and “Golden Hills” Pistachio (Pistacia vera) Kernels. J. Food Sci. 2019, 84, 1937–1942. [Google Scholar] [CrossRef]
  26. Sánchez, J.; Harwood, J.L. Biosynthesis of triacylglycerols and volatiles in olives. Eur. J. Lipid Sci. Technol. 2002, 104, 564–573. [Google Scholar] [CrossRef]
  27. Morelló, J.R.; Romero, M.P.; Motilva, M.J. Effect of the maturation of the olive fruit on the phenolic fraction of drupes and oils from Arbequina, Farga, and Morrut cultivars. J. Agric. Food Chem. 2004, 52, 6002–6009. [Google Scholar] [CrossRef]
  28. USDA. United States Standards for Grades of Olive Oil and Olive-Pomace Oil; USDA: Washington, DC, USA, 2010.
  29. Lee, C.; Polari, J.J.; Kramer, K.E.; Wang, S.C. Near-Infrared (NIR) Spectrometry as a Fast and Reliable Tool for Fat and Moisture Analyses in Olives. ACS Omega 2018, 3, 16081–16088. [Google Scholar] [CrossRef]
  30. Ramli, U.S.; Salas, J.J.; Quant, P.A.; Harwood, J.L. Metabolic control analysis reveals an important role for diacylglycerol acyltransferase in olive but not in oil palm lipid accumulation. FEBS J. 2005, 272, 5764–5770. [Google Scholar] [CrossRef]
  31. Ghanbari, R.; Anwar, F.; Alkharfy, K.M.; Gilani, A.H.; Saari, N. Valuable Nutrients and Functional Bioactives in Different Parts of Olive (Olea europaea L.)—A Review. Int. J. Mol. Sci. 2012, 13, 3291–3340. [Google Scholar] [CrossRef] [PubMed]
  32. Conde, C.; Delrot, S.; Gerós, H. Physiological, biochemical and molecular changes occurring during olive development and ripening. J. Plant Physiol. 2008, 165, 1545–1562. [Google Scholar] [CrossRef] [PubMed]
  33. Morelló, J.R.; Vuorela, S.; Romero, M.P.; Motilva, M.J.; Heinonen, M. Antioxidant Activity of Olive Pulp and Olive Oil Phenolic Compounds of the Arbequina Cultivar. J. Agric. Food Chem. 2005, 53, 2002–2008. [Google Scholar] [CrossRef] [PubMed]
  34. Ortega-Garcia, F.; Blanco, S.; Peinado, M.A.; Peragon, J. Polyphenol oxidase and its relationship with oleuropein concentration in fruits and leaves of olive (Olea europaea) cv. “Picual” trees during fruit ripening. Tree Physiol. 2008, 28, 45–54. [Google Scholar] [CrossRef] [PubMed]
Figure 1. Minimum and maximum monthly temperatures at the location where the fruits were collected in 2016, 2017, and 2018.
Agronomy 11 00313 g001
Figure 2. Dynamics of olive fruit maturation index as a function of time after flowering (days) for super-high-density ‘Arbequina’, ‘Arbosana’, and ‘Koroneiki’ grown in California, USA.
Agronomy 11 00313 g002
Figure 3. Dynamics of olive fruit water concentration as a function of time after flowering (days) for super-high-density ‘Arbequina’, ‘Arbosana’, and ‘Koroneiki’ grown in California, US. Maturation index serves as a reference.
Agronomy 11 00313 g003
Figure 4. Dynamics of olive fruit oil concentration (on a dry basis) as a function of time after flowering (days) for super-high-density ‘Arbequina’, ‘Arbosana’, and ‘Koroneiki’ grown in California, US. Maturation index serves as a reference.
Agronomy 11 00313 g004
Figure 5. Dynamics of oleic, linoleic, and palmitic acid concentration (%) as a function of time after flowering (days) for super-high-density ‘Arbequina’, ‘Arbosana’, and ‘Koroneiki’ grown in California, US. Maturation index serves as a reference.
Agronomy 11 00313 g005
Figure 6. Principal component analysis for fatty acids from super-high-density cultivars ‘Arbequina’, ‘Arbosana’, and ‘Koroneiki’ grown in California, US; (left) Loading plot; (right) Score plot.
Agronomy 11 00313 g006
Figure 7. Dynamics of olive fruit (top) and oil (bottom) total phenols as a function of time after flowering (days) for super-high-density ‘Arbequina’, ‘Arbosana’, and ‘Koroneiki’ grown in California, US. Maturation index serves as a reference.
Agronomy 11 00313 g007
Table 1. Maximum oil concentration, accumulation rate, the onset of the linear stage and duration, (days from full bloom to maximum oil concentration) for the dynamics of fruit oil concentration on a dry basis.
CultivarMax Oil Conc. (%)Rate (%/DAF)Onset (DAF)Duration (DAF)
Arbequina41.8 ± 1.6 b0.41 ± 0.04 a60 ± 10 a172 ± 4 b
Arbosana45.4 ± 1.6 a0.32 ± 0.03 b36 ± 10 b179 ± 5 b
Koroneiki45.7 ± 1.3 a0.31 ± 0.02 b43 ± 10 b192 ± 4 a
Values are expressed as mean ± SD; different letters indicate significant differences within each parameter across cultivars at p < 0.05.
Table 2. Fatty acids composition for super-high-density ‘Arbequina’, ‘Arbosana’, and ‘Koroneiki’ grown in California, US.
Fatty AcidArbequinaArbosanaKoroneiki
Palmitic acid (C16:0)15.76 ± 0.69 a15.32 ± 0.61 b12.31 ± 1.32 c
Palmitoleic acid (C16:1)1.44 ± 0.32 a1.38 ± 0.17 b0.66 ± 0.09 c
Margaric acid (C17:0)0.12 ± 0.03 c0.18 ± 0.05 b0.06 ± 0.08 a
Heptadecenoic acid (C17:1)0.26 ± 0.04 b0.35 ± 0.06 a0.07 ± 0.01 c
Stearic acid (C18:0)1.83 ± 0.15 c2.28 ± 0.23 b2.58 ± 0.17 a
Oleic acid (C18:1)67.47 ± 2.02 c71.16 ± 1.59 b75.31 ± 1.02 a
Linoleic acid (C18:2)11.00 ± 1.55 a6.96 ± 1.26 b6.10 ± 0.75 c
Linolenic acid (C18:3)0.71 ± 0.19 b0.80 ± 0.15 a0.8 ± 0.13 a
Arachidic acid (C20:0)0.41 ± 0.02 c0.47 ± 0.03 b0.49 ± 0.03 a
Gondoic acid (C20:1)0.31 ± 0.03 c0.29 ± 0.04 b0.32 ± 0.02 a
Behenic acid (C22:0)0.13 ± 0.01 b0.18 ± 0.09 a0.17 ± 0.01 a
Lignoceric acid (C24:0)0.07 ± 0.01 b0.12 ± 0.10 a0.08 ± 0.01 b
Values are expressed as mean ± SD; within a row, different letters indicate significant differences within each fatty acid across cultivars at p < 0.05.
Publisher’s Note: MDPI stays neutral with regard to jurisdictional claims in published maps and institutional affiliations.

