Abstract
Climate, nitrogen (N) and leaf area index (LAI) are key determinants of crop yield. N additions can enhance yield but must be managed efficiently to reduce pollution. Complex process models estimate N status by simulating soil-crop N interactions, but such models require extensive inputs that are seldom available. Through model-data fusion (MDF), we combine climate and LAI time-series with an intermediate-complexity model to infer leaf N and yield. The DALEC-Crop model was calibrated for wheat leaf N and yields across field experiments covering N applications ranging from 0 to 200 kg N ha−1 in Scotland, UK. Requiring daily meteorological inputs, this model simulates crop C cycle responses to LAI, N and climate. The model, which includes a leaf N-dilution function, was calibrated across N treatments based on LAI observations, and tested at validation plots. We showed that a single parameterization varying only in leaf N could simulate LAI development and yield across all treatments—the mean normalized root-mean-square-error (NRMSE) for yield was 10%. Leaf N was accurately retrieved by the model (NRMSE = 6%). Yield could also be reasonably estimated (NRMSE = 14%) if LAI data are available for assimilation during periods of typical N application (April and May). Our MDF approach generated robust leaf N content estimates and timely yield predictions that could complement existing agricultural technologies. Moreover, EO-derived LAI products at high spatial and temporal resolutions provides a means to apply our approach regionally. Testing yield predictions from this approach over agricultural fields is a critical next step to determine broader utility.
1. Introduction
Nitrogen (N) plays a critical role in plant productivity and physiology [1]. To achieve the demands for food, feed and fuel of a growing population, the application of N fertilizers is an essential part of modern agricultural production [2,3]. Farmers often apply quantities of N fertilizer which exceed that required by crops to attain yield potential [4,5]. Excessive N applications can, however, have detrimental impacts on the environment, including biodiversity, water quality from nitrate leaching, air quality and, thus, climate because of nitrous oxide emissions [6,7,8]. Cropland management practices should, therefore, aim for more spatially targeted and efficient N applications that maximize yields whilst reducing the negative environmental impacts.
Reliable estimates of crop N status at growth stages corresponding to key management periods are essential for determining spatially variable N fertilization application rates. Crop N can be inferred by determining the critical N, defined as the minimum N in plant aboveground biomass required for maximum growth at a given time and field condition [9]. The general decrease in N concentration observed with crop growth can be described using N dilution curves. These curves are typically established based on the relationship between N content and dry matter (e.g., shoot or leaf) from destructive sample measurements [10].
Crop leaf N content correlates with chlorophyll concentration and leaf area index (LAI) [11], both of which can be estimated from satellite Earth observation (EO) multispectral data [12,13]. EO sensors can provide valuable synoptic and repetitive coverages of crops over large areas [14]. Optical EO data is, however, a function of the spectral characteristics (i.e., transmission, absorption, and reflectance properties) of the entire crop canopy, including leaf, stem and ears. Consequently, the spectral data is highly convolved and the covariance between traits, including chlorophyll content and LAI (and thus foliar N) [12], can complicate the retrievals of individual leaf traits. The retrieval of crop traits from EO is further confounded by spatial scaling mismatches. These mismatches exist between the ground measurements, used for calibrating retrieval models, and the spatial resolution of satellite sensors, as demonstrated in Revill at al. [15]. The extent to which optical EO data can be used to provide estimates of crop N is also dependent on the availability of cloud-free imagery. Because the timing of N applications coincides with key crop growth stages, at least biweekly observations are required for the effective tracking of crop growth dynamics [16,17]. This regularity in observations may not always be available in temperate latitudes under frequent cloud-cover.
Process-based crop growth models can estimate daily crop growth and productivity in response to inputs of meteorology and management [18]. Crucially the models simulate interactions between these inputs. Crop models explicitly link crop development and leaf traits to leaf function (i.e., photosynthesis and growth) and yield potential [19]. In comparison to EO data, crop models can simulate the mechanisms leading to yield formation and, in doing so, provide an intrinsic explanation for spatial and temporal yield differences. The models can, therefore, be used as a decision-making tool to simulate crop productivity under different agricultural practices [20,21,22] including those concerning N application [5,23].
Detailed crop models, including those that simulate leaf-level processes over multiple canopy layers [24], can have a high level of complexity and typically require an extensive number of parameters [25]. For instance, the WOFOST model uses 27 parameters to simulate phenological development and leaf growth alone [26]. Crop model parameters are often difficult to specify and more complex models are challenging to calibrate [27,28]. Consequently, models are often over-fitted for specific sites, which presents complications when scaling up to provide regional estimates [29,30]. The introduction of the N cycle, with links to N management and soil-water dynamics, is one of the most common factors that result in an increase in crop model complexity and the number of required inputs [25]. Research in Salo et al. [31] includes an inter-comparison of 11 widely used crop models for predicting yield responses to different N application rates. Most of these models used a detailed representation of the components of the N cycle, which included processes effecting N mineralization, N movement, N demands, and the responses of N stress on growth and phenology. Despite the high level of detail, generally these models did not accurately reproduce yield responses to N applications, with the majority of the models underestimating yields by greater than 1 t ha−1.
In this research, we merge observations of crop canopy development (e.g., using EO data) with the predictive capabilities of an intermediate complexity model, which simulates interactions of leaf N traits, climate and yield. We hypothesize that this modelling approach can provide reliable estimates of plant leaf N traits attributed to management. Specifically, the modelling of yield over a growing season can be summarized:
where yield is dependent on the interception and absorption of solar radiation (i.e., climate) by available leaf area (i.e., LAI) and its carboxylation capacity (i.e., leaf N). Essential climate drivers include solar energy, required for photosynthetic reactions, and temperature, which effects the rates of crop development and photosynthesis. Prior to harvest the best proxy for yield is LAI, which is the largest biomass pool and the most readily observable, with many LAI products generated from satellite data. Research has also demonstrated improved crop model yield simulations when assimilating LAI observations [32,33,34]. Thus, the LAI at a time t should be explained by the chronological development of LAI and leaf N, along with the climate during the preceding period. Since LAI is only one component of the yield equation, its growth must also be consistent with the evolution of the crop’s developmental stage up to time t:
There are reliable models of developmental stage linked to climate data, and both LAI and climate can be determined from EO and meteorological re-analyses data [35,36]. Thus, for a given time-step, leaf N is the only unknown, and can therefore be inferred based on the observed LAI and climate data, and the model of developmental stage. A key question is what information content does LAI and climate data provide in such an inversion? and what is the relative importance of each of these constraints?
Here we test whether a model-data fusion (MDF) approach can combine observations of crop canopy states (LAI) and climate with process modelling to estimate yield and leaf N traits robustly. If leaf N can be routinely inferred from EO data and modelling, we can better understand controls on variation in crop leaf N content and yield in response to N-application. Robust crop model evaluations involve testing simulations under a wide range of circumstances. For model calibration and validation, we therefore use comprehensive multi-temporal measurements acquired during two seasons of experimental winter wheat N trial plots in Scotland spanning a range of N treatment levels: from 0 to 200 kg N ha−1. Field data included non-destructive measurements of LAI along with C and N content data from some destructive samples. We apply a MDF framework that consists of using Bayesian inference to calibrate probabilistically an intermediate complexity process model—simulating photosynthesis, C mass-balance and N dilution—for the estimation of LAI, yield and leaf N concentration. We apply this model framework to carry out experiments that were designed to address the following key questions:
- What is the performance of an intermediate complexity model for the simulation of LAI and yields when calibrated across a range of N fertilizer treatments and are the model parameter consistent across treatments?
- Can a single model calibration (developed from research Question 1) reliably reproduce destructively sampled leaf N content observations at each of the treatments when constrained by climate and LAI data?
- Can a single model calibration (developed from Question 1) reliably reproduce yield variation across each of the treatments when constrained by climate and LAI inputs and what is the relative information content of LAI and climate data?
- Can yield prediction from fusing the model and EO data potentially be accurate enough to support timely management interventions?
The novelty of this research is to use a combination of climate data and canopy time-series observations with a process model to produce robust estimates of crop N status and, thus, yield. Essentially, the MDF process determines the likely leaf N based on the observed canopy development, climate and process understanding of how leaf N is linked to photosynthesis and production. Based on this research, we discuss the potential of the MDF approach for providing (sub-) field scale estimates of leaf N and yield forecasts that could support precision agriculture using EO-derived LAI.
2. Materials and Methods
2.1. Field Site and Measurements
Multi-temporal field campaign measurements, used for model calibration and evaluation, were carried out at winter wheat field experiments during two consecutive growing seasons (2016–2017 and 2017–2018). The experiments were situated approximately 4 km south of the village of East Saltoun, East Lothian, Scotland (55°52′50.5″ N, 2°50′12.2″ W; 170 m above mean sea level).
2.1.1. Experimental Trial Plot Description
Trials comprised of a set of 50 winter wheat (Triticum aestivum L.) experiments set up over two growing seasons: 2016 to 2017 and 2017 to 2018. Since the plots were included in fertilization experiments, the plot locations were moved between the two seasons to minimize the impact of any soil-remaining fertilizer on successive experiments. Although the locations moved by around 1 km, both sites were managed with the same previous crop rotation sequence and had a Humbie soil series with a loam texture.
To investigate and evaluate the MDF approach for estimating yield response to N, for both seasons the experiments included five different rates of N application: 0, 50, 100, 150 and 200 kg N ha−1 (Figure 1). Each of the plot treatments had five replicates for two common soft group 4 winter wheat varieties: Revelation and Leeds. These wheat varieties were selected in accordance with the 2016–2017 and 2017–2018 recommended lists published by the UK Agriculture and Horticultural Development Board for cereal crops [37]. However, only negligible differences in growth stage timing, biomass and yields were observed between these two wheat varieties.
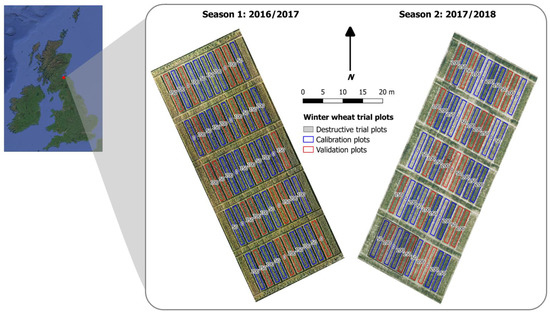
Figure 1.
Winter wheat trial plot design used during growing season 1 (2016–2017) and season 2 (2017–2018) at different field locations. UAV-derived true-colour aerial images acquired during both seasons have annotations showing the nitrogen treatments (N; kg N ha−1) across 50 replicated trial plots along with plots selected for model calibration (blue) and validation (red). The locations of five plots used for the destructive sample analysis (season 2 only) are also highlighted (cross-hatching), whereas non-destructive canopy measurements were carried out at all 50 plots during both seasons.
For both years, the N fertilization of plots was carried out as a split application—50% of the total N was applied at growth stage (GS) 24 and the remainder was added at around GS 31. For the 2016–2017 growing season the sowing date was 30 September and harvest was 07 September, whereas the plots were sown on the 30 September and harvested on 25 August for the 2017–2018 season.
Throughout the two crop growing seasons meteorological data—used to drive the crop model—was recorded using an automated Weather Station (WS-GP1; Delta-T Devices, Cambridge, UK) that was located on a 2 m mast within 1 km of both plot locations. This meteorological data, which was logged at 10-min resolutions, included minimum and maximum air temperature (°C) and short-wave radiation (kWh m−2). Post-processing of this data included the removal of outliers, such as abrupt changes in temperature between observations, followed by temporal aggregation of the time-series from 10-min to daily time-steps.
2.1.2. Non-Destructive Measurements
Non-destructive LAI measurements were carried out at all experimental trial plots at key winter wheat growth stages during both growing seasons (Table 1). For each plot, five replicates of LAI were taken using a SunScan Canopy Analyser (Delta-T Devices, Cambridge, UK). These replicates were then combined to give a plot average and standard deviation. The growth stages were also determined on a per plot basis, whereby for a given plot the dominant growth stage was recorded. For each observation date, the average growth stage is then reported across all the experimental treatments.

Table 1.
Dates and corresponding average growth stages (GS; Zadoks et al. [38]) when non-destructive ground measurements were made at the winter wheat trial plots for two seasons: 2016–2017 and 2017–2018. Note: asterisk (*) indicates additional destructive sample analysis dates.
2.1.3. Destructive Sampling and Post-Processing
Destructive sampling—covering the range of N applications—was carried out at five of the wheat plots (Figure 1) on four dates (17 April, 25 May, 20 June and 4 July) during the 2018 season. Destructive sample analysis included direct leaf area measurements and the analysis of the leaf C:N ratio, used to derive linear N dilution functions that were incorporated into DALEC-Crop (see details in Section 2.2.2).
The destructive sampling routine entailed randomly placing a 0.25 m2 quadrat within the sampled plots and removing all the enclosed above-ground vegetation. The leaves were separated from the sampled vegetation and leaf area was measured using a Li-3100C leaf area meter (Li-Cor, Lincoln, NE, USA). The destructively measured LAI was then used to correct biases in the non-destructive LAI estimates (i.e., SunScan data) as detailed in Revill et al. [11]. The leaf N concentration was estimated by, first, drying and milling the samples. The samples were then weighed and analysed for percentage C and N content using a Flash 2000 elemental analyzer (Thermo Fisher Scientific, Waltham, MA, USA).
2.2. Description of DALEC-Crop
We describe the DALEC-Crop model structure used in this analysis, followed by the inclusion of an N dilution function used to simulate leaf N dynamics. We further detail the integration of DALEC-Crop within a MDF framework for calibrating the model parameters based on observations.
2.2.1. Model Overview
DALEC-Crop is a C mass-balance model consisting of C pools/stores that are linked by allocation fluxes (i.e., rate of C allocated to plant tissues) (Figure 2). The model includes a winter wheat C allocation look-up table that defines the fraction of C allocated to the plant organs (foliage, stem, storage, and root) based on empirical observations in Penning de Vries et al. [39]. These allocation fractions, which are interpolated within DALEC-Crop to match the model’s daily time-steps, are assigned according to the simulated developmental stage (DS)—ranging from −1 (sowing) to 2 (maturity). The DS is calculated as a function of the key winter wheat developmental responses: temperature, photoperiod and vernalization (until emergence) [24,40].
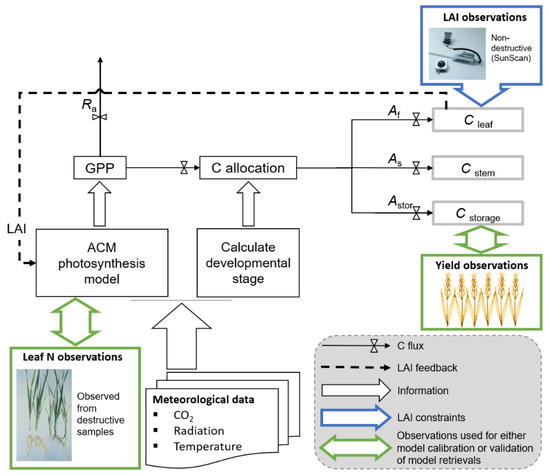
Figure 2.
DALEC-Crop model structure relevant to canopy development and yield. Daily estimates of gross primary productivity (GPP) are determined by the Aggregated Canopy Model (ACM)—a function combining inputs of leaf area index (LAI), climate and leaf nitrogen (N). Where leaf N can be provided based on destructive samples or can be inferred based on LAI observations. After a fractional loss of carbon (C) through autotrophic respiration (Ra), remaining C allocation is applied as a function of crop developmental stage—calculated from daily accumulations of effective temperature, photoperiod and vernalization (until emergence). According to the calculated allocation (A) fraction, C is allocated to C pools (including leaf, stem, and storage). Allocated C is lost from the pools either through harvest exports or root litter. DALEC-Crop parameters are calibrated based on the comparison between modelled and observed leaf area index (LAI) values.
The Aggregated Canopy Model (ACM) [41] provides DALEC-Crop with estimates of gross primary productivity (GPP) using the atmospheric carbon dioxide (CO2; μ mol−1) concentration and daily inputs of short-wave radiation (MJ m−2 d−1), minimum and maximum temperature (°C), leaf N and LAI (m2 m−2). The meteorological station provided the temperature and radiation inputs. Since no observations of atmospheric CO2 existed at the study site, we used a fixed value of 407 ppm, which approximated that of the global mean CO2 during the study period. To derive GPP from these drivers, ACM comprises of a series of simple equations calibrated to reproduce the daily photosynthesis estimates of the more detailed Soil-Plant-Atmosphere Crop model (SPA-Crop) [24], which simulates leaf-level processes at half-hourly time-steps. Further research in Revill et al. [42] has demonstrated the successful calibration of ACM across multiple European wheat sites when compared to daily eddy-covariance C flux data.
2.2.2. Nitrogen Dilution Function
To account for and simulate variable leaf N across the experimental treatments, we applied developments to DALEC-Crop for N dilution. This N dilution function was based on the analysis of destructive leaf N data which showed that leaf N per leaf area (LNA; g N m−2 leaf area) decreased with an increase in mass of leaf C per area (g m−2). A linear fit between the LNA and leaf C per ground area data indicated that the slope was similar across all five N treatments with the intercept coefficient increasing with treatment level from 0 to 200 kg N ha−1 (Figure 3).
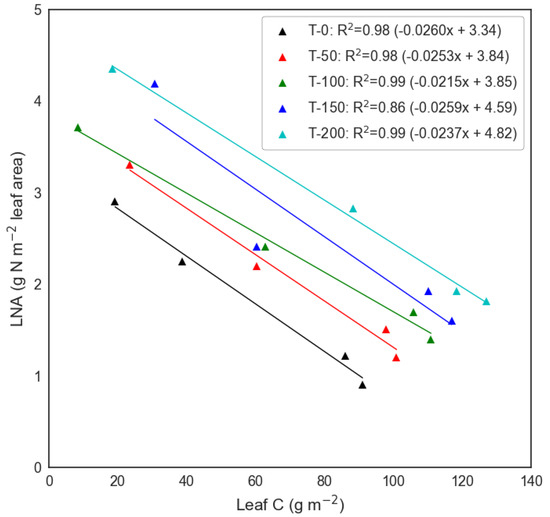
Figure 3.
Analysis of leaf nitrogen per leaf area (LNA) against C leaf (leaf C per ground area) based on destructive sample analysis at each of the N treatment plots (T−0 to T−200 kg N ha−1) during the 2018 wheat growing season. Derived linear regression coefficients were used within the DALEC-Crop model to calculate LNA. Note: Each LNA—Leaf C point is derived from the mean of two replicated destructive samples.
Using leaf C per ground area (Cleaf) modelled by DALEC-Crop, the slope and intercept coefficients can generate LNA estimates throughout the growing season for a given N treatment. The LNA is used in an ACM equation that determines the leaf N- and temperature-limited rate of photosynthesis (PNT; g C m−2):
where PNT is derived from LAI, LNA, photosynthetic nitrogen use efficiency (PNUE; gC gN−1) and an exponential temperature function.
PNT = LAI × LNA × PNUE,
2.2.3. Model-Data Fusion Approach
DALEC-Crop, including ACM, was integrated within the CARDAMOM MDF system [43] that used Bayesian inference to approximate the joint distribution of the model parameters, evaluated in a series of experiments (see details in Section 2.3). In accordance with Bayes’ theorem, this approximation can be expressed as:
where c represents the LAI observation data, x are the model parameters, p(x|c) is the posterior parameter distribution, p(c|x) is the likelihood of x given c and p(x) is the prior distribution of parameters [44].
P(x|c) α P(c|x) × P(x),
Sampling from the prior distribution of model parameters was achieved using the Markov Chain Monte Carlo (MCMC) Metropolis-Hastings (MH) algorithm, which is used for sampling from a probability distribution [29,42]. A Markov Chain consisting of a sequence of samples of x is generated by the MH algorithm. Each sample of x is either accepted or rejected after comparing the corresponding likelihood to the previously accepted value of x, in accordance with an acceptance ratio (A):
where x′ is the newly sampled parameter vector and ƒ is a function proportional to P(x|c). To be proportional to the likelihood, ƒ(x) (and ƒ(x′)) should reflect the degree of agreement between the resulting modelled LAI and the corresponding observed LAI, weighted for observational uncertainty. The outcome from CARDAMOM is an ensemble of acceptable parameter sets that define the parameter joint distribution and parameter uncertainty.
We further refine the accepted parameter hypervolume generated through the DALEC-Crop MDF approach by imposing a series of ecological and dynamic constraints (EDCs). For each iteration of the MDF, the EDCs check that the sampled parameter sets used to the generate model outputs are broadly within the expected ecophysiology based on our understanding of wheat growth dynamics. Past research has demonstrated the successful use of EDCs when calibrating terrestrial ecosystem models [43,45]. We applied four EDCs, which principally constrained estimates related to the C pools and fluxes (Table 2).
Table 2.
DALEC-Crop Ecological and Dynamic Constraints (EDCs).
2.3. Calibration and Experimental Protocol
To address our key research questions, using the CARDAMOM framework we performed an initial analysis and evaluated a multi-treatment calibration of DALEC-Crop. This multi-treatment calibration was then used to carry out three successive model experiments. These experiments were designed to determine the accuracy of wheat N retrievals (Experiment 1), validate and identify the key inputs driving yield variability (Experiment 2) and evaluate yield predictions when constraining the model during growth stages when N fertilizers are typically applied (Experiment 3).
2.3.1. Multi-Treatment Analysis and Calibration
A treatment-by-treatment calibration of DALEC-Crop was first carried out using the CARDAMOM MDF framework to determine the distributions and sensitivity of parameters across the range of treatments (0 to 200 kg N ha−1). The goal of this analysis was to validate the hypothesized relationships between climate, leaf N, LAI and yield in DALEC-Crop. Each treatment calibration was performed using data from both seasons (i.e., multi-season calibration). From the 50 plots included in each season, calibration plots were identified by randomly selecting three out of the five replicates for each treatment and wheat variety, whereas the remaining two plots were used for validation. Thus, 12 plots were used for calibration and 8 plots were used for validation, per treatment. A key output of this experiment was to test whether retrieved parameter ensembles for different N treatments were similar or showed substantive differences in processes, such as phenology, between treatments (see Supplementary Material, Figure S1).
A total of 25 of the DALEC-Crop parameters determining C availability and phenology were calibrated for each treatment (see Supplementary Material, Table S1). This calibration was based on optimizing the selection of these parameters such that the DALEC-Crop mean LAI and yield estimates were within a 12% uncertainty of the observed at each of the corresponding calibration plots. This uncertainty for LAI was previously quantified in Revill et al. [11] and, in this analysis, we assume this characterized uncertainty to be the same as that of the yield observations. Throughout this calibration the LNA used in the ACM PNUE equation (3) was calculated by providing DALEC-Crop with the slope and intercept of the linear N dilution fit derived from the destructive sample data for a given treatment (Figure 3).
Using the same experimental plots for validation and calibration as those of the per-treatment analysis, we also performed a cross-treatment calibration of the 25 DALEC-Crop parameters. Based on the simulation of wheat yields, the goal of this multi-treatment approach was to determine if a single calibration of DALEC-Crop was valid across the gradient of N applications. The posterior distributions in the parameters were then sampled and used in Experiments 1–3.
We evaluated the performance of the DALEC-Crop cross-treatment calibration using LAI and yield observations at the validation plots. Metrics used in the evaluation included the coefficient of determination (R2) and the normalized root-mean-square-error (NRMSE):
where Ei and Oi are the modelled and observed values, respectively, and n is the number of modelled and observed comparisons.
2.3.2. Experiment 1: Leaf N Retrieval
This experiment tested the capability of CARDAMOM to retrieve a valid DALEC-Crop calibration of LNA across the fertilizer treatments. The goal was to determine whether the leaf N status of an individual treatment could be inferred accurately based on LAI and climate time-series, and without any information on the fertilizer treatment applied and yield. The posterior distribution of each of the 25 parameters inferred during the initial cross-treatment calibration was sampled based on the 99th-percentile of the most likely parameter sets (see Supplementary Material, Figure S2) and used as the prior distribution for this experiment. Using the LAI observations at the destructively sampled plots, the MDF framework was then applied to calibrate just two parameters: the slope and intercept coefficients for the linear fit used to estimate LNA as a function of the DALEC-Crop leaf C pool (Figure 3).
2.3.3. Experiment 2: Linking Model Inputs to Yield Estimation Accuracy
The core goal of this experiment is to test whether crop N status and yield variation across the experimental treatments in both years can be retrieved using only time-series observations of LAI from each plot and the growing season meteorology. Because crop N status data were not collected across all experimental sites, the model testing was against plot yields, which are strongly determined by N fertilization. The key information for LNA retrieval and yield estimation was a combination of LAI and climate time-series, along with the hypotheses represented in the DALEC-Crop model, following the approach in Experiment 1.
In this experiment we also test the relative information content of LAI and climate data for providing robust LNA and yield retrievals. We explored the yield estimation accuracy when interchanging the annual meteorological data and LAI observations between the two seasons used to drive and constrain DALEC-Crop during the calibration of the slope and intercept coefficients of the LNA fit. Using the sampled cross-treatment parameter calibration as prior distributions, two sub-experiments were carried out involving inter-changing the meteorological driving data (Experiment 2MET) and the LAI observations (Experiment 2OBS) between the two seasons. For both seasons, the accuracy of the yield estimates generated from these two experiments was evaluated based on the validation plots.
2.3.4. Experiment 3: Synthetic EO Data Constraint
The goal of this experiment was to test whether the MDF approach tested above could provide robust estimates of crop N status during a critical management period, allowing effective intervention. We evaluated the performance of the multi-treatment parameter calibration for estimating yield when constraining DALEC-Crop with synthetic EO-derived LAI observations during the recommended period of N fertilization—coinciding with the middle of the tillering to stem elongation growth stages (i.e., GS 25–35) [46]. We produced a synthetic EO LAI times-series by, first, generating daily DALEC-Crop LAI estimates during this N application period. This DALEC-Crop LAI time-series was resampled from a daily to a 5-day interval to matches the potential revisit time of the European Space Agency’s (ESA) Sentinel-2 dual-satellite constellation. We further added random noise to this synthetic time-series to match the expected uncertainty of Sentinel-2 wheat LAI retrievals, which has previously been quantified as having an NRMSE of 17% [15]. The resultant time-series comprised of 7 (first season) and 5 (second season) synthetic observations with a 5-day temporal resolution. This time-series was then used to calibrate the slope and intercept coefficients for the LNA linear fit and the model yield predictive performance was evaluated for all plots.
3. Results
3.1. DALEC-Crop Analysis and Calibration
Based on an initial per-treatment calibration, the posterior distributions of the retrieved DALEC-Crop parameters were broadly similar across the range of N applications (see Supplementary Material, Figure S1). A notable exception to this parameter consistency, however, was shown for the product of the LNA and PNUE parameters used in the leaf N- and temperature-limited rate of photosynthesis equation (3). The LNA·PNUE product shows a distinct distribution for each of the treatments, consistent with the variation in applied N fertilizer.
The DALEC-Crop cross-treatment and multi-year calibrations for each N treatment had a high agreement with all the LAI observations—the mean R2 was 0.78 and mean NRMSE was 26% (Figure 4 and Table 3). Most of the observations were within the model uncertainty. The later LAI observations in the first season (i.e., 26 June and 10 July 2017) were generally not as well captured when compared to the earlier measurements, this was particularly the case for the higher treatments (i.e., >100 kg N ha−1). For all treatments, the performance of the calibration for the simulation of LAI in the first season (mean R2 = 0.73 and NRMSE = 27%) was slightly lower than that of the second season (mean R2 = 0.83 and NRMSE = 25%).
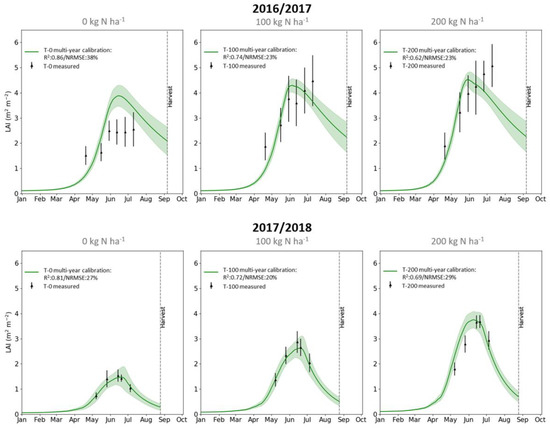
Figure 4.
Time-series validation plots comparing DALEC-Crop LAI estimates for the cross-treatment and multi-year parameter calibrations compared to observations (black error bars) for the 2016–2017 (top row) and 2017–2018 (bottom row) winter wheat growing seasons. Plots shown for the 0 kg N ha−1 (T-0; left column), 100 kg N ha−1 (T-100; middle column) and 200 kg N ha−1 (T-200; right column) fertilizer treatments. Standard deviation of the LAI values is shown for the observations and modelled estimates (green shading).
Table 3.
Summary validation statistics comparing DALEC-Crop LAI estimates for each nitrogen (N) fertilizer treatment derived from the multi-year single model calibration for the 2016–2017 and 2017–2018 growing seasons.
When evaluating DALEC-Crop under the constraints of LAI observations at the validation plots, the multi-year model calibration had a high accuracy when estimating yields at these plots for both seasons—the mean NRMSE was 11% (Figure 5). The model calibration for the first season was slightly more accurate than that of the second season (mean NRMSE = 11%).
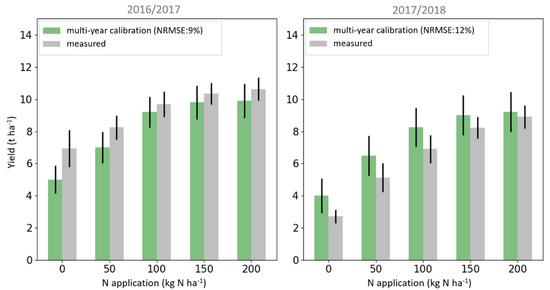
Figure 5.
Bar plots of the DALEC-Crop ensemble mean yield estimates for the validation trial plots derived from the multi-year model calibrations (green) compared to the observations (grey) covering the range of N treatments for the 2016–2017 and 2017–2018 growing seasons. Error bars represent the standard deviation of the distribution of modelled yield estimates and measurements.
3.2. Multi-Temporal LNA Retrieval across Fertilisation Treatments
The CARDAMOM analysis for the five destructive plots successfully retrieved valid LNA values across the fertiliser treatments through the assimilation of LAI and climate data. The outcome of the assimilation process was the calibration of two parameters—intercept and slope—used to infer leaf N (see Supplementary Material, Table S1). The comparison to the destructive sample data collected in the second growing season was excellent, with an R2 of 0.98 and a NRMSE of 6% (Experiment 1; Figure 6). Using the two parameters retrieved, we can reconstruct the estimated temporal dilution of leaf N for each experiment. The retrieved slope values of the N dilution varied only slightly from −0.0239 to −0.0258 whereas the calibrated intercept values ranged from 3.3 to 4.9 g N m−2 leaf area. From the time-series of retrievals, the model could distinguish between the different treatment levels recorded for most of the destructive sampling dates carried out from April till July.
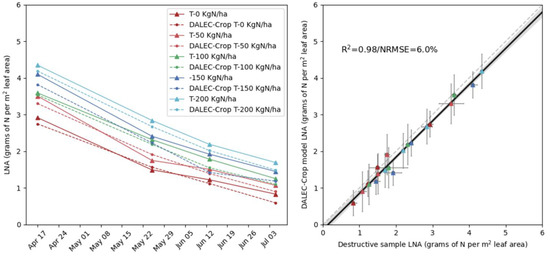
Figure 6.
Experiment 1: Evaluating DALEC-Crop for the multi-temporal retrieval of leaf nitrogen per area (LNA) compared to LNA estimated from the 5 destructively sampled plots. Including a time-series comparison of model estimates (triangles) on dates corresponding to destructive LNA observations (dots) (left panel), and the linear-fit between all modelled and measured LNA values (solid black line), along with 1:1 line (grey dashed line) (right panel). Note: measured-model plot x-axis uncertainty error bars represent the difference between the high and low values from two replicated destructive samples, whereas the y-axis uncertainty is based on the standard deviation of the model estimates.
3.3. Validating Yield Retrievals Based on Leaf N Estimates Derived from LAI
We repeated the approach in Experiment 1 across all trial plots for both seasons (i.e., including those without destructive sampling and determination of N status). This time, however, we tested the reliability of yield predictions generated from assimilating plot-level growing season LAI and meteorology time-series only. This experiment, thus, was to determine if yield variation could be identified from these simple growing season observations. Our results showed that the assimilation process was able to resolve the variability in N treatment effects on yield across the range of applications (Experiment 1; Figure 7) and for both years using a generic model calibration that was adjusted for each plot using local data only to estimate the two N dilution parameters.
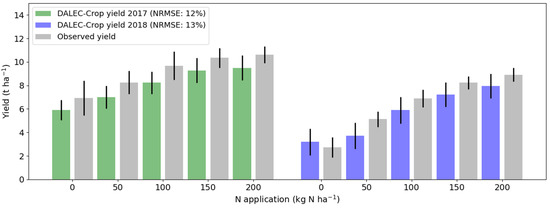
Figure 7.
Experiment 1: Evaluating DALEC-Crop for the retrieval of wheat yield when constraining the model based on LAI observations. Experiment applied using the multi-year model calibration applied at all trial plots for the 2016–2017 (green) and 2017–2018 (blue) growing seasons. Error bars represent the standard deviation of the distribution of modelled yield values for each treatment. Note: NRMSE is calculated from independent yield data.
For the first growing season the mean NRMSE of yield prediction was 12% and for the second season it was 13%. This model performance for yield was, therefore, comparable to the results in the model calibration stage, during which leaf N information was provided (Figure 5).
3.4. Estimating Yield Variability from LAI and Meteorology Data through Inference of Crop N Status
In investigating the sensitivity of LNA retrieval to climate and LAI data, we interchanged the meteorological data and LAI observational inputs between the two seasons and repeated the yield retrieval. The accuracy of the DALEC-Crop yield estimates was more dependent on the time-series of LAI in comparison to that of the meteorological data (Experiment 2; see Supplementary Material, Figure S3). Specifically, when interchanging the meteorological driving data (i.e., Experiment 2MET) the mean NRMSE between the recorded and modelled yield was increased from 10 to 14%. When interchanging the LAI observations (i.e., Experiment 2LAI), however, the error inflation was greater with the mean NRMSE increasing from 10 to 22%.
3.5. Yield Estimation Accuracy during the N Application Growth Stages
This experiment used synthetic data to test whether crop N status and yield could be robustly estimated using observations of LAI during critical growth stages for crop management. The results show that yield estimates from constraining DALEC-Crop with LAI observations during the period of recommended N fertilization had a NRMSE of 14% (Experiment 3; Figure 8). From a linear fit the model had a high agreement with the observed yield (R2 = 0.97). Based on the yield residual error (i.e., measured—modelled), which ranged from −0.52 to 1.68 t ha−1, the model increasingly underestimated yield when the observed values were greater than 6.5 t ha−1. However, the overall trend in yield with N additions, and differences between years, were very well reproduced.
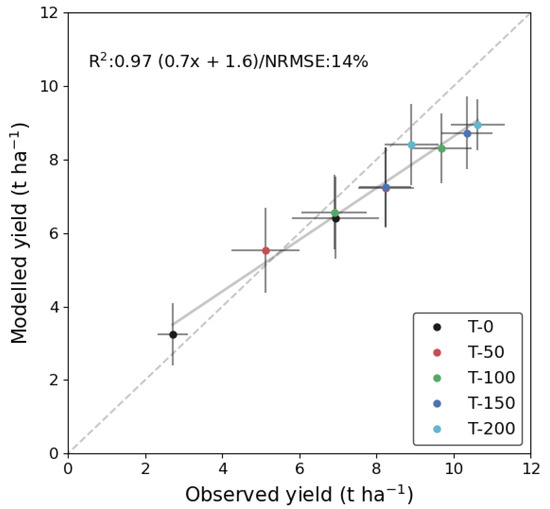
Figure 8.
Experiment 3: Comparing DALEC-Crop yield from data assimilation of LAI data to observations for each treatment. The constraint used the multi-year calibration for the 2016–2017 and 2017–2018 seasons with a synthetic EO LAI time-series during the growth stages corresponding to recommended N fertilizer applications in April and May—from the middle of the tillering to stem elongation growth stages (i.e., GS 25–35).
4. Discussion
4.1. Simulating LAI and Yield Responses to N
Our results from the model cross-treatment calibration show that wheat LAI and yield observations can be used to produce robust calibrations of DALEC-Crop for a broad range of N fertiliser application rates. The posterior parameter distributions from the MDF showed that process rates were similar across fertiliser treatments. These results confirmed our hypothesis that fundamental plant processes were unchanged by N treatments. The differences in canopy development and yield could be shown to be explicable purely by the differences in leaf N between treatments. These leaf N differences generated variability in productivity that were consistent with growth and yield differences. Validation statistics for independent plots were robust and provide evidence that the model is generic. We conclude that the process representation in the DALEC-Crop model linking leaf N to photosynthesis, allocation and yield, and the feedbacks between these processes and plant states, provides a robust simulation. We also concluded that the parameter distributions produced by the treatment calibrations could be merged into a single posterior parameter set that could be applied in the next set of experiments. The key remaining unknowns for calibrating DALEC-Crop are the initial LNA and its dilution rate at the relevant scale (Figure 3). Our initial tests suggest that if these two parameters can be constrained by observational data, then we can expect robust calibrations with yield prediction errors comparable to those from the model calibration phase (Figure 5).
Our results can be compared to an inter-comparison of crop models applied across N fertilization rates similar to our research [31]. In contrast to the intermediate complexity DALEC-Crop model, all models evaluated in this past research incorporated a simulation of the major components of N dynamics, including N demand, uptake and stress. From independently validating the yield estimates based on observations, however, Salo et al. [31] reported errors >1.5 t ha−1 for most of the models. Furthermore, most models poorly simulated the yield responses to N with the estimated yield generally levelling-off when the application rate increased beyond 120 kg N ha−1. In our research, however, we constrained the comparatively less complex DALEC-Crop model using LAI observations. This MDF approach resolved the mean yield to within 1 t ha−1 of the observations, which themselves had a mean standard deviation of 0.75 t ha−1, without any significant bias to N application rate.
In addition to LAI, our approach involved calibrating DALEC-Crop based on the observed yield at the calibration trial plots. Caldararu et al. [47] demonstrated that models can be fitted based on yield data alone, however, this was achieved at the expense of a poor simulation in GPP. Models can, thus, be successfully calibrated for yield prediction at the expense of a realistic representation of cropland ecosystem C dynamics. Our model calibration approach addresses this issue by ensuring that the parameterisation leads to a simulation of both LAI and yield that are consistent with observations. Throughout the calibration we also imposed ecological and dynamic constraints, which principally prevented the model from sampling parameters that generated unrealistic estimates of LAI and GPP.
4.2. Leaf Nitrogen Dynamics—Constrained Estimates from LAI Observations
The CARDAMOM approach was able to produce robust estimates of crop N status based on independent data. A constrained calibration of DALEC-Crop with LAI observations had a high accuracy for the retrieval of leaf N estimates across the treatment range (mean R2 = 0.98 and NRMSE = 6%). These modelled leaf N estimates were evaluated against data from a limited number of destructively sampled plots that were available for the second season only. The sensitivity of the calibration process was good enough to clearly rank the plots according to the in situ LNA estimates, which in turn varied according to N fertilization and differed between the two seasons. This variability between the seasons is likely due to the underlying differences in soil N supply. The leaf N data in these tests were also used to derive the N dilution functions that were part of the DALEC-Crop calibration. The robustness of this retrieval calibration should be tested using similar experimental wheat leaf N datasets from additional sites and growing seasons.
4.3. Impact of Model Inputs on Yield
For a broader test of the CARDAMOM retrieval of crop N status and yield potential, we showed that robust estimates of crop yield variation across years and treatments was achieved through the assimilation of LAI time-series, climate observations, and calibration of two N-status parameters in the model. The resulting errors on yield prediction were comparable to the yield prediction errors during the DALEC-Crop calibration phase, however the observed yield was used in the calibration. Thus, the MDF retrieval to predict yield is as effective using just LAI time-series and climate data (Experiment 3) as the estimates produced in Experiment 1 which had extra information on local fertilizer treatment, and assimilation of yield data.
From inter-changing the meteorological and LAI inputs between the two seasons the DALEC-Crop yield prediction accuracy was more sensitive to the LAI data when compared to the meteorological drivers. Because agricultural production is strongly influenced by climate [48] this result was unexpected. When applying crop models across large areas, uncertainties in drivers (including temperature and radiation) often arise from the interpolation of point measurements [49]. Although limited to two seasons, our analysis suggests that the assimilation of temporally infrequent LAI observations can correct for uncertainties in meteorological data, providing high information content. Additionally, from comparing crop model outputs generated from different gridded meteorological datasets, research in Parkes et al. [50] demonstrated large uncertainties in estimated crop yield responses. The potential of assimilating LAI to reduce model errors due to uncertainties in meteorological drivers would, therefore, also be of value when using gridded meteorological products.
4.4. Expected Yield Prediction Accuracy during the Nitrogen Application Period
A high yield prediction accuracy (mean NRMSE was 14%) was achieved when assimilating a synthetic ESA Sentinel-2 LAI time-series during the recommended growth stages for N fertilization only. Although noise was added to this synthetic time-series to characterise the Sentinel-2 LAI retrieval uncertainty, the assumption of clear-sky observations available every five days was perhaps optimistic due to the frequent cloud cover of the study region. Depending on the crop growth stage, the recommended winter wheat N management dates for the United Kingdom are often for several weeks between March and April [46]. We would, therefore, anticipate some useable optical EO data within this period. The number of LAI observations can also be supplemented with data from Unmanned Aerial Vehicle platforms [15] or exploring the information content of Radar data [51]. Nonetheless, our results demonstrate that if LAI observations were available during this management period, around five months in advance of harvest, then CARDAMOM-DALEC-Crop MDF could generate timely yield forecasts that could be used to adjust N management. When supporting such management decisions, the lack of information on future weather conditions is, however, a significant source of uncertainty in model yield forecasts that needs to be further explored [5].
4.5. Research Implications and Recommendations
Crop models providing a detailed representation of the N cycle, including those evaluated in Salo et al. [31], are typically too complex to be applied within a MDF approach that requires a large ensemble of model runs [28]. Our use of the intermediate complexity DALEC-Crop model and using CARDAMOM to calibrate just two N dilution function parameters represents a considerably less complex and, thus, faster means of optimising parameters based on observations. Furthermore, CARDAMOM efficiently generates a large ensemble of model estimates that allows for a robust uncertainty characterisation of the N and yield estimates.
Our DALEC-Crop calibration could potentially be applied on an operational basis to generate leaf N estimates and yield predictions at the field and sub-field scale. There are studies that have estimated wheat N content from satellite EO data [52,53]. Inferring leaf N content directly from EO data is complicated by a typically high correlation between LAI and canopy chlorophyll content. Furthermore, solely relying on EO data can lead to gaps in the estimation time-series due to cloud cover [54]. The use of DALEC-Crop, however, can generate estimates of daily N content based on meteorological inputs, which could complement existing precision agricultural technologies. Modern technology linked to precision fertiliser spreaders have the capacity to enable farmers to vary applications to fine resolutions of up to 10 × 10 m2 [55]. Combining our modelling framework with data available from current EO sensors with spatial resolutions finer than 20 m data, including Sentinel-2, could therefore support such precision agricultural management operations.
The empirical N dilution function implemented in DALEC-Crop involved estimating leaf N that, through feedback with the model’s photosynthesis sub-model (ACM), was effective at characterising the variability in LAI, yield and leaf N across the treatments. Generally, as leaf N increases so too does the assimilation rate of CO2 [4]. This enhancement in photosynthesis in response to leaf N, however, can be reduced by water stress due to a decrease in stomatal conductance [56]. Our implementation of DALEC-Crop did not account for water stress nor were there any moisture stress occurrences reported during the two growing seasons. Future climate projections suggest droughts will be more frequent in western Europe [57]. We would, therefore, recommend the use of testing ACM and DALEC predictions of soil moisture-growth interactions [58] when spatially and temporally upscaling our modelling approach.
5. Conclusions
In terms of inputs required and computational efficiency, the application of intermediate complexity models of crop C and N dynamics under the constraints of observations is favorable when upscaling the models from local to regional extents. This study has demonstrated that an intermediate complexity model, DALEC-Crop, can produce reliable estimates of leaf N content and yields using growing season data on climate and LAI across a range of N application rates for multiple winter wheat seasons. Further validation of the DALEC-Crop modelling framework using experimental data from additional wheat sites and seasons is a critical next step for testing application.
The CARDAMOM MDF system was able to extract valuable information from LAI data that improved estimates of crop N status and yield. Spatial and temporal variation in yield is driven by climate, soil and management variations, and our testing showed that combining a process model with time-series of weather and LAI data could diagnose their combined effects to explain yield variation robustly. The growing availability of high resolution (10 m) and frequent Earth observations of LAI (sub-weekly depending on cloud conditions) means that, when used in conjunction with our approach, there is a potential to map wheat N status and forecast yields during the growing season. We showed that CARDAMOM could generate reliable estimates of crop yield even during early growth stages when N fertilizer is typically applied, providing clear-sky observations are available during this period. Our analysis demonstrates a scalable proof-of-concept MDF approach for the timely prediction of yield responses to N management.
Supplementary Materials
The following are available online at https://www.mdpi.com/2073-4395/11/2/314/s1, Table S1: The DALEC-Crop and Aggregated Canopy Model (ACM) parameters, Figure S1: Probability density function of parameters for DALEC-Crop from calibrating on a treatment-by-treatment basis, Figure S2: Probability density function of the retrieved parameters for DALEC-Crop from an aggregated model calibration, Figure S3: Experiment 2: Yield estimated from experiments involving the multi-year DALEC-Crop calibration to determine the influence of model inputs between the two seasons.
Author Contributions
Conceptualization, A.R. and M.W.; methodology, A.R., V.M., A.F. and M.W.; validation, A.R.; formal analysis, A.R.; investigation, A.R.; resources, A.R., M.W. and S.H.; data curation, A.R. and A.F.; writing—original draft preparation, A.R. and M.W.; writing—review and editing, A.R., V.M., S.H., R.R. and M.W.; project administration, A.M. and M.W.; funding acquisition, A.M. and M.W. All authors have read and agreed to the published version of the manuscript.
Funding
This research was funded by the joint Biotechnology and Biological Sciences Research Council (BBSRC) and National Environment Research Council (NERC) Sustainable Agricultural Research and Innovation Club (SARIC) initiative (grant numbers: BB/P004628/1 and BB/P004458/1), NERC grant NE/P018920/1, the Royal Society and NCEO.
Data Availability Statement
Datasets supporting reported results can be found within the ATEC (Advanced Technologies for Efficient Crop management) collection on Edinburgh DataShare publicly available depository (datashare.is.ed.ac.uk/handle/10283/3697).
Acknowledgments
We acknowledge the technical support from Colin Crawford at Scotland’s Rural College (SRUC).
Conflicts of Interest
The authors declare no conflict of interest.
References
- Zhao, B.; Ata-Ul-Karim, S.T.; Duan, A.; Liu, Z.; Wang, X.; Xiao, J.; Liu, Z.; Qin, A.; Ning, D.; Zhang, W.; et al. Determination of critical nitrogen concentration and dilution curve based on leaf area index for summer maize. Field Crop. Res. 2018, 228, 195–203. [Google Scholar] [CrossRef]
- Tilman, D.; Balzer, C.; Hill, J.; Befort, B.L. Global food demand and the sustainable intensification of agriculture. Proc. Natl. Acad. Sci. USA 2011, 108, 20260–20264. [Google Scholar] [CrossRef]
- Gerten, D.; Heck, V.; Jägermeyr, J.; Bodirsky, B.; Fetzer, I.; Jalava, M.; Kummu, M.; Lucht, W.; Rockström, J.; Schaphoff, S.; et al. Feeding ten billion people is possible within four terrestrial planetary boundaries. Nat. Sustain. 2020, 3, 200–208. [Google Scholar] [CrossRef]
- Lemaire, G.; Jeuffroy, M.-H.; Gastal, F. Diagnosis tool for plant and crop N status in vegetative stage. Eur. J. Agron. 2008, 28, 614–624. [Google Scholar] [CrossRef]
- Dumont, B.; Basso, B.; Bodson, B.; Destain, J.-P.; Destain, M.-F. Climatic risk assessment to improve nitrogen fertilisation recommendations: A strategic crop model-based approach. Eur. J. Agron. 2015, 65, 10–17. [Google Scholar] [CrossRef][Green Version]
- Rockström, J.; Steffen, W.; Noone, K.; Persson, Å.; Chapin, F.S.; Lambin, E.F.; Lenton, T.M.; Scheffer, M.; Folke, C.; Schellnhuber, H.J.; et al. A safe operating space for humanity. Nature 2009, 461, 472–475. [Google Scholar] [CrossRef] [PubMed]
- Grace, P.R.; Robertson, G.P.; Millar, N.; Colunga-Garcia, M.; Basso, B.; Gage, S.H.; Hoben, J. The contribution of maize cropping in the Midwest USA to global warming: A regional estimate. Agric. Syst. 2011, 104, 292–296. [Google Scholar] [CrossRef]
- Olin, S.; Schurgers, G.; Lindeskog, M.; Wårlind, D.; Smith, B.; Bodin, P.; Holmér, J.; Arneth, A. Modelling the response of yields and tissue C: N to changes in atmospheric CO2 and N management in the main wheat regions of western Europe. Biogeosciences 2015, 12, 2489–2515. [Google Scholar] [CrossRef]
- Greenwood, D.J.; Neeteson, J.J.; Draycott, A. Quantitative relationships for the dependence of growth rate of arable crops on their nitrogen content, dry weight and aerial environment. Plant Soil 1986, 91, 281–301. [Google Scholar] [CrossRef]
- Yue, S.; Meng, Q.; Zhao, R.; Li, F.; Chen, X.; Zhang, F.; Cui, Z. Critical Nitrogen Dilution Curve for Optimizing Nitrogen Management of Winter Wheat Production in the North China Plain. Agron. J. 2012, 104, 523–529. [Google Scholar] [CrossRef]
- Revill, A.; Florence, A.; Mac Arthur, A.; Hoad, S.P.; Rees, R.; Williams, M. The Value of Sentinel-2 Spectral Bands for the Assessment of Winter Wheat Growth and Development. Remote Sens. 2019, 11, 2050. [Google Scholar] [CrossRef]
- Clevers, J.G.P.W.; Kooistra, L.; Brande, M.M.M.V.D. Using Sentinel-2 Data for Retrieving LAI and Leaf and Canopy Chlorophyll Content of a Potato Crop. Remote Sens. 2017, 9, 405. [Google Scholar] [CrossRef]
- Cammarano, D.; Fitzgerald, G.J.; Casa, R.; Basso, B. Assessing the Robustness of Vegetation Indices to Estimate Wheat N in Mediterranean Environments. Remote Sens. 2014, 6, 2827–2844. [Google Scholar] [CrossRef]
- Zhao, Y.; Chen, S.; Shen, S. Assimilating remote sensing information with crop model using Ensemble Kalman Filter for improving LAI monitoring and yield estimation. Ecol. Model. 2013, 270, 30–42. [Google Scholar] [CrossRef]
- Revill, A.; Florence, A.; Mac Arthur, A.; Hoad, S.P.; Rees, R.; Williams, M. Quantifying Uncertainty and Bridging the Scaling Gap in the Retrieval of Leaf Area Index by Coupling Sentinel-2 and UAV Observations. Remote Sens. 2020, 12, 1843. [Google Scholar] [CrossRef]
- Becker-Reshef, I.; Vermote, E.; Lindeman, M.; Justice, C. A generalized regression-based model for forecasting winter wheat yields in Kansas and Ukraine using MODIS data. Remote Sens. Environ. 2010, 114, 1312–1323. [Google Scholar] [CrossRef]
- Sakamoto, T.; Gitelson, A.A.; Arkebauer, T.J. MODIS-based corn grain yield estimation model incorporating crop phenology information. Remote Sens. Environ. 2013, 131, 215–231. [Google Scholar] [CrossRef]
- Lashkari, A.; Salehnia, N.; Asadi, S.; Paymard, P.; Zare, H.; Bannayan, M. Evaluation of different gridded rainfall datasets for rainfed wheat yield prediction in an arid environment. Int. J. Biometeorol. 2018, 62, 1543–1556. [Google Scholar] [CrossRef] [PubMed]
- Boote, K.J.; Jones, J.W.; White, J.W.; Asseng, S.; Lizaso, J.I. Putting mechanisms into crop production models. Plant Cell Environ. 2013, 36, 1658–1672. [Google Scholar] [CrossRef]
- Basso, B.; Ritchie, J.T.; Cammarano, D.; Sartori, L. A strategic and tactical management approach to select optimal N fertilizer rates for wheat in a spatially variable field. Eur. J. Agron. 2011, 35, 215–222. [Google Scholar] [CrossRef]
- Ewert, F.; Van Ittersum, M.K.; Heckelei, T.; Therond, O.; Bezlepkina, I.; Andersen, E. Scale changes and model linking methods for integrated assessment of agri-environmental systems. Agric. Ecosyst. Environ. 2011, 142, 6–17. [Google Scholar] [CrossRef]
- Phelan, D.C.; Harrison, M.T.; McLean, G.; Cox, H.; Pembleton, K.G.; Dean, G.J.; Parsons, D.; Richter, M.E.D.A.; Pengilley, G.; Hinton, S.J.; et al. Advancing a farmer decision support tool for agronomic decisions on rainfed and irrigated wheat cropping in Tasmania. Agric. Syst. 2018, 167, 113–124. [Google Scholar] [CrossRef]
- Asseng, S.; Ewert, F.; Rosenzweig, C.; Jones, J.W.; Hatfield, J.L.; Ruane, A.C.; Boote, K.J.; Thorburn, P.J.; Rotter, R.; Cammarano, D.; et al. Uncertainty in simulating wheat yields under climate change. Nat. Clim. Chang. 2013, 3, 827–832. [Google Scholar] [CrossRef]
- Sus, O.; Williams, M.; Bernhofer, C.; Béziat, P.; Buchmann, N.; Ceschia, E.; Doherty, R.; Eugster, W.; Grünwald, T.; Kutsch, W.; et al. A linked carbon cycle and crop developmental model: Description and evaluation against measurements of carbon fluxes and carbon stocks at several European agricultural sites. Agric. Ecosyst. Environ. 2010, 139, 402–418. [Google Scholar] [CrossRef]
- Di Paola, A.; Valentini, R.; Santini, M. An overview of available crop growth and yield models for studies and assessments in agriculture. J. Sci. Food Agric. 2016, 96, 709–714. [Google Scholar] [CrossRef]
- De Wit, A.; Boogaard, H.; Fumagalli, D.; Janssen, S.; Knapen, R.; Van Kraalingen, D.; Supit, I.; Van Der Wijngaart, R.; Van Diepen, K. 25 years of the WOFOST cropping systems model. Agric. Syst. 2019, 168, 154–167. [Google Scholar] [CrossRef]
- Keenan, T.F.; Davidson, E.; Moffat, A.M.; Munger, W.; Richardson, A.D. Using model-data fusion to interpret past trends, and quantify uncertainties in future projections, of terrestrial ecosystem carbon cycling. Glob. Chang. Biol. 2012, 18, 2555–2569. [Google Scholar] [CrossRef]
- Ziehn, T.; Scholze, M.; Knorr, W. On the capability of Monte Carlo and adjoint inversion techniques to derive posterior parameter uncertainties in terrestrial ecosystem models. Glob. Biogeochem. Cycles 2012, 26, 3025. [Google Scholar] [CrossRef]
- Fox, A.; Williams, M.; Richardson, A.D.; Cameron, D.; Gove, J.H.; Quaife, T.; Ricciuto, D.; Reichstein, M.; Tomelleri, E.; Trudinger, C.M.; et al. The REFLEX project: Comparing different algorithms and implementations for the inversion of a terrestrial ecosystem model against eddy covariance data. Agric. For. Meteorol. 2009, 149, 1597–1615. [Google Scholar] [CrossRef]
- Kuppel, S.; Peylin, P.; Chevallier, F.; Bacour, C.; Maignan, F.; Richardson, A.D. Constraining a global ecosystem model with multi-site eddy-covariance data. Biogeosci. Discuss. 2012, 9, 3317–3380. [Google Scholar] [CrossRef]
- Salo, T.J.; Palosuo, T.; Kersebaum, K.C.; Nendel, C.; Angulo, C.; Ewert, F.; Bindi, M.; Calanca, P.; Klein, T.W.; Moriondo, M.; et al. Comparing the performance of 11 crop simulation models in predicting yield response to nitrogen fertilization. J. Agric. Sci. 2016, 154, 1218–1240. [Google Scholar] [CrossRef]
- Huang, J.; Tian, L.; Liang, S.; Ma, H.; Becker-Reshef, I.; Huang, Y.; Su, W.; Zhang, X.; Zhu, D.; Wu, W. Improving winter wheat yield estimation by assimilation of the leaf area index from Landsat TM and MODIS data into the WOFOST model. Agric. For. Meteorol. 2015, 204, 106–121. [Google Scholar] [CrossRef]
- Ma, G.; Huang, J.; Wu, W.; Fan, J.; Zou, J.; Wu, S. Assimilation of MODIS-LAI into the WOFOST model for forecasting regional winter wheat yield. Math. Comput. Model. 2013, 58, 634–643. [Google Scholar] [CrossRef]
- Novelli, F.; Spiegel, A.; Sandén, T.; Vuolo, F. Assimilation of Sentinel-2 Leaf Area Index Data into a Physically-Based Crop Growth Model for Yield Estimation. Agronomy 2019, 9, 255. [Google Scholar] [CrossRef]
- Berrisford, P.; Dee, D.P.; Fielding, K.; Fuentes, M.; Kållberg, P.; Kobayashi, S.; Uppala, S.M. The ERA-Interim Archive; ECMWF: Reading, UK, 2009. [Google Scholar]
- Robinson, E.L.; Blyth, E.; Clark, D.B.; Comyn-Platt, E.; Finch, J.; Rudd, A.C. Climate Hydrology and Ecology Research Support System Meteorology Dataset for Great Britain (1961–2015), v1.2.; NERC Environmental Information Data Centre: Oxford, UK, 2016. [Google Scholar] [CrossRef]
- AHDB Recommended Lists for Cereals and Oilseeds 2017/18. 2017. Available online: https://www.yumpu.com/en/document/view/57001707/ahdb-recommended-lists-for-cereals-and-oilseeds-2017-18 (accessed on 25 November 2019).
- Zadoks, J.C.; Chang, T.T.; Konzak, C.F. A decimal code for the growth stages of cereals. Weed Res. 1974, 14, 415–421. [Google Scholar] [CrossRef]
- Penning de Vries, F.W.T.; Jansen, D.M.; ten Berge, H.F.M.; Bakema, A.H. Simulation of ecophysiological processes in several annual crops. In Simulation Monographs; Pudoc: Wageningen, The Netherlands, 1989; Volume 29. [Google Scholar]
- Wang, E.; Engel, T. Simulation of phenological development of wheat crops. Agric. Syst. 1998, 58, 1–24. [Google Scholar] [CrossRef]
- Williams, M.; Rastetter, E.B.; Fernandes, D.N.; Goulden, M.L.; Shaver, G.R.; Johnson, L.C. Predicting Gross Primary Productivity in Terrestrial Ecosystems. Ecol. Appl. 1997, 7, 882–894. [Google Scholar] [CrossRef]
- Revill, A.; Bloom, A.A.; Williams, M. Impacts of reduced model complexity and driver resolution on cropland ecosystem photosynthesis estimates. Field Crop. Res. 2016, 187, 74–86. [Google Scholar] [CrossRef][Green Version]
- Bloom, A.A.; Williams, M. Constraining ecosystem carbon dynamics in a data-limited world: Integrating ecological “common sense” in a model–data fusion framework. Biogeosciences 2015, 12, 1299–1315. [Google Scholar] [CrossRef]
- Patenaude, G.; Milne, R.; Van Oijen, M.; Rowland, C.; Hill, R.A. Integrating remote sensing datasets into ecological modelling: A Bayesian approach. Int. J. Remote Sens. 2008, 29, 1295–1315. [Google Scholar] [CrossRef]
- Myrgiotis, V.; Blei, E.; Clement, R.; Jones, S.K.; Keane, B.; Lee, M.A.; Levy, P.E.; Rees, R.M.; Skiba, U.M.; Smallman, T.L.; et al. A model-data fusion approach to analyse carbon dynamics in managed grasslands. Agric. Syst. 2020, 184, 102907. [Google Scholar] [CrossRef]
- AHDB. Winter Wheat Growth Guide; AHDB: Kenilworth, UK, 2018. [Google Scholar]
- Caldararu, S.; Purves, D.W.; Smith, M.J. The impacts of data constraints on the predictive performance of a general process-based crop model (PeakN-crop v1.0). Geosci. Model Dev. 2017, 10, 1679–1701. [Google Scholar] [CrossRef]
- Hansen, J.; Challinor, A.; Ines, A.; Wheeler, T.; Moron, V. Translating climate forecasts into agricultural terms: Advances and challenges. Clim. Res. 2006, 33, 27–41. [Google Scholar] [CrossRef]
- Huang, J.; Gómez-Dans, J.L.; Huang, H.; Ma, H.; Wu, Q.; Lewis, P.E.; Liang, S.; Chen, Z.; Xue, J.-H.; Wu, Y.; et al. Assimilation of remote sensing into crop growth models: Current status and perspectives. Agric. For. Meteorol. 2019, 107609. [Google Scholar] [CrossRef]
- Parkes, B.; Higginbottom, T.P.; Hufkens, K.; Ceballos, F.; Kramer, B.; Foster, T. Weather dataset choice introduces uncertainty to estimates of crop yield responses to climate variability and change. Environ. Res. Lett. 2019, 14, 124089. [Google Scholar] [CrossRef]
- Revill, A.; Sus, O.; Barrett, B.; Williams, M. Carbon cycling of European croplands: A framework for the assimilation of optical and microwave Earth observation data. Remote Sens. Environ. 2013, 137, 84–93. [Google Scholar] [CrossRef]
- Delloye, C.; Weiss, M.; Defourny, P. Retrieval of the canopy chlorophyll content from Sentinel-2 spectral bands to estimate nitrogen uptake in intensive winter wheat cropping systems. Remote Sens. Environ. 2018, 216, 245–261. [Google Scholar] [CrossRef]
- Söderström, M.; Piikki, K.; Stenberg, M.; Stadig, H.; Martinsson, J. Producing nitrogen (N) uptake maps in winter wheat by combining proximal crop measurements with Sentinel-2 and DMC satellite images in a decision support system for farmers. Acta Agric. Scand. Sect. B Plant Soil Sci. 2017, 67, 637–650. [Google Scholar] [CrossRef]
- Whitcraft, A.K.; Becker-Reshef, I.; Justice, C.O. A Framework for Defining Spatially Explicit Earth Observation Requirements for a Global Agricultural Monitoring Initiative (GEOGLAM). Remote Sens. 2015, 7, 1461–1481. [Google Scholar] [CrossRef]
- Kindred, D.R.; Milne, A.; Webster, R.; Marchant, B.; Sylvester-Bradley, R. Exploring the spatial variation in the fertilizer-nitrogen requirement of wheat within fields. J. Agric. Sci. 2015, 153, 25–41. [Google Scholar] [CrossRef]
- Pallardy, S.G. Chapter 5—Photosynthesis. In Physiology of Woody Plants; Third, E., Ed.; Academic Press: San Diego, CA, USA, 2008; pp. 107–167. ISBN 978-0-12-088765-1. [Google Scholar]
- Spinoni, J.; Vogt, J.V.; Naumann, G.; Barbosa, P.; Dosio, A. Will drought events become more frequent and severe in Europe? Int. J. Clim. 2018, 38, 1718–1736. [Google Scholar] [CrossRef]
- Smallman, T.L.; Williams, M. Description and validation of an intermediate complexity model for ecosystem photosynthesis and evapotranspiration: ACM-GPP-ETv1. Geosci. Model Dev. 2019, 12, 2227–2253. [Google Scholar] [CrossRef]


Publisher’s Note: MDPI stays neutral with regard to jurisdictional claims in published maps and institutional affiliations. |
© 2021 by the authors. Licensee MDPI, Basel, Switzerland. This article is an open access article distributed under the terms and conditions of the Creative Commons Attribution (CC BY) license (http://creativecommons.org/licenses/by/4.0/).